All posts by Markku Leiniö

Zabbix 7.0 Proxy Load Balancing

Post Syndicated from Markku Leiniö original https://blog.zabbix.com/zabbix-7-0-proxy-load-balancing/28173/

One of the new features in Zabbix 7.0 LTS is proxy load balancing. As the documentation says:

Proxy load balancing allows monitoring hosts by a proxy group with automated distribution of hosts between proxies and high proxy availability.

If one proxy from the proxy group goes offline, its hosts will be immediately distributed among other proxies having the least assigned hosts in the group.

Proxy group is the new construct that enables Zabbix server to make dynamic decisions about the monitoring responsibilities within the group(s) of proxies. As you can see in the documentation, the proxy group has only a minimal set of configurable settings.

One important background information to understand is that Zabbix server always knows (within reasonable timeframe) which proxies in the proxy groups are online and which are not. That’s because all active proxies connect to the Zabbix server every 1 second by default (DataSenderFrequency setting in the proxy), and Zabbix server connects to the passive proxies also every 1 second by default (ProxyDataFrequency setting in the server), so if those connections are not happening anymore, then something is wrong with using the proxy.

Initially Zabbix server will balance the hosts between the proxies in the proxy group. It can also rebalance the hosts later if needed, the algorithm is described in the documentation. That’s something we don’t need to configure (that’s the “automated distribution of hosts” mentioned above). The idea is that, at any given time, any host configured to be monitored by the proxy group is monitored by one proxy only.

Now let’s see how the actual connections work with active and passive Zabbix agents. The active/passive modes of the proxies (with the Zabbix server connectivity) don’t matter in this context, but I’m using active proxies in my tests for simplicity.

Disclaimer: These are my own observations from my own Zabbix setup using 7.0.0, and they are not necessarily based on any official Zabbix documentation. I’m open for any comments or corrections in any case.

At the very end of this post I have included samples of captured agent traffic for each of the cases mentioned below.

Passive agents monitored by a proxy group

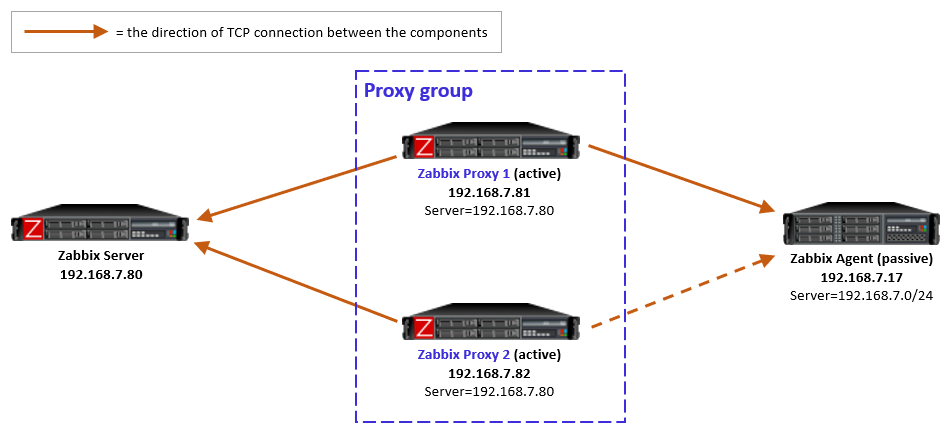
For passive agents the proxy load balancing really is this simple: Whenever a proxy goes down in a proxy group, all the hosts that were previously monitored by that proxy will then be monitored by the other available proxies in the same proxy group.

There is nothing new to configure in the passive agents, only the usual Server directive to allow specific proxies (IP addresses, DNS names, subnets) to communicate with the agent.

As a reminder, a passive agent means that it listens to incoming requests from Zabbix proxies (or the Zabbix server), and then collects and returns the requested data. All relevant firewalls also need to be configured to allow the connections from the Zabbix proxies to the agent TCP port 10050.

As yet another reminder, each agent (or monitored host) can have both passive and active items configured, which means that it will both listen to incoming Zabbix requests but also actively request any active tasks from Zabbix proxies or servers. But again, this is long-existing functionality, nothing new in Zabbix 7.0.

Active agents monitored by a proxy group

For active agents the proxy load balancing needs a bit new tweaking in the agent side.

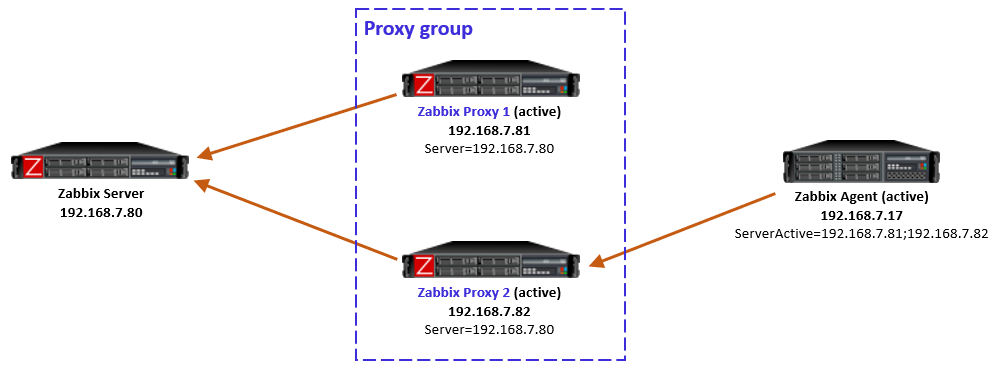
By definition, an active agent is the party that initiates the connection to the Zabbix proxy (or server), to TCP port 10051 by default. The configuration happens with the ServerActive directive in the agent configuration. According to the official documentation, providing multiple comma-separated addresses in the ServerActive directive has been possible for ages, but it is for the purpose of providing data to multiple independent Zabbix installations at the same time. (Think about a Zabbix agent on a monitored host, being monitored by both a service provider and the inhouse IT department.)

Using semicolon-separated server addresses in ServerActive directive has been possible since Zabbix 6.0 when Zabbix servers are configured in high-availability cluster. That requires specific Zabbix server database implementation so that all the cluster nodes use the same database, and some other shared configurations.

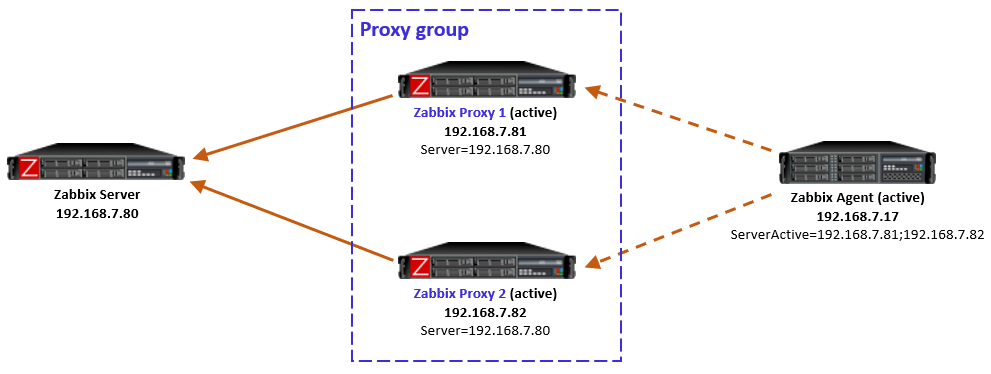
Now in Zabbix 7.0 this same configuration style can be used for the agent to connect to all proxies in the proxy group, by entering all the proxy addresses in the ServerActive configuration, semicolon-separated. However, to be exact, this is not described in the ServerActive documentation as of this writing. Rather, it specifically says “More than one Zabbix proxy should not be specified from each Zabbix server/cluster.” But it works, let’s see how.

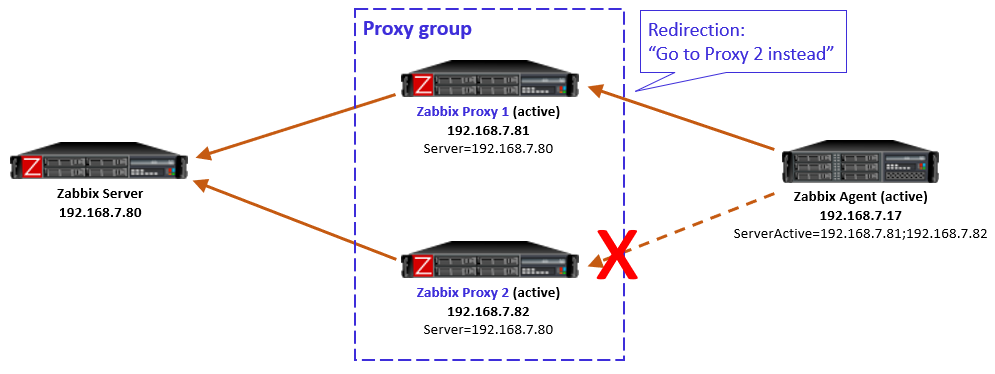
Using multiple semicolon-separated proxy addresses works because of the new redirection functionality in the proxy-agent communication: Whenever an active agent sends a message to a proxy, the proxy tells the agent to connect to another proxy, if the agent is currently assigned to some other proxy. The agent then ceases connecting to that previous proxy, and starts using the proxy address provided in the redirection instead. Thus the agent converges to using only that one designated proxy address.

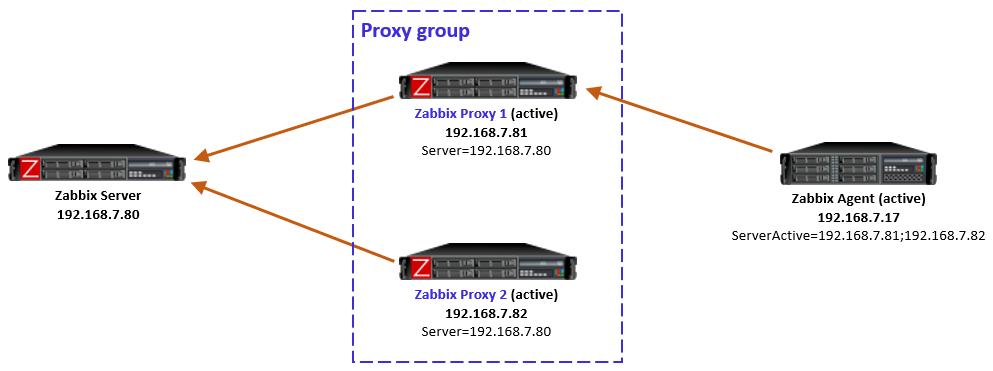
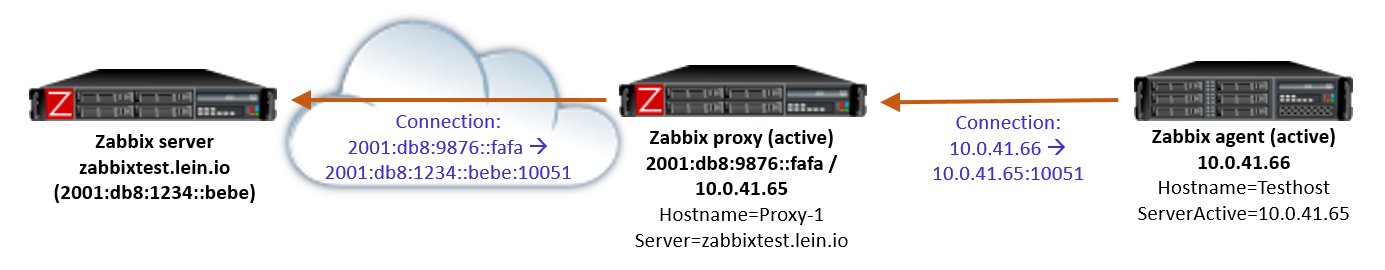
In this simple example the Zabbix server determined that the agent should be monitored by Proxy 1, so when the agent initially contacted Proxy 1 (because its IP address is first in the ServerActive list), the proxy responded normally and agent was happy with that.

In case the Zabbix server had for any reason determined that the agent should be monitored by Proxy 2, then Proxy 1 would have responded with a redirection, and agent would have followed that. (There will be examples of redirections in the capture files below.)

To be clear, this agent redirection from the proxy group works only with Zabbix 7.0 agents as of this writing.

Note: In the initial version of this post I used comma-separated proxy addresses in ServerActive (instead of semicolon-separated), and that caused duplicate connections from the agent to the designated proxy (because the agent is not equipped to recognize that it connects to the same proxy twice), eventually causing data duplication in Zabbix database. Using comma-separated proxy addresses is thus not a working solution for proxy load balancing usage.

If the host-proxy assignments are changed by the Zabbix server for balancing the load between the proxies, the previously designated proxy will redirect the agent to the correct proxy address, and the situation is optimized again.

Side note: When configuring the proxies in Zabbix UI, there is a new Address for active agents field. That is the address value that is used by the proxies when responding with redirection messages to agents.

Proxy group failure scenarios with active agents

Proxy goes down

If the designated proxy of an active agent goes offline so that it doesn’t respond to the agent anymore, agent realizes the situation, discards the redirection information it had, and reverts to using the proxy addresses from ServerActive directive again.

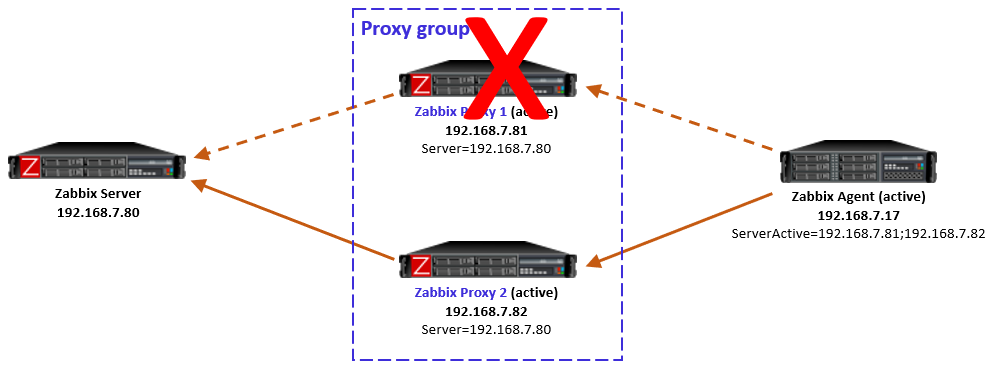
Now, this is an interesting case because of some timing dependencies. In the proxy group configuration there is the Failover period configuration that controls the Zabbix server’s sensitivity to proxy availability in regards to agent rebalancing within the proxy group. Thus, if the agent reverts to using the other proxies faster than Zabbix server recognizes the situation and notifies the other proxies in the proxy group, the agent will get redirection responses from the other proxies, telling it to use the currently offline proxy. And the same happens again: agent fails to connect to the redirected proxy, and reverts to using the other locally configured proxies, and so on.

In my tests this looping was not very intense, only two rounds every second, so it was not very significant network-wise, and the situation will converge automatically when the Zabbix server has notified the proxies about the host rebalancing.

So this temporary looping is not a big deal. The takeaway is that the whole system converges automatically from a failed proxy.

After the failed proxy has recovered to online mode, the agents stay with their designated proxies in the proxy group.

As mentioned in the beginning, Zabbix server will automatically rebalance the hosts again after some time if needed.

Proxy is online but unreachable from the active agent

Another interesting case is one where the proxy itself is running and communicating with Zabbix server, thus being in online mode in the proxy group, but the active agent is not able to reach it, while still being able to connect to the other proxies in the group. This can happen due to various Internet-related routing issues for example, if the proxies are geographically distributed and far away from the agent.

Let’s start with the situation where the agent is currently monitored by Proxy 2 (as per the last picture above). When the failure starts and agent realizes that the connections to Proxy 2 are not succeeding anymore, the agent reverts to using the configured proxies in ServerActive, connecting to Proxy 1.

But, Proxy 1 knows (by the information given by Zabbix server) that Proxy 2 is still online and that the agent should be monitored by Proxy 2, so Proxy 1 responds to the agent with a redirection.

Obviously that won’t work for the agent as it doesn’t have connectivity to Proxy 2 anymore.

This is a non-recoverable situation (at least with the current Zabbix 7.0.0) while the reachability issue persists: The agent keeps on contacting Proxy 1, keeps receiving the redirection, and the same repeats over and over again.

Note that it does not matter if the agent is now locally reconfigured to only use Proxy 1 in this situation, because the load balancing of the hosts in the proxy group is not controlled by any of the agent-local configuration. The proxy group (led by Zabbix server) has the only authority to assign the hosts to the proxies.

One way to escape from this situation is to stop the unreachable Proxy 2. That way the Zabbix server will eventually notice that Proxy 2 is offline, and the hosts will be automatically rebalanced to other proxies in the group, thus removing the agent-side redirection to the unreachable proxy.

Keep this potential scenario in mind when planning proxy groups with proxy location diversity.

This is also something to think about if your Zabbix proxies have multiple network interfaces, where Zabbix server connectivity is using different interface from the agent connectivity. In that case the same problem can occur due to your own configurations.

Closing words

All in all, proxy load balancing looks very promising feature as it does not require any network-level tricks to achieve load balancing and high availability. In Zabbix 7.0 this is a new feature, so we can expect some further development for the details and behavior in the upcoming releases.


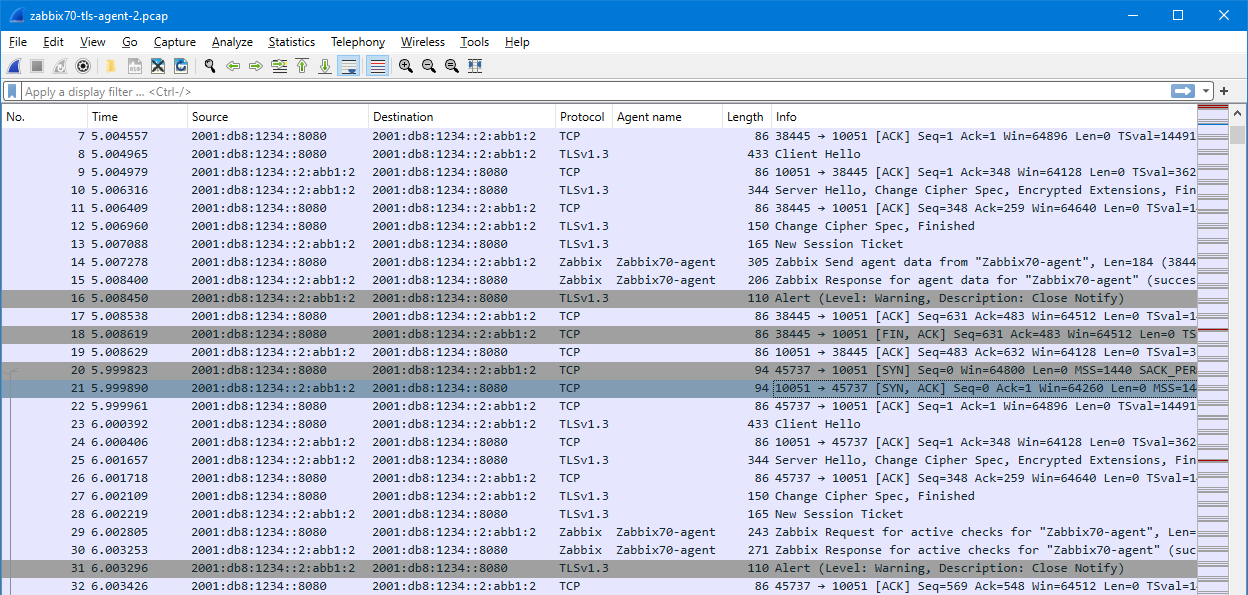
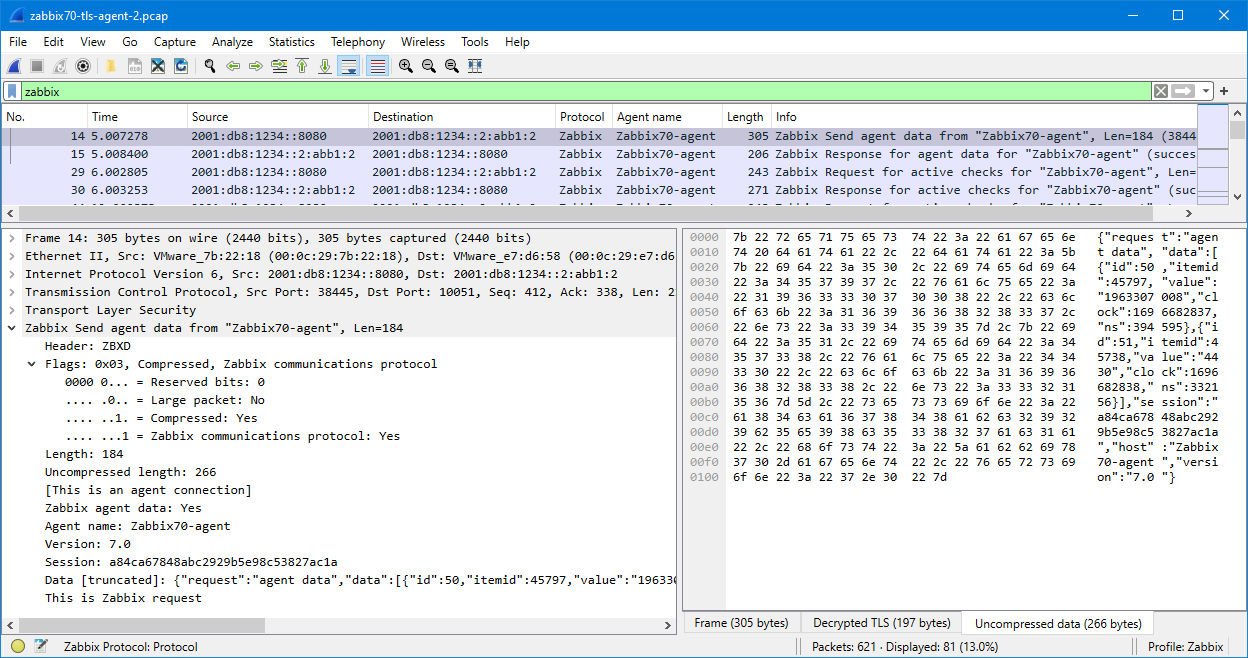
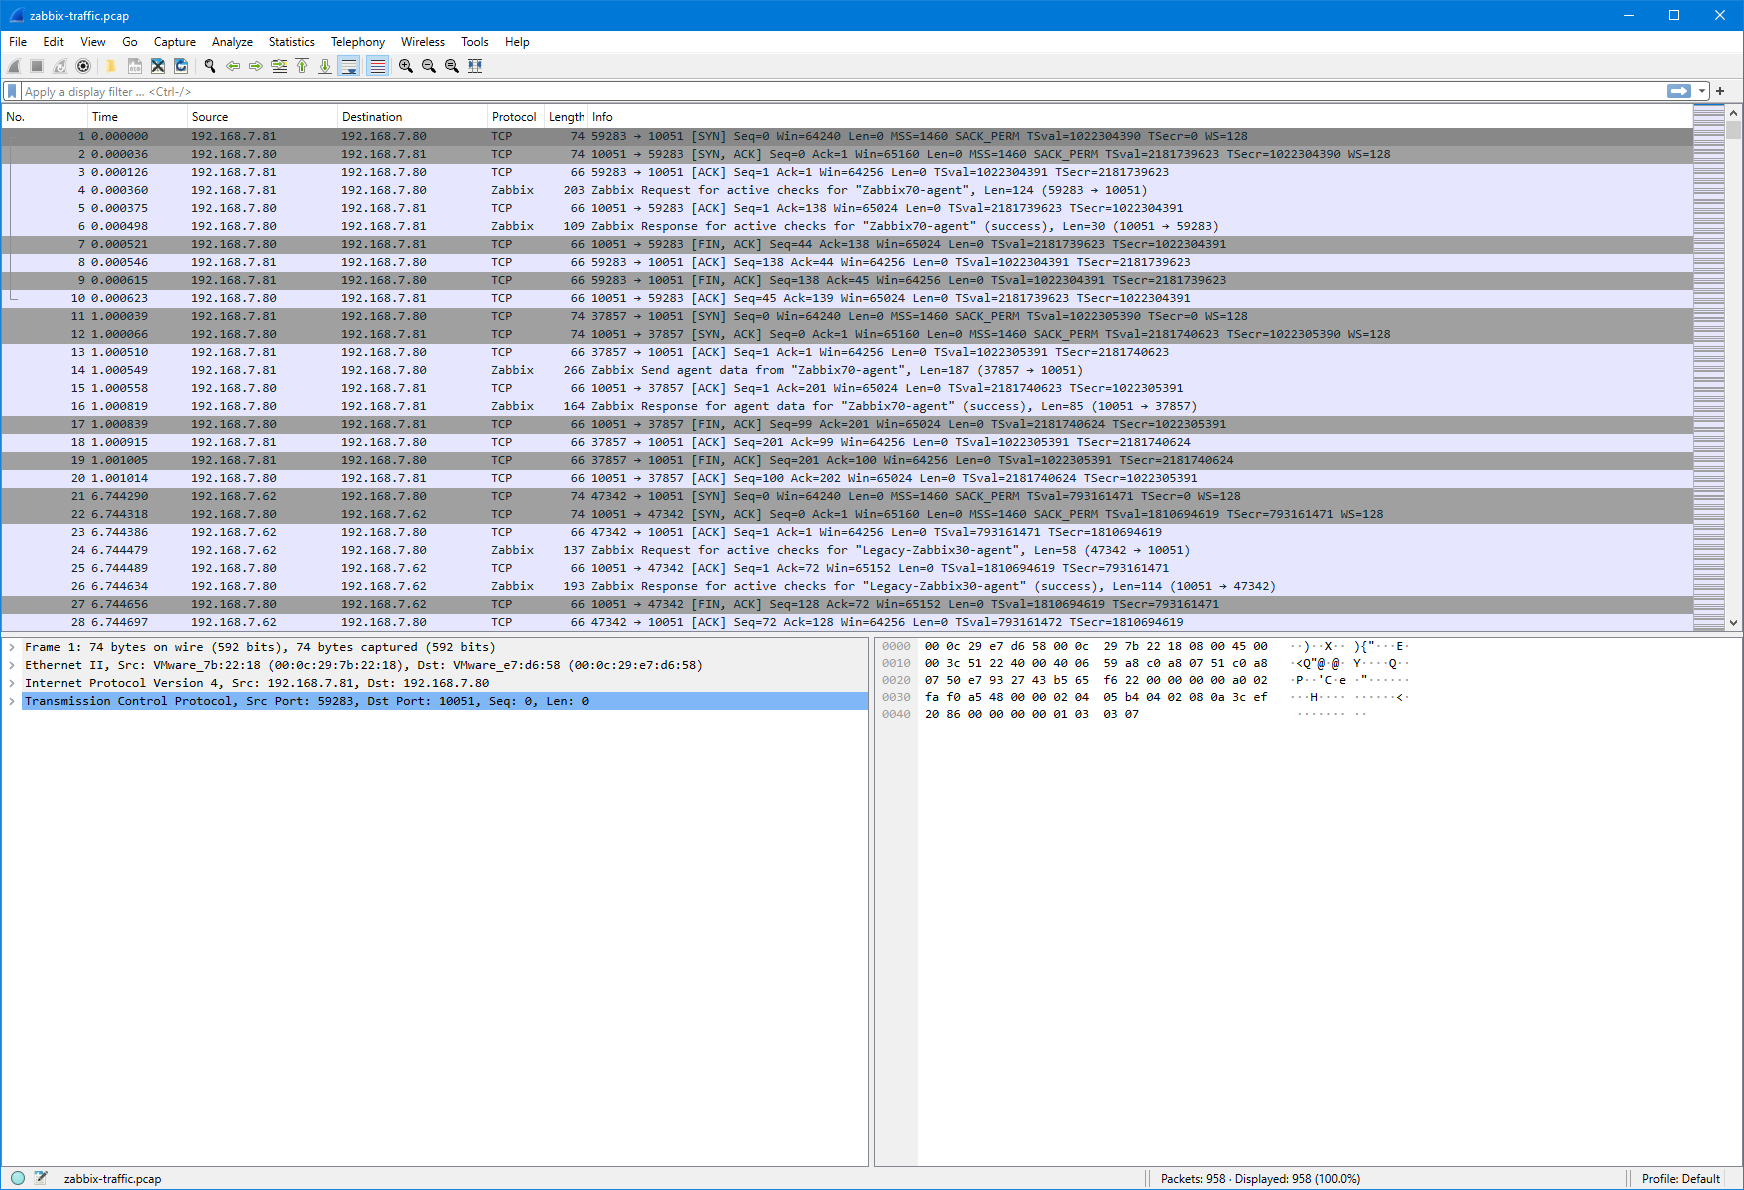
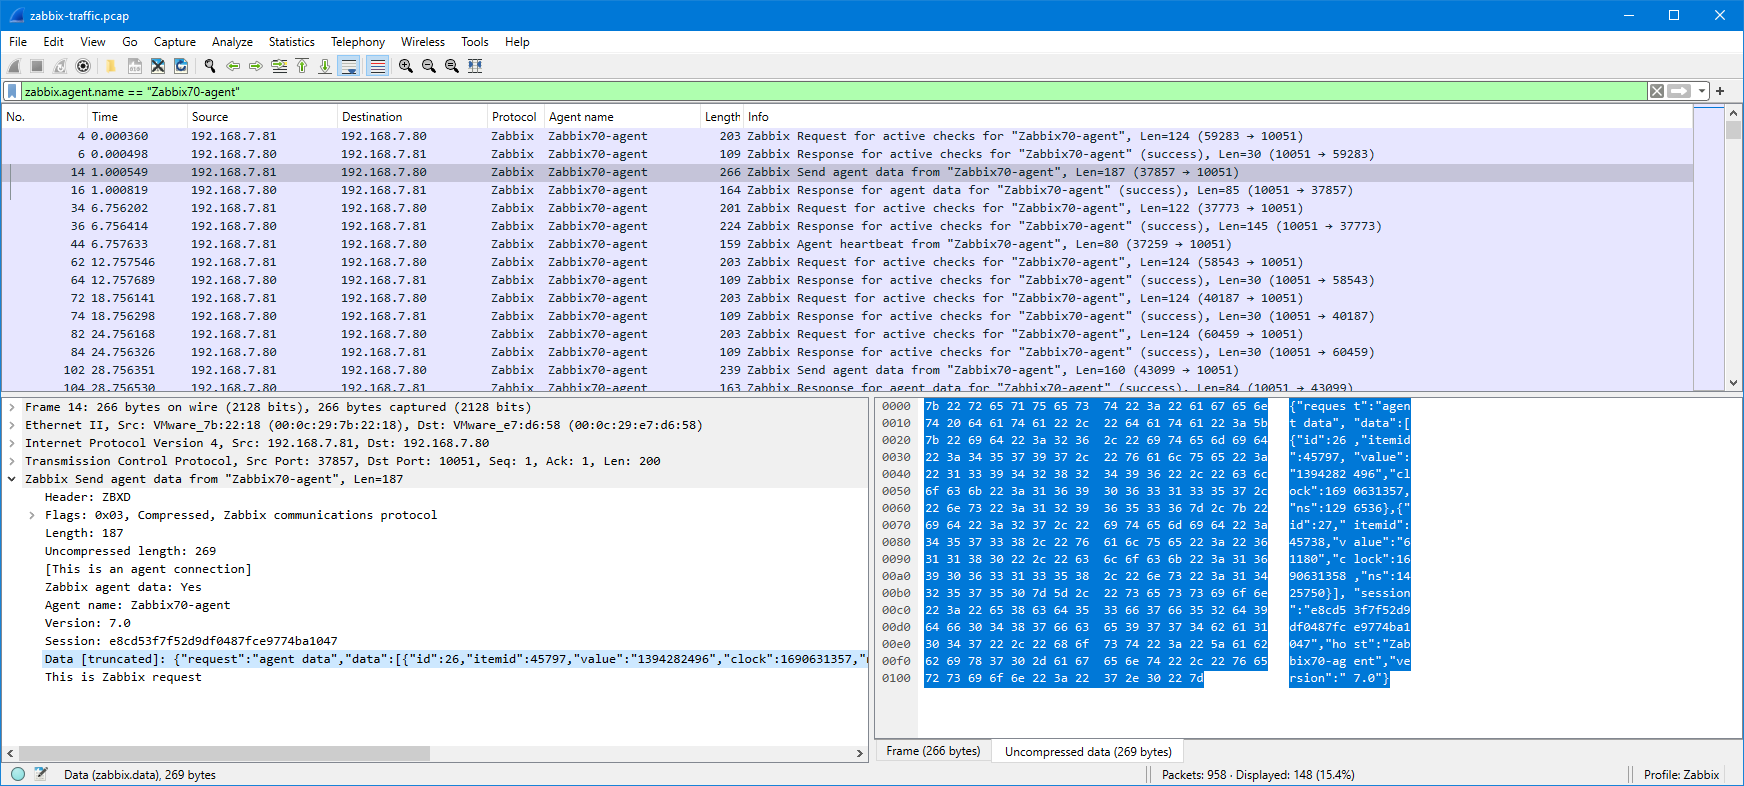
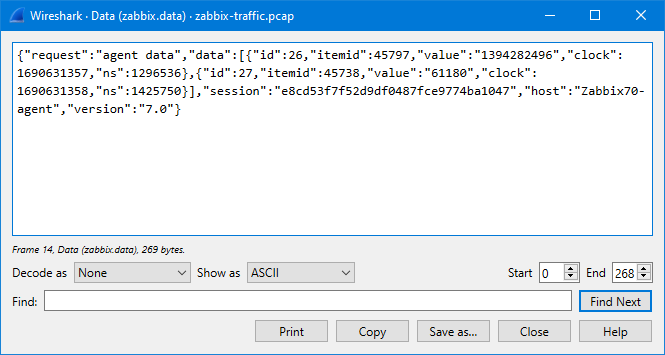
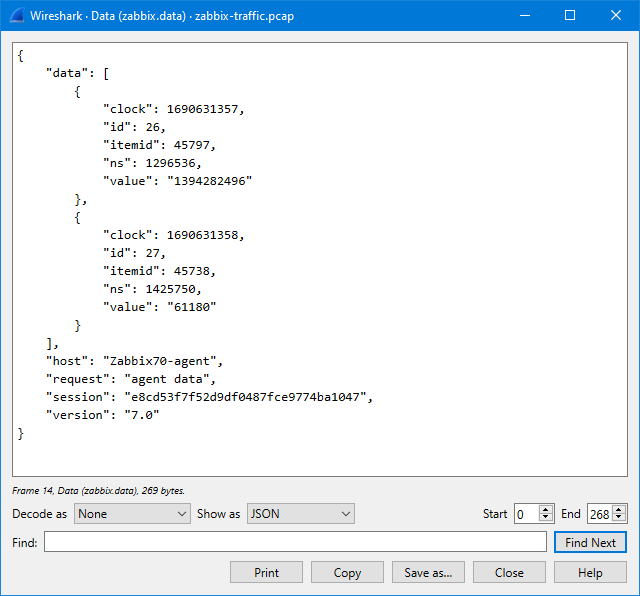
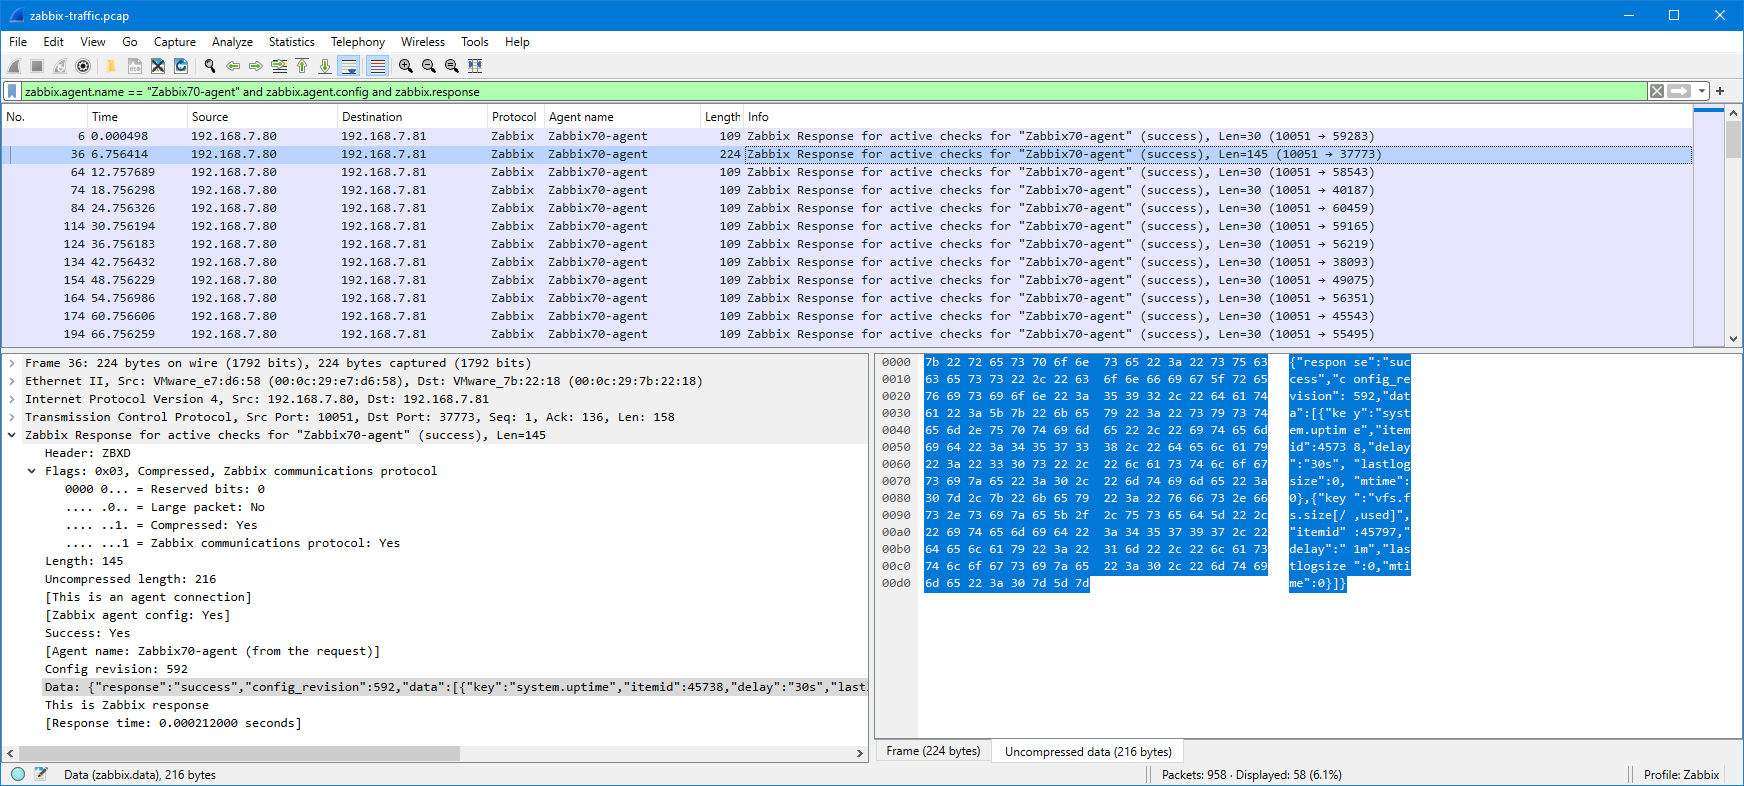
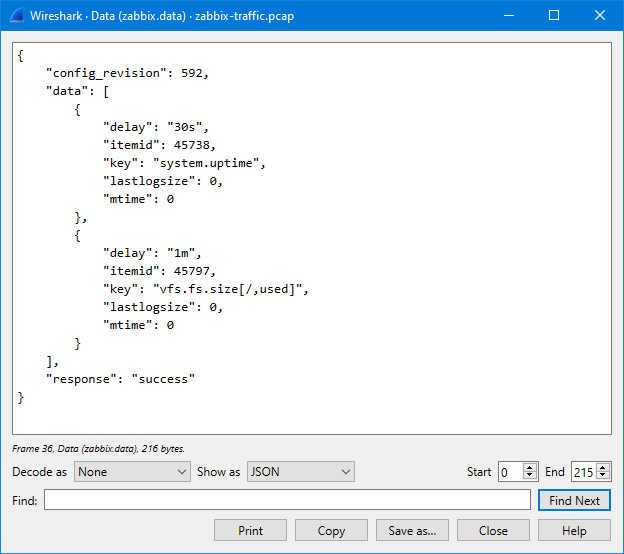
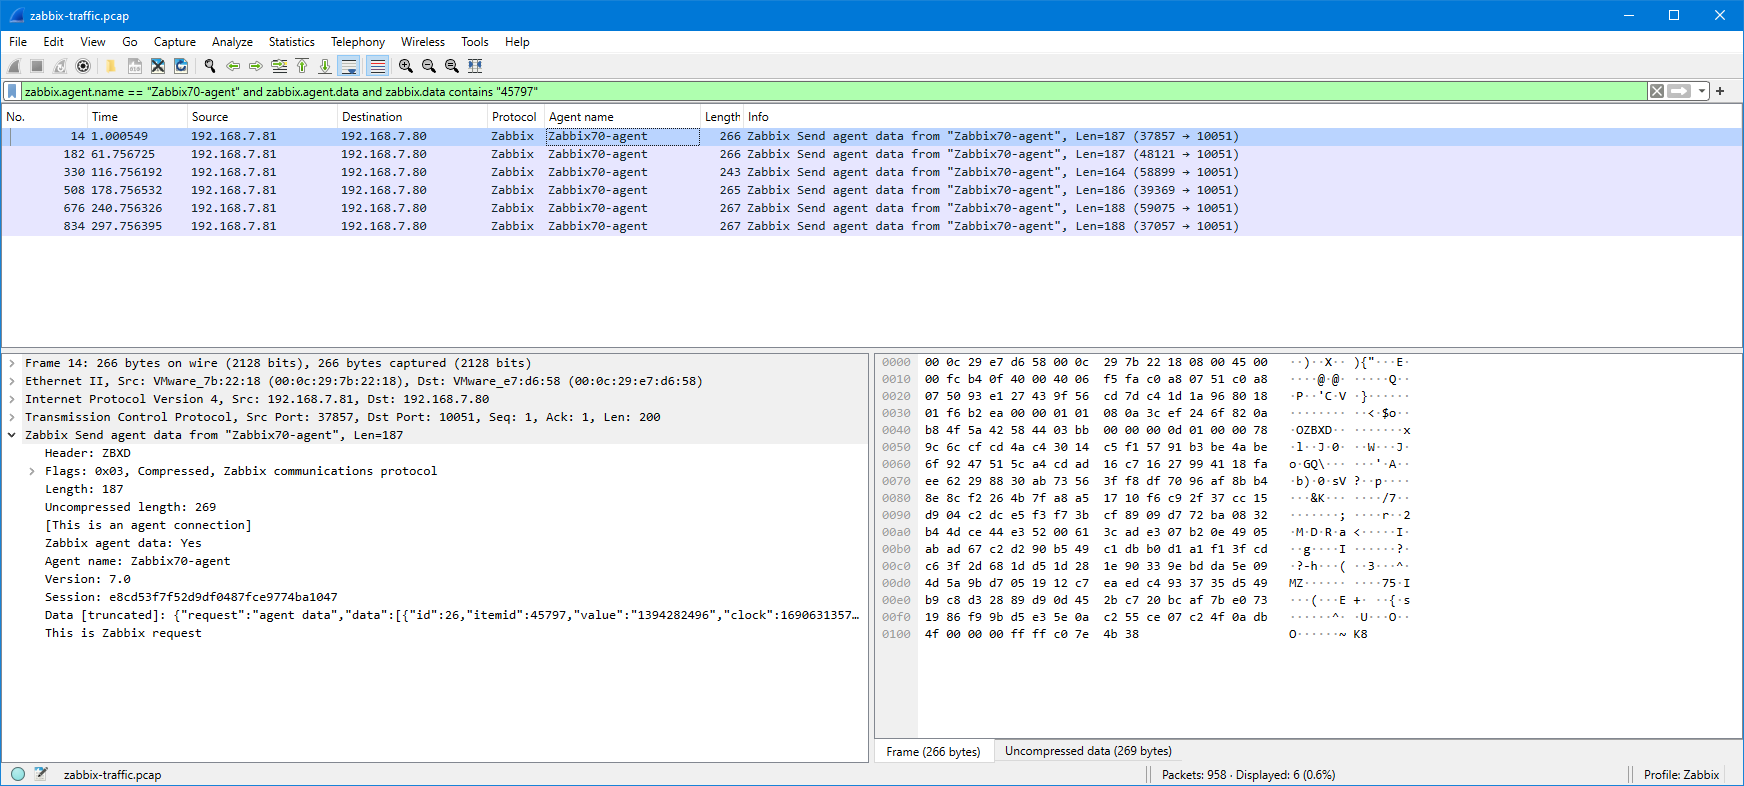
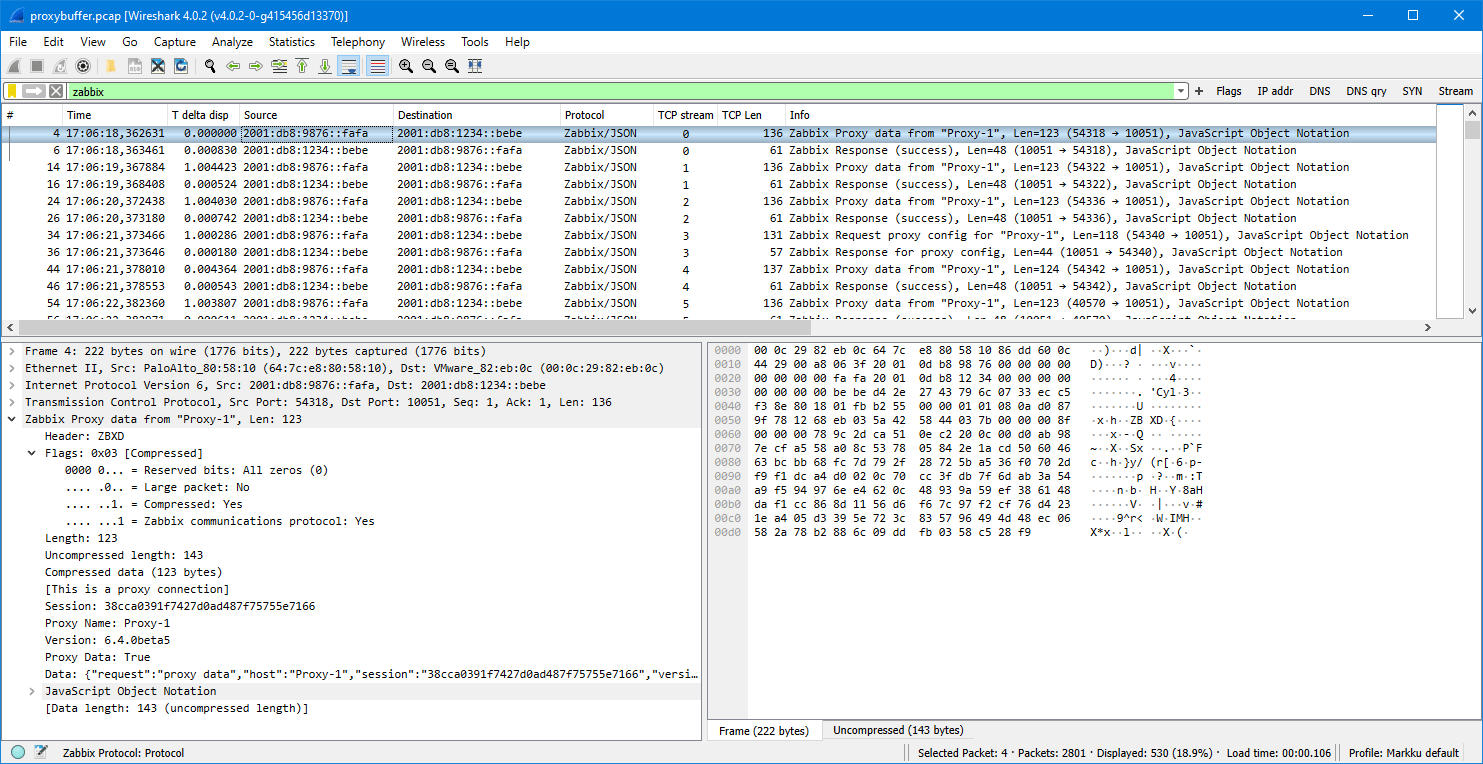
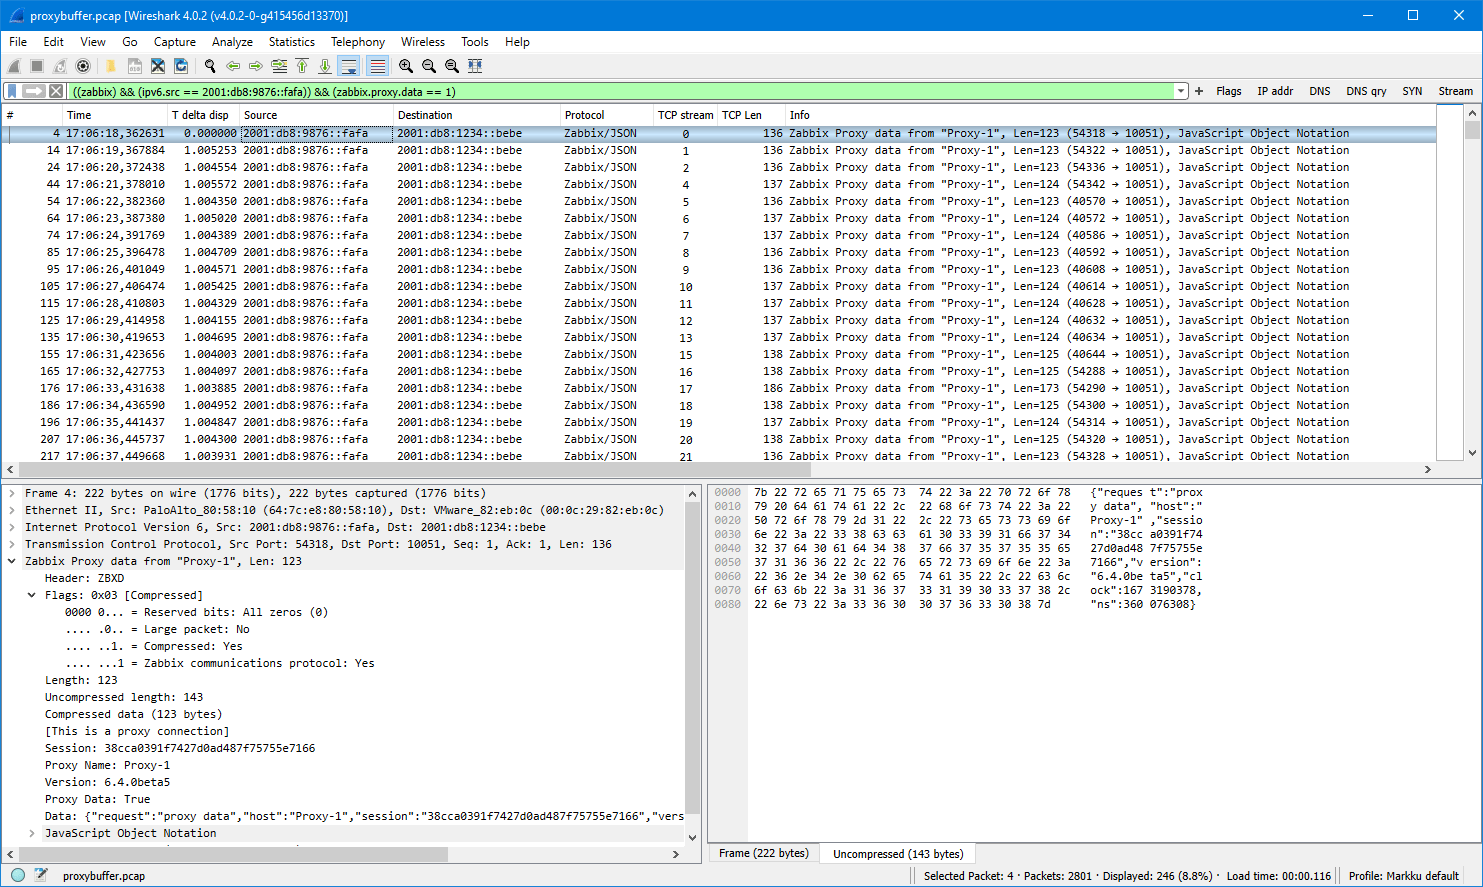
Appendix: Sample capture files

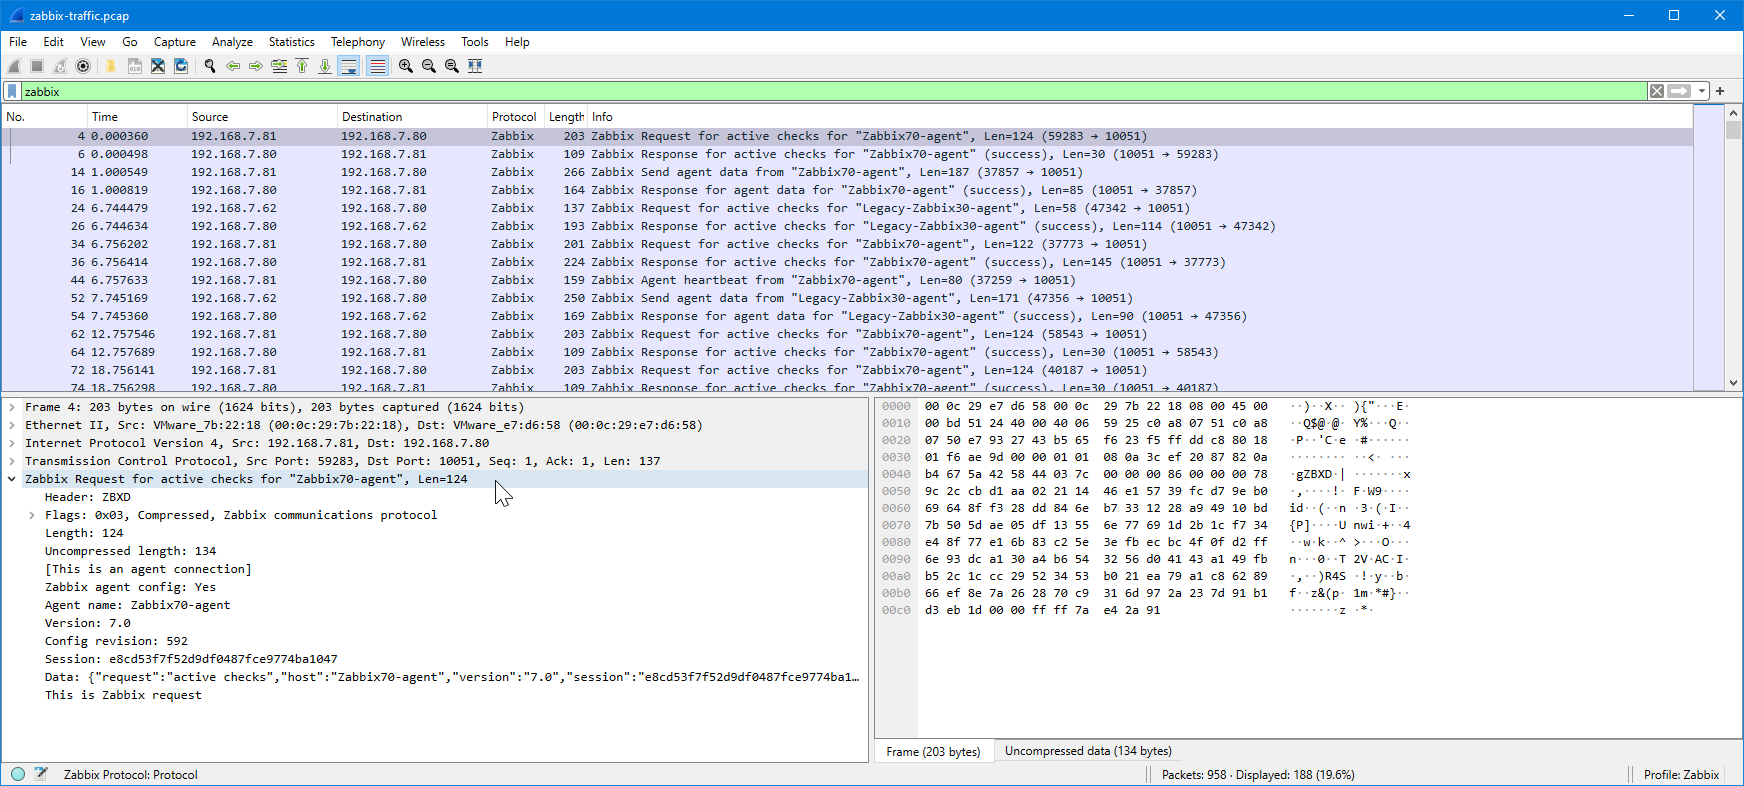
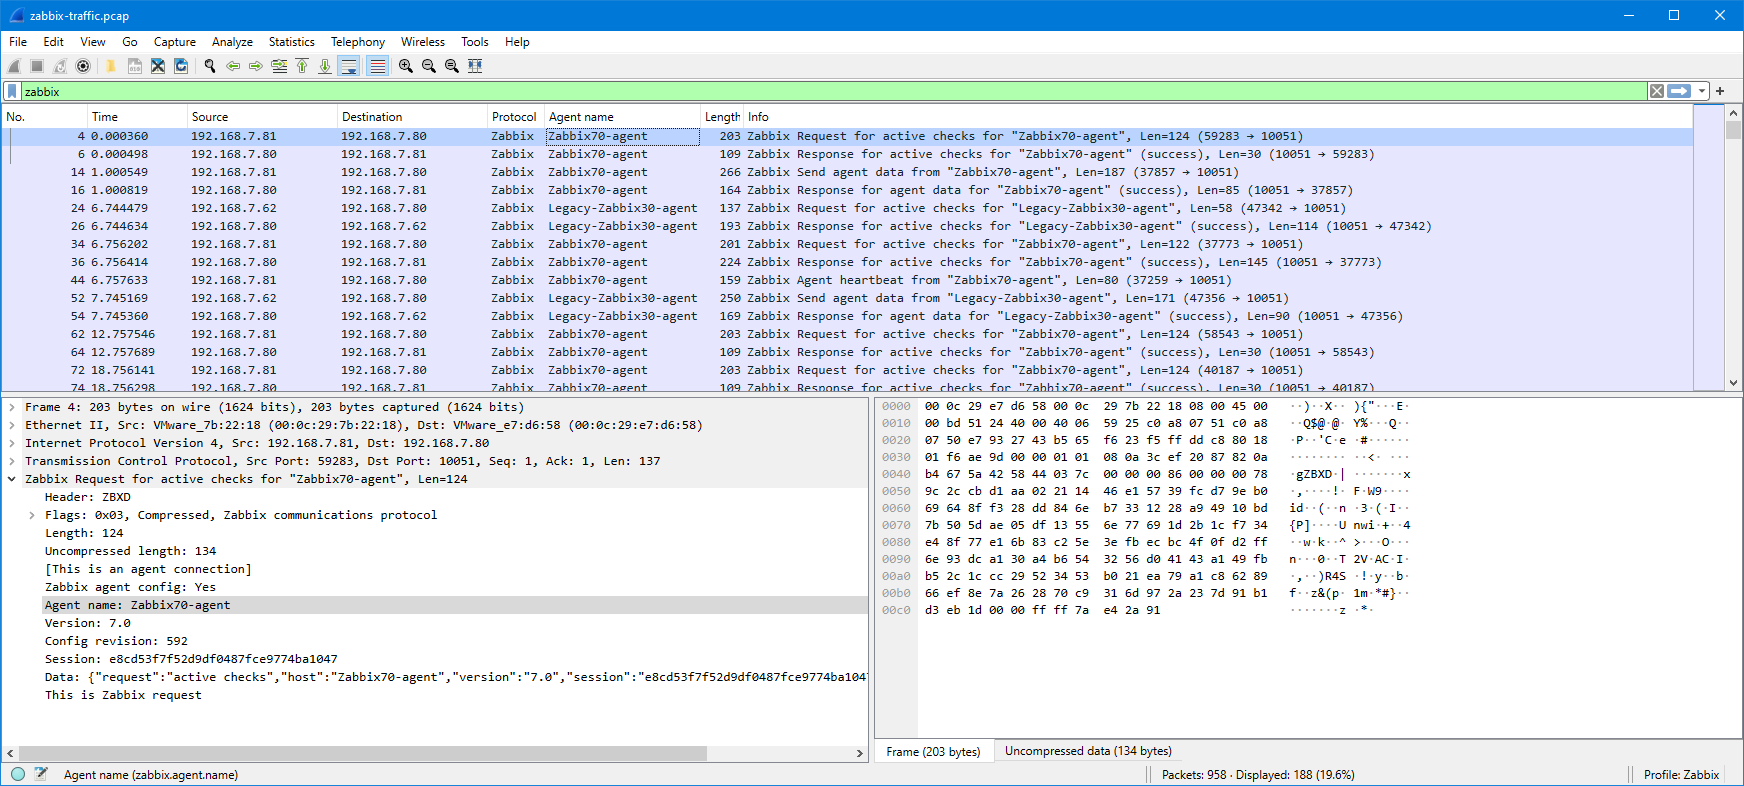
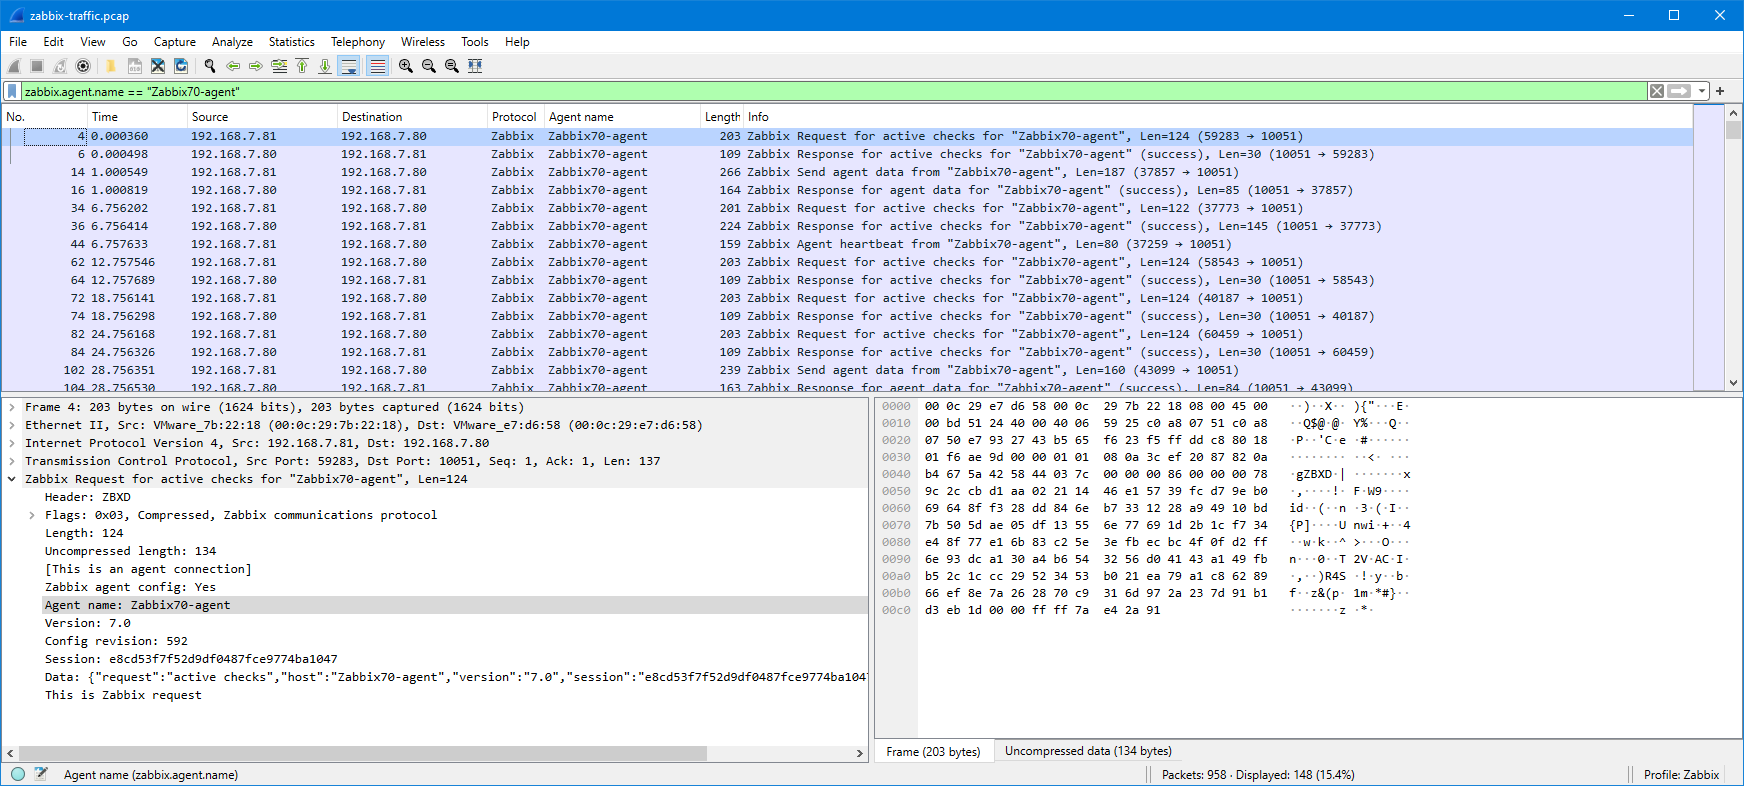
Ideally these capture files should be viewed with Wireshark version 4.3.0rc1 or newer because only the latest Wireshark builds include support for latest Zabbix protocol features. Wireshark 4.2.x should also show most of the Zabbix packet fields. Use display filter “zabbix” to see only the Zabbix protocol packets, but when examining cases more carefully you should also check the plain TCP packets (without any display filter) to get more understanding about the cases.

These samples are taken with Zabbix components version 7.0.0, using default timers in the Zabbix process configurations, and 20 seconds as the proxy group failover period.

Passive agent, with proxy failover

    • After frame #50 Proxy 1 was stopped and Proxy 2 eventually took over the monitoring

Active agent, with proxy failover

    • The agent initially communicates with Proxy 1
    • Proxy 1 was stopped before frame #425
    • Agent connected to Proxy 2, but Proxy 2 keeps sending redirects
    • Proxy 2 was assigned the agent before frame #1074, so it took over the monitoring and accepted the agent connections
    • Proxy 1 was later restarted (but agent didn’t try to connect to it yet)
    • The agent was manually restarted before frame #1498 and it connected to Proxy 1 again, was given a redirection to Proxy 2, and continued with Proxy 2 again

Active agent, with proxy unreachable

    • Started with Proxy 2 monitoring the agent normally
    • Network started dropping all packets from the agent to Proxy 2 before frame #179, agent started connecting to Proxy 1 almost immediately
    • From frame #181 on Proxy 1 responds with redirection to Proxy 2 (which is not working)
    • Proxy 2 was eventually stopped manually
    • Redirections continue until frame #781 when Proxy 1 is assigned the monitoring of the agent, and Proxy 1 starts accepting the agent requests

This post was originally published on the author’s blog.

The post Zabbix 7.0 Proxy Load Balancing appeared first on Zabbix Blog.

Decrypting Zabbix TLS with Wireshark

Post Syndicated from Markku Leiniö original https://blog.zabbix.com/decrypting-zabbix-tls-with-wireshark/26832/

One of the built-in security features in Zabbix is TLS (Transport Layer Security) support for external connections. This means that when your distributed Zabbix proxies or Zabbix agents connect to the Zabbix server (or vice versa), TLS can be used to encrypt all the connections. When the connections are encrypted, third parties cannot read the Zabbix components’ communication, even though they would be able to catch the network traffic in some way.

In specific cases you may still want to inspect the encrypted traffic, for example to troubleshoot some problems with Zabbix agents or proxies. I already wrote a post about troubleshooting Zabbix agent with Wireshark, but the TLS encryption prevents anyone seeing the actual contents of the packets.

Since the traffic is encrypted in the Zabbix components (the server, agents and proxies), there still is a way for you, the Zabbix administrator, to intervene with the encryption so that you can get hold of the unencrypted traffic as well. In this post I will explain the process.

First, let’s demonstrate the TLS encryption between a Zabbix agent and a Zabbix server. I have configured the agent (Zabbix Agent 2 actually) with these lines:

Hostname=Zabbix70-agent
ServerActive=zabbixtest.lein.io
TLSConnect=psk
TLSPSKIdentity=agent-ident
TLSPSKFile=/etc/zabbix/psk

In this example I’m using TLS with pre-shared key (PSK), and the key itself is saved in /etc/zabbix/psk. My favorite way of generating a PSK is using OpenSSL:

markku@agent:~$ openssl rand -hex 32
afa34bf1104a1457e11e7d3a9b1ff7f5fb4f494c92ca1a8a9c5e1437f8897416
markku@agent:~$

The same key must also be configured on the Zabbix server frontend, see the Zabbix documentation for the PSK configuration details:

After the configurations I captured the Zabbix traffic for some time on the Zabbix server (using sudo tcpdump port 10051 -v -w zabbix70-tls-agent.pcap), stopped the capture, copied the capture file to my workstation, and opened it with Wireshark.

The capture file can be downloaded here:

Note: I recommend using Wireshark version 4.1.0 or later when analyzing captures containing Zabbix traffic because the built-in Zabbix protocol support was only added to Wireshark in version 4.1.0.

The packet list looks like this:

As we can see in the Protocol column, there are no Zabbix packets recognized in this capture, there are only TCP and TLS packets (the TCP-marked packets being the “empty” packets for negotiating the actual connectivity).

A side detail: Even though the traffic is encrypted, you can still see the configured Zabbix TLS PSK identity (“agent-ident” in my configuration above) in plain text inside the TLS Client Hello packets, if you ever need to check that in the traffic.

Now that we confirmed that TLS encryption is used and we cannot see the Zabbix traffic contents in the capture, let’s prepare the Zabbix server for the TLS decryption.

As I hinted in the beginning, since we have the TLS connection endpoints under our management, we can do tricks on the hosts to get the encryption keys. TLS negotiates the encryption keys dynamically for each connection, but there is a way to save the keys to a file so that we can later decrypt the captured traffic. (Note: I’m not a protocol-level TLS expert, so please forgive me any possible technical inaccuracies in the detailed explanations. I’ll just call “TLS keys” whatever is needed to get the encryption/decryption done.)

Peter Wu (who, in contrast to me, is a protocol-level TLS expert, and also one of the Wireshark core developers) has kindly published code for a helper library that makes it possible for us to save the TLS session keys on the TLS endpoint. In this demo I will save the keys on the Zabbix server, but the same could be done on the agents/proxies instead if needed.

First I’ll see the TLS library that my Debian-based Zabbix server is using:

markku@zabbixserver:~$ ldd /usr/sbin/zabbix_server | grep ssl
        libssl.so.3 => /lib/x86_64-linux-gnu/libssl.so.3 (0x00007f62ee47a000)
markku@zabbixserver:~$ dpkg -l libssl* | grep ^ii
ii  libssl3:amd64  3.0.9-1   amd64  Secure Sockets Layer toolkit - shared libraries
markku@zabbixserver:~$

To get and compile the helper library I’ll need to install some utilities:

markku@zabbixserver:~$ sudo apt install git gcc make libssl-dev
...
markku@zabbixserver:~$ dpkg -l libssl* | grep ^ii
ii  libssl-dev:amd64 3.0.9-1 amd64 Secure Sockets Layer toolkit - development files
ii  libssl3:amd64    3.0.9-1 amd64 Secure Sockets Layer toolkit - shared libraries
markku@zabbixserver:~$

I’ll the clone the Peter’s wireshark-notes repo to the server:

markku@zabbixserver:~$ git clone --depth=1 https://git.lekensteyn.nl/peter/wireshark-notes
Cloning into 'wireshark-notes'...
...
markku@zabbixserver:~$ cd wireshark-notes/src
markku@zabbixserver:~/wireshark-notes/src$ ls -l
total 28
-rw-r--r-- 1 markku markku   534 Oct  7 15:39 Makefile
-rw-r--r-- 1 markku markku 11392 Oct  7 15:39 sslkeylog.c
-rw-r--r-- 1 markku markku  7278 Oct  7 15:39 sslkeylog.py
-rwxr-xr-x 1 markku markku  2325 Oct  7 15:39 sslkeylog.sh
markku@zabbixserver:~/wireshark-notes/src$

Now I can compile the library and make it available on the server:

markku@zabbixserver:~/wireshark-notes/src$ make
cc   sslkeylog.c -shared -o libsslkeylog.so -fPIC -ldl
markku@zabbixserver:~/wireshark-notes/src$ sudo install libsslkeylog.so /usr/local/lib
markku@zabbixserver:~/wireshark-notes/src$ ls -l /usr/local/lib/libsslkeylog.so
-rwxr-xr-x 1 root root 17336 Oct  7 15:40 /usr/local/lib/libsslkeylog.so
markku@zabbixserver:~/wireshark-notes/src$ cd
markku@zabbixserver:~$

To use the helper library, a couple of environment variables need to be set. For Zabbix server the easy way is to edit the systemd configuration for zabbix-server service:

markku@zabbixserver:~$ sudo systemctl edit zabbix-server

In the editor that opens I’ll add these in the configuration:

[Service]
Environment=LD_PRELOAD=/usr/local/lib/libsslkeylog.so
Environment=SSLKEYLOGFILE=/tmp/tls.keys

The variables are kind of self-explanatory: Whenever Zabbix server service is started, the libsslkeylog.so library is loaded first, and the SSLKEYLOGFILE variable sets the location of the file where the keys will be saved.

Now the word of warning: The libsslkeylog.so library, when loaded by a process that uses TLS communication, will save the encryption/decryption keys of all the TLS sessions of the process to the configured file. This means that whoever gets that file and the saved TLS communication will be able to see the decrypted contents of the packets, defeating the whole idea of the TLS encryption. You really don’t want to do this TLS key saving for any longer periods of time. Be sure to remove the configurations (and restart the service) after you have inspected whatever you were inspecting in your system. Or, don’t do any of this at all.

After saving the configuration the Zabbix server needs to be restarted:

markku@zabbixserver:~$ sudo systemctl restart zabbix-server
markku@zabbixserver:~$

The TLS keys have now started being saved in the configured file:

markku@zabbixserver:~$ ls -l /tmp/tls.keys
-rw-rw-r-- 1 zabbix zabbix 10157 Oct  7 15:45 tls.keys
markku@zabbixserver:~$

At this point the Zabbix agent is still communicating actively with the Zabbix server, so I’ll take a new capture with tcpdump (sudo tcpdump port 10051 -v -w zabbix70-tls-agent-2.pcap).

After a short while I’ll stop the capture, and copy the capture file and the TLS key file on my workstation.

Now it’s a good time to disable the TLS key saving as well (besides containing sensitive data, the key file will also grow with each new TLS session so it can quickly get very large), so I’ll edit the Zabbix service configuration, remove the configured lines and restart the service:

markku@zabbixserver:~$ sudo systemctl edit zabbix-server
markku@zabbixserver:~$ sudo systemctl restart zabbix-server
markku@zabbixserver:~$

When opening the new capture file in Wireshark there is no immediate change in the packet list: the TLS packets are still shown encrypted. Wireshark needs to be specifically configured to read the TLS keys from the separate file.

In Wireshark, I’ll go to Edit – Preferences – Protocols – TLS:

There is the “(Pre)-Master-Secret log filename” field, I’ll use Browse button to select the copied tls.keys file, and save the configuration with OK.

At this point Wireshark reloads the capture file and the Zabbix agent TLS sessions will be decrypted:

Using the “zabbix” display filter will show just the Zabbix protocol packets:

When selecting a Zabbix protocol packet and looking at the packet details, in the lower right pane there are now three tabs: Frame (the encrypted TLS data), Decrypted TLS, and Uncompressed data.

This is because in this example the Zabbix agent 2 also compresses the traffic, and the compressed traffic is then encrypted when sending out to the network. Wireshark can interpret all this because of its built-in knowledge about TLS encryption and the Zabbix protocol structure, as well as the user-supplied TLS decryption keys.

We are now able to analyze the Zabbix agent communication with Wireshark even though the traffic was TLS-encrypted when we captured it.

One more trick about the TLS keys in Wireshark: It is also possible to save the keys inside the capture file when analyzing the traffic, instead of having the keys in a separate file (tls.keys in this example). I’ll go in Edit menu and select Inject TLS Secrets, and then save the capture file in pcapng format. Now the previously loaded keys are embedded in the capture file, and I can clear the “(Pre)-Master-Secret log filename” field in the TLS settings (as the filename setting is not useful in any later Wireshark analysis). The same can also be done in the command line by using editcap --inject-secrets (editcap is part of Wireshark install, see the manual page of editcap for more details).

Here is the second capture file of this demo, with the embedded TLS keys:

Finally some closing comments:

  • As demonstrated, when you have administrator/root-level access to the TLS session endpoint (Zabbix server in this example), there can be a possibility to save and decrypt the TLS sessions using external tooling. After all, TLS encryption is based on the negotiation between the TLS-connected endpoints, so if you are the TLS connection endpoint, you have ways to access the plaintext data. If you don’t have sufficient access to the TLS session endpoint, there is no way you can get the decryption keys mid-path.
  • Act responsibly when saving the TLS session keys for any traffic, on Zabbix server or otherwise. The encryption is there for a purpose, and saving the TLS keys always carries the risk that someone else gets access to data they wouldn’t have access to otherwise.
  • Do not save the TLS session keys with the capture file, unless you are dealing with a test/demo environment, like I had here.
  • When troubleshooting Zabbix connections, TLS decryption with Wireshark is not the only way. You should also consider if just increasing the logging level in the Zabbix components brings you enough information to solve your case, or maybe in some specific case you can just disable TLS encryption for an agent for a moment to not have to deal with the decryption at all. But again, usually the encryption is there for a purpose, so you need to evaluate your own situation.

The post Decrypting Zabbix TLS with Wireshark appeared first on Zabbix Blog.

Troubleshooting Zabbix Agent with Wireshark

Post Syndicated from Markku Leiniö original https://blog.zabbix.com/troubleshooting-zabbix-agent-with-wireshark/26514/

A variety of tools exist that can be used to troubleshoot different Zabbix components. In this article I will demonstrate how Wireshark can be used to rule out network connectivity issues as the root cause of data collection problems.

A user has a Zabbix agent that collects the used disk space information on a host. The item interval is one minute:

List of agent items

However, the user complains that Zabbix fails to collect the data appropriately, as the graph has empty areas with occasional dots:

Graph of used disk space

In Zabbix implementations with very high NVPS (new values per second) this may indicate some kind of performance problem where not all data is collected or saved to the database properly. However, that does not seem likely in this particular setup as there are only a couple of hosts and items configured and the NVPS value is under 2.

One question to ask whenever data is missing from Zabbix is: Did the data even arrive to the Zabbix server? If all the data never arrived, it is quite natural that there won’t be full data in the graphs or in the database.

As a networking professional one of the tools I always have at hand is Wireshark, the world-famous protocol analyzer (that just had its 25th anniversary!). Starting from Wireshark version 4.1.0, which is the current development release for the upcoming 4.2.0 stable release, it has built-in support for Zabbix protocol. This means that if you have a network capture of Zabbix agent or proxy traffic, you can analyze the Zabbix traffic contents using Wireshark. Previously this was possible also using manually-installed Lua-based scripts, but I was able to write the same functionality in C language and it was quickly accepted in the official Wireshark codebase as well.

Starting from Zabbix version 4.0, all of the traffic between Zabbix server and Zabbix proxies as well as Zabbix agent 2 traffic is compressed to save bandwidth and improve performance. The Zabbix protocol dissector in Wireshark is able to automatically decompress any compressed Zabbix traffic so that application-level analysis is possible. TLS-encrypted Zabbix protocol traffic is also supported if the session keys are available. I’ll write another post about that later.

In this example case I will use Wireshark to confirm that the agent really collects the disk space usage data and sends it to the server.

Note: Zabbix components (server, proxies, agents) are well-known for their stable network communications. They don’t just pretend to send data, so if they really have problems communicating, they should log those events in their own log files. The components also just do whatever they are configured to do, so usually the roots of any item-collecting problems are found by just checking the Zabbix logs and configurations. In this post I still want to highlight one network-centric way to troubleshoot Zabbix-related issues.

I’ll start by capturing the agent traffic on the server, as the agent is communicating directly with the server, not via a Zabbix proxy. On the Zabbix server I will use sudo tcpdump -v port 10051 -w zabbix-traffic.pcap command to start the capture and see its progress.

I will then restart the Zabbix agent using sudo systemctl restart zabbix-agent2 command (on the agent host, this is a Linux host with Zabbix agent 2).

After capturing traffic for a few minutes I’ll stop the capture with Ctrl-C on the server:

markku@zabbix-server:~$ sudo tcpdump -v port 10051 -w zabbix-traffic.pcap
tcpdump: listening on ens192, link-type EN10MB (Ethernet), snapshot length 262144 bytes
^C958 packets captured
958 packets received by filter
0 packets dropped by kernel
markku@zabbix-server:~$

If you want to test the following steps yourself, you can download the capture file here:

After copying the capture file to my workstation I can open it in Wireshark:

Wireshark window with default view

This is still the default Wireshark profile, but I’ll right-click the Profile: Default text in the bottom right corner, select New, and create a new profile called “Zabbix” to continue with some adjustments. (For more information about configuring Wireshark to fit your taste, see my earlier post on my personal blog about customizing Wireshark settings.)

In the display filter field I’ll first type “zabbix” and press Enter.

Note: If your Wireshark does not recognize the “zabbix” display filter, check that you are running Wireshark version 4.1.0 or newer to support Zabbix protocol dissection, as mentioned earlier in this post.

I’ll expand the Zabbix tree in the lower half of the screen to see the Zabbix-specific fields:

Wireshark window with Zabbix protocol tree opened

I’ll drag the “Agent name: Zabbix70-agent” field to the column headings to add it as a column:

Zabbix agent column added in the packet list in Wireshark

Now I have the agent name conveniently visible in the packet list. The same can be done for any other field as needed. Instead of dragging and dropping the fields, you can also right-click any of the fields and select Apply as column.

I will now filter the packet list based on the agent name, and since the problem agent “Zabbix70-agent” is already visible in the list, I can just drag the agent name into the display filter as “zabbix.agent.name == "Zabbix70-agent"“:

Packet list filtered by the agent name

Now, the original issue is that I want to ensure that the agent really sends the monitored data to Zabbix server, so let’s check one of the “Zabbix Send agent data” packets:

Zabbix protocol packet with data

This is Zabbix agent 2 so the packet is compressed, but as you notice Wireshark automatically uncompressed and showed the contents for me.

The JSON data is a bit hard to read there in the packet bytes pane, but I can right-click the “Data [truncated]” field and select Show packet bytes to see it better:

Wireshark's Show packet bytes window

In the Show as dropdown list there is a selection for JSON to show it even better:

JSON data in Show packet bytes window

So, what does it show us? It shows that in this particular packet there are two data values sent, one for item ID 45797 and one for item ID 45738, with appropriate Unix-style timestamps (clock).

But how do we find out the item ID for the disk usage item?

You can find it in the Zabbix frontend GUI when editing the item: the item ID is shown in the browser address bar as itemid=45797.

But, since we have Wireshark at hand, we can also check the agent config packets that the server sent to the agent. First, add “and zabbix.agent.config and zabbix.response” in the display filter:

Zabbix agent config packet in Wireshark

Most of the responses just contain {"response":"success"} to indicate that there were no changes in the configuration (this is the new incremental configuration update feature in Zabbix protocol since Zabbix version 6.4), but since we restarted the agent during the capture, we have a full agent configuration in one of the responses (the one packet that is larger than the others, packet #36). In that packet there is:

Zabbix agent config data in JSON

So there we see that the item ID corresponding to the vfs.fs.size[/,used] key is 45797.

(In this demo agent we only had two items configured, so the output was very short. In practical cases you certainly have many more items configured.)

Ok, after that small detour, let’s try to filter the agent data packets based on the item ID using display filter:

zabbix.agent.name == "Zabbix70-agent" and zabbix.agent.data and zabbix.data contains "45797"

Agent data filtered with item ID

The “zabbix.data contains” filter is very simple in this example, you may get additional (false) matches in some more complicated cases, so be sure to check your results and adjust the filter as needed.

In this case we got six packets in the list (the capture length was about six minutes). When checking the data field contents more closely, we can see that the agent really sent the server the item values once every minute as configured. The values in the packets are (I copied the clock field from each packet separately and converted to local time using Epoch converter site):

Packet number “value” for itemid 45797 “clock” for itemid 45797 Absolute local time
(from “clock”)
14 1394282496 1690631357 14:49:17
182 1394290688 1690631417 14:50:17
330 1394290688 1690631477 14:51:17
508 1394290688 1690631537 14:52:17
676 1394290688 1690631597 14:53:17
834 1394290688 1690631657 14:54:17

But, when checking the same timespan in the item latest values in Zabbix frontend, there is only one value:

Item values in Latest data

Thus, our collected evidence shows that the Zabbix agent did its configured job properly and it sent the disk usage information every minute to Zabbix server, but Zabbix server decided for some reason to discard some of the values.

In this example the saved value 1394290688 (at 14:50:17) is especially interesting, because the previous value was different (1394282496). The next collected values are the same, and they weren’t saved.

Let’s see the item configuration more carefully:

Item configuration screen

In the top of the screen there is a hint: “Preprosessing 1”, meaning that there is one preprocessing step configured for this item. Let’s open that tab:

Item preprocessing configuration screen

Aha! There is a preprocessing step that says: Discard unchanged with heartbeat: 5 minutes.

It means that whenever Zabbix server receives a value it compares it to the previously saved value, and if the value is the same as earlier, it doesn’t save it, unless the specified heartbeat time has elapsed since the last saved value.

This preprocessing rule is frequently used for items whose values aren’t changing that often, because this can dramatically reduce the database size while still enabling Zabbix to quickly react to changes.

So in this case there wasn’t any problem in the system. The configured behavior just didn’t match the user’s expectations.

Finally, some key takeaways when considering using Wireshark for Zabbix protocol troubleshooting in the application level:

  • Ensure that you capture in the correct place to get the expected data in the capture. In this example I captured on the Zabbix server, but since I was only interested in a single agent, I could have also captured on that agent host, using whatever tool is appropriate for the operating system (like tcpdump, Wireshark, tshark, or see also my post about using Packet Monitor on Windows). Or, if there are capable network devices like firewalls in the path, maybe they can be used for capturing as well (check with your network team).
  • Ensure that you capture with a suitable capture filter. In case of Zabbix protocol the interesting TCP (Transmission Control Protocol, the transport protocol on which Zabbix protocol runs) port is usually 10051, but if you are using Zabbix agents in passive mode (where server/proxy connects to the agents), then you need to also capture TCP port 10050. Also, in your Zabbix setup the ports may have been reconfigured to something else, so check the Zabbix configurations if unsure.
  • When looking at the Zabbix protocol captures in Wireshark, experiment with the display filters to find out exactly what you are looking for. When you type “zabbix.” (with the dot) in the display filter, Wireshark will automatically suggest you all possible Zabbix protocol fields that can be used in the filter. The field names are also shown in the status bar when you click on the fields.
  • Also, be aware of the fact that if your Zabbix components won’t talk to each other at all because of some misconfiguration or connectivity error, the Zabbix protocol display filter won’t show you anything in Wireshark. In those cases you need to resort to other ways of troubleshooting, maybe looking for any TCP-level issues in the captures.
  • Practice! See what the Zabbix traffic (or any other network traffic) looks like when everything works. If you can, try to cause some errors in a testing environment (pull some cable out, disable the firewall rule, stop the server, etc.), and see how it then looks in your captures.

This post was originally published on the author’s blog.

The post Troubleshooting Zabbix Agent with Wireshark appeared first on Zabbix Blog.

Data Buffering in Zabbix Proxy

Post Syndicated from Markku Leiniö original https://blog.zabbix.com/data-buffering-in-zabbix-proxy/25410/

One of the features of Zabbix proxy is that it can buffer the collected monitoring data if connectivity to Zabbix server is lost. In this post I will show it happening, using packet capture, or packet analysis.

Zabbix setup and capturing Zabbix proxy traffic

This is the setup in this demo:

  • One Zabbix server in the central site (IPv6 address 2001:db8:1234::bebe and DNS name zabbixtest.lein.io)
  • One Zabbix proxy “Proxy-1” in a remote site (IPv6 address 2001:db8:9876::fafa and IPv4 address 10.0.41.65)
  • One Zabbix agent “Testhost” on a server in the remote site, sending data via the proxy

For simplicity, the agent only monitors one item: the system uptime (item key system.uptime using Zabbix active agent), with 20 seconds interval. So that’s the data that we are expecting to arrive to the server, every 20 seconds.

The proxy is an active proxy using SQLite database, with these non-default configurations in the configuration file:

Server=zabbixtest.lein.io
Hostname=Proxy-1
DBName=/var/lib/zabbix/zabbix_proxy

The proxy “Proxy-1” has also been added in Zabbix server using the frontend.

I’m using Zabbix server and proxy version 6.4.0beta5 here. Agents are normally compatible with newer servers and proxies, so I happened to use an existing agent that was version 4.0.44.

With this setup successfully running, I started packet capture on the Zabbix server, capturing only packets for the proxy communication:

sudo tcpdump host 2001:db8:9876::fafa -v -w proxybuffer.pcap

After having it running for a couple of minutes, I introduced a “network outage” by dropping the packets from the proxy in the server:

sudo ip6tables -A INPUT -s 2001:db8:9876::fafa -j DROP

I kept that drop rule in use for a few minutes and then deleted it with a suitable ip6tables command (sudo ip6tables -D INPUT 1 in this case), and stopped the capture some time after that.

Analyzing the captured Zabbix traffic with Wireshark

I downloaded the capture file (proxybuffer.pcap) to my workstation where I already had Wireshark installed. I also had the Zabbix dissector for Wireshark installed. Without this specific dissector the Zabbix packet contents are just unreadable binary data because the proxy communication is compressed since Zabbix version 4.0.

You can download the same capture file here if you want to follow along:

After opening the capture file in Wireshark I first entered zabbix in the display filter, expanded the Zabbix fields in the protocol tree a bit, and this is what I got:

(Your Wireshark view will probably look different. If you are interested in changing it, see my post about customizing Wireshark settings.)

Since this is an active proxy communicating with the server, there is always first a packet from the proxy (config request or data to be sent) and then the response from the server.

Let’s look at the packets from the proxy only. We get that by adding the proxy source IP address in the filter (by typing it to the field as an ipv6.src filter, or by dragging the IP address from the Source column to the display filter like I did):

Basically there are two types of packets shown:

  • Proxy data
  • Request proxy config

The configuration requests are easier to explain: in Zabbix proxy 6.4 there is a configuration parameter ProxyConfigFrequency (in earlier Zabbix versions the same was called ConfigFrequency):

How often proxy retrieves configuration data from Zabbix server in seconds. Active proxy parameter. Ignored for passive proxies (see ProxyMode parameter). https://www.zabbix.com/documentation/devel/en/manual/appendix/config/zabbix_proxy

It defaults to 10 seconds. What basically happens in each config request is that the proxy says “my current configuration revision is 1234”, and then the server responds to that.

Note: The configuration request concept has been changed in Zabbix 6.4 to use incremental configurations when possible, so the proxy is allowed to get the updated configuration much faster compared to earlier default of 3600 seconds or one hour in Zabbix 6.2 and earlier. See What’s new in Zabbix 6.4.0 for more information.

The other packet type shown above is the proxy data packet. It is actually also used for other than data. In proxy configuration there is a parameter DataSenderFrequency:

Proxy will send collected data to the server every N seconds. Note that active proxy will still poll Zabbix server every second for remote command tasks. Active proxy parameter. Ignored for passive proxies (see ProxyMode parameter). https://www.zabbix.com/documentation/devel/en/manual/appendix/config/zabbix_proxy

The default value for it is one second. But as mentioned in the quote above, even if you increase the configuration value (= actually decrease the frequency… but it is what it is), the proxy will connect to the server every second anyway.

Note: There is a feature request ZBXNEXT-4998 about making the task update interval configurable. Vote and watch that issue if you are interested in that for example for battery-powered Zabbix use cases.

The first packet shown above is (JSON reformatted for better readability):

{
    "request": "proxy data",
    "host": "Proxy-1",
    "session": "38cca0391f7427d0ad487f75755e7166",
    "version": "6.4.0beta5",
    "clock": 1673190378,
    "ns": 360076308
}

There is no “data” in the packet, that’s just the proxy basically saying “hey I’m still here!” to the server so that the server has an opportunity to talk back to the proxy if it has something to say, like a remote command to run on the proxy or on any hosts monitored by the proxy.

As mentioned earlier, the test setup consisted of only one collected item, and that is being collected every 20 seconds, so it is natural that not all data packets contain monitoring data.

I’m further filtering the packets to show only the proxy data packets by adding zabbix.proxy.data in the display filter (by dragging the “Proxy Data: True” field to the filter):

(Yes yes, the topic of this post is data buffering in Zabbix proxy, and we are getting there soon)

Now, there is about 20 seconds worth of packets shown, so we should have one actual data packet there, and there it is, the packet number 176: it is about 50 bytes larger than other packets so there must be something. Here is the Data field contents of that packet:

{
    "request": "proxy data",
    "host": "Proxy-1",
    "session": "38cca0391f7427d0ad487f75755e7166",
    "history data": [
        {
            "id": 31,
            "itemid": 44592,
            "clock": 1673190392,
            "ns": 299338333,
            "value": "1686"
        }
    ],
    "version": "6.4.0beta5",
    "clock": 1673190393,
    "ns": 429562969
}

In addition to the earlier fields there is now a list called history data containing one object. That object has fields like itemid and value. The itemid field has the actual item ID for the monitored item, it can be seen in the URL address in the browser when editing the item in Zabbix frontend. The value 1686 is the actual value of the monitored item (the system uptime in seconds, the host was rebooted about 28 minutes ago).

Let’s develop the display filter even more. Now that we are quite confident that packets that have TCP length of about 136-138 bytes are just the empty data packets without item data, we can get the interesting data packets by adding tcp.len > 140 in the display filter:

When looking at the packet timestamps there is the 20-second interval observed until about 17:08:30. Then there is about 3.5 minutes gap, next send at 17:11:53, and then the data was flowing again with the 20-second interval. The 3.5 minutes gap corresponds to the network outage that was manually caused in the test. The data packet immediately after the outage is larger than others, so let’s see that:

{
    "request": "proxy data",
    "host": "Proxy-1",
    "session": "38cca0391f7427d0ad487f75755e7166",
    "history data": [
        {
            "id": 37,
            "itemid": 44592,
            "clock": 1673190512,
            "ns": 316923947,
            "value": "1806"
        },
        {
            "id": 38,
            "itemid": 44592,
            "clock": 1673190532,
            "ns": 319597379,
            "value": "1826"
        },
--- JSON truncated ---
        {
            "id": 45,
            "itemid": 44592,
            "clock": 1673190672,
            "ns": 345132325,
            "value": "1966"
        },
        {
            "id": 46,
            "itemid": 44592,
            "clock": 1673190692,
            "ns": 348345312,
            "value": "1986"
        }
    ],
    "auto registration": [
        {
            "clock": 1673190592,
            "host": "Testhost",
            "ip": "10.0.41.66",
            "port": "10050",
            "tls_accepted": 1
        }
    ],
    "version": "6.4.0beta5",
    "clock": 1673190708,
    "ns": 108126335
}

What we see here is that there are several history data objects in the same data packet from the proxy. The itemid field is still the same as earlier (44592), and the value field is increasing in 20-second steps. Also the timestamps (clock and nanoseconds) are increasing correspondingly, so we see when the values were actually collected, even though they were sent to the server only a few minutes later, having been buffered by the proxy.

That is also confirmed by looking at the Latest data graph in Zabbix frontend for that item during the time of the test:

There is a nice increasing graph with no gaps or jagged edges.

By the way, this is how the outage looked like in the Zabbix proxy log (/var/log/zabbix/zabbix_proxy.log on the proxy):

   738:20230108:170835.557 Unable to connect to [zabbixtest.lein.io]:10051 [cannot connect to [[zabbixtest.lein.io]:10051]: [4] Interrupted system call]
   738:20230108:170835.558 Will try to reconnect every 120 second(s)
   748:20230108:170835.970 Unable to connect to [zabbixtest.lein.io]:10051 [cannot connect to [[zabbixtest.lein.io]:10051]: [4] Interrupted system call]
   748:20230108:170835.970 Will try to reconnect every 1 second(s)
   748:20230108:170939.993 Still unable to connect...
   748:20230108:171040.015 Still unable to connect...
   738:20230108:171043.561 Still unable to connect...
   748:20230108:171140.068 Still unable to connect...
   748:20230108:171147.105 Connection restored.
   738:20230108:171243.563 Connection restored.

The log looks confusing at first because it shows the messages twice. Also, the second “Connection restored” message arrived almost one minute after the data sending was already restored, as proved in the packet list earlier. The explanation is (as far as I understand it) that the configuration syncer and data sender are separate processes in the proxy, as described in https://www.zabbix.com/documentation/devel/en/manual/concepts/proxy#proxy-process-types. When looking at the packets we see that at 17:12:43 (when the second “Connection restored” message arrived) the proxy sent a proxy config request to the server, so apparently the data sender tries to reconnect every second (to facilitate fast recovery for monitoring data), while the config syncer only tries every two minutes (based on the “Will try to reconnect every 120 second(s)” message, and that corresponds to the outage start time 17:08:35 plus 2 x 2 minutes, plus some extra seconds, presumably because of TCP timeouts).

There were no messages on the Zabbix server log (/var/log/zabbix/zabbix_server.log) for this outage as the outage did not happen in the middle of the TCP session and the proxy was in active mode (= connections are always initiated by the proxy, not by the server), so there was nothing special to log in the Zabbix server process log.

Configurations for the proxy data buffering

In the configuration file for Zabbix proxy 6.4 there are two configuration parameters that control the buffering: ProxyLocalBuffer

Proxy will keep data locally for N hours, even if the data have already been synced with the server. This parameter may be used if local data will be used by third-party applications. (Default = 0) https://www.zabbix.com/documentation/devel/en/manual/appendix/config/zabbix_proxy

ProxyOfflineBuffer

Proxy will keep data for N hours in case of no connectivity with Zabbix server. Older data will be lost. (Default = 1) https://www.zabbix.com/documentation/devel/en/manual/appendix/config/zabbix_proxy

The ProxyOfflineBuffer parameter is the important one. If you need to tolerate longer outages than one hour between the proxy and the Zabbix server (and you have enough disk storage on the proxy), you can increase the value. There is no separate filename or path to configure because proxy uses the dedicated database (configured when installed the proxy) for storing the buffered data.

The ProxyLocalBuffer parameter is uninteresting for most (and disabled by default) because that’s only useful if you plan to fetch the collected data directly from the proxy database into some other external application, and you need to have some flexibility for scheduling the data retrievals from the database.

This post was originally published on the author’s blog.

LLD Filtering with Macros

Post Syndicated from Markku Leiniö original https://blog.zabbix.com/lld-filtering-with-macros/24959/

When configuring monitoring and using templates in Zabbix you often see low-level discovery (LLD) used for finding out the monitored components or features of a host. In this post, I will explain how user macros and regular expressions are used in LLD for filtering the discovery results.

I’m using the Network Generic Device by SNMP template as an example. (Note that by using the dropdown menu in the top of that linked page you can select the Zabbix version you are using. It defaults to Master, which means the latest Zabbix version that is being developed, currently 6.4.)

Let’s see the Network interfaces discovery rule and specifically the Filters tab:

Discovery rule filters

All these filters use regular expressions to match (or not match) the LLD macro value. For example:

{#IFNAME} matches {$NET.IF.IFNAME.MATCHES}

These are the macros defined in the template:

Macros defined in the template

There we see that {$NET.IF.IFNAME.MATCHES} is defined with a value: ^.*$

That is a regular expression (often called regexp or regex). I won’t try to make this post a full regular expression tutorial, but there is:

  • ^ = match the beginning of the string
  • . = match any single character
  • * = match zero or more occurrences of the previous element (which is any character in this case)
  • $ = match the end of the string

Basically, that means: “match any kind of string, empty or not”

(In this case a shorter .* would mean the exact same thing, but that’s how the template was configured when I downloaded it.)

When the discovery runs, it finds all network interfaces and assigns values to all of the LLD macros (like the interface name to {#IFNAME}), and then the filters are tested.

In the LLD filters Type of calculation is usually set to “And” (see the first screenshot), so that all filters need to be true for the interface to be discovered (in other words, if any of the filters is false, then no item is created for that interface).

If you want to change the filtering by modifying the macros, here is the thing:

  • You don’t modify the macros in the template.
  • You should modify the macros in the host that is using the template.

When you go to the Macros tab on your host, there is the Inherited and host macros button. After clicking it, you will also see all macros that are defined in the templates that the host is using:

Inherited and host macros for a host

You can click the Change link for any of the macros to enter a new value for that macro, and that value will then be used for everything for this host. The value in the template will thus act as a default value that is used whenever there is no other value set at the host level.

If you for example want to discover only interfaces that start with “wan”, “lan” or “vlan”, you can use this regexp in {$NET.IF.IFNAME.MATCHES} macro (again, change it in the host macros, not in the template): ^(wan|lan|vlan)

It means:

  • match “wan”, “lan” or “vlan”
  • but only if they are in the beginning of the string.

This is the same, just grouped differently: (^wan|^lan|^vlan)

If you at the same time want to exclude interface “vlan999”, you can use {$NET.IF.IFNAME.NOT_MATCHES} macro for that (note the “does not match” selection in the LLD filters list). The default value for that macro is:

(^Software Loopback Interface|^NULL[0-9.]*$|^[Ll]o[0-9.]*$|^[Ss]ystem$|^Nu[0-9.]*$|^veth[0-9a-z]+$|docker[0-9]+|br-[a-z0-9]{12})

Quite a mouthful, but it is basically a long list of “or” patterns separated by the vertical bar (|). You can add your own exclusion there inside the parenthesis, separated by |, or if you know that’s the only thing you want to exclude in that particular host, you can just replace the whole string with ^vlan999$ to exclude only vlan999 (and not for example lan999 or vlan9999). Note the use of ^ and $ to make sure it only matches the full interface name, not any partial names.

A common “not matches” macro value for me is something like this: ^(Nu|Tunnel|Loopback|VoIP)

It will exclude all those Null0, Loopback0 and other virtual interfaces that may exist on the device by default but won’t usually be useful in Zabbix statistics. I will always exclude these kinds of interfaces to reduce polling intensity and save database capacity.

It should also be said that all these regular expressions are case-sensitive, so use upper case or lower case as appropriate in your particular device, or expand the regexp to include various syntaxes as needed.

To conclude: When you want to reconfigure the discovery for a host:

  • See the filters that are used in the discovery rule
  • Check which macros are used in the filters
  • In the host you are configuring, change the macro values to achieve the desired filtering results.

This post was originally published on the author’s blog.