All posts by Nikunj Vaidya

Gaining operational insights with AIOps using Amazon DevOps Guru

Post Syndicated from Nikunj Vaidya original https://aws.amazon.com/blogs/devops/gaining-operational-insights-with-aiops-using-amazon-devops-guru/

Amazon DevOps Guru offers a fully managed AIOps platform service that enables developers and operators to improve application availability and resolve operational issues faster. It minimizes manual effort by leveraging machine learning (ML) powered recommendations. Its ML models take advantage of AWS’s expertise in operating highly available applications for the world’s largest e-commerce business for over 20 years. DevOps Guru automatically detects operational issues, predicts impending resource exhaustion, details likely causes, and recommends remediation actions.

This post walks you through how to enable DevOps Guru for your account in a typical serverless environment and observe the insights and recommendations generated for various activities. These insights are generated for operational events that could pose a risk to your application availability. DevOps Guru uses AWS CloudFormation stacks as the application boundary to detect resource relationships and co-relate with deployment events.

Solution overview

The goal of this post is to demonstrate the insights generated for anomalies detected by DevOps Guru from DevOps operations. If you don’t have a test environment and want to build out infrastructure to test the generation of insights, then you can follow along through this post. However, if you have a test or production environment (preferably spawned from CloudFormation stacks), you can skip the first section and jump directly to section, Enabling DevOps Guru and injecting traffic.

The solution includes the following steps:

1. Deploy a serverless infrastructure.

2. Enable DevOps Guru and inject traffic.

3. Review the generated DevOps Guru insights.

4. Inject another failure to generate a new insight.

As depicted in the following diagram, we use a CloudFormation stack to create a serverless infrastructure, comprising of Amazon API Gateway, AWS Lambda, and Amazon DynamoDB, and inject HTTP requests at a high rate towards the API published to list records.

Serverless infrastructure monitored by DevOps Guru

When DevOps Guru is enabled to monitor your resources within the account, it uses a combination of vended Amazon CloudWatch metrics and specific patterns from its ML models to detect anomalies. When an anomaly is detected, it generates an insight with the recommendations.

The generation of insights is dependent upon several factors. Although this post provides a canned environment to reproduce insights, the results may vary depending upon traffic pattern, timings of traffic injection, and so on.

Prerequisites

To complete this tutorial, you should have access to an AWS Cloud9 environment and the AWS Command Line Interface (AWS CLI).

Deploying a serverless infrastructure

To deploy your serverless infrastructure, you complete the following high-level steps:

1.   Create your IDE environment.

2.   Launch the CloudFormation template to deploy the serverless infrastructure.

3.   Populate the DynamoDB table.


1. Creating your IDE environment

We recommend using AWS Cloud9 to create an environment to get access to the AWS CLI from a bash terminal. AWS Cloud9 is a browser-based IDE that provides a development environment in the cloud. While creating the new environment, ensure you choose Linux2 as the operating system. Alternatively, you can use your bash terminal in your favorite IDE and configure your AWS credentials in your terminal.

When access is available, run the following command to confirm that you can see the Amazon Simple Storage Service (Amazon S3) buckets in your account:

aws s3 ls

Install the following prerequisite packages and ensure you have Python3 installed:

sudo yum install jq -y

export AWS_REGION=$(curl -s \
169.254.169.254/latest/dynamic/instance-identity/document | jq -r '.region')

sudo pip3 install requests

Clone the git repository to download the required CloudFormation templates:

git clone https://github.com/aws-samples/amazon-devopsguru-samples
cd amazon-devopsguru-samples/generate-devopsguru-insights/

2. Launching the CloudFormation template to deploy your serverless infrastructure

To deploy your infrastructure, complete the following steps:

  • Run the CloudFormation template using the following command:
aws cloudformation create-stack --stack-name myServerless-Stack \
--template-body file:///$PWD/cfn-shops-monitoroper-code.yaml \
--capabilities CAPABILITY_IAM CAPABILITY_NAMED_IAM

The AWS CloudFormation deployment creates an API Gateway, a DynamoDB table, and a Lambda function with sample code.

  • When it’s complete, go to the Outputs tab of the stack on the AWS CloudFormation console.
  • Record the links for the two APIs: one of them to list the table contents and other one to populate the contents.

3. Populating the DynamoDB table

Run the following commands (simply copy-paste) to populate the DynamoDB table. The below three commands will identify the name of the DynamoDB table from the CloudFormation stack and populate the name in the populate-shops-dynamodb-table.json file.

dynamoDBTableName=$(aws cloudformation list-stack-resources \
--stack-name myServerless-Stack | \
jq '.StackResourceSummaries[]|select(.ResourceType == "AWS::DynamoDB::Table").PhysicalResourceId' | tr -d '"')
sudo sed -i s/"<YOUR-DYNAMODB-TABLE-NAME>"/$dynamoDBTableName/g \
populate-shops-dynamodb-table.json
aws dynamodb batch-write-item \
--request-items file://populate-shops-dynamodb-table.json

The command gives the following output:

{
"UnprocessedItems": {}
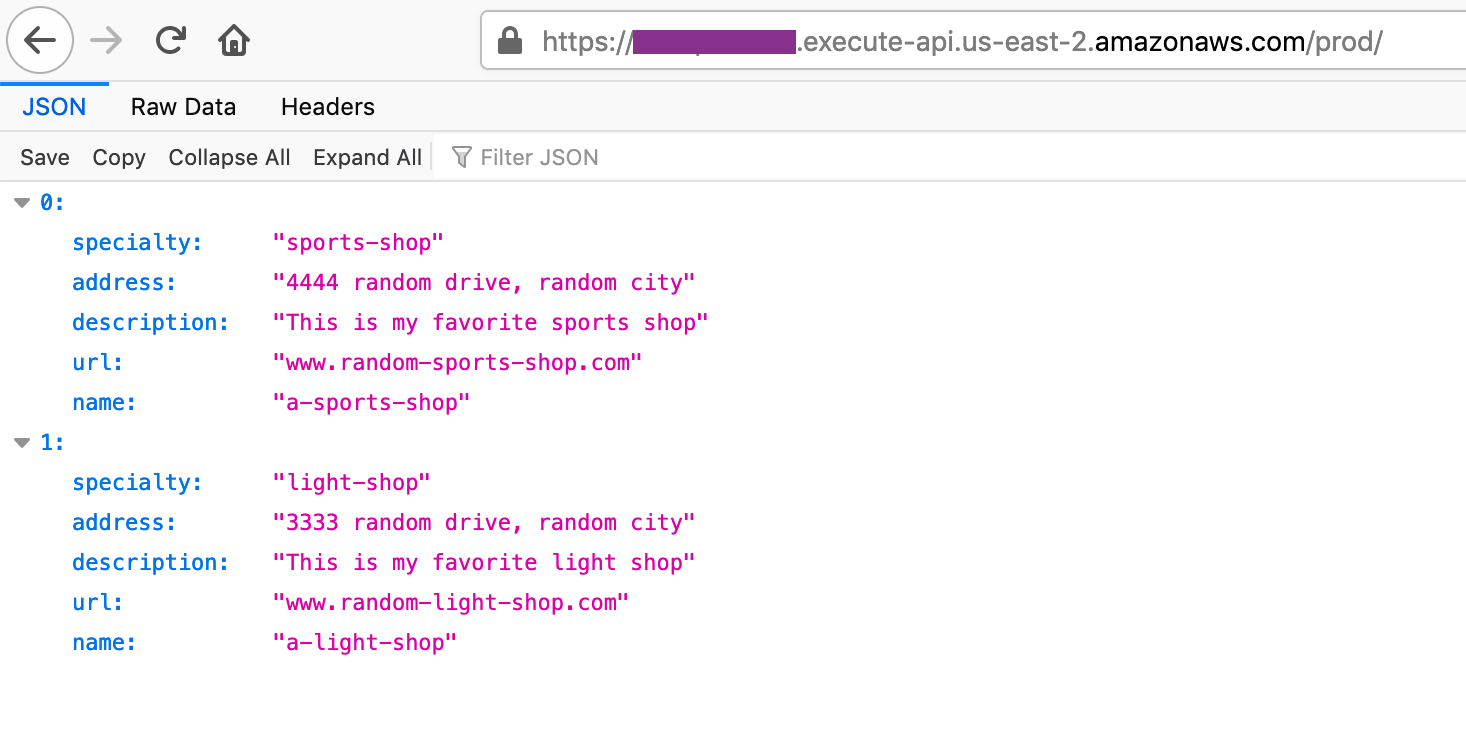
}

This populates the DynamoDB table with a few sample records, which you can verify by accessing the ListRestApiEndpointMonitorOper API URL published on the Outputs tab of the CloudFormation stack. The following screenshot shows the output.

Screenshot showing the API output

Enabling DevOps Guru and injecting traffic

In this section, you complete the following high-level steps:

1.   Enable DevOps Guru for the CloudFormation stack.

2.   Wait for the serverless stack to complete.

3.   Update the stack.

4.   Inject HTTP requests into your API.


1. Enabling DevOps Guru for the CloudFormation stack

To enable DevOps Guru for CloudFormation, complete the following steps:

  • Run the CloudFormation template to enable DevOps Guru for this CloudFormation stack:
aws cloudformation create-stack \
--stack-name EnableDevOpsGuruForServerlessCfnStack \
--template-body file:///$PWD/EnableDevOpsGuruForServerlessCfnStack.yaml \
--parameters ParameterKey=CfnStackNames,ParameterValue=myServerless-Stack \
--region ${AWS_REGION}
  • When the stack is created, navigate to the Amazon DevOps Guru console.
  • Choose Settings.
  • Under CloudFormation stacks, locate myServerless-Stack.

If you don’t see it, your CloudFormation stack has not been successfully deployed. You may remove and redeploy the EnableDevOpsGuruForServerlessCfnStack stack.

Optionally, you can configure Amazon Simple Notification Service (Amazon SNS) topics or enable AWS Systems Manager integration to create OpsItem entries for every insight created by DevOps Guru. If you need to deploy as a stack set across multiple accounts and Regions, see Easily configure Amazon DevOps Guru across multiple accounts and Regions using AWS CloudFormation StackSets.

2. Waiting for baselining of resources

This is a necessary step to allow DevOps Guru to complete baselining the resources and benchmark the normal behavior. For our serverless stack with 3 resources, we recommend waiting for 2 hours before carrying out next steps. When enabled in a production environment, depending upon the number of resources selected to monitor, it can take up to 24 hours for it to complete baselining.

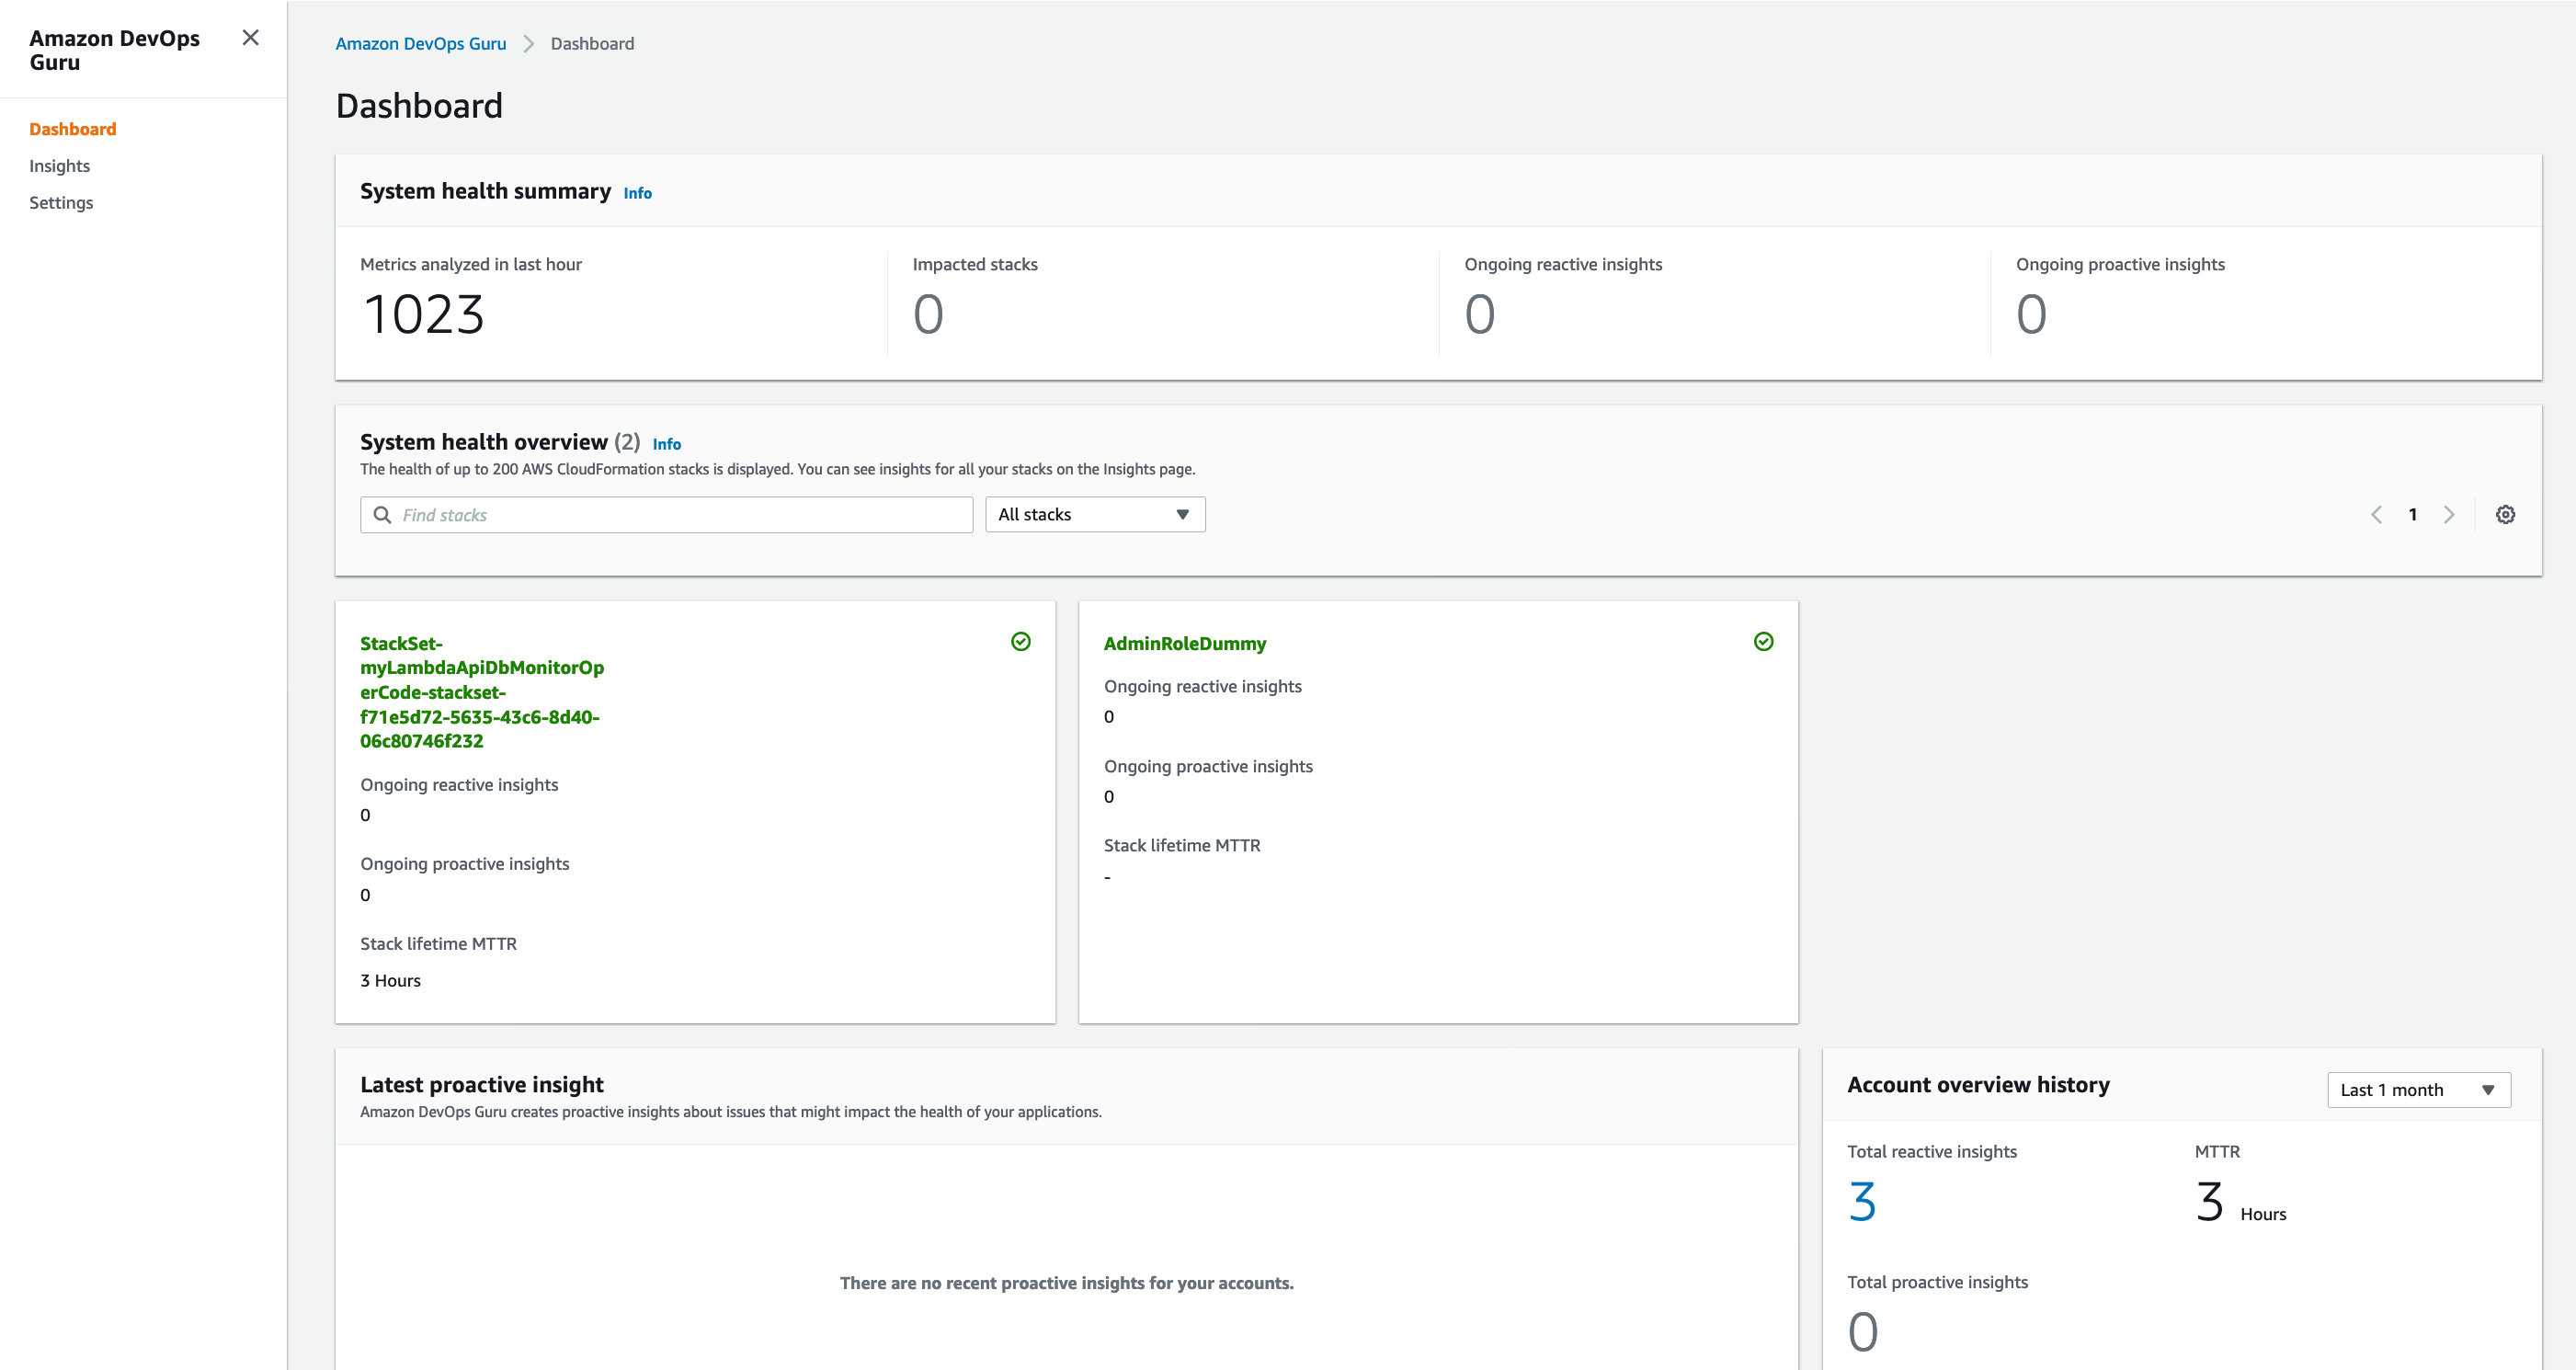
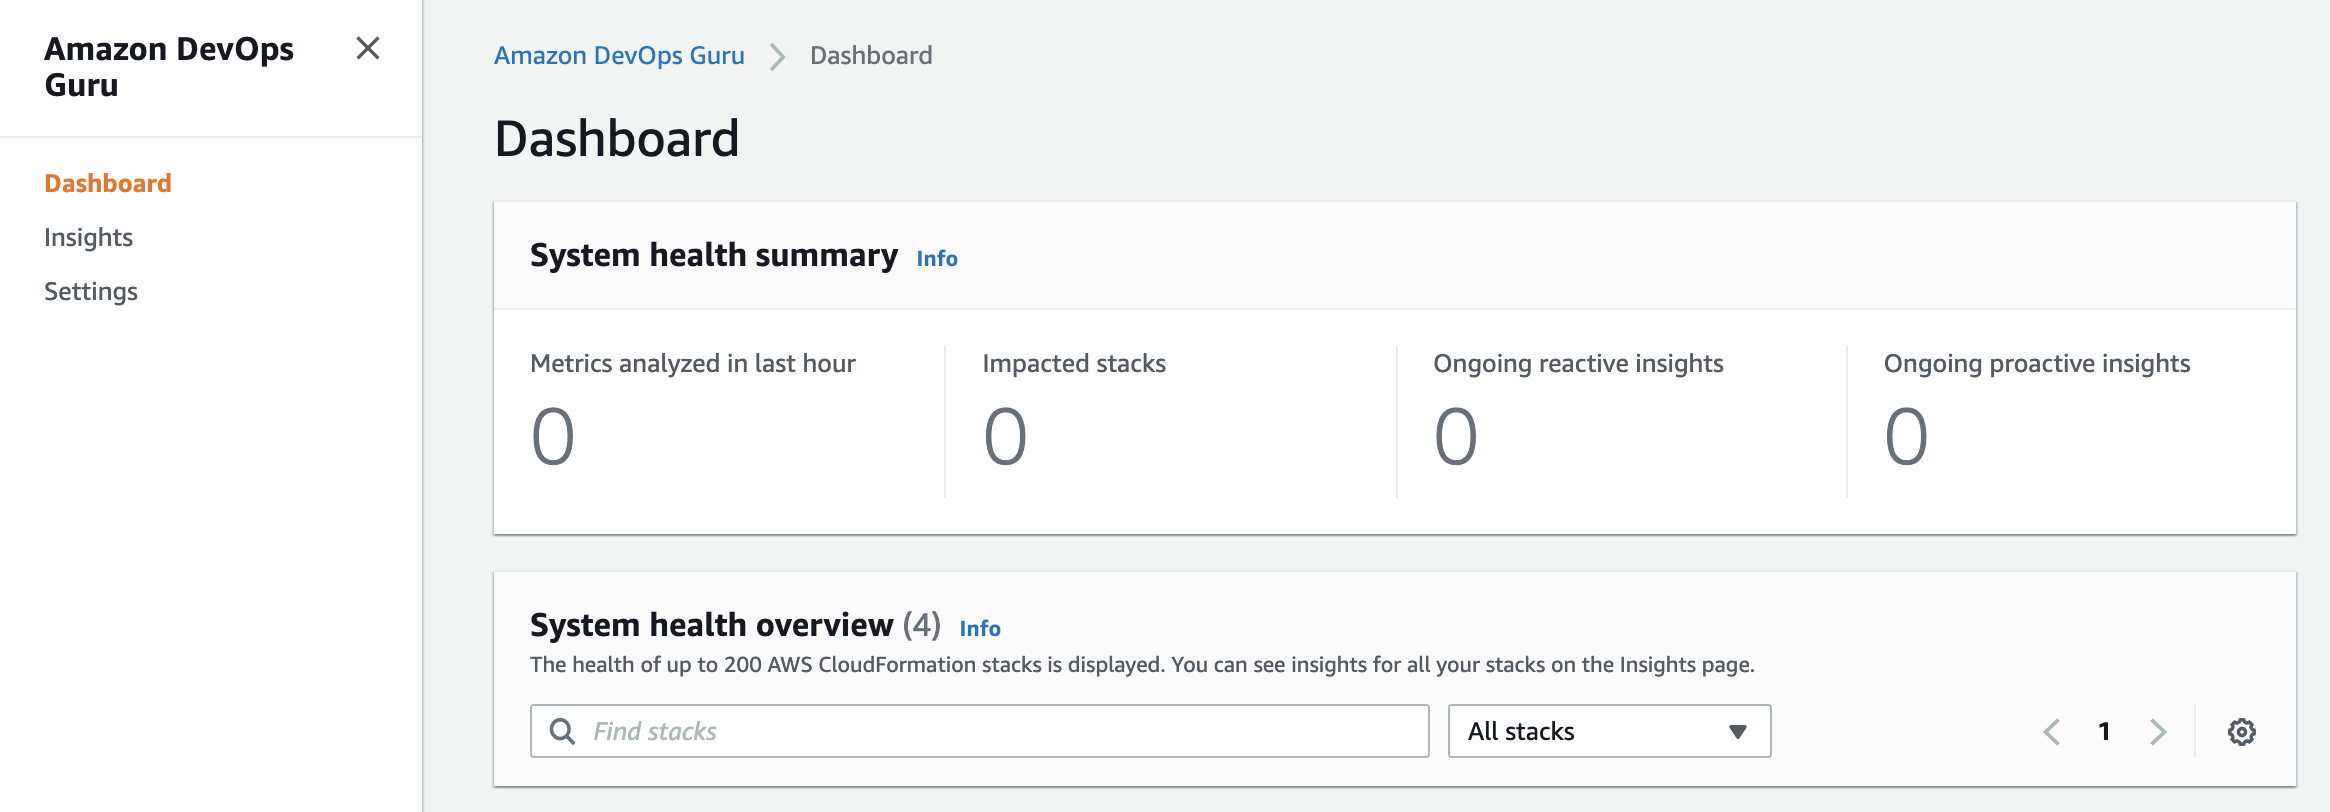
Note: Unlike many monitoring tools, DevOps Guru does not expect the dashboard to be continuously monitored and thus under normal system health, the dashboard would simply show zero’ed counters for the ongoing insights. It is only when an anomaly is detected, it will raise an alert and display an insight on the dashboard.

3. Updating the CloudFormation stack

When enough time has elapsed, we will make a configuration change to simulate a typical operational event. As shown below, update the CloudFormation template to change the read capacity for the DynamoDB table from 5 to 1.

CloudFormation showing read capacity settings to modify

Run the following command to deploy the updated CloudFormation template:

aws cloudformation update-stack --stack-name myServerless-Stack \
--template-body file:///$PWD/cfn-shops-monitoroper-code.yaml \
--capabilities CAPABILITY_IAM CAPABILITY_NAMED_IAM

4. Injecting HTTP requests into your API

We now inject ingress traffic in the form of HTTP requests towards the ListRestApiEndpointMonitorOper API, either manually or using the Python script provided in the current directory (sendAPIRequest.py). Due to reduced read capacity, the traffic will oversubscribe the dynamodb tables, thus inducing an anomaly. However, before triggering the script, populate the url parameter with the correct API link for the  ListRestApiEndpointMonitorOper API, listed in the CloudFormation stack’s output tab.

After the script is saved, trigger the script using the following command:

python sendAPIRequest.py

Make sure you’re getting an output of status 200 with the records that we fed into the DynamoDB table (see the following screenshot). You may have to launch multiple tabs (preferably 4) of the terminal to run the script to inject a high rate of traffic.

Terminal showing script executing and injecting traffic to API

After approximately 10 minutes of the script running in a loop, an operational insight is generated in DevOps Guru.


Reviewing DevOps Guru insights

While these operations are being run, DevOps Guru monitors for anomalies, logs insights that provide details about the metrics indicating an anomaly, and prints actionable recommendations to mitigate the anomaly. In this section, we review some of these insights.

Under normal conditions, DevOps Guru dashboard will show the ongoing insights counter to be zero. It monitors a high number of metrics behind the scenes and offloads the operator from manually monitoring any counters or graphs. It raises an alert in the form of an insight, only when anomaly occurs.

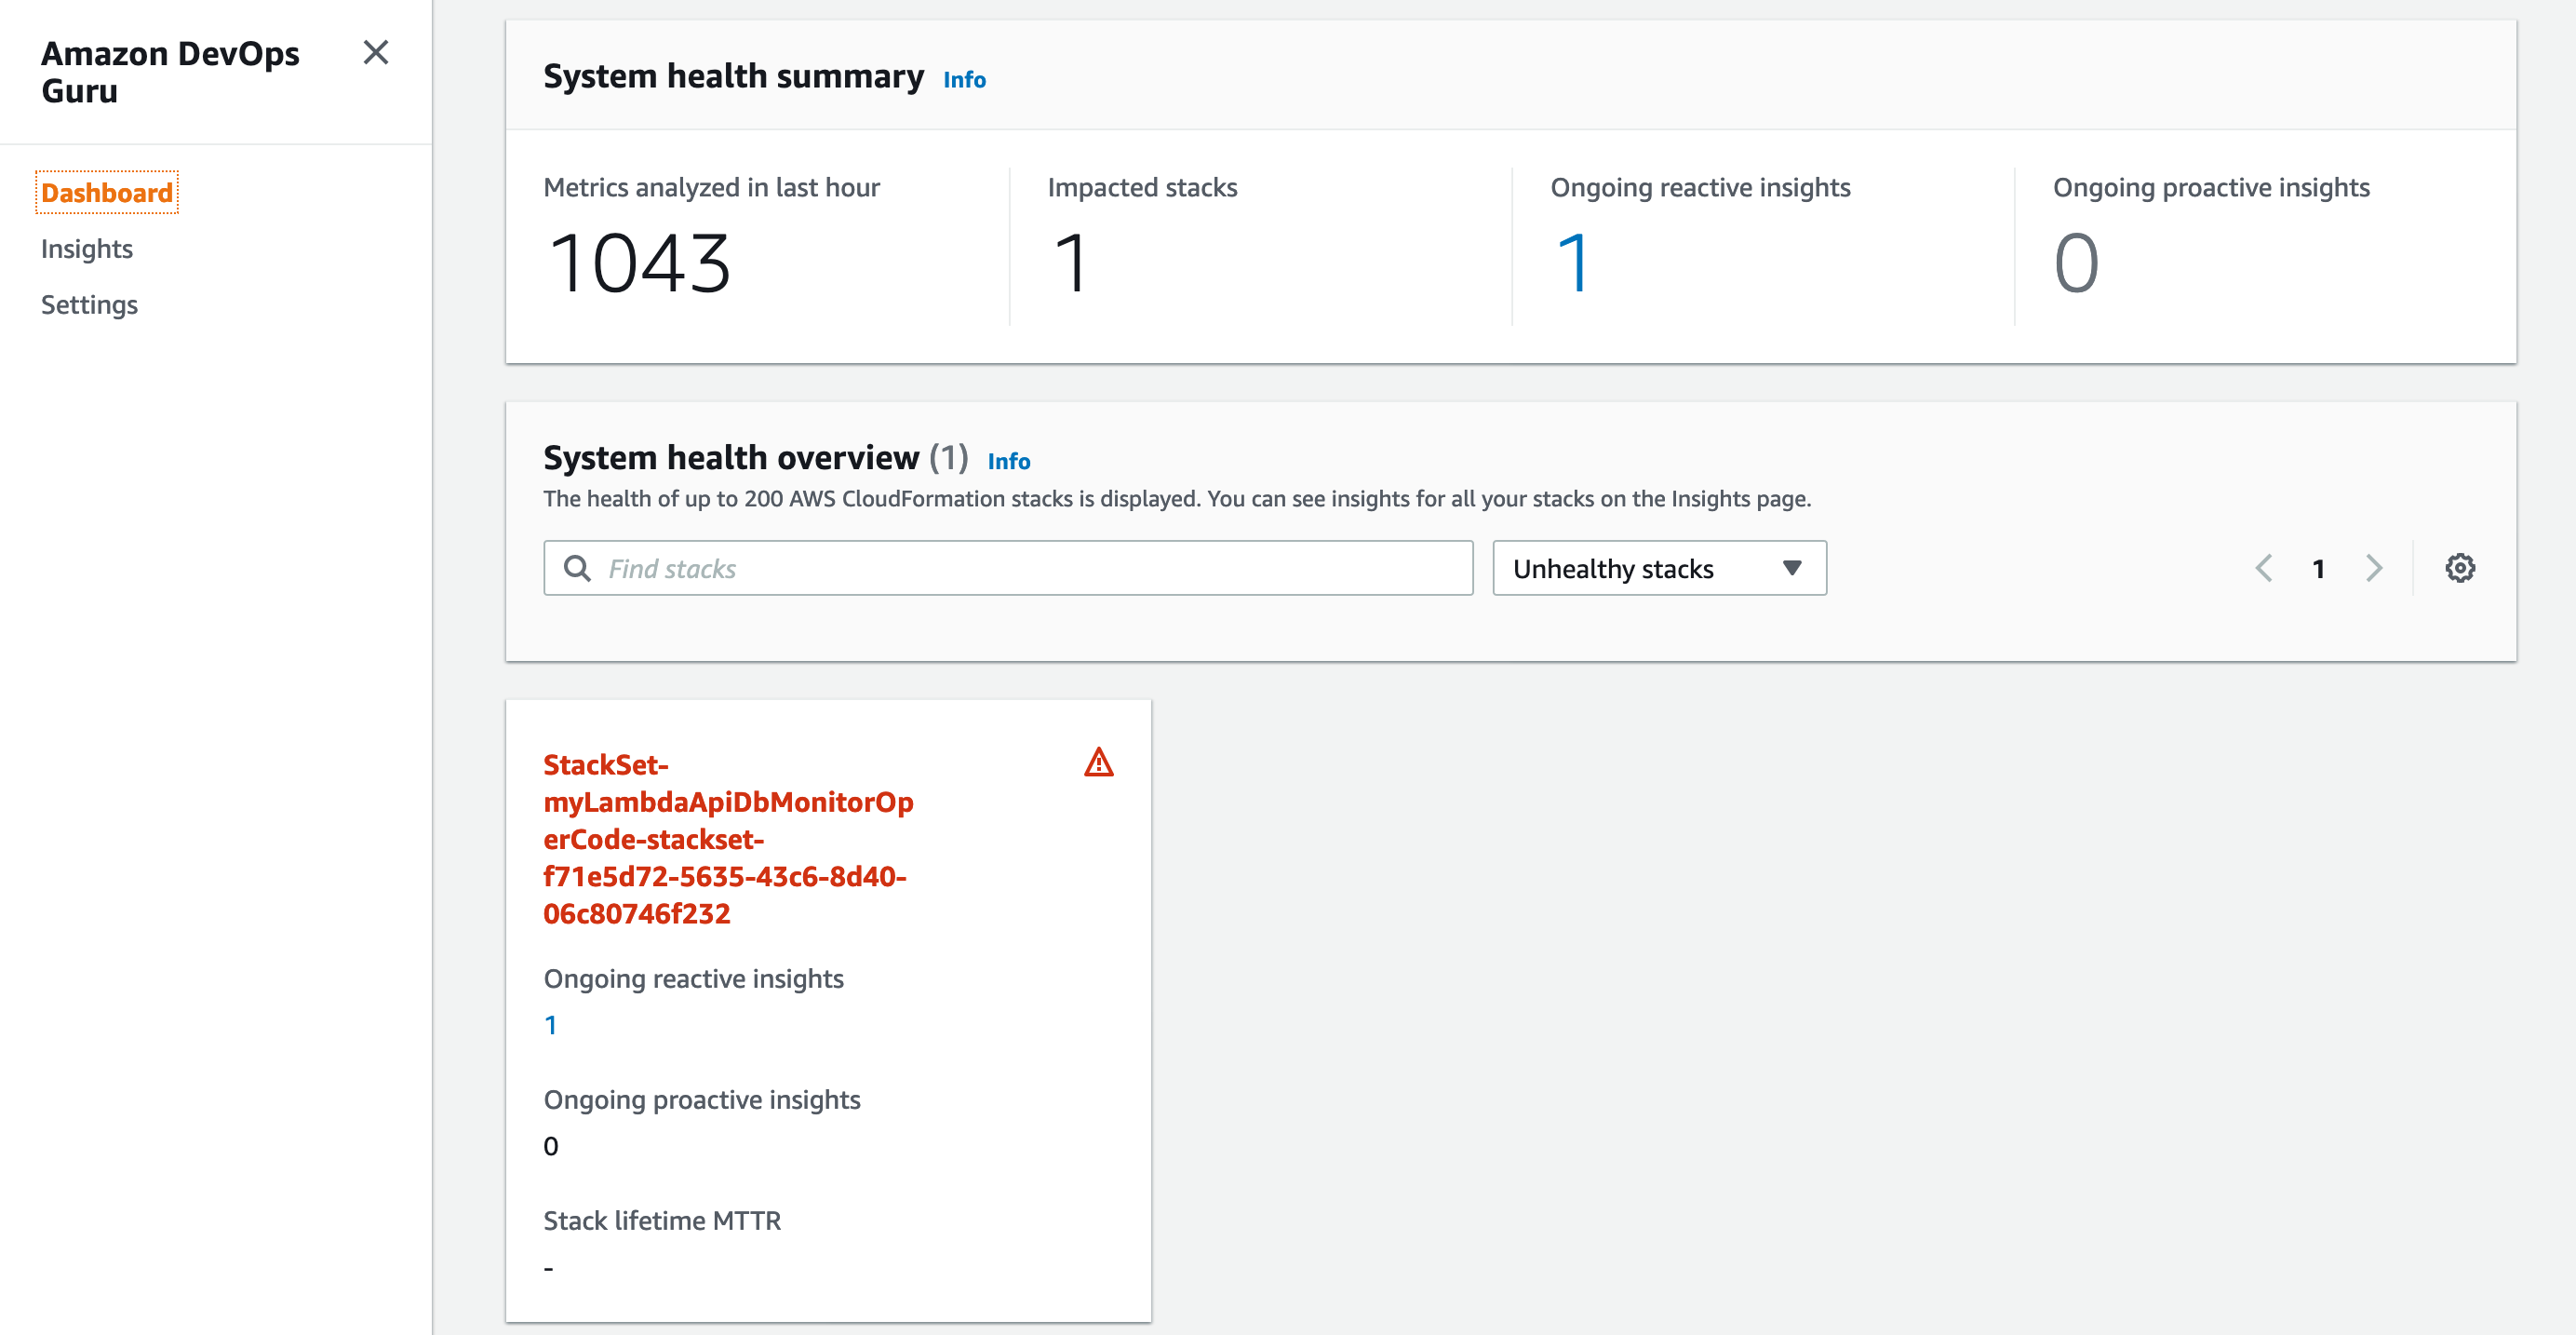
The following screenshot shows an ongoing reactive insight for the specific CloudFormation stack. When you choose the insight, you see further details. The number under the Total resources analyzed last hour may vary, so for this post, you can ignore this number.

DevOps Guru dashboard showing an ongoing reactive insight

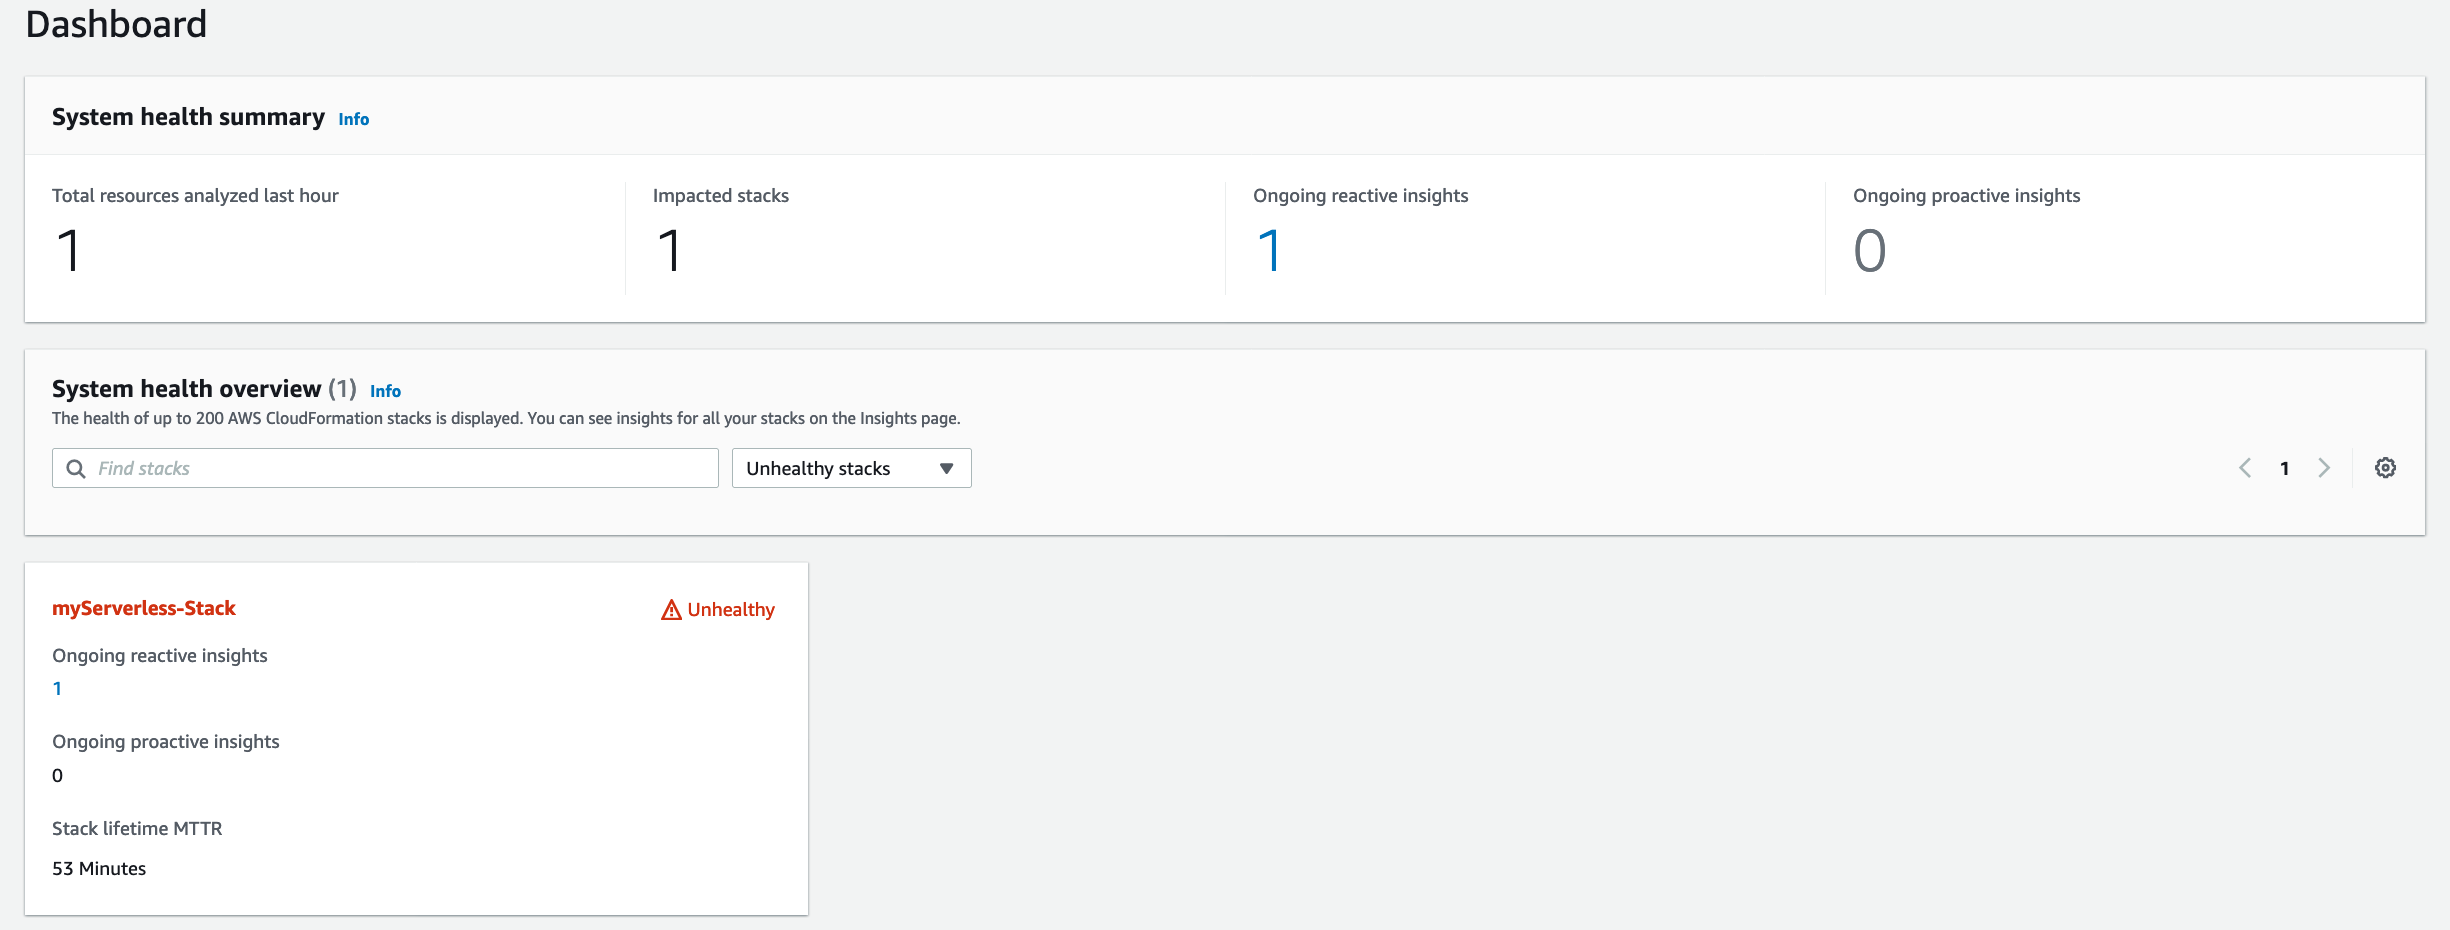
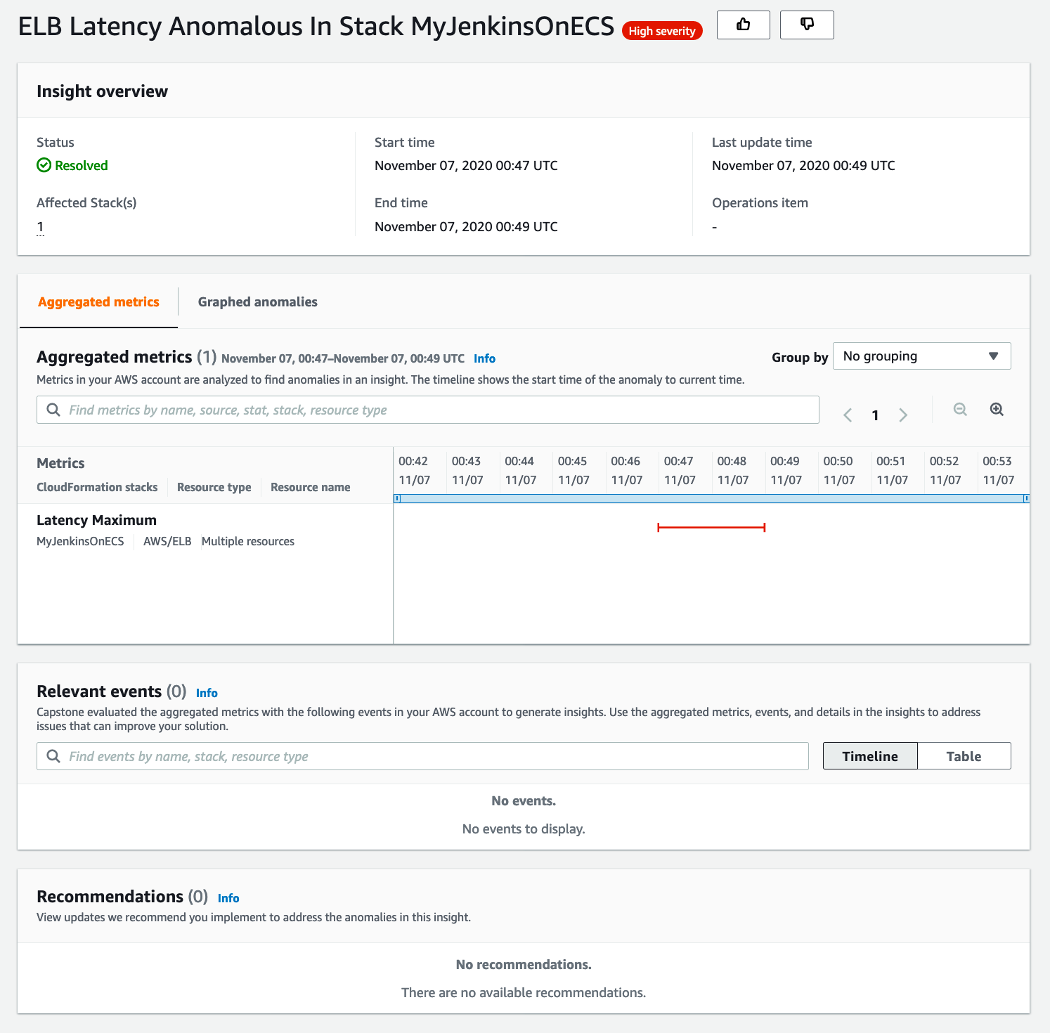
The insight is divided into four sections: Insight overview, Aggregated metrics, Relevant events, and Recommendations. Let’s take a closer look into these sections.

The following screenshot shows the Aggregated metrics section, where it shows metrics for all the resources that it detected anomalies in (DynamoDB, Lambda, and API Gateway). Note that depending upon your traffic pattern, lambda settings, baseline traffic, the list of metrics may vary. In the example below, the timeline shows that an anomaly for DynamoDB started first and was followed by API Gateway and Lambda. This helps us understand the cause and symptoms, and prioritize the right anomaly investigation.

The listing of metrics inside an Insight

Initially, you may see only two metrics listed, however, over time, it populates more metrics that showed anomalies. You can see the anomaly for DynamoDB started earlier than the anomalies for API Gateway and Lambda, thus indicating them as after effects. In addition to the information in the preceding screenshot, you may see Duration p90 and IntegrationLatency p90 (for Lambda and API Gateway respectively, due to increased backend latency) metrics also listed.

Now we check the Relevant events section, which lists potential triggers for the issue. The events listed here depend on the set of operations carried out on this CloudFormation stack’s resources in this Region. This makes it easy for the operator to be reminded of a change that may have caused this issue. The dots (representing events) that are near the Insight start portion of timeline are of particular interest.

Related Events shown inside the Insight

If you need to delve into any of these events, just click of any of these points, and it provides more details as shown below screenshot.

Delving into details of the related event listed in Insight

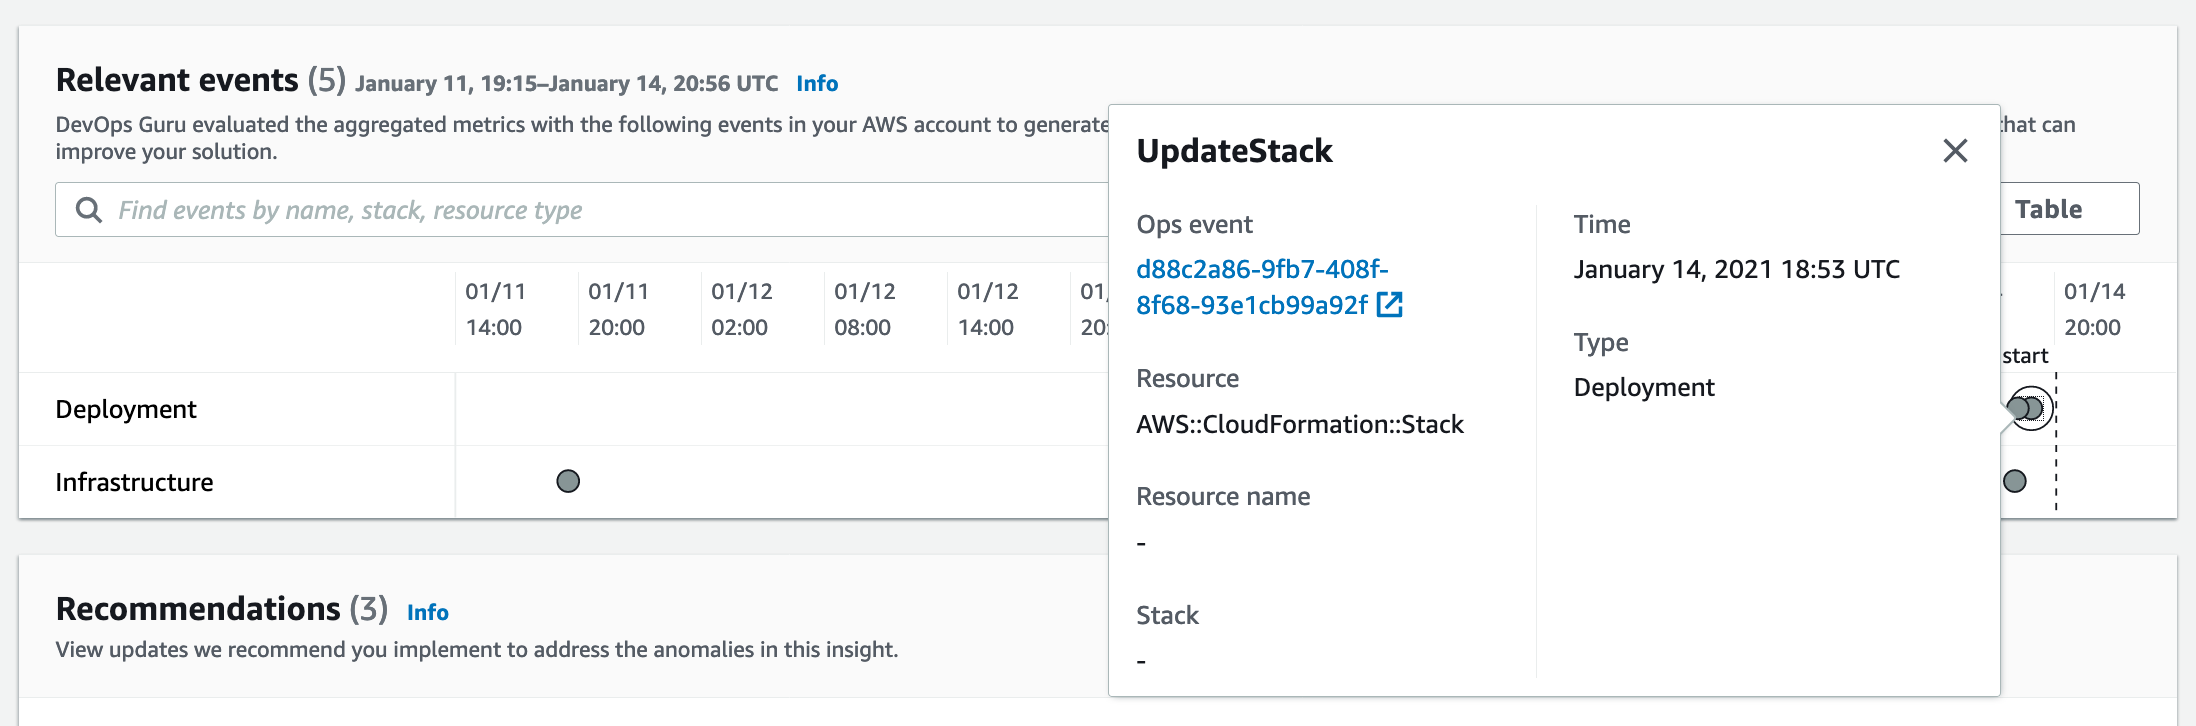
You can choose the link for an event to view specific details about the operational event (configuration change via CloudFormation update stack operation).

Now we move to the Recommendations section, which provides prescribed guidance for mitigating this anomaly. As seen in the following screenshot, it recommends to roll back the configuration change related to the read capacity for the DynamoDB table. It also lists specific metrics and the event as part of the recommendation for reference.

Recommendations provided inside the Insight

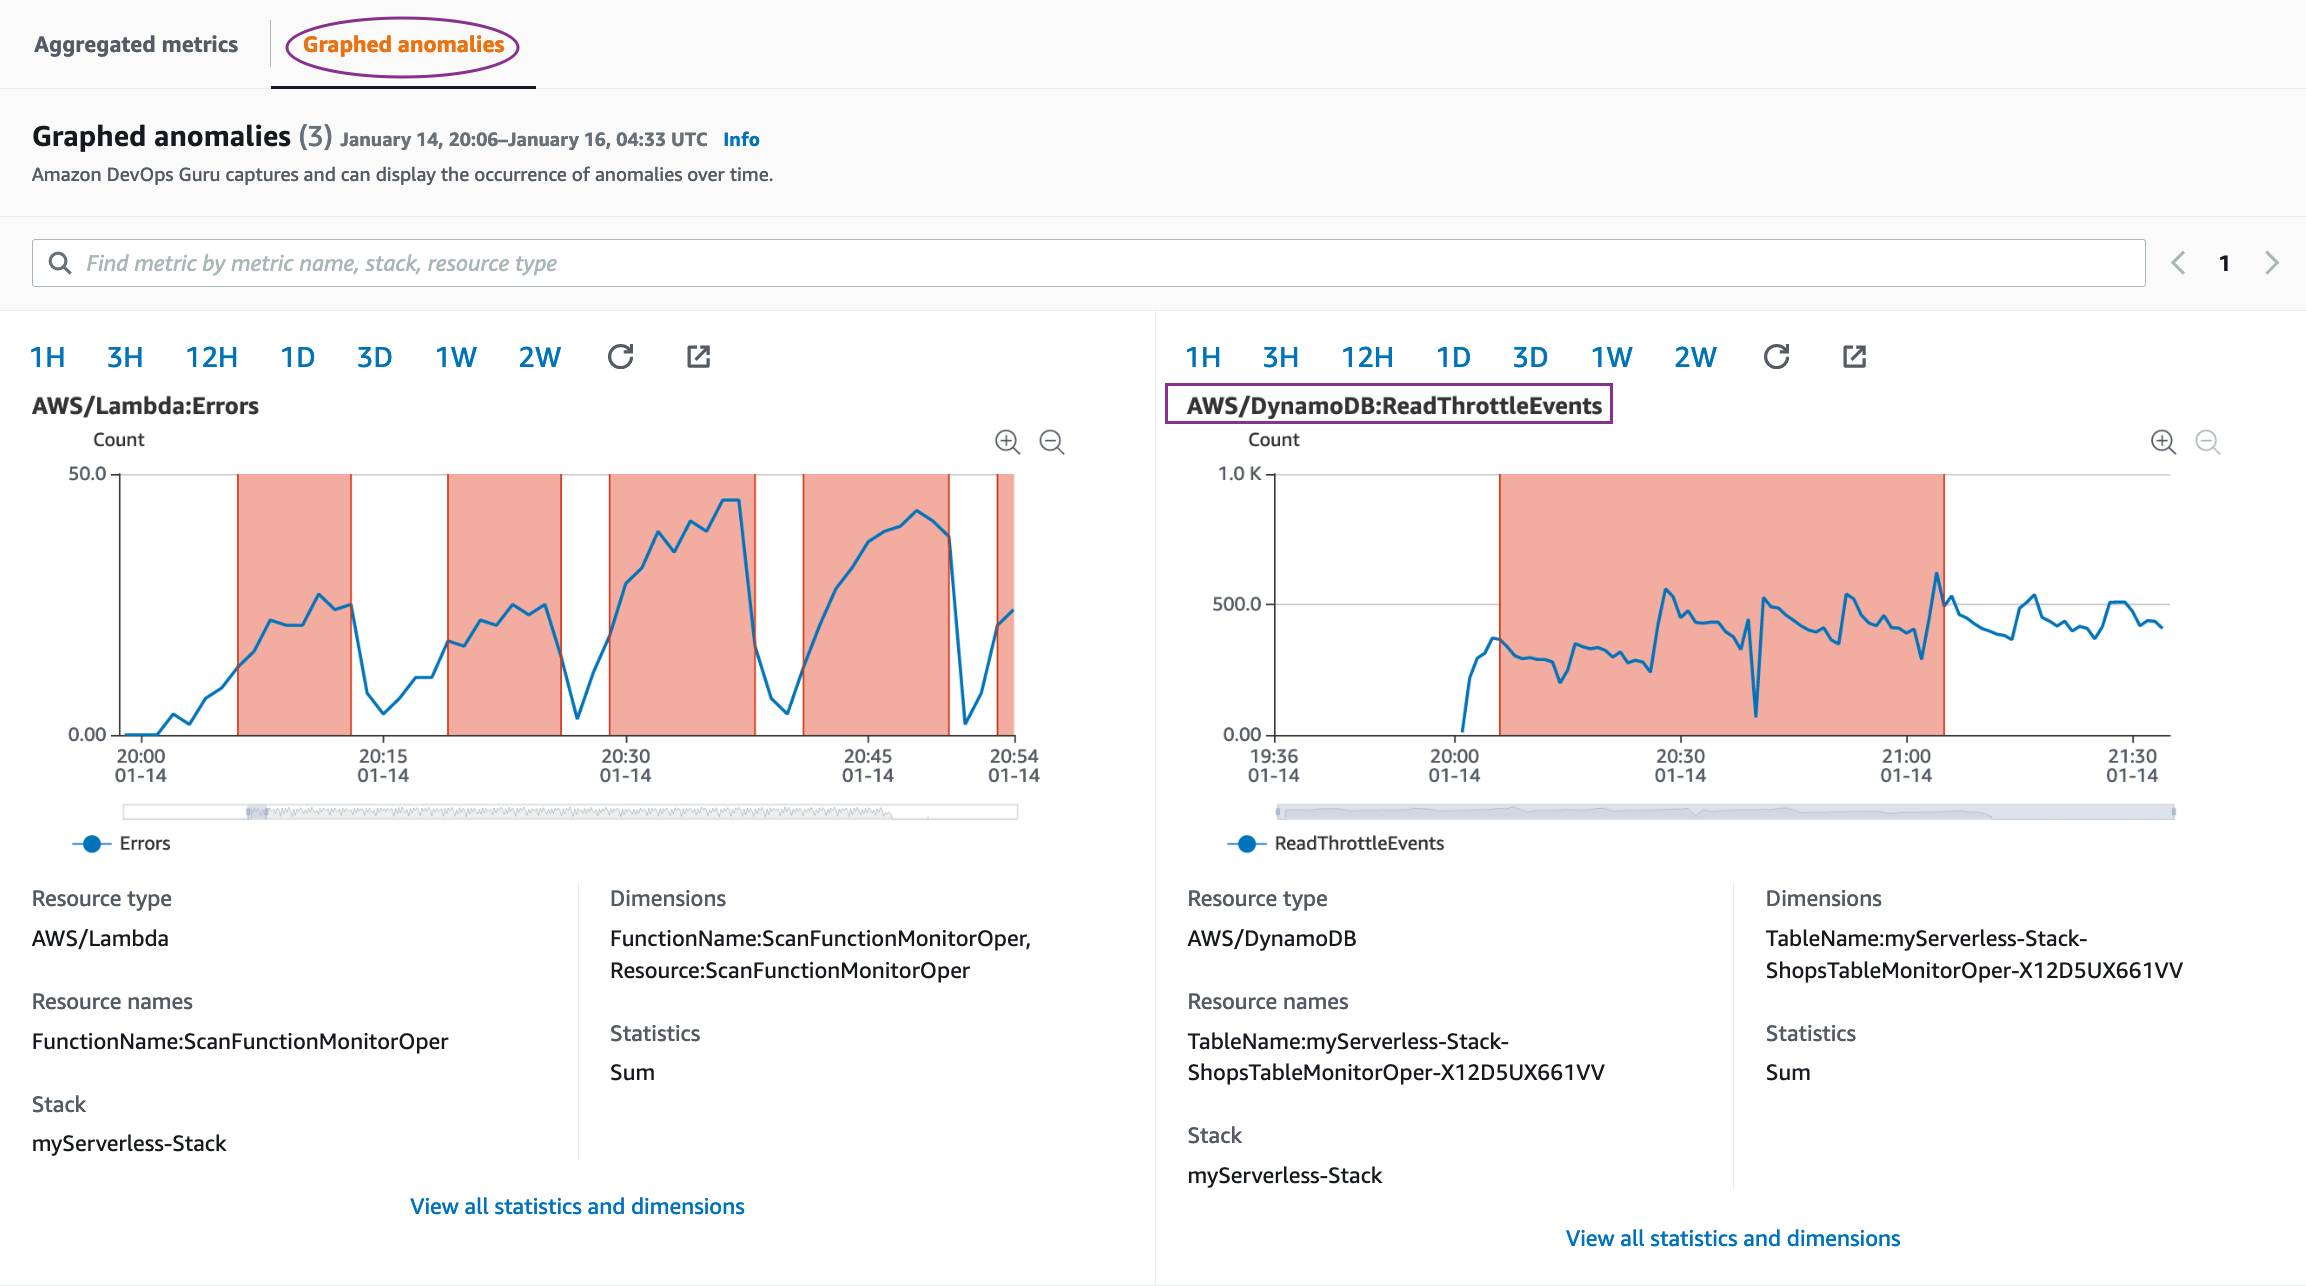
Going back to the metric section of the insight, when we select Graphed anomalies, it shows you the graphs of all related resources. Below screenshot shows a snippet showing anomaly for DynamoDB ReadThrottleEvents metrics. As seen in the below screenshot of the graph pattern, the read operations on the table are exceeding the provisioned throughput of read capacity. This clearly indicates an anomaly.

Graphed anomalies in DevOps Guru

Let’s navigate to the DynamoDB table and check our table configuration. Checking the table properties, we notice that our read capacity is reduced to 1. This is our root cause that led to this anomaly.

Checking the DynamoDB table capacity settings

If we change it to 5, we fix this anomaly. Alternatively, if the traffic is stopped, the anomaly moves to a Resolved state.

The ongoing reactive insight takes a few minutes after resolution to move to a Closed state.

Note: When the insight is active, you may see more metrics get populated over time as we detect further anomalies. When carrying out the preceding tests, if you don’t see all the metrics as listed in the screenshots, you may have to wait longer.


Injecting another failure to generate a new DevOps Guru insight

Let’s create a new failure and generate an insight for that.

1.   After you close the insight from the previous section, trigger the HTTP traffic generation loop from the AWS Cloud9 terminal.

We modify the Lambda functions’s resource-based policy by removing the permissions for API Gateway to access this function.

2.   On the Lambda console, open the function ScanFunctionMonitorOper.

3.   On the Permissions tab, access the policy.

Accessing the permissions tab for the Lambda


4.   Save a copy of the policy offline as a backup before making any changes.

5.   Note down the “Sid” values for the “AWS:SourceArn” that ends with prod/*/ and prod/*/*.

Checking the Resource-based policy for the Lambda

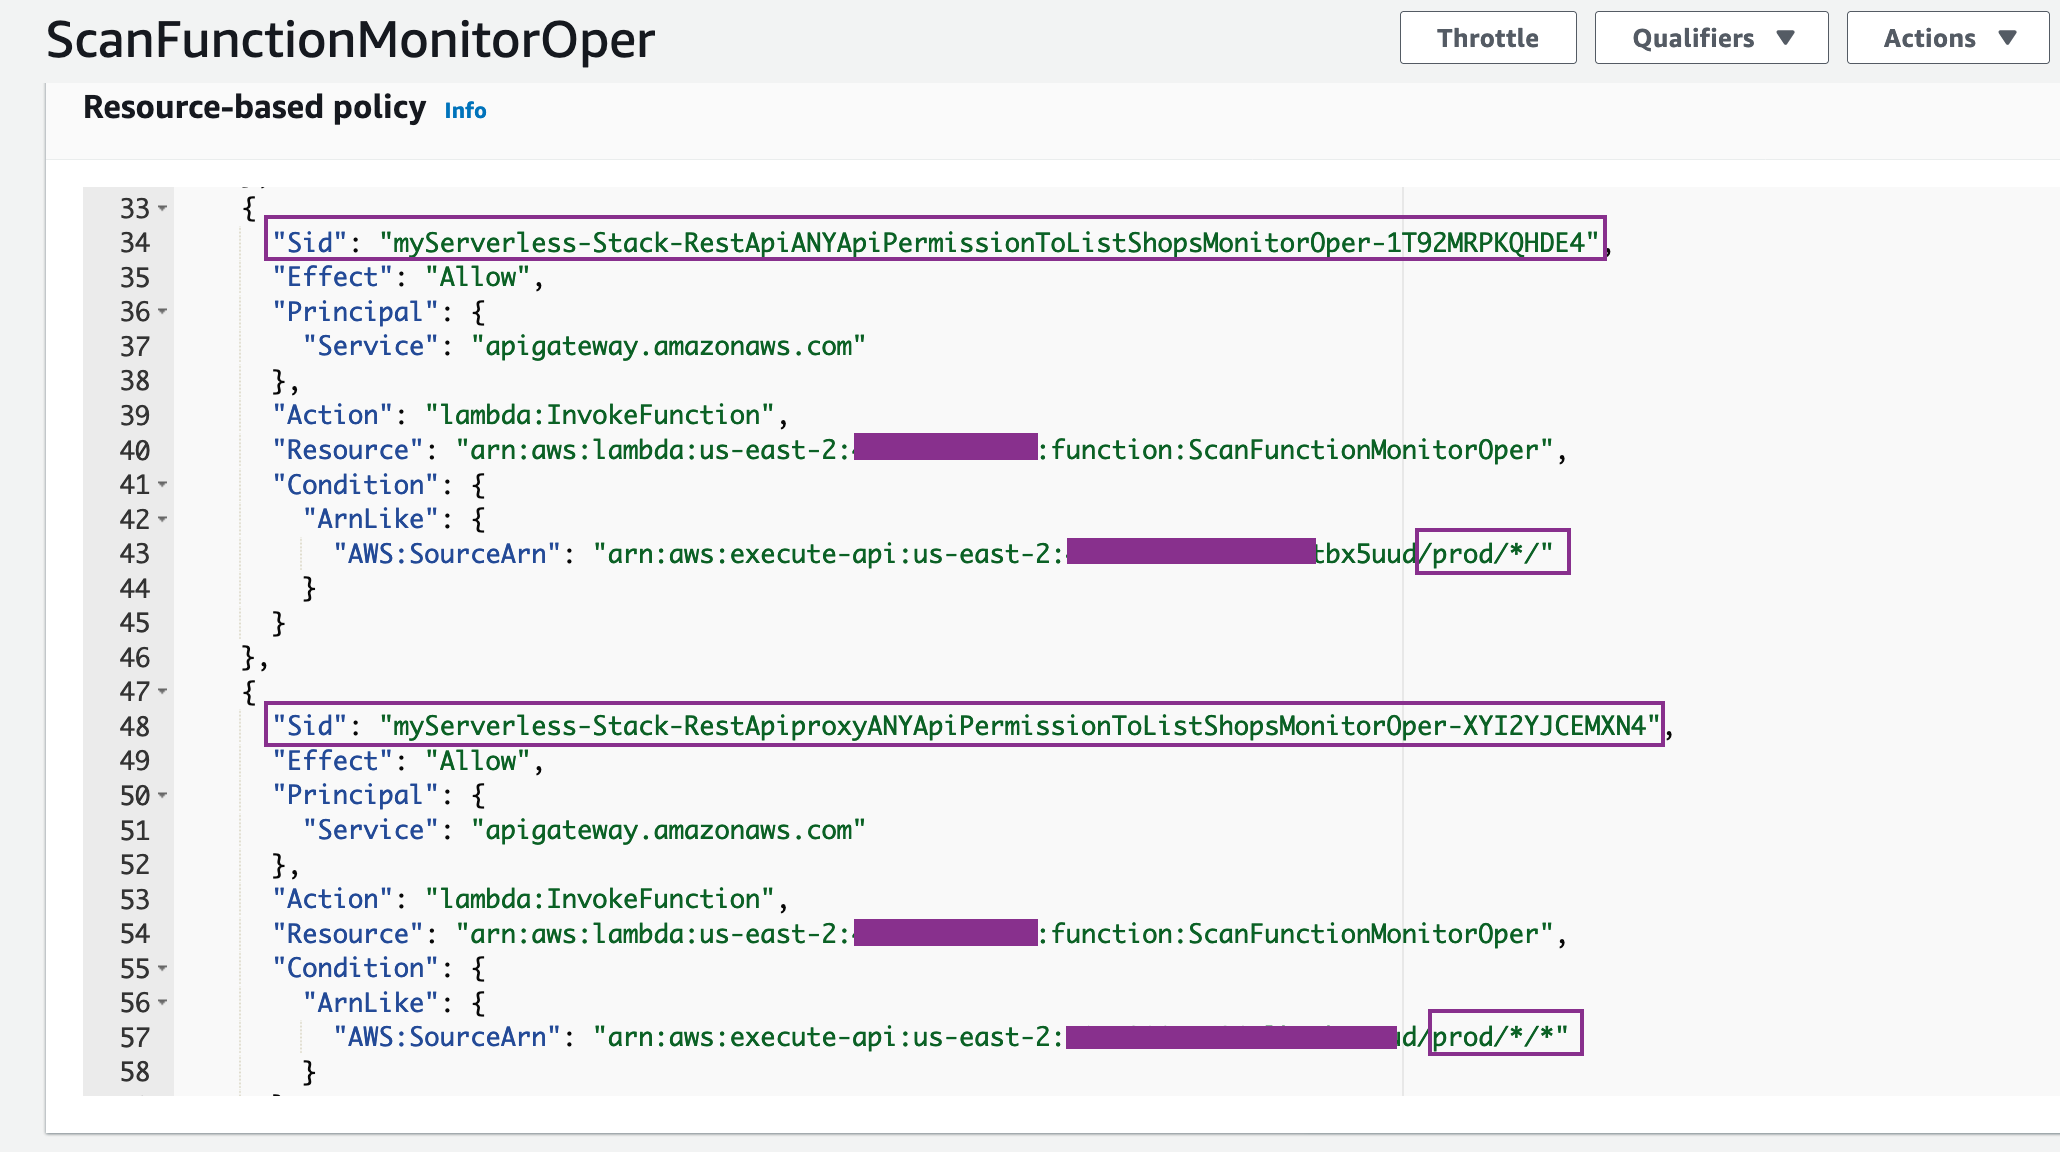
6.   Run the following command to remove the “Sid” JSON statements in your Cloud9 terminal:

aws lambda remove-permission --function-name ScanFunctionMonitorOper \
--statement-id <Sid-value-ending-with-prod/*/>

7.   Run the same command for the second Sid value:

aws lambda remove-permission --function-name ScanFunctionMonitorOper \
--statement-id <Sid-value-ending-with-prod/*/*>

You should see several 5XX errors, as in the following screenshot.

Terminal output now showing 500 errors for the script output

After less than 8 minutes, you should see a new ongoing reactive insight on the DevOps Guru dashboard.

Let’s take a closer look at the insight. The following screenshot shows the anomalous metric 5XXError Average of API Gateway and its duration. (This insight shows as closed because I had already restored permissions.)

Insight showing 5XX errors for API-Gateway and link to OpsItem

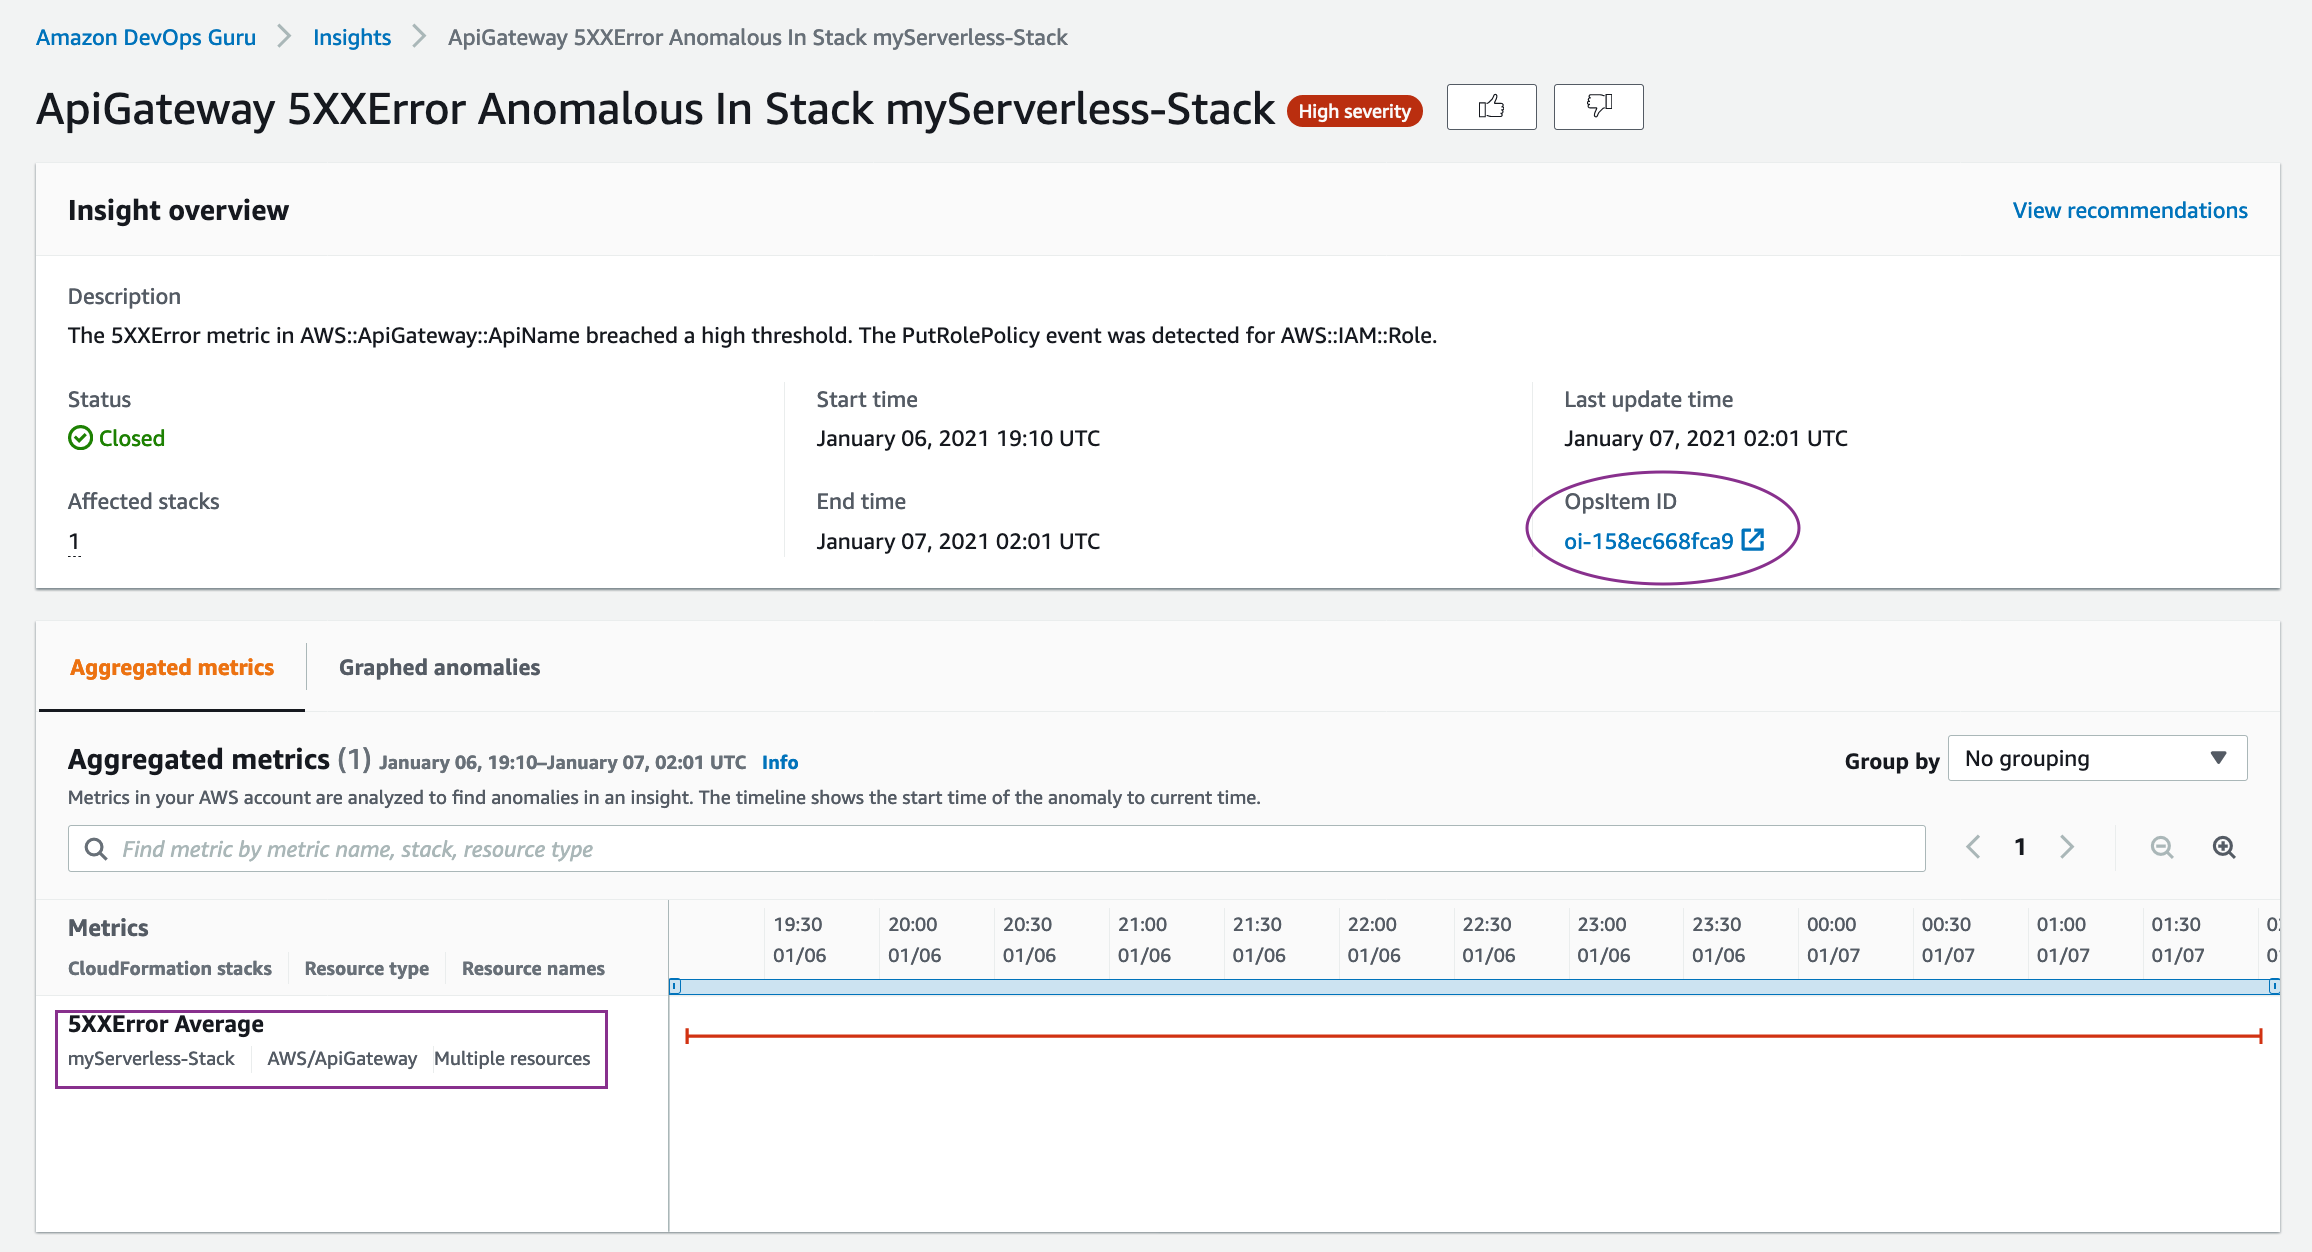
If you have configured to enable creating OpsItem in Systems Manager, you would see the link to OpsItem ID created in the insight, as shown above. This is an optional configuration, which will enable you to track the insights in the form of open tickets (OpsItems) in Systems Manager OpsCenter.

The recommendations provide guidance based upon the related events and anomalous metrics.

After the insight has been generated, reviewed, and verified, restore the permissions by running the following command:

aws lambda add-permission --function-name ScanFunctionMonitorOper  \
--statement-id APIGatewayProdPerm --action lambda:InvokeFunction \
--principal apigateway.amazonaws.com

If needed, you can insert the condition to point to the API Gateway ARN to allow only specific API Gateways to access the Lambda function.


Cleaning up

After you walk through this post, you should clean up and un-provision the resources to avoid incurring any further charges.

1.   To un-provision the CloudFormation stacks, on the AWS CloudFormation console, choose Stacks.

2.   Select each stack (EnableDevOpsGuruForServerlessCfnStack and myServerless-Stack) and choose Delete.

3.   Check to confirm that the DynamoDB table created with the stacks is cleaned up. If not, delete the table manually.

4.   Un-provision the AWS Cloud9 environment.


Conclusion

This post reviewed how DevOps Guru can continuously monitor the resources in your AWS account in a typical production environment. When it detects an anomaly, it generates an insight, which includes the vended CloudWatch metrics that breached the threshold, the CloudFormation stack in which the resource existed, relevant events that could be potential triggers, and actionable recommendations to mitigate the condition.

DevOps Guru generates insights that are relevant to you based upon the pre-trained machine-learning models, removing the undifferentiated heavy lifting of manually monitoring several events, metrics, and trends.

I hope this post was useful to you and that you would consider DevOps Guru for your production needs.


Easily configure Amazon DevOps Guru across multiple accounts and Regions using AWS CloudFormation StackSets

Post Syndicated from Nikunj Vaidya original https://aws.amazon.com/blogs/devops/configure-devops-guru-multiple-accounts-regions-using-cfn-stacksets/

As applications become increasingly distributed and complex, operators need more automated practices to maintain application availability and reduce the time and effort spent on detecting, debugging, and resolving operational issues.

Enter Amazon DevOps Guru (preview).

Amazon DevOps Guru is a machine learning (ML) powered service that gives you a simpler way to improve an application’s availability and reduce expensive downtime. Without involving any complex configuration setup, DevOps Guru automatically ingests operational data in your AWS Cloud. When DevOps Guru identifies a critical issue, it automatically alerts you with a summary of related anomalies, the likely root cause, and context on when and where the issue occurred. DevOps Guru also, when possible, provides prescriptive recommendations on how to remediate the issue.

Using Amazon DevOps Guru is easy and doesn’t require you to have any ML expertise. To get started, you need to configure DevOps Guru and specify which AWS resources to analyze. If your applications are distributed across multiple AWS accounts and AWS Regions, you need to configure DevOps Guru for each account-Region combination. Though this may sound complex, it’s in fact very simple to do so using AWS CloudFormation StackSets. This post walks you through the steps to configure DevOps Guru across multiple AWS accounts or organizational units, using AWS CloudFormation StackSets.


Solution overview

The goal of this post is to provide you with sample templates to facilitate onboarding Amazon DevOps Guru across multiple AWS accounts. Instead of logging into each account and enabling DevOps Guru, you use AWS CloudFormation StackSets from the primary account to enable DevOps Guru across multiple accounts in a single AWS CloudFormation operation. When it’s enabled, DevOps Guru monitors your associated resources and provides you with detailed insights for anomalous behavior along with intelligent recommendations to mitigate and incorporate preventive measures.

We consider various options in this post for enabling Amazon DevOps Guru across multiple accounts and Regions:

  • All resources across multiple accounts and Regions
  • Resources from specific CloudFormation stacks across multiple accounts and Regions
  • For All resources in an organizational unit

In the following diagram, we launch the AWS CloudFormation StackSet from a primary account to enable Amazon DevOps Guru across two AWS accounts and carry out operations to generate insights. The StackSet uses a single CloudFormation template to configure DevOps Guru, and deploys it across multiple accounts and regions, as specified in the command.

Figure: Shows enabling of DevOps Guru using CloudFormation StackSets

Figure: Shows enabling of DevOps Guru using CloudFormation StackSets

When Amazon DevOps Guru is enabled to monitor your resources within the account, it uses a combination of vended Amazon CloudWatch metrics, AWS CloudTrail logs, and specific patterns from its ML models to detect an anomaly. When the anomaly is detected, it generates an insight with the recommendations.

Figure: Shows DevOps Guru generating Insights based upon ingested metrics

Figure: Shows DevOps Guru monitoring the resources and generating insights for anomalies detected


Prerequisites

To complete this post, you should have the following prerequisites:

  • Two AWS accounts. For this post, we use the account numbers 111111111111 (primary account) and 222222222222. We will carry out the CloudFormation operations and monitoring of the stacks from this primary account.
  • To use organizations instead of individual accounts, identify the organization unit (OU) ID that contains at least one AWS account.
  • Access to a bash environment, either using an AWS Cloud9 environment or your local terminal with the AWS Command Line Interface (AWS CLI) installed.
  • AWS Identity and Access Management (IAM) roles for AWS CloudFormation StackSets.
  • Knowledge of CloudFormation StackSets


(a) Using an AWS Cloud9 environment or AWS CLI terminal
We recommend using AWS Cloud9 to create an environment to get access to the AWS CLI from a bash terminal. Make sure you select Linux2 as the operating system for the AWS Cloud9 environment.

Alternatively, you may use your bash terminal in your favorite IDE and configure your AWS credentials in your terminal.

(b) Creating IAM roles

If you are using Organizations for account management, you would not need to create the IAM roles manually and instead use Organization based trusted access and SLRs. You may skip the sections (b), (c) and (d). If not using Organizations, please read further.

Before you can deploy AWS CloudFormation StackSets, you must have the following IAM roles:

  • AWSCloudFormationStackSetAdministrationRole
  • AWSCloudFormationStackSetExecutionRole

The IAM role AWSCloudFormationStackSetAdministrationRole should be created in the primary account whereas AWSCloudFormationStackSetExecutionRole role should be created in all the accounts where you would like to run the StackSets.

If you’re already using AWS CloudFormation StackSets, you should already have these roles in place. If not, complete the following steps to provision these roles.

(c) Creating the AWSCloudFormationStackSetAdministrationRole role
To create the AWSCloudFormationStackSetAdministrationRole role, sign in to your primary AWS account and go to the AWS Cloud9 terminal.

Execute the following command to download the file:

curl -O https://s3.amazonaws.com/cloudformation-stackset-sample-templates-us-east-1/AWSCloudFormationStackSetAdministrationRole.yml

Execute the following command to create the stack:

aws cloudformation create-stack \
--stack-name AdminRole \
--template-body file:///$PWD/AWSCloudFormationStackSetAdministrationRole.yml \
--capabilities CAPABILITY_NAMED_IAM \
--region us-east-1

(d) Creating the AWSCloudFormationStackSetExecutionRole role
You now create the role AWSCloudFormationStackSetExecutionRole in the primary account and other target accounts where you want to enable DevOps Guru. For this post, we create it for our two accounts and two Regions (us-east-1 and us-east-2).

Execute the following command to download the file:

curl -O https://s3.amazonaws.com/cloudformation-stackset-sample-templates-us-east-1/AWSCloudFormationStackSetExecutionRole.yml

Execute the following command to create the stack:

aws cloudformation create-stack \
--stack-name ExecutionRole \
--template-body file:///$PWD/AWSCloudFormationStackSetExecutionRole.yml \
--parameters ParameterKey=AdministratorAccountId,ParameterValue=111111111111 \
--capabilities CAPABILITY_NAMED_IAM \
--region us-east-1

Now that the roles are provisioned, you can use AWS CloudFormation StackSets in the next section.


Running AWS CloudFormation StackSets to enable DevOps Guru

With the required IAM roles in place, now you can deploy the stack sets to enable DevOps Guru across multiple accounts.

As a first step, go to your bash terminal and clone the GitHub repository to access the CloudFormation templates:

git clone https://github.com/aws-samples/amazon-devopsguru-samples
cd amazon-devopsguru-samples/enable-devopsguru-stacksets


(a) Configuring Amazon SNS topics for DevOps Guru to send notifications for operational insights

If you want to receive notifications for operational insights generated by Amazon DevOps Guru, you need to configure an Amazon Simple Notification Service (Amazon SNS) topic across multiple accounts. If you have already configured SNS topics and want to use them, identify the topic name and directly skip to the step to enable DevOps Guru.

Note for Central notification target: You may prefer to configure an SNS Topic in the central AWS account so that all Insight notifications are sent to a single target. In such a case, you would need to modify the central account SNS topic policy to allow other accounts to send notifications.

To create your stack set, enter the following command (provide an email for receiving insights):

aws cloudformation create-stack-set \
--stack-set-name CreateDevOpsGuruTopic \
--template-body file:///$PWD/CreateSNSTopic.yml \
--parameters ParameterKey=EmailAddress,ParameterValue=<[email protected]> \
--region us-east-1

Instantiate AWS CloudFormation StackSets instances across multiple accounts and multiple Regions (provide your account numbers and Regions as needed):

aws cloudformation create-stack-instances \
--stack-set-name CreateDevOpsGuruTopic \
--accounts '["111111111111","222222222222"]' \
--regions '["us-east-1","us-east-2"]' \
--operation-preferences FailureToleranceCount=0,MaxConcurrentCount=1

After running this command, the SNS topic devops-guru is created across both the accounts. Go to the email address specified and confirm the subscription by clicking the Confirm subscription link in each of the emails that you receive. Your SNS topic is now fully configured for DevOps Guru to use.

Figure: Shows creation of SNS topic to receive insights from DevOps Guru

Figure: Shows creation of SNS topic to receive insights from DevOps Guru


(b) Enabling DevOps Guru

Let us first examine the CloudFormation template format to enable DevOps Guru and configure it to send notifications over SNS topics. See the following code snippet:

Resources:
  DevOpsGuruMonitoring:
    Type: AWS::DevOpsGuru::ResourceCollection
    Properties:
      ResourceCollectionFilter:
        CloudFormation:
          StackNames: *

  DevOpsGuruNotification:
    Type: AWS::DevOpsGuru::NotificationChannel
    Properties:
      Config:
        Sns:
          TopicArn: arn:aws:sns:us-east-1:111111111111:SnsTopic


When the StackNames property is fed with a value of *, it enables DevOps Guru for all CloudFormation stacks. However, you can enable DevOps Guru for only specific CloudFormation stacks by providing the desired stack names as shown in the following code:


Resources:
  DevOpsGuruMonitoring:
    Type: AWS::DevOpsGuru::ResourceCollection
    Properties:
      ResourceCollectionFilter:
        CloudFormation:
          StackNames:
          - StackA
          - StackB


For the CloudFormation template in this post, we provide the names of the stacks using the parameter inputs. To enable the AWS CLI to accept a list of inputs, we need to configure the input type as CommaDelimitedList, instead of a base string. We also provide the parameter SnsTopicName, which the template substitutes into the TopicArn property.

See the following code:

AWSTemplateFormatVersion: 2010-09-09
Description: Enable Amazon DevOps Guru

Parameters:
  CfnStackNames:
    Type: CommaDelimitedList
    Description: Comma separated names of the CloudFormation Stacks for DevOps Guru to analyze.
    Default: "*"

  SnsTopicName:
    Type: String
    Description: Name of SNS Topic

Resources:
  DevOpsGuruMonitoring:
    Type: AWS::DevOpsGuru::ResourceCollection
    Properties:
      ResourceCollectionFilter:
        CloudFormation:
          StackNames: !Ref CfnStackNames

  DevOpsGuruNotification:
    Type: AWS::DevOpsGuru::NotificationChannel
    Properties:
      Config:
        Sns:
          TopicArn: !Sub arn:aws:sns:${AWS::Region}:${AWS::AccountId}:${SnsTopicName}


Now that we reviewed the CloudFormation syntax, we will use this template to implement the solution. For this post, we will consider three use cases for enabling Amazon DevOps Guru:

(i) For all resources across multiple accounts and Regions

(ii) For all resources from specific CloudFormation stacks across multiple accounts and Regions

(iii) For all resources in an organization

Let us review each of the above points in detail.

(i) Enabling DevOps Guru for all resources across multiple accounts and Regions

Note: Carry out the following steps in your primary AWS account.

You can use the CloudFormation template (EnableDevOpsGuruForAccount.yml) from the current directory, create a stack set, and then instantiate AWS CloudFormation StackSets instances across desired accounts and Regions.

The following command creates the stack set:

aws cloudformation create-stack-set \
--stack-set-name EnableDevOpsGuruForAccount \
--template-body file:///$PWD/EnableDevOpsGuruForAccount.yml \
--parameters ParameterKey=CfnStackNames,ParameterValue=* \
ParameterKey=SnsTopicName,ParameterValue=devops-guru \
--region us-east-1

The following command instantiates AWS CloudFormation StackSets instances across multiple accounts and Regions:

aws cloudformation create-stack-instances \
--stack-set-name EnableDevOpsGuruForAccount \
--accounts '["111111111111","222222222222"]' \
--regions '["us-east-1","us-east-2"]' \
--operation-preferences FailureToleranceCount=0,MaxConcurrentCount=1


The following screenshot of the AWS CloudFormation console in the primary account running StackSet, shows the stack set deployed in both accounts.

Figure: Screenshot for deployed StackSet and Stack instances

Figure: Screenshot for deployed StackSet and Stack instances


The following screenshot of the Amazon DevOps Guru console shows DevOps Guru is enabled to monitor all CloudFormation stacks.

Figure: Screenshot of DevOps Guru dashboard showing DevOps Guru enabled for all CloudFormation stacks

Figure: Screenshot of DevOps Guru dashboard showing DevOps Guru enabled for all CloudFormation stacks


(ii) Enabling DevOps Guru for specific CloudFormation stacks for individual accounts

Note: Carry out the following steps in your primary AWS account

In this use case, we want to enable Amazon DevOps Guru only for specific CloudFormation stacks for individual accounts. We use the AWS CloudFormation StackSets override parameters feature to rerun the stack set with specific values for CloudFormation stack names as parameter inputs. For more information, see Override parameters on stack instances.

If you haven’t created the stack instances for individual accounts, use the create-stack-instances AWS CLI command and pass the parameter overrides. If you have already created stack instances, update the existing stack instances using update-stack-instances and pass the parameter overrides. Replace the required account number, Regions, and stack names as needed.

In account 111111111111, create instances with the parameter override with the following command, where CloudFormation stacks STACK-NAME-1 and STACK-NAME-2 belong to this account in us-east-1 Region:

aws cloudformation create-stack-instances \
--stack-set-name  EnableDevOpsGuruForAccount \
--accounts '["111111111111"]' \
--parameter-overrides ParameterKey=CfnStackNames,ParameterValue=\"<STACK-NAME-1>,<STACK-NAME-2>\" \
--regions '["us-east-1"]' \
--operation-preferences FailureToleranceCount=0,MaxConcurrentCount=1

Update the instances with the following command:

aws cloudformation update-stack-instances \
--stack-set-name EnableDevOpsGuruForAccount \
--accounts '["111111111111"]' \
--parameter-overrides ParameterKey=CfnStackNames,ParameterValue=\"<STACK-NAME-1>,<STACK-NAME-2>\" \
--regions '["us-east-1"]' \
--operation-preferences FailureToleranceCount=0,MaxConcurrentCount=1


In account 222222222222, create instances with the parameter override with the following command, where CloudFormation stacks STACK-NAME-A and STACK-NAME-B belong to this account in the us-east-1 Region:

aws cloudformation create-stack-instances \
--stack-set-name  EnableDevOpsGuruForAccount \
--accounts '["222222222222"]' \
--parameter-overrides ParameterKey=CfnStackNames,ParameterValue=\"<STACK-NAME-A>,<STACK-NAME-B>\" \
--regions '["us-east-1"]' \
--operation-preferences FailureToleranceCount=0,MaxConcurrentCount=1

Update the instances with the following command:

aws cloudformation update-stack-instances \
--stack-set-name EnableDevOpsGuruForAccount \
--accounts '["222222222222"]' \
--parameter-overrides ParameterKey=CfnStackNames,ParameterValue=\"<STACK-NAME-A>,<STACK-NAME-B>\" \
--regions '["us-east-1"]' \
--operation-preferences FailureToleranceCount=0,MaxConcurrentCount=1


The following screenshot of the DevOps Guru console shows that DevOps Guru is enabled for only two CloudFormation stacks.

Figure: Screenshot of DevOps Guru dashboard showing DevOps Guru enabled for only two CloudFormation stacks

Figure: Screenshot of DevOps Guru dashboard with DevOps Guru enabled for two CloudFormation stacks


(iii) Enabling DevOps Guru for all resources in an organization

Note: Carry out the following steps in your primary AWS account

If you’re using AWS Organizations, you can take advantage of the AWS CloudFormation StackSets feature support for Organizations. This way, you don’t need to add or remove stacks when you add or remove accounts from the organization. For more information, see New: Use AWS CloudFormation StackSets for Multiple Accounts in an AWS Organization.

The following example shows the command line using multiple Regions to demonstrate the use. Update the OU as needed. If you need to use additional Regions, you may have to create an SNS topic in those Regions too.

To create a stack set for an OU and across multiple Regions, enter the following command:

aws cloudformation create-stack-set \
--stack-set-name EnableDevOpsGuruForAccount \
--template-body file:///$PWD/EnableDevOpsGuruForAccount.yml \
--parameters ParameterKey=CfnStackNames,ParameterValue=* \
ParameterKey=SnsTopicName,ParameterValue=devops-guru \
--region us-east-1 \
--permission-model SERVICE_MANAGED \
--auto-deployment Enabled=true,RetainStacksOnAccountRemoval=true

Instantiate AWS CloudFormation StackSets instances for an OU and across multiple Regions with the following command:

aws cloudformation create-stack-instances \
--stack-set-name  EnableDevOpsGuruForAccount \
--deployment-targets OrganizationalUnitIds='["<organizational-unit-id>"]' \
--regions '["us-east-1","us-east-2"]' \
--operation-preferences FailureToleranceCount=0,MaxConcurrentCount=1

In this way, you can run CloudFormation StackSets to enable and configure DevOps Guru across multiple accounts, Regions, with simple and easy steps.


Reviewing DevOps Guru insights

Amazon DevOps Guru monitors for anomalies in the resources in the CloudFormation stacks that are enabled for monitoring. The following screenshot shows the initial dashboard.

Figure: Screenshot of DevOps Guru dashboard

Figure: Screenshot of DevOps Guru dashboard

On enabling DevOps Guru, it may take up to 24 hours to analyze the resources and baseline the normal behavior. When it detects an anomaly, it highlights the impacted CloudFormation stack, logs insights that provide details about the metrics indicating an anomaly, and prints actionable recommendations to mitigate the anomaly.

Figure: Screenshot of DevOps Guru dashboard showing ongoing reactive insight

Figure: Screenshot of DevOps Guru dashboard showing ongoing reactive insight

The following screenshot shows an example of an insight (which now has been resolved) that was generated for the increased latency for an ELB. The insight provides various sections in which it provides details about the metrics, the graphed anomaly along with the time duration, potential related events, and recommendations to mitigate and implement preventive measures.

Figure: Screenshot for an Insight generated about ELB Latency

Figure: Screenshot for an Insight generated about ELB Latency


Cleaning up

When you’re finished walking through this post, you should clean up or un-provision the resources to avoid incurring any further charges.

  1. On the AWS CloudFormation StackSets console, choose the stack set to delete.
  2. On the Actions menu, choose Delete stacks from StackSets.
  3. After you delete the stacks from individual accounts, delete the stack set by choosing Delete StackSet.
  4. Un-provision the environment for AWS Cloud9.


Conclusion

This post reviewed how to enable Amazon DevOps Guru using AWS CloudFormation StackSets across multiple AWS accounts or organizations to monitor the resources in existing CloudFormation stacks. Upon detecting an anomaly, DevOps Guru generates an insight that includes the vended CloudWatch metric, the CloudFormation stack in which the resource existed, and actionable recommendations.

We hope this post was useful to you to onboard DevOps Guru and that you try using it for your production needs.


About the Authors

Author's profile photo


Nikunj Vaidya is a Sr. Solutions Architect with Amazon Web Services, focusing in the area of DevOps services. He builds technical content for the field enablement and offers technical guidance to the customers on AWS DevOps solutions and services that would streamline the application development process, accelerate application delivery, and enable maintaining a high bar of software quality.


Nuatu Tseggai is a Cloud Infrastructure Architect at Amazon Web Services. He enjoys working with customers to design and build event-driven distributed systems that span multiple services.


Incorporating security in code-reviews using Amazon CodeGuru Reviewer

Post Syndicated from Nikunj Vaidya original https://aws.amazon.com/blogs/devops/incorporating-security-in-code-reviews-using-amazon-codeguru-reviewer/

Today, software development practices are constantly evolving to empower developers with tools to maintain a high bar of code quality. Amazon CodeGuru Reviewer offers this capability by carrying out automated code-reviews for developers, based on the trained machine learning models that can detect complex defects and providing intelligent actionable recommendations to mitigate those defects. A quick overview of CodeGuru is covered in this blog post.

Security analysis is a critical part of a code review and CodeGuru Reviewer offers this capability with a new set of security detectors. These security detectors introduced in CodeGuru Reviewer are geared towards identifying security risks from the top 10 OWASP categories and ensures that your code follows best practices for AWS Key Management Service (AWS KMS), Amazon Elastic Compute Cloud (Amazon EC2) API, and common Java crypto and TLS/SSL libraries. As of today, CodeGuru security analysis supports Java language, thus we will take an example of a Java application.

In this post, we will walk through the on-boarding workflow to carry out the security analysis of the code repository and generate recommendations for a Java application.


Security workflow overview:

The new security workflow, introduced for CodeGuru reviewer, utilizes the source code and build artifacts to generate recommendations. The security detector evaluates build artifacts to generate security-related recommendations whereas other detectors continue to scan the source code to generate recommendations. With the use of build artifacts for evaluation, the detector can carry out a whole-program inter-procedural analysis to discover issues that are caused across your code (e.g., hardcoded credentials in one file that are passed to an API in another) and can reduce false-positives by checking if an execution path is valid or not. You must provide the source code .zip file as well as the build artifact .zip file for a complete analysis.

Customers can run a security scan when they create a repository analysis. CodeGuru Reviewer provides an additional option to get both code and security recommendations. As explained in the following sections, CodeGuru Reviewer will create an Amazon Simple Storage Service (Amazon S3) bucket in your AWS account for that region to upload or copy your source code and build artifacts for the analysis. This repository analysis option can be run on Java code from any repository.


Prerequisites

Prepare the source code and artifact zip files: If you do not have your Java code locally, download the source code that you want to evaluate for security and zip it. Similarly, if needed, download the build artifact .jar file for your source code and zip it. It will be required to upload the source code and build artifact as separate .zip files as per the instructions in subsequent sections. Thus even if it is a single file (eg. single .jar file), you will still need to zip it. Even if the .zip file includes multiple files, the right files will be discovered and analyzed by CodeGuru. For our sample test, we will use src.zip and jar.zip file, saved locally.

Creating an S3 bucket repository association:

This section summarizes the high-level steps to create the association of your S3 bucket repository.

1. On the CodeGuru console, choose Code reviews.

2. On the Repository analysis tab, choose Create repository analysis.

Screenshot of initiating the repository analysis

Figure: Screenshot of initiating the repository analysis


3. For the source code analysis, select Code and security recommendations.

4. For Repository name, enter a name for your repository.

5. Under Additional settings, for Code review name, enter a name for trackability purposes.

6. Choose Create S3 bucket and associate.

Screenshot to show selection of Security Code Analysis

Figure: Screenshot to show selection of Security Code Analysis

It takes a few seconds to create a new S3 bucket in the current Region. When it completes, you will see the below screen.

Screenshot for Create repository analysis showing S3 bucket created

Figure: Screenshot for Create repository analysis showing S3 bucket created


7. Choose Upload to the S3 bucket option and under that choose Upload source code zip file and select the zip file (src.zip) from your local machine to upload.

Screenshot of popup to upload code and artifacts from S3 bucket

Figure: Screenshot of popup to upload code and artifacts from S3 bucket


8. Similarly, choose Upload build artifacts zip file and select the zip file (jar.zip) from your local machine and upload.


Screenshot for Create repository analysis showing S3 paths populated

Figure: Screenshot for Create repository analysis showing S3 paths populated


Alternatively, you can always upload the source code and build artifacts as zip file from any of your existing S3 bucket as below.

9. Choose Browse S3 buckets for existing artifacts and upload from there as shown below:


Screenshot to upload code and artifacts from S3 bucket

Figure: Screenshot to upload code and artifacts from an existing S3 bucket


10. Now click Create repository analysis and trigger the code review.

A new pending entry is created as shown below.


Screenshot of code review in Pending state

Figure: Screenshot of code review in Pending state

After a few minutes, you would see the recommendations generate that would include security analysis too. In the below case, there are 10 recommendations generated.

Screenshot of repository analysis being completed

Figure: Screenshot of repository analysis being completed


For the subsequent code reviews, you can use the same repository and upload new files or create a new repository as shown below:


Screenshot of subsequent code review making repository selection

Figure: Screenshot of subsequent code review making repository selection


Recommendations

Apart from detecting the security risks from the top 10 OWASP categories, the security detector, detects the deep security issues by analyzing data flow across multiple methods, procedures, and files.

The recommendations generated in the area of security are labelled as Security. In the below example we see a recommendation to remove hard-coded credentials and a non-security-related recommendation about refactoring of code for better maintainability.

Screenshot of Recommendations generated

Figure: Screenshot of Recommendations generated


Below is another example of recommendations pointing out the potential resource-leak as well as a security issue pointing to a potential risk of path traversal attack.

Screenshot of deep security recommendations

Figure: More examples of deep security recommendations


As this blog is focused on on-boarding aspects, we will cover the explanation of recommendations in more detail in a separate blog.

Disassociation of Repository (optional):

The association of CodeGuru to the S3 bucket repository can be removed by following below steps. Navigate to the Repositories page, select the repository and choose Disassociate repository.

Screenshot of disassociating the S3 bucket repo with CodeGuru

Figure: Screenshot of disassociating the S3 bucket repo with CodeGuru


Conclusion

This post reviewed the support for on-boarding workflow to carry out the security analysis in CodeGuru Reviewer. We initiated a full repository analysis for the Java code using a separate UI workflow and generated recommendations.

We hope this post was useful and would enable you to conduct code analysis using Amazon CodeGuru Reviewer.


About the Author

Author's profile photo


Nikunj Vaidya is a Sr. Solutions Architect with Amazon Web Services, focusing in the area of DevOps services. He builds technical content for the field enablement and offers technical guidance to the customers on AWS DevOps solutions and services that would streamline the application development process, accelerate application delivery, and enable maintaining a high bar of software quality.