Post Syndicated from Bineesh Ravindran original https://aws.amazon.com/blogs/devops/directing_ml-powered_operational_insights_from_amazon_devops_guru_to_your_datadog_event_stream/
Amazon DevOps Guru is a fully managed AIOps service that uses machine learning (ML) to quickly identify when applications are behaving outside of their normal operating patterns and generates insights from its findings. These insights generated by DevOps Guru can be used to alert on-call teams to react to anomalies for business mission critical workloads. If you are already utilizing Datadog to automate infrastructure monitoring, application performance monitoring, and log management for real-time observability of your entire technology stack, then this blog is for you.
You might already be using Datadog for a consolidated view of your Datadog Events interface to search, analyze and filter events from many different sources in one place. Datadog Events are records of notable changes relevant for managing and troubleshooting IT Operations, such as code, deployments, service health, configuration changes and monitoring alerts.
Wherever DevOps Guru detects operational events in your AWS environment that could lead to outages, it generates insights and recommendations. These insights/recommendations are then pushed to a user specific Datadog endpoint using Datadog events API. Customers can then create dashboards, incidents, alarms or take corrective automated actions based on these insights and recommendations in Datadog.
Datadog collects and unifies all of the data streaming from these complex environments, with a 1-click integration for pulling in metrics and tags from over 90 AWS services. Companies can deploy the Datadog Agent directly on their hosts and compute instances to collect metrics with greater granularity—down to one-second resolution. And with Datadog’s out-of-the-box integration dashboards, companies get not only a high-level view into the health of their infrastructure and applications but also deeper visibility into individual services such as AWS Lambda and Amazon EKS.
This blogpost will show you how to utilize Amazon DevOps guru with Datadog to get real time insights and recommendations on their AWS Infrastructure. We will demonstrate how an insight generated by Amazon DevOps Guru for an anomaly can automatically be pushed to Datadog’s event streams which can then be used to create dashboards, create alarms and alerts to take corrective actions.
Solution Overview
When an Amazon DevOps Guru insight is created, an Amazon EventBridge rule is used to capture the insight as an event and routed to an AWS Lambda Function target. The lambda function interacts with Datadog using a REST API to push corresponding DevOps Guru events captured by Amazon EventBridge
The EventBridge rule can be customized to capture all DevOps Guru insights or narrowed down to specific insights. In this blog, we will be capturing all DevOps Guru insights and will be performing actions on Datadog for the below DevOps Guru events:
- DevOps Guru New Insight Open
- DevOps Guru New Anomaly Association
- DevOps Guru Insight Severity Upgraded
- DevOps Guru New Recommendation Created
- DevOps Guru Insight Closed

Figure 1: Amazon DevOps Guru Integration with Datadog with Amazon EventBridge and AWS.
Solution Implementation Steps
Pre-requisites
Before you deploy the solution, complete the following steps.
-
- Datadog Account Setup: We will be connecting your AWS Account with Datadog. If you do not have a Datadog account, you can request a free trial developer instance through Datadog.
- Datadog Credentials: Gather the credentials of Datadog keys that will be used to connect with AWS. Follow the steps below to create an API Key and Application Key
Add an API key or client token-
- To add a Datadog API key or client token:
- Navigate to Organization settings, then click the API keys or Client Tokens
- Click the New Key or New Client Token button, depending on which you’re creating.
- Enter a name for your key or token.
- Click Create API key or Create Client Token.
- Note down the newly generated API Key value. We will need this in later steps
-

Figure 2: Create new API Key.
Add application keys
- To add a Datadog application key, navigate to Organization Settings > Application Keys.If you have the permission to create application keys, click New Key.Note down the newly generated Application Key. We will need this in later steps
-

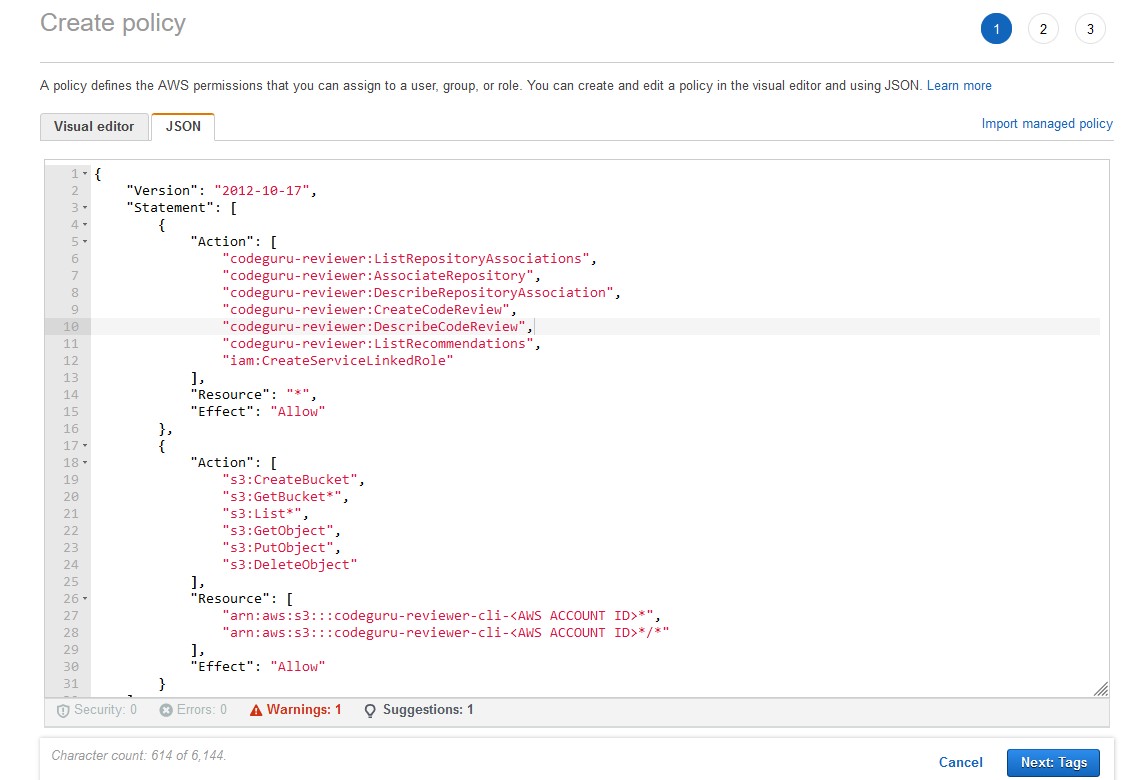
Add Application Key and API Key to AWS Secrets Manager : Secrets Manager enables you to replace hardcoded credentials in your code, including passwords, with an API call to Secrets Manager to retrieve the secret programmatically. This helps ensure the secret can’t be compromised by someone examining your code,because the secret no longer exists in the code.
Follow below steps to create a new secret in AWS Secrets Manager.
- Open the Secrets Manager console at https://console.aws.amazon.com/secretsmanager/
- Choose Store a new secret.
- On the Choose secret type page, do the following:
- For Secret type, choose other type of secret.
- In Key/value pairs, either enter your secret in Key/value
pairs

Figure 3: Create new secret in Secret Manager.
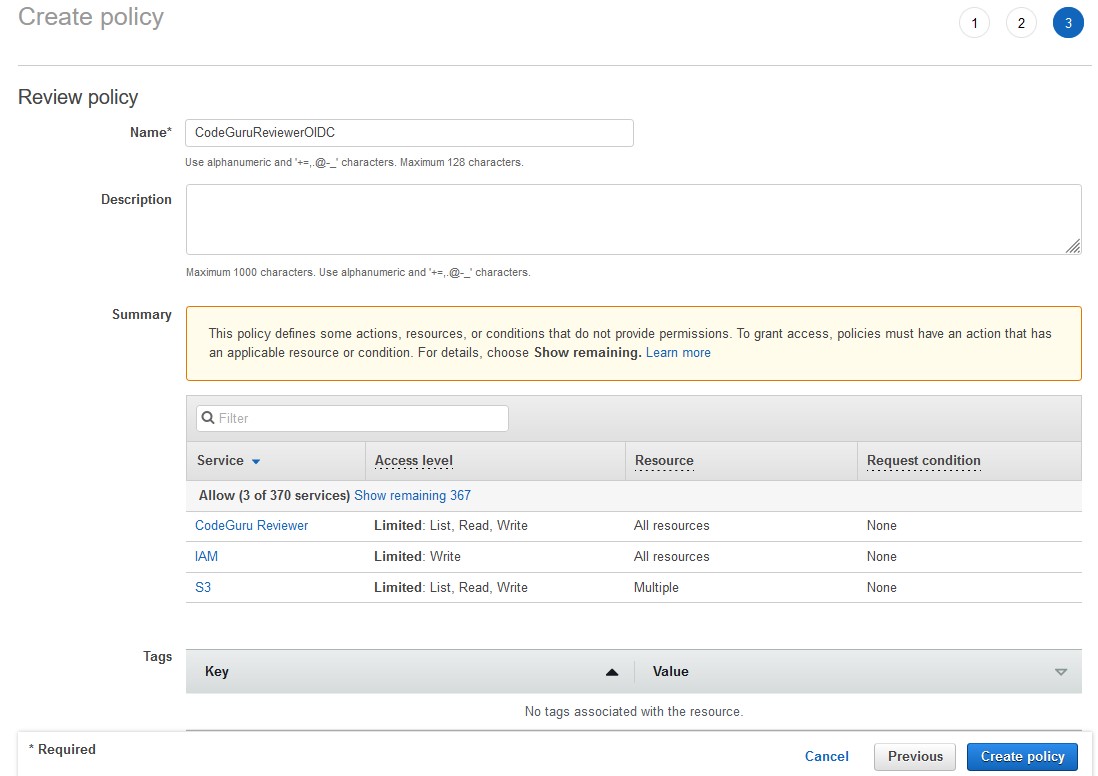
Click next and enter “DatadogSecretManager” as the secret name followed by Review and Finish

Figure 4: Configure secret in Secret Manager.
-
-
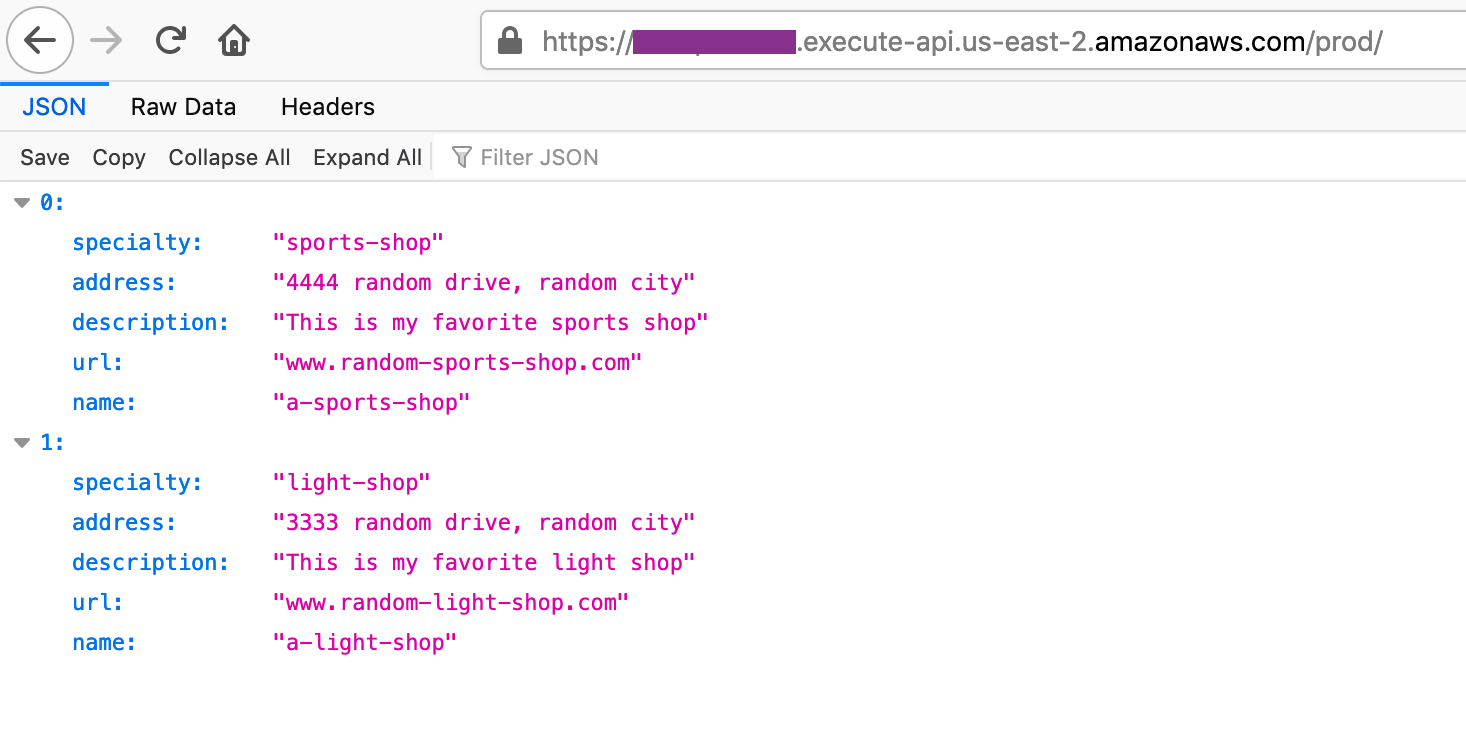
- Enable DevOps Guru for your applications by following these steps or you can follow this blog to deploy a sample serverless application that can be used to generate DevOps Guru insights for anomalies detected in the application.
- AWS Cloud9 is recommended to create an environment as AWS Serverless Application Model (SAM) CLI and AWS Command Line Interface (CLI) are pre-installed and can be accessed from a bash terminal.
- Install and set up SAM CLI – Install the SAM CLI
- Download and set up Java. The version should be matching to the runtime that you defined in the SAM template. yaml Serverless function configuration – Install the Java SE Development Kit 11
- Maven – Install Maven
-
Option 1: Deploy Datadog Connector App from AWS Serverless Repository
The DevOps Guru Datadog Connector application is available on the AWS Serverless Application Repository which is a managed repository for serverless applications. The application is packaged with an AWS Serverless Application Model (SAM) template, definition of the AWS resources used and the link to the source code. Follow the steps below to quickly deploy this serverless application in your AWS account
-
-
- Login to the AWS management console of the account to which you plan to deploy this solution.
- Go to the DevOps Guru Datadog Connector application in the AWS Serverless Repository and click on “Deploy”.
- The Lambda application deployment screen will be displayed where you can enter the Datadog Application name

Figure 5: DevOps Guru Datadog connector.

Figure 6: Serverless Application DevOps Guru Datadog connector.
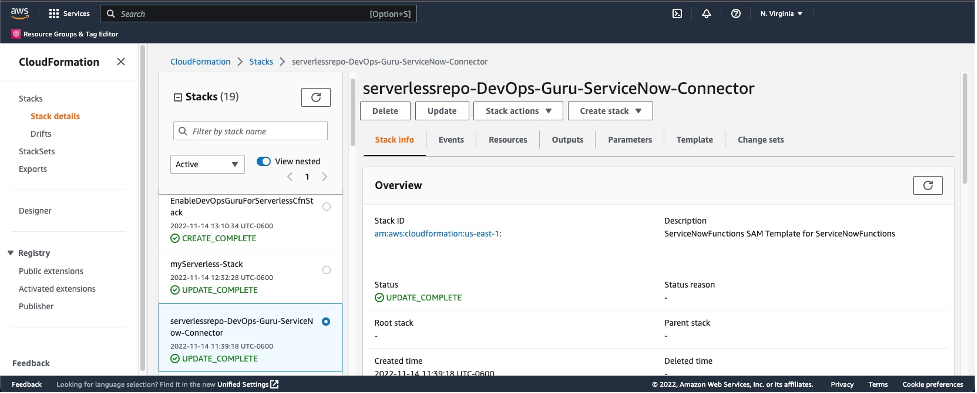
- After successful deployment the AWS Lambda Application page will display the “Create complete” status for the serverlessrepo-DevOps-Guru-Datadog-Connector application. The CloudFormation template creates four resources,
- Lambda function which has the logic to integrate to the Datadog
- Event Bridge rule for the DevOps Guru Insights
- Lambda permission
- IAM role
- Now skip Option 2 and follow the steps in the “Test the Solution” section to trigger some DevOps Guru insights/recommendations and validate that the events are created and updated in Datadog.
-


Option 2: Build and Deploy sample Datadog Connector App using AWS SAM Command Line Interface
As you have seen above, you can directly deploy the sample serverless application form the Serverless Repository with one click deployment. Alternatively, you can choose to clone the GitHub source repository and deploy using the SAM CLI from your terminal.
The Serverless Application Model Command Line Interface (SAM CLI) is an extension of the AWS CLI that adds functionality for building and testing serverless applications. The CLI provides commands that enable you to verify that AWS SAM template files are written according to the specification, invoke Lambda functions locally, step-through debug Lambda functions, package and deploy serverless applications to the AWS Cloud, and so on. For details about how to use the AWS SAM CLI, including the full AWS SAM CLI Command Reference, see AWS SAM reference – AWS Serverless Application Model.
Before you proceed, make sure you have completed the pre-requisites section in the beginning which should set up the AWS SAM CLI, Maven and Java on your local terminal. You also need to install and set up Docker to run your functions in an Amazon Linux environment that matches Lambda.
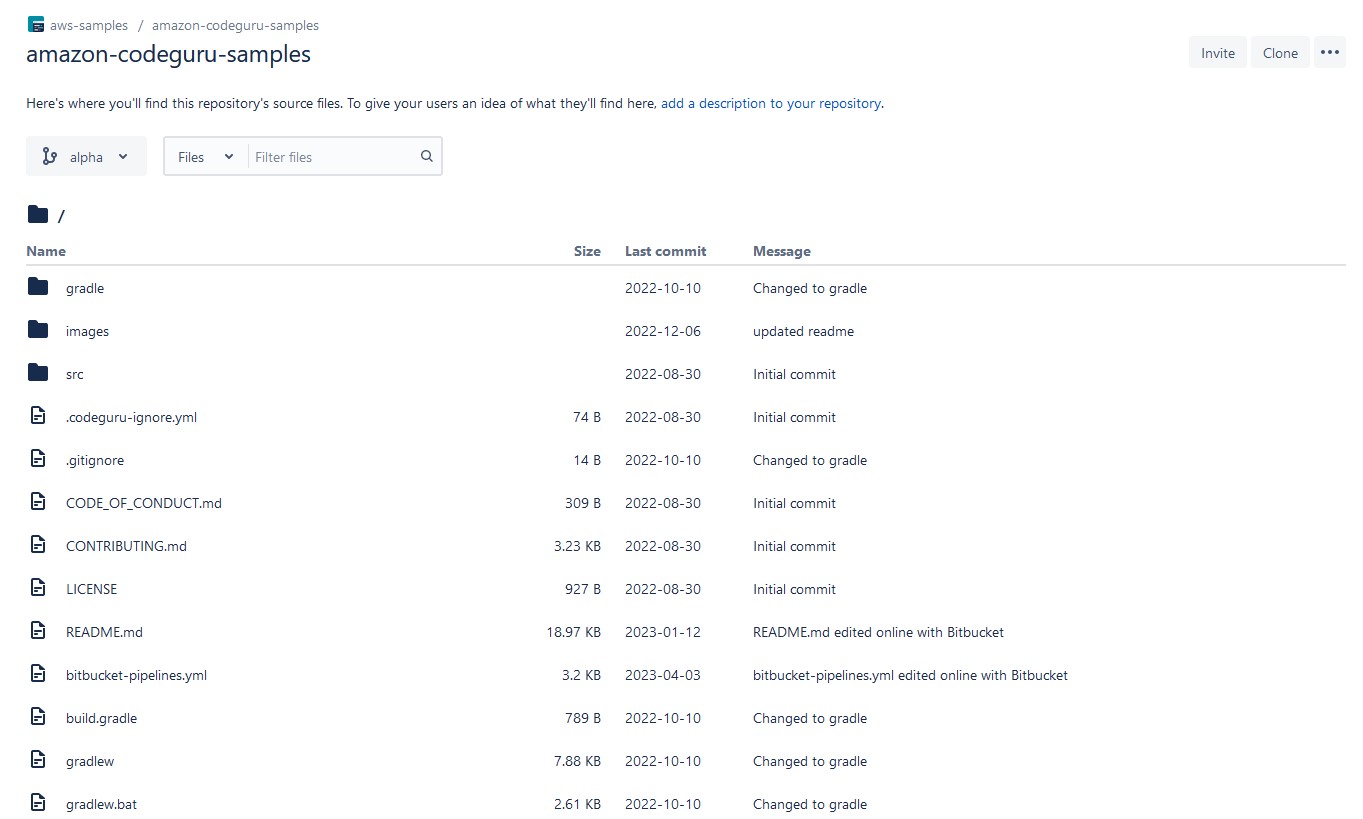
Clone the source code from the github repo
git clone https://github.com/aws-samples/amazon-devops-guru-connector-datadog.git
Build the sample application using SAM CLI
$cd DatadogFunctions

$sam build
Building codeuri: $\amazon-devops-guru-connector-datadog\DatadogFunctions\Functions runtime: java11 metadata: {} architecture: x86_64 functions: Functions
Running JavaMavenWorkflow:CopySource
Running JavaMavenWorkflow:MavenBuild
Running JavaMavenWorkflow:MavenCopyDependency
Running JavaMavenWorkflow:MavenCopyArtifacts

Build Succeeded

Built Artifacts  : .aws-sam\build
Built Template   : .aws-sam\build\template.yaml

Commands you can use next
=========================
[*] Validate SAM template: sam validate
[*] Invoke Function: sam local invoke
[*] Test Function in the Cloud: sam sync --stack-name {{stack-name}} --watch
[*] Deploy: sam deploy --guided
This command will build the source of your application by installing dependencies defined in Functions/pom.xml, create a deployment package and saves it in the. aws-sam/build folder.
Deploy the sample application using SAM CLI
$sam deploy --guided
This command will package and deploy your application to AWS, with a series of prompts that you should respond to as shown below:
-
-
- Stack Name: The name of the stack to deploy to CloudFormation. This should be unique to your account and region, and a good starting point would be something matching your project name.
- AWS Region: The AWS region you want to deploy your application to.
- Confirm changes before deploy: If set to yes, any change sets will be shown to you before execution for manual review. If set to no, the AWS SAM CLI will automatically deploy application changes.
- Allow SAM CLI IAM role creation:Many AWS SAM templates, including this example, create AWS IAM roles required for the AWS Lambda function(s) included to access AWS services. By default, these are scoped down to minimum required permissions. To deploy an AWS CloudFormation stack which creates or modifies IAM roles, the CAPABILITY_IAM value for capabilities must be provided. If permission isn’t provided through this prompt, to deploy this example you must explicitly pass
--capabilities CAPABILITY_IAMto the sam deploy command. - Disable rollback [y/N]: If set to Y, preserves the state of previously provisioned resources when an operation fails.
- Save arguments to configuration file (samconfig.toml): If set to yes, your choices will be saved to a configuration file inside the project, so that in the future you can just re-run sam deploy without parameters to deploy changes to your application.
-
After you enter your parameters, you should see something like this if you have provided Y to view and confirm ChangeSets. Proceed here by providing ‘Y’ for deploying the resources.
Initiating deployment
=====================

        Uploading to sam-app-datadog/0c2b93e71210af97a8c57710d0463c8b.template  1797 / 1797  (100.00%)


Waiting for changeset to be created..

CloudFormation stack changeset
---------------------------------------------------------------------------------------------------------------------
Operation                     LogicalResourceId             ResourceType                  Replacement
---------------------------------------------------------------------------------------------------------------------
+ Add                         FunctionsDevOpsGuruPermissi   AWS::Lambda::Permission       N/A
                              on
+ Add                         FunctionsDevOpsGuru           AWS::Events::Rule             N/A
+ Add                         FunctionsRole                 AWS::IAM::Role                N/A
+ Add                         Functions                     AWS::Lambda::Function         N/A
---------------------------------------------------------------------------------------------------------------------


Changeset created successfully. arn:aws:cloudformation:us-east-1:867001007349:changeSet/samcli-deploy1680640852/bdc3039b-cdb7-4d7a-a3a0-ed9372f3cf9a


Previewing CloudFormation changeset before deployment
======================================================
Deploy this changeset? [y/N]: y

2023-04-04 15:41:06 - Waiting for stack create/update to complete

CloudFormation events from stack operations (refresh every 5.0 seconds)
---------------------------------------------------------------------------------------------------------------------
ResourceStatus                ResourceType                  LogicalResourceId             ResourceStatusReason
---------------------------------------------------------------------------------------------------------------------
CREATE_IN_PROGRESS            AWS::IAM::Role                FunctionsRole                 -
CREATE_IN_PROGRESS            AWS::IAM::Role                FunctionsRole                 Resource creation Initiated
CREATE_COMPLETE               AWS::IAM::Role                FunctionsRole                 -
CREATE_IN_PROGRESS            AWS::Lambda::Function         Functions                     -
CREATE_IN_PROGRESS            AWS::Lambda::Function         Functions                     Resource creation Initiated
CREATE_COMPLETE               AWS::Lambda::Function         Functions                     -
CREATE_IN_PROGRESS            AWS::Events::Rule             FunctionsDevOpsGuru           -
CREATE_IN_PROGRESS            AWS::Events::Rule             FunctionsDevOpsGuru           Resource creation Initiated
CREATE_COMPLETE               AWS::Events::Rule             FunctionsDevOpsGuru           -
CREATE_IN_PROGRESS            AWS::Lambda::Permission       FunctionsDevOpsGuruPermissi   -
                                                            on
CREATE_IN_PROGRESS            AWS::Lambda::Permission       FunctionsDevOpsGuruPermissi   Resource creation Initiated
                                                            on
CREATE_COMPLETE               AWS::Lambda::Permission       FunctionsDevOpsGuruPermissi   -
                                                            on
CREATE_COMPLETE               AWS::CloudFormation::Stack    sam-app-datadog               -
---------------------------------------------------------------------------------------------------------------------


Successfully created/updated stack - sam-app-datadog in us-east-1
Once the deployment succeeds, you should be able to see the successful creation of your resources. Also, you can find your Lambda, IAM Role and EventBridge Rule in the CloudFormation stack output values.
You can also choose to test and debug your function locally with sample events using the SAM CLI local functionality.Test a single function by invoking it directly with a test event. An event is a JSON document that represents the input that the function receives from the event source. Refer the Invoking Lambda functions locally – AWS Serverless Application Model link here for more details.
$ sam local invoke Functions -e ‘event/event.json’
Once you are done with the above steps, move on to “Test the Solution” section below to trigger some DevOps Guru insights and validate that the events are created and pushed to Datadog.
Test the Solution
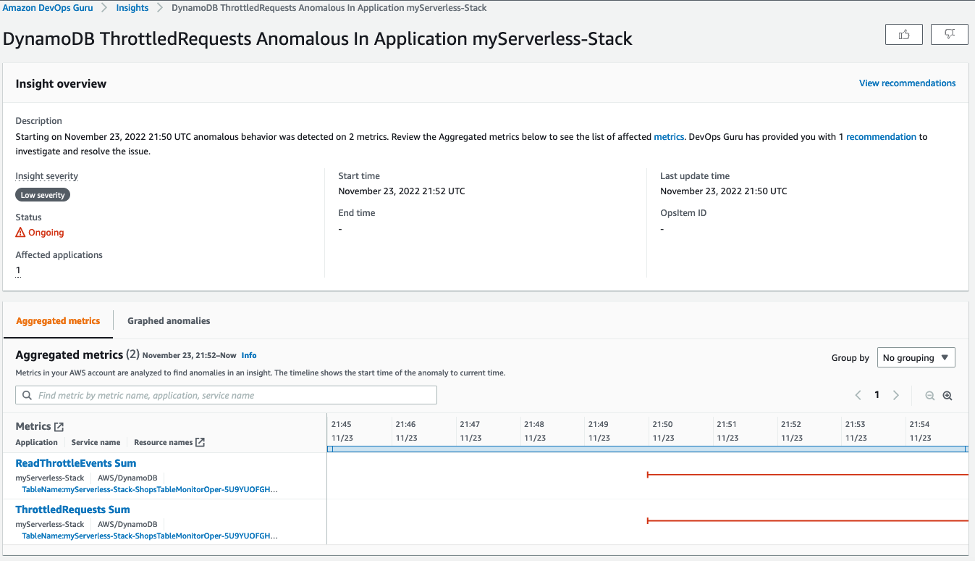
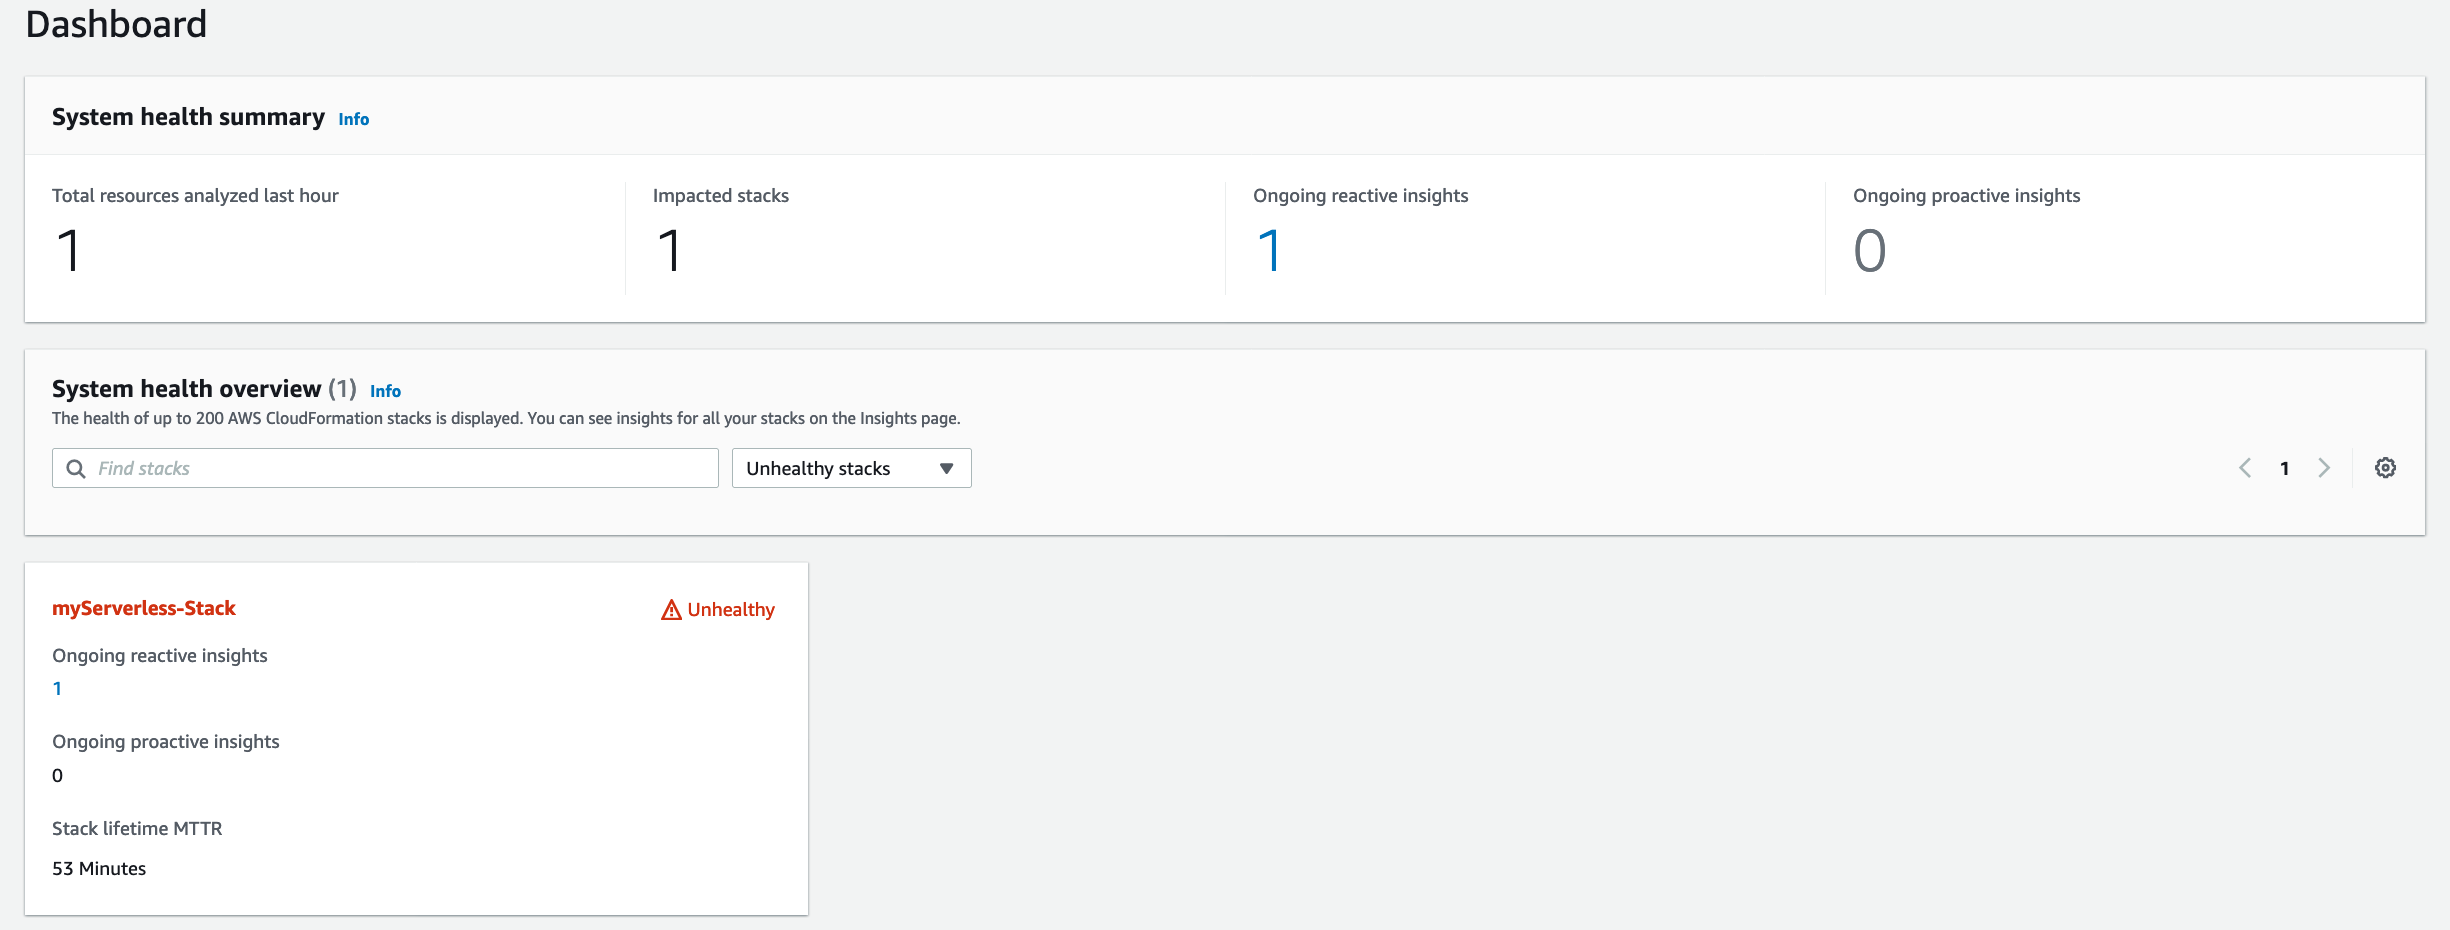
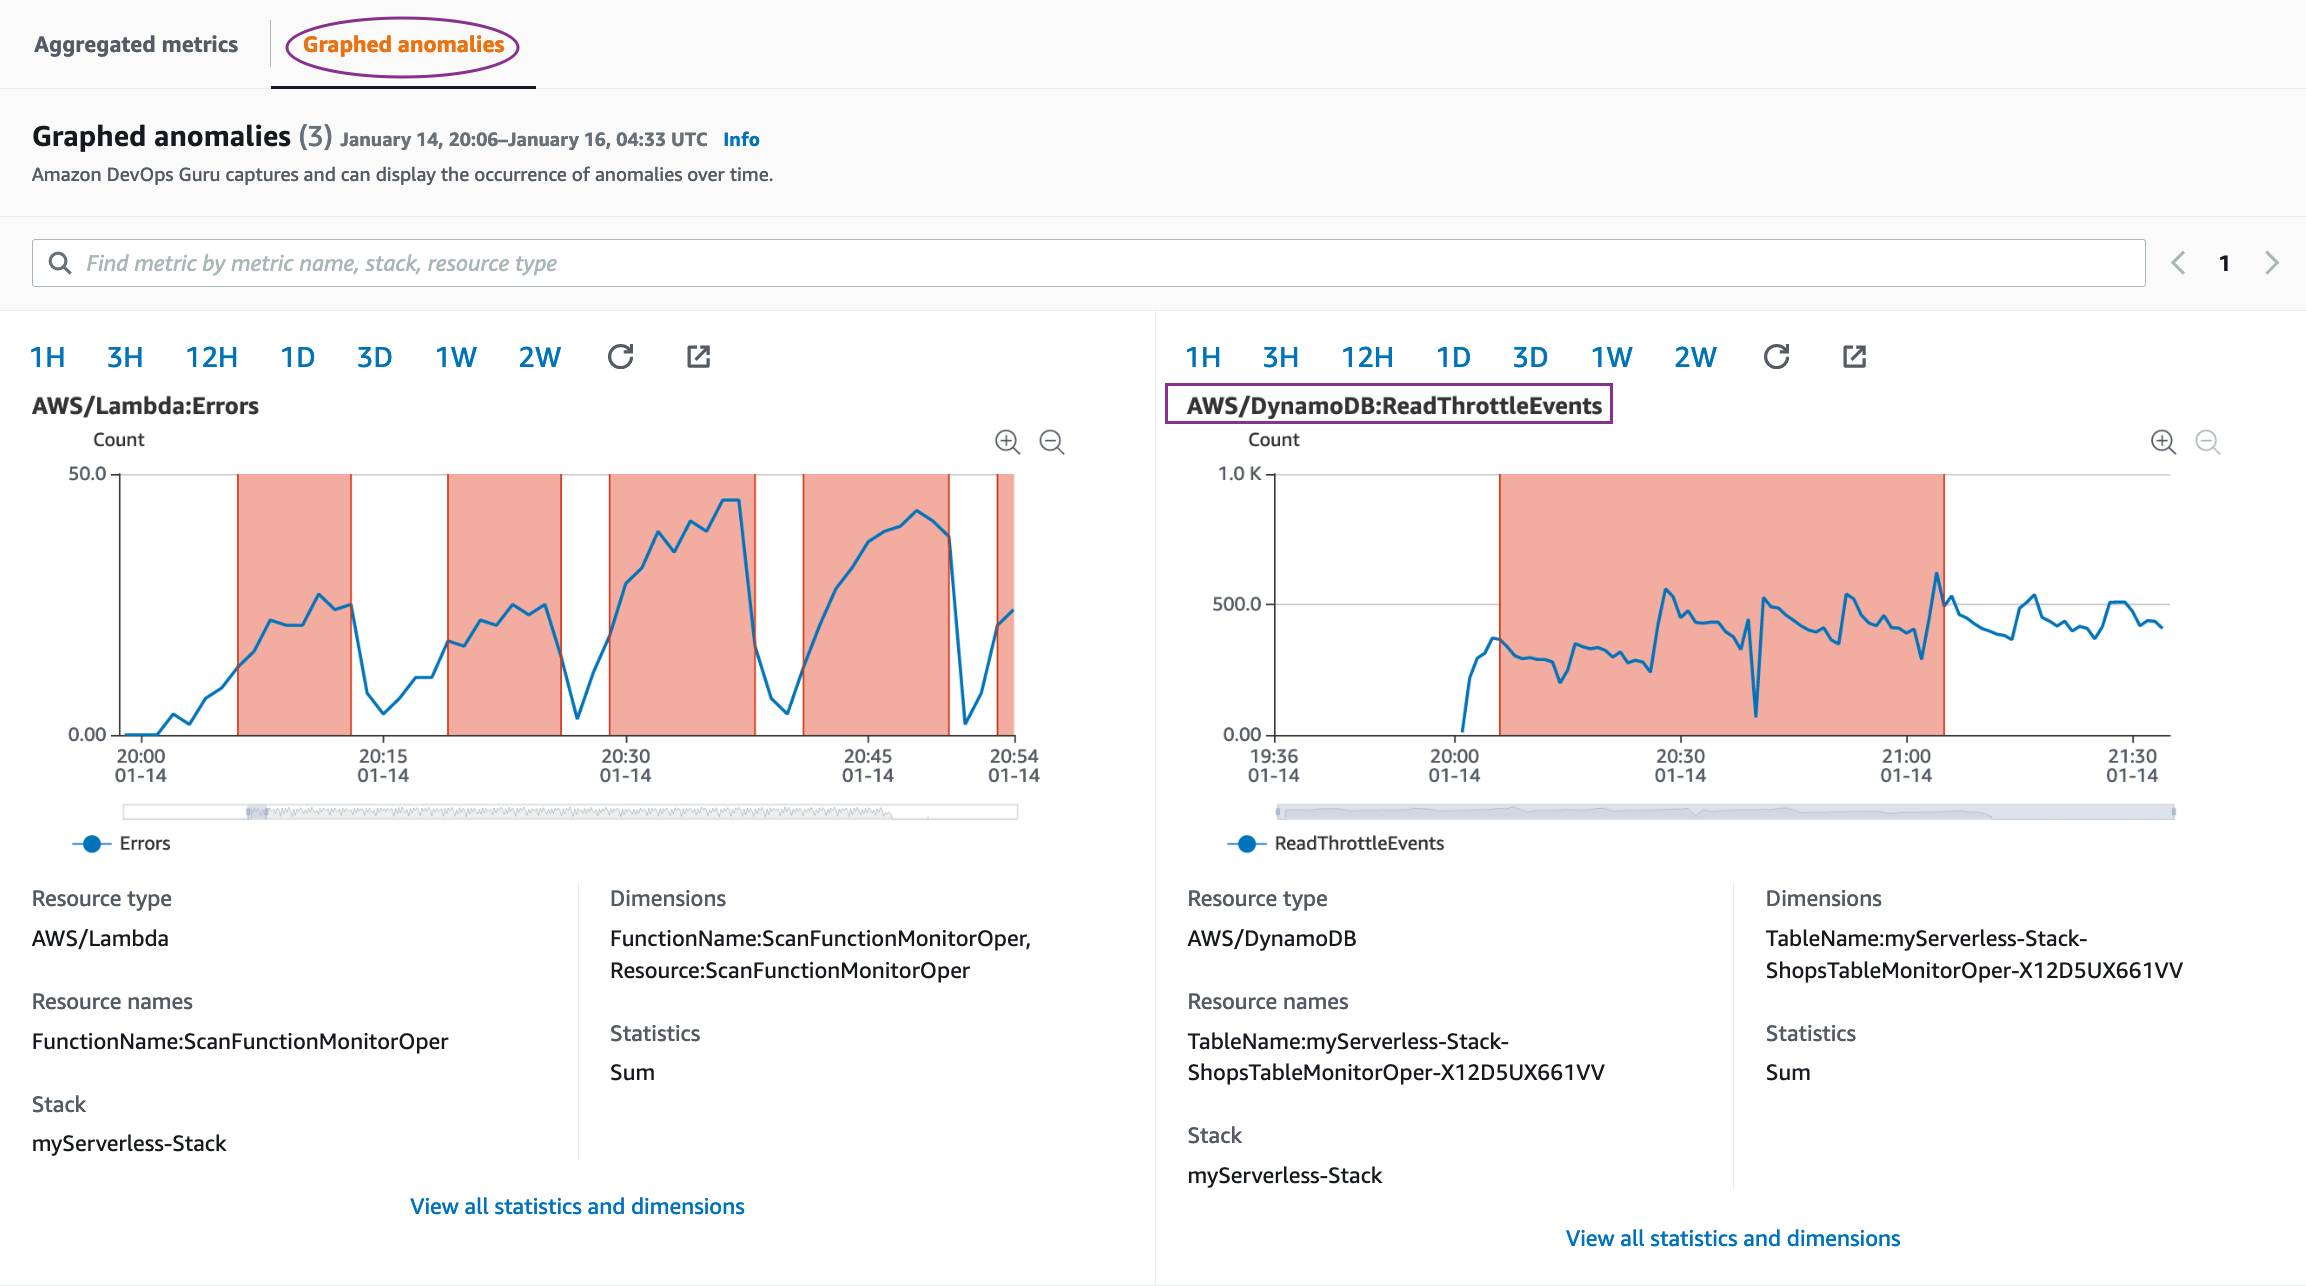
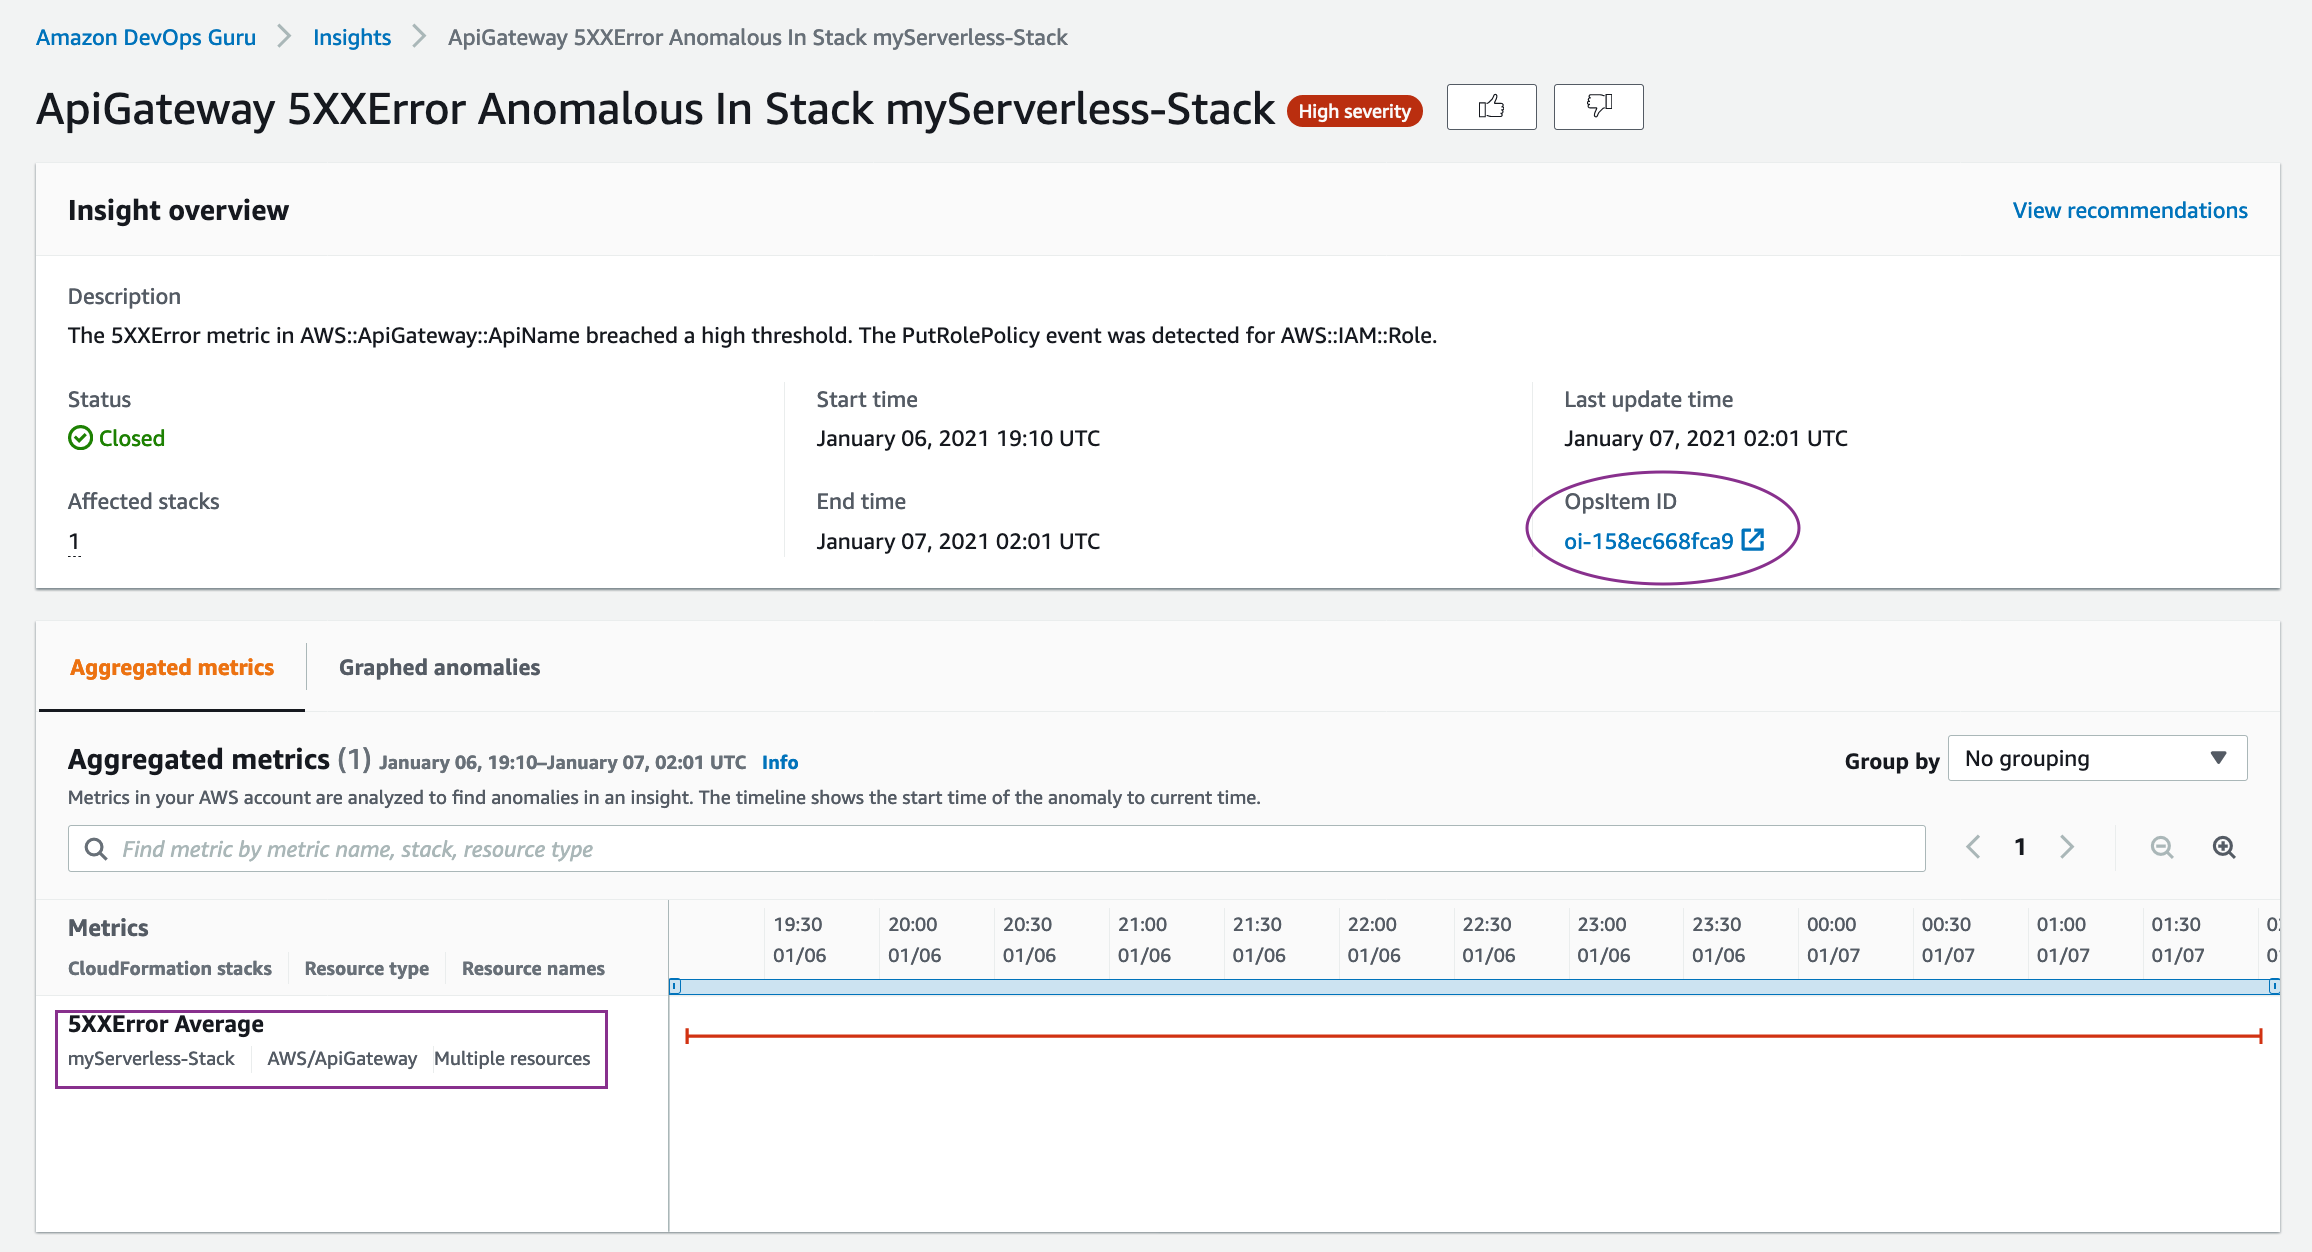
To test the solution, we will simulate a DevOps Guru Insight. You can also simulate an insight by following the steps in this blog. After an anomaly is detected in the application, DevOps Guru creates an insight as shown below

Figure 7: DevOps Guru insight for DynamoDB
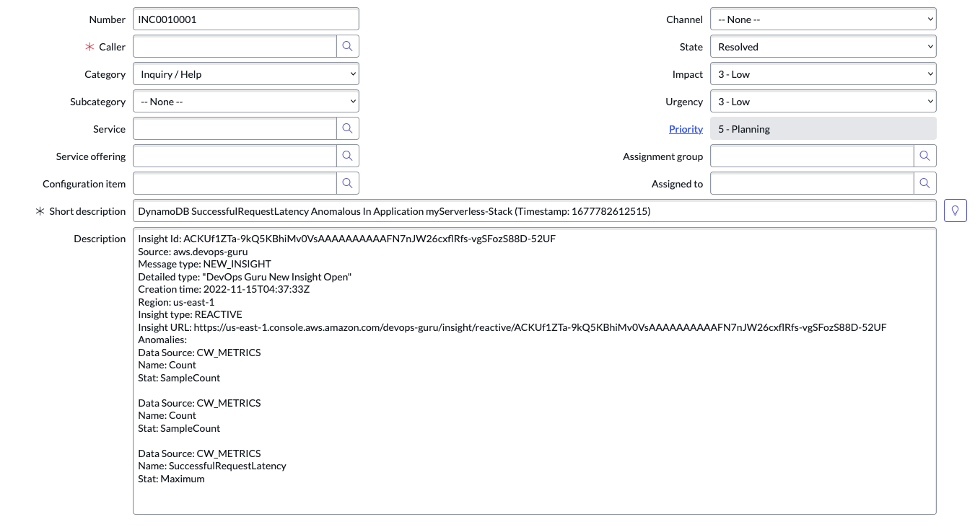
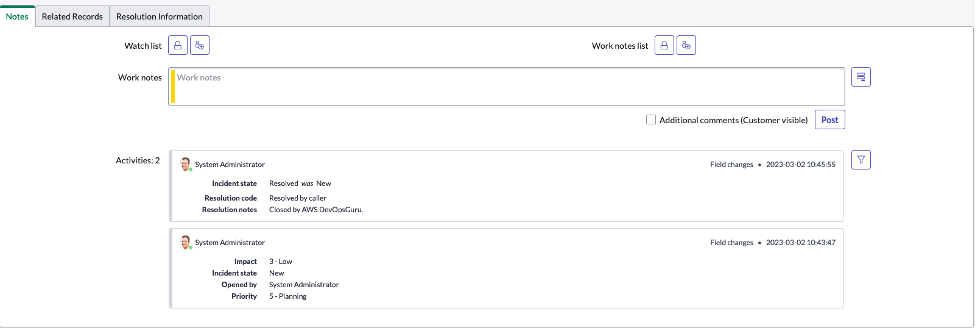
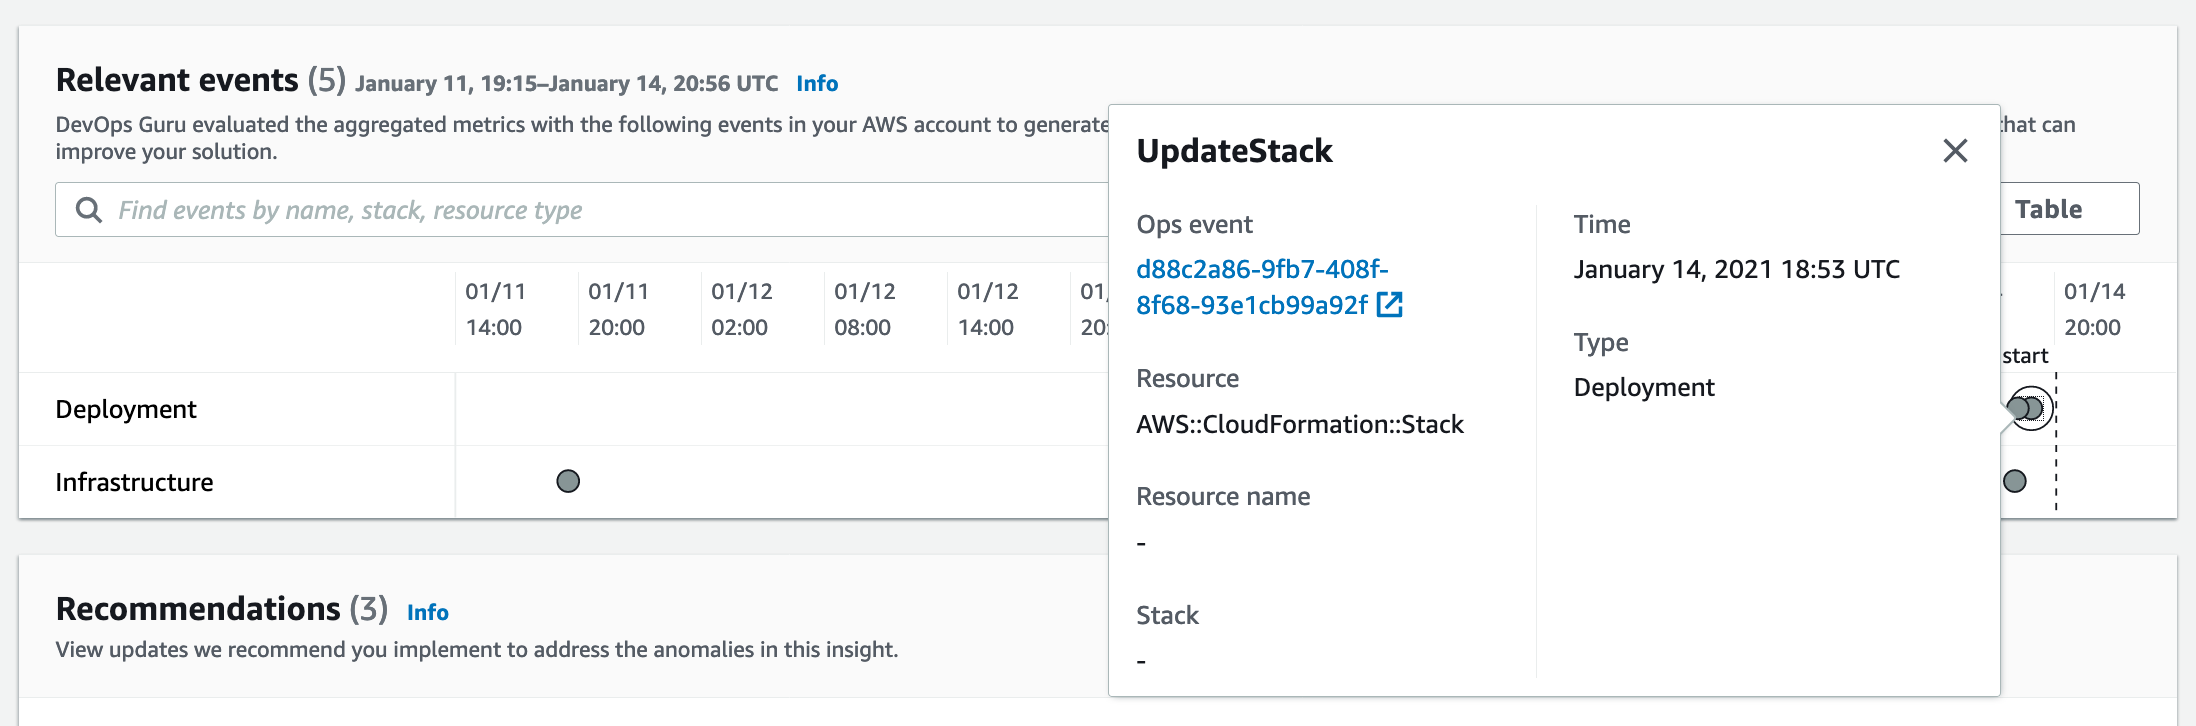
For the DevOps Guru insight shown above, a corresponding event is automatically created and pushed to Datadog as shown below. In addition to the events creation, any new anomalies and recommendations from DevOps Guru is also associated with the events

Figure 8 : DevOps Guru Insight pushed to Datadog event stream.
Cleaning Up
To delete the sample application that you created, In your Cloud 9 environment open a new terminal. Now type in the AWS CLI command below and pass the stack name you provided in the deploy step
aws cloudformation delete-stack --stack-name <Stack Name>
Alternatively ,you could also use the AWS CloudFormation Console to delete the stack
Conclusion
This article highlights how Amazon DevOps Guru monitors resources within a specific region of your AWS account, automatically detecting operational issues, predicting potential resource exhaustion, identifying probable causes, and recommending remediation actions. It describes a bespoke solution enabling integration of DevOps Guru insights with Datadog, enhancing management and oversight of AWS services. This solution aids customers using Datadog to bolster operational efficiencies, delivering customized insights, real-time alerts, and management capabilities directly from DevOps Guru, offering a unified interface to swiftly restore services and systems.
To start gaining operational insights on your AWS Infrastructure with Datadog head over to Amazon DevOps Guru documentation page.
About the authors:


![As the user configures their EventBridge Rule, for the Creation method they have chosen "Custom pattern (JSON editor) write an event pattern in JSON." For the Event pattern editor just below they have entered {"source":["aws.devops-guru"]}](https://d2908q01vomqb2.cloudfront.net/7719a1c782a1ba91c031a682a0a2f8658209adbf/2023/04/19/eventbridge.png)