Tag Archives: Aurora

Using Amazon CodeCatalyst with Amazon Virtual Private Cloud

Post Syndicated from Brian Beach original https://aws.amazon.com/blogs/devops/using-amazon-codecatalyst-with-amazon-virtual-private-cloud/

Amazon CodeCatalyst is an integrated service for software development teams adopting continuous integration and deployment practices into their software development process. CodeCatalyst puts the tools you need all in one place. You can plan work, collaborate on code, and build, test, and deploy applications with continuous integration/continuous delivery (CI/CD) tools. You can also integrate AWS resources with your projects by connecting your AWS accounts to CodeCatalyst spaces.

CodeCatalyst recently announced support for Amazon Virtual Private Cloud (Amazon VPC). Amazon VPC is a logically isolated virtual network that you’ve defined. This virtual network closely resembles a traditional network that you’d operate in your own data center, with the benefits of using the scalable infrastructure of AWS. VPC connectivity from CodeCatalyst allows you to publish a package to an artifact repository in a private subnet, query an Amazon Relational Database Service (Amazon RDS) in a private subnet, deploy an update to Amazon Elastic Kubernetes Service (Amazon EKS) in a private subnet, and much more. In this post I will show you how to deploy changes to an Amazon Aurora database in a private Subnet using CodeCatalyst.

Overview

CodeCatalyst now allows you to create a VPC connection associated with an AWS Account. A VPC connection is a CodeCatalyst resource which contains all of the configuration needed to access a VPC. Space administrators can add their own VPC connections in the Amazon CodeCatalyst console on behalf of space members. Once created, members of the space can use the VPC connection in their projects.

For this walkthrough, I have created a VPC in the us-west-2 region. My VPC has both a private and public subnet in each Availability Zone (AZ) . Next, I created a VPC connection in CodeCatalyst. In the following image, I have configured a VPC connection with a private subnet in each of the four AZs. In addition, I have added a security group that will be associated with resources that use this VPC connection allowing me to controls the traffic that is allowed to reach and leave the resources.
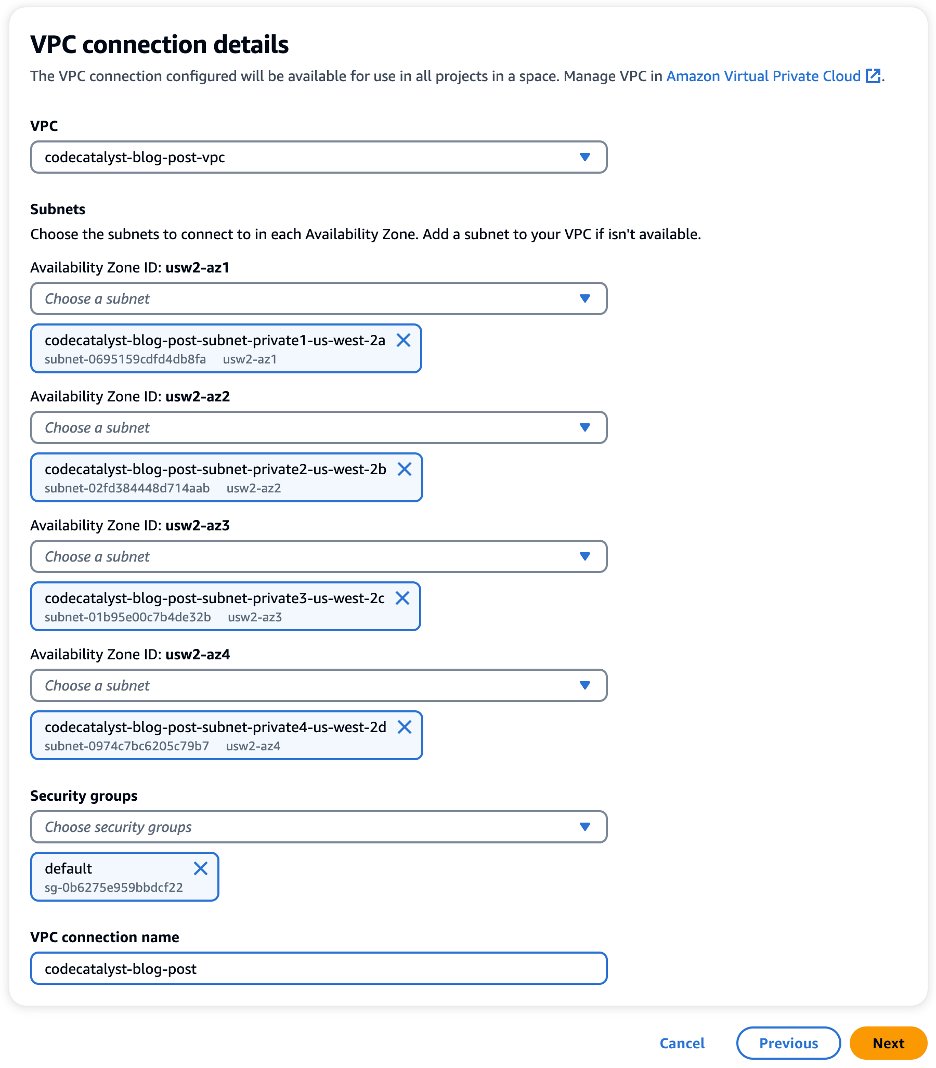
VPC connection details dialog showing the four private subnets and a security group.

Before we move on, let’s take a moment to discuss how CodeCatalyst VPC connections work. When CodeCatalyst creates a workflow, an elastic network interface (ENI) is added to your VPC as shown in the following image. Note that the image shows two subnets a single availability zone for simplicity. However, as discussed earlier, the VPC used in this walkthrough has eight subnets in four availability zones.
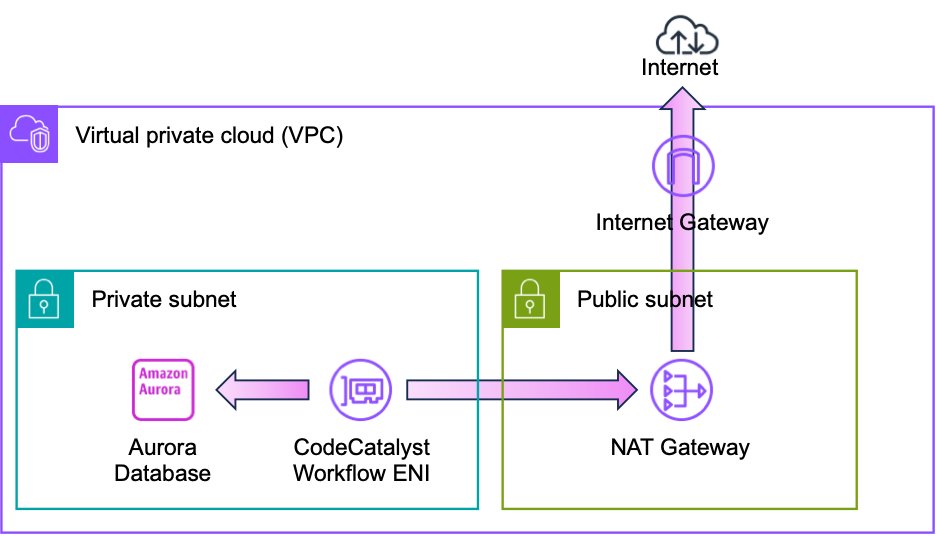
Architecture diagram showing an aurora database in a private subnet and a NAT gateway in a public subnet for internet access

CodeCatalyst can now use this ENI to access private resources in the VPC. For example, an Amazon Aurora database. It is important to note that the ENI does not have a public IP address. Therefore, I have provided a path to the internet. Internet connectivity allows CodeCatalyst to access the APIs as well as publicly available repositories such as GitHub, PyPI, NPM, Docker Hub, et cetera. In this example, I use a NAT gateway for internet access, but I will discuss advanced network topologies later in this post.

Using CodeCatalyst Workflows in a Private Subnet

With the VPC connection in place, I can also use the VPC connection in a workflow. Amazon CodeCatalyst workflows are continuous integration and continuous delivery (CI/CD) pipelines that enable you to easily build, test and deploy applications. CodeCatalyst Workflows help you reliably deliver high-quality application updates frequently, quickly and securely. CodeCatalyst allows you to quickly assemble and configure actions – including GitHub Actions – to compose workflows that automate your CI/CD pipeline, test reporting, and other manual processes. You can learn more about CodeCatalyst workflows in the CodeCatalyst User Guide.

As a database developer, my workflow often needs to update the schema of the Aurora database. For this walkthrough, I will use Liquibase to deploy a schema change to the Aurora PostgreSQL database. If you are not familiar with Liquibase, you can refer to my prior post on Running GitHub Actions in a private Subnet with AWS CodeBuild for an overview. CodeCatalyst allows you to use GitHub Actions alongside native CodeCatalyst actions in a CodeCatalyst workflow. I will use the Liquibase Update GitHub Action as shown in the following image.
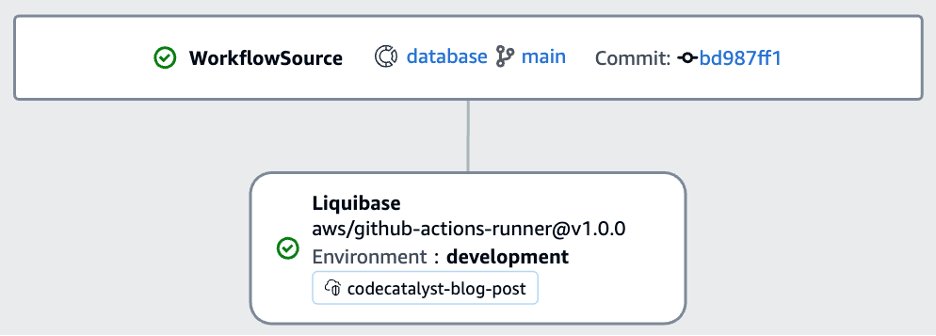
Workflow diagram showing the Liquibase action

If I edit the Liquibase action, I can see the details of the configuration as shown in the following image. You will notice that I have selected the codecatalyst-blog-post VPC connection in the environment configuration. This will allow the Liquibase action to access private resources in my VPC including the Aurora database. Also notice how easy it is to incorporate a GitHub action in my workflow through the YAML configuration. Finally, notice that I can access CodeCatalyst secrets, such as the password, in my configuration.
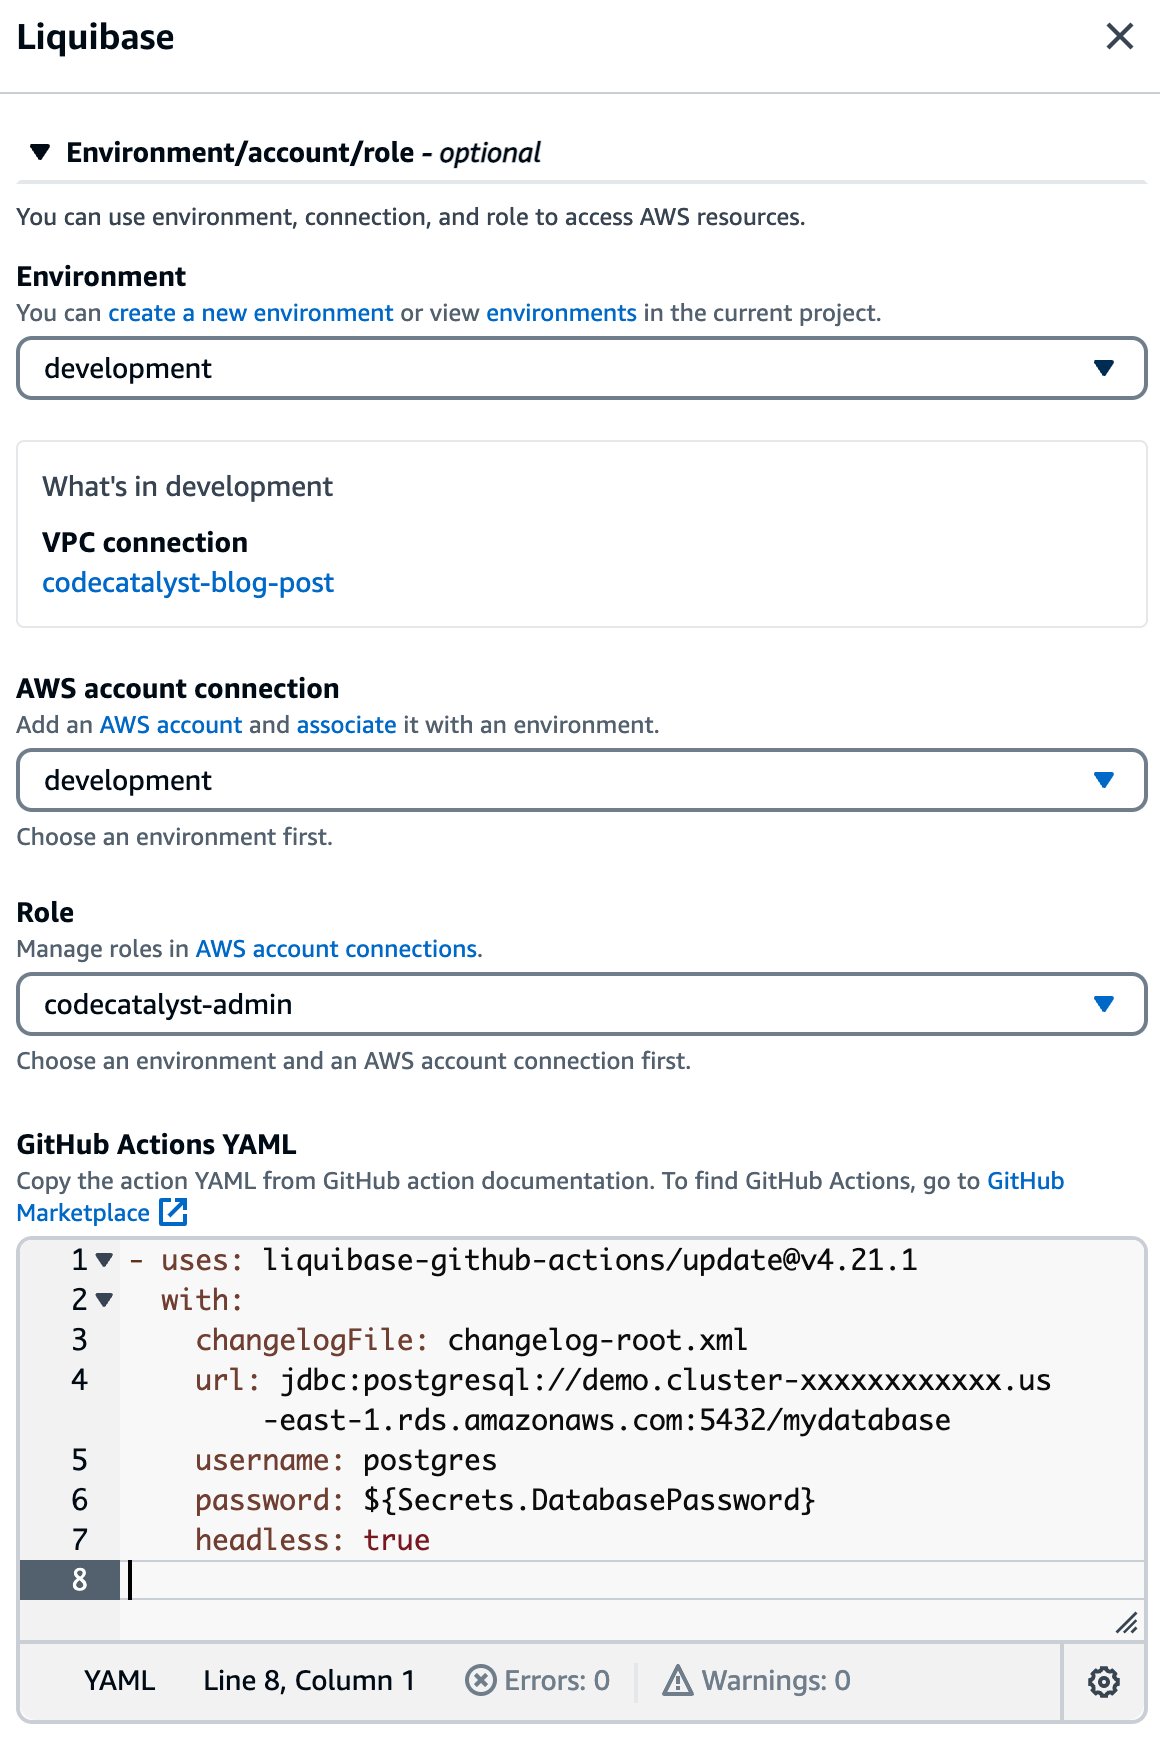
Action configuration dialog showing the GitHub Action configuration

When I save the workflow and run it, you can see that the Liquibase action is able to successfully connect to the database. Note that in this example, there were no pending changes, so Liquibase reports “Database is up to date, no changesets to execute.”

####################################################
##   _     _             _ _                      ##
##  | |   (_)           (_) |                     ##
##  | |    _  __ _ _   _ _| |__   __ _ ___  ___   ##
##  | |   | |/ _` | | | | | '_ \ / _` / __|/ _ \  ##
##  | |___| | (_| | |_| | | |_) | (_| \__ \  __/  ##
##  \_____/_|\__, |\__,_|_|_.__/ \__,_|___/\___|  ##
##              | |                               ##
##              |_|                               ##
##                                                ##
##  Get documentation at docs.liquibase.com       ##
##  Get certified courses at learn.liquibase.com  ##
##  Free schema change activity reports at        ##
##      https://hub.liquibase.com                 ##
##                                                ##
####################################################
Starting Liquibase at 13:04:37 (version 4.21.1 #9070)
Liquibase Version: 4.21.1
Liquibase Open Source 4.21.1 by Liquibase
Database is up to date, no changesets to execute
 
UPDATE SUMMARY
Run:                          0
Previously run:               2
Filtered out:                 0
-------------------------------
Total change sets:            2
 
Liquibase command 'update' was executed successfully.

Obviously, a database is just one possible example. There are many private resources that I may need to access as a developer. A few more examples include: Amazon Elastic Compute Cloud (Amazon EC2) instances, Amazon Elastic File System (EFS) shares, and Amazon ElastiCache clusters among many others.

Advanced VPC Topologies

At the beginning of this post, I introduced a simple VPC with public and private subnets, and a NAT gateway. However, CodeCatalyst will work with more complex VPC topologies that are common among enterprise customers. For example, imagine that my application is deployed across multiple regions for both improved availability and lower latency. However, I prefer to manage all of CodeCatalyst projects in a single region, us-west-2, close to the developers.

As a result, CodeCatalyst workflows all run in us-west-2. This does not mean that I can only deploy changes to the same region as the CodeCatalyst project. CodeCatalyst can use the full complement of VPC features. For example, in the following architecture, I am using VPC peering to allow CodeCatalyst to update an Aurora database in another region. The workflow is identical to the version I created previously, other than changing the Aurora endpoint, and possibly the username and password. Note that I still have an internet connection which I have omitted from this diagram for simplicity.
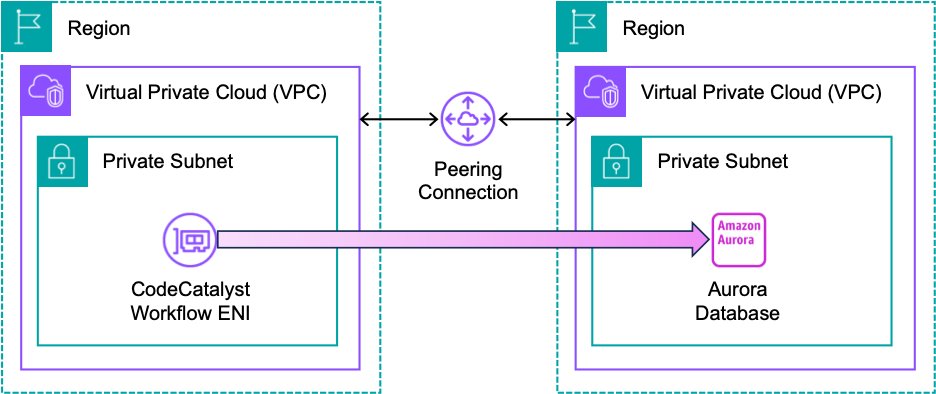
Architecture diagram showing two VPCs connected by a peering connection

Alternatively, I could use an AWS Transit Gateway (TGW) rather than a peering connection as shown in the following architecture. CodeCatalyst can use the TGW to update resources in another region. Furthermore, CodeCatalyst can leverage a VPN connection associated with the TGW to update resources hosted outside of AWS. For example, I could deploy a change to a database hosted in an on-prem datacenter. Note that I have omitted the internet connection from this diagram for simplicity.
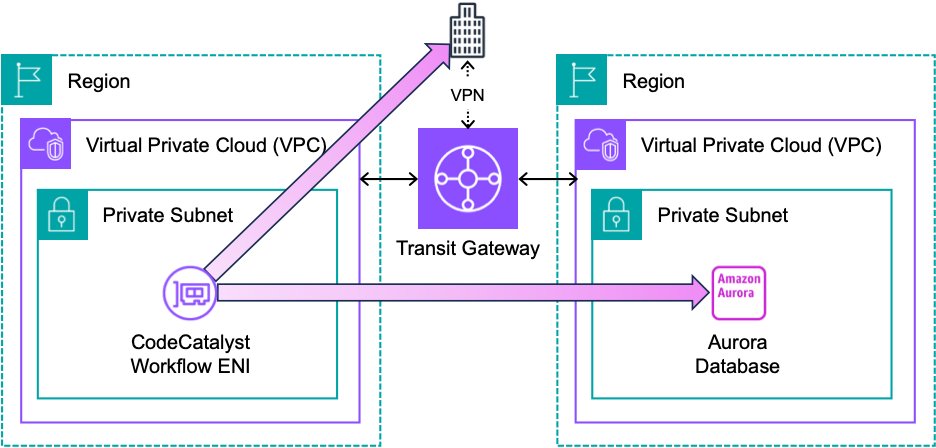
Architecture diagram showing two VPCs connected by a TGW

These are just a few examples of the advanced networking topologies that you can use with CodeCatalyst. You can read more about planning your network topology in the Reliability Pillar of the AWS Well-Architected Framework.

Conclusion

Amazon CodeCatalyst VPC connections allow you to access resources in a private subnet from your workflows. In this post, I configured a VPC connection to deploy schema changes using Liquibase. I also discussed some advanced network topologies that allow you to update resources in other regions. You can learn more about CodeCatalyst VPC connections in the CodeCatalyst User Guide

Argonne Aurora Supercomputer Intel Max Blade Installation is Complete

Post Syndicated from Cliff Robinson original https://www.servethehome.com/argonne-aurora-supercomputer-intel-max-blade-installation-is-complete/

Today Intel and Argonne National Labs announced that the Intel Xeon Max and GPU Max Aurora supercomputer blade installation is complete

The post Argonne Aurora Supercomputer Intel Max Blade Installation is Complete appeared first on ServeTheHome.

Leverage DevOps Guru for RDS to detect anomalies and resolve operational issues

Post Syndicated from Kishore Dhamodaran original https://aws.amazon.com/blogs/devops/leverage-devops-guru-for-rds-to-detect-anomalies-and-resolve-operational-issues/

The Relational Database Management System (RDBMS) is a popular choice among organizations running critical applications that supports online transaction processing (OLTP) use-cases. But managing the RDBMS database comes with its own challenges. AWS has made it easier for organizations to operate these databases in the cloud, thereby addressing the undifferentiated heavy lifting with managed databases (Amazon Aurora, Amazon RDS). Although using managed services has freed up engineering from provisioning hardware, database setup, patching, and backups, they still face the challenges that come with running a highly performant database. As applications scale in size and sophistication, it becomes increasingly challenging for customers to detect and resolve relational database performance bottlenecks and other operational issues quickly.

Amazon RDS Performance Insights is a database performance tuning and monitoring feature, that lets you quickly assess your database load and determine when and where to take action. Performance Insights lets non-experts in database administration diagnose performance problems with an easy-to-understand dashboard that visualizes database load. Furthermore, Performance Insights expands on the existing Amazon RDS monitoring features to illustrate database performance and help analyze any issues that affect it. The Performance Insights dashboard also lets you visualize the database load and filter the load by waits, SQL statements, hosts, or users.

On Dec 1st, 2021, we announced Amazon DevOps Guru for RDS, a new capability for Amazon DevOps Guru. It’s a fully-managed machine learning (ML)-powered service that detects operational and performance related issues for Amazon Aurora engines. It uses the data that it collects from Performance Insights, and then automatically detects and alerts customers of application issues, including database problems. When DevOps Guru detects an issue in an RDS database, it publishes an insight in the DevOps Guru dashboard. The insight contains an anomaly for the resource AWS/RDS. If DevOps Guru for RDS is turned on for your instances, then the anomaly contains a detailed analysis of the problem. DevOps Guru for RDS also recommends that you perform an investigation, or it provides a specific corrective action. For example, the recommendation might be to investigate a specific high-load SQL statement or to scale database resources.

In this post, we’ll deep-dive into some of the common issues that you may encounter while running your workloads against Amazon Aurora MySQL-Compatible Edition databases, with simulated performance issues. We’ll also look at how DevOps Guru for RDS can help identify and resolve these issues. Simulating a performance issue is resource intensive, and it will cost you money to run these tests. If you choose the default options that are provided, and clean up your resources using the following clean-up instructions, then it will cost you approximately $15 to run the first test only. If you wish to run all of the tests, then you can choose “all” in the Tests parameter choice. This will cost you approximately $28 to run all three tests.

Prerequisites

To follow along with this walkthrough, you must have the following prerequisites:

  • An AWS account with a role that has sufficient access to provision the required infrastructure. The account should also not have exceeded its quota for the resources being deployed (VPCs, Amazon Aurora, etc.).
  • Credentials that enable you to interact with your AWS account.
  • If you already have Amazon DevOps Guru turned on, then make sure that it’s tagged properly to detect issues for the resource being deployed.

Solution overview

You will clone the project from GitHub and deploy an AWS CloudFormation template, which will set up the infrastructure required to run the tests. If you choose to use the defaults, then you can run only the first test. If you would like to run all of the tests, then choose the “all” option under Tests parameter.

We simulate some common scenarios that your database might encounter when running enterprise applications. The first test simulates locking issues. The second test simulates the behavior when the AUTOCOMMIT property of the database driver is set to: True. This could result in statement latency. The third test simulates performance issues when an index is missing on a large table.

Solution walk through

Clone the repo and deploy resources

  1. Utilize the following command to clone the GitHub repository that contains the CloudFormation template and the scripts necessary to simulate the database load. Note that by default, we’ve provided the command to run only the first test.
    git clone https://github.com/aws-samples/amazon-devops-guru-rds.git
    cd amazon-devops-guru-rds
    
    aws cloudformation create-stack --stack-name DevOpsGuru-Stack \
        --template-body file://DevOpsGuruMySQL.yaml \
        --capabilities CAPABILITY_IAM \
        --parameters ParameterKey=Tests,ParameterValue=one \
    ParameterKey=EnableDevOpsGuru,ParameterValue=y

    If you wish to run all four of the tests, then flip the ParameterValue of the Tests ParameterKey to “all”.

    If Amazon DevOps Guru is already enabled in your account, then change the ParameterValue of the EnableDevOpsGuru ParameterKey to “n”.

    It may take up to 30 minutes for CloudFormation to provision the necessary resources. Visit the CloudFormation console (make sure to choose the region where you have deployed your resources), and make sure that DevOpsGuru-Stack is in the CREATE_COMPLETE state before proceeding to the next step.

  2. Navigate to AWS Cloud9, then choose Your environments. Next, choose DevOpsGuruMySQLInstance followed by Open IDE. This opens a cloud-based IDE environment where you will be running your tests. Note that in this setup, AWS Cloud9 inherits the credentials that you used to deploy the CloudFormation template.
  3. Open a new terminal window which you will be using to clone the repository where the scripts are located.

  1. Clone the repo into your Cloud9 environment, then navigate to the directory where the scripts are located, and run initial setup.
git clone https://github.com/aws-samples/amazon-devops-guru-rds.git
cd amazon-devops-guru-rds/scripts
sh setup.sh 
# NOTE: If you are running all test cases, use sh setup.sh all command instead. 
source ~/.bashrc
  1. Initialize databases for all of the test cases, and add random data into them. The script to insert random data takes approximately five hours to complete. Your AWS Cloud9 instance is set up to run for up to 24 hours before shutting down. You can exit the browser and return between 5–24 hours to validate that the script ran successfully, then continue to the next step.
source ./connect.sh test 1
USE devopsgurusource;
CREATE TABLE IF NOT EXISTS test1 (id int, filler char(255), timer timestamp);
exit;
python3 ct.py

If you chose to run all test cases, and you ran the sh setup.sh all command in Step 4, open two new terminal windows and run the following commands to insert random data for test cases 2 and 3.

# Test case 2 – Open a new terminal window to run the commands
cd amazon-devops-guru-rds/scripts
source ./connect.sh test 2
USE devopsgurusource;
CREATE TABLE IF NOT EXISTS test1 (id int, filler char(255), timer timestamp);
exit;
python3 ct.py
# Test case 3 - Open a new terminal window to run the commands
cd amazon-devops-guru-rds/scripts
source ./connect.sh test 3
USE devopsgurusource;
CREATE TABLE IF NOT EXISTS test1 (id int, filler char(255), timer timestamp);
exit;
python3 ct.py
  1. Return between 5-24 hours to run the next set of commands.
  1. Add an index to the first database.
source ./connect.sh test 1
CREATE UNIQUE INDEX test1_pk ON test1(id);
INSERT INTO test1 VALUES (-1, 'locker', current_timestamp);
exit;
  1. If you chose to run all test cases, and you ran the sh setup.sh all command in Step 4, add an index to the second database. NOTE: Do no add an index to the third database.
source ./connect.sh test 2
CREATE UNIQUE INDEX test1_pk ON test1(id);
INSERT INTO test1 VALUES (-1, 'locker', current_timestamp);
exit;

DevOps Guru for RDS uses Performance Insights, and it establishes a baseline for the database metrics. Baselining involves analyzing the database performance metrics over a period of time to establish a “normal” behavior. DevOps Guru for RDS then uses ML to detect anomalies against the established baseline. If your workload pattern changes, then DevOps Guru for RDS establishes a new baseline that it uses to detect anomalies against the new “normal”. For new database instances, DevOps Guru for RDS takes up to two days to establish an initial baseline, as it requires an analysis of the database usage patterns and establishing what is considered a normal behavior.

  1. Allow two days before you start running the following tests.

Scenario 1: Locking Issues

In this scenario, multiple sessions compete for the same (“locked”) record, and they must wait for each other.
In real life, this often happens when:

  • A database session gets disconnected due to a (i.e., temporary network) malfunction, while still holding a critical lock.
  • Other sessions become stuck while waiting for the lock to be released.
  • The problem is often exacerbated by the application connection manager that keeps spawning additional sessions (because the existing sessions don’t complete the work on time), thus creating a distinct “inclined slope” pattern that you’ll see in this scenario.

Here’s how you can reproduce it:

  1. Connect to the database.
cd amazon-devops-guru-rds/scripts
source ./connect.sh test 1
  1. In your MySQL, enter the following SQL, and don’t exit the shell.
START TRANSACTION;
UPDATE test1 SET timer=current_timestamp WHERE id=-1;
-- Do NOT exit!
  1. Open a new terminal, and run the command to simulate competing transactions. Give it approximately five minutes before you run the commands in this step.
cd amazon-devops-guru-rds/scripts
source ./connect.sh test 1
exit;
python3 locking_scenario.py 1 1200 2
  1. After the program completes its execution, navigate to the Amazon DevOps Guru console, choose Insights, and then choose RDS DB Load Anomalous. You’ll notice a summary of the insight under Description.

Shows navigation to Amazon DevOps Guru Insights and RDS DB Load Anomalous screen to find the summary description of the anomaly.

  1. Choose the View Recommendations link on the top right, and observe the databases for which it’s showing the recommendations.
  2. Next, choose View detailed analysis for database performance anomaly for the following resources.
  3. Under To view a detailed analysis, choose a resource name, choose the database associated with the first test.

 Shows the detailed analysis of the database performance anomaly. The database experiencing load is chosen, and a graphical representation of how the Average active sessions (AAS) spikes, which Amazon DevOps Guru is able to identify.

  1. Observe the recommendations under Analysis and recommendations. It provides you with analysis, recommendations, and links to troubleshooting documentation.

Shows a different section of the detailed analysis screen that provides Analysis and recommendations and links to the troubleshooting documentation.

In this example, DevOps Guru for RDS has detected a high and unusual spike of database load, and then marked it as “performance anomaly”.

Note that the relative size of the anomaly is significant: 490 times higher than the “typical” database load, which is why it’s deemed: “HIGH severity”.

In the analysis section, note that a single “wait event”, wait/synch/mutex/innodb/aurora_lock_thread_slot_futex, is dominating the entire spike. Moreover, a single SQL is “responsible” (or more precisely: “suffering”) from this wait event at the time of the problem. Select the wait event name and see a simple explanation of what’s happening in the database. For example, it’s “record locking”, where multiple sessions are competing for the same database records. Additionally, you can select the SQL hash and see the exact text of the SQL that’s responsible for the issue.

If you’re interested in why DevOps Guru for RDS detected this problem, and why these particular wait events and an SQL were selected, the Why is this a problem? and Why do we recommend this? links will provide the answer.

Finally, the most relevant part of this analysis is a View troubleshooting doc link. It references a document that contains a detailed explanation of the likely causes for this problem, as well as the actions that you can take to troubleshoot and address it.

Scenario 2: Autocommit: ON

In this scenario, we must run multiple batch updates, and we’re using a fairly popular driver setting: AUTOCOMMIT: ON.

This setting can sometimes lead to performance issues as it causes each UPDATE statement in a batch to be “encased” in its own “transaction”. This leads to data changes being frequently synchronized to disk, thus dramatically increasing batch latency.

Here’s how you can reproduce the scenario:

  1. On your Cloud9 terminal, run the following commands:
cd amazon-devops-guru-rds/scripts
source ./connect.sh test 2
exit;
python3 batch_autocommit.py 50 1200 1000 10000000
  1. Once the program completes its execution, or after an hour, navigate to the Amazon DevOps Guru console, choose Insights, and then choose RDS DB Load Anomalous. Then choose Recommendations and choose View detailed analysis for database performance anomaly for the following resources. Under To view a detailed analysis, choose a resource name, choose the database associated with the second test.

  1. Observe the recommendations under Analysis and recommendations. It provides you with analysis, recommendations, and links to troubleshooting documentation.

Shows a different section of the detailed analysis screen that provides Analysis and recommendations and links to the troubleshooting documentation.

Note that DevOps Guru for RDS detected a significant (and unusual) spike of database load and marked it as a HIGH severity anomaly.

The spike looks similar to the previous example (albeit, “smaller”), but it describes a different database problem (“COMMIT slowdowns”). This is because of a different database wait event that dominates the spike: wait/io/aurora_redo_log_flush.

As in the previous example, you can select the wait event name to see a simple description of what’s going on, and you can select the SQL hash to see the actual statement that is slow. Furthermore, just as before, the View troubleshooting doc link references the document that describes what you can do to troubleshoot the problem further and address it.

Scenario 3: Missing index

Have you ever wondered what would happen if you drop a frequently accessed index on a large table?

In this relatively simple scenario, we’re testing exactly that – an index gets dropped causing queries to switch from fast index lookups to slow full table scans, thus dramatically increasing latency and resource use.

Here’s how you can reproduce this problem and see it for yourself:

  1. On your Cloud9 terminal, run the following commands:
cd amazon-devops-guru-rds/scripts
source ./connect.sh test 3
exit;
python3 no_index.py 50 1200 1000 10000000
  1. Once the program completes its execution, or after an hour, navigate to the Amazon DevOps Guru console, choose Insights, and then choose RDS DB Load Anomalous. Then choose Recommendations and choose View detailed analysis for database performance anomaly for the following resources. Under To view a detailed analysis, choose a resource name, choose the database associated with the third test.

Shows the detailed analysis of the database performance anomaly. The database experiencing load is chosen and a graphical representation of how the Average active sessions (AAS) spikes which Amazon DevOps Guru is able to identify.

  1. Observe the recommendations under Analysis and recommendations. It provides you with analysis, recommendations, and links to troubleshooting documentation.

Shows a different section of the detailed analysis screen that provides Analysis and recommendations and links to the troubleshooting documentation.

As with the previous examples, DevOps Guru for RDS detected a high and unusual spike of database load (in this case, ~ 50 times larger than the “typical” database load). It also identified that a single wait event, wait/io/table/sql/handler, and a single SQL, are responsible for this issue.

The analysis highlights the SQL that you must pay attention to, and it links a detailed troubleshooting document that lists the likely causes and recommended actions for the problems that you see. While it doesn’t tell you that the “missing index” is the real root cause of the issue (this is planned in future versions), it does offer many relevant details that can help you come to that conclusion yourself.

Cleanup

On your terminal where you originally ran the AWS Command Line Interface (AWS CLI) command to create the CloudFormation resources, run the following command:

aws cloudformation delete-stack --stack-name DevOpsGuru-Stack

Conclusion

In this post, you learned how to leverage DevOps Guru for RDS to alert you of any operational issues with recommendations. You simulated some of the commonly encountered, real-world production issues, such as locking contentions, AUTOCOMMIT, and missing indexes. Moreover, you saw how DevOps Guru for RDS helped you detect and resolve these issues. Try this out, and let us know how DevOps Guru for RDS was able to address your use-case.

Authors:

Kishore Dhamodaran

Kishore Dhamodaran is a Senior Solutions Architect at AWS. Kishore helps strategic customers with their cloud enterprise strategy and migration journey, leveraging his years of industry and cloud experience.

Simsek Mert

Simsek Mert is a Cloud Application Architect with AWS Professional Services.
Simsek helps customers with their application architecture, containers, serverless applications, leveraging his over 20 years of experience.

Maxym Kharchenko

Maxym Kharchenko is a Principal Database Engineer at AWS. He builds automated monitoring tools that use machine learning to discover and explain performance problems in relational databases.

Jared Keating

Jared Keating is a Senior Cloud Consultant with Amazon Web Services Professional Services. Jared assists customers with their cloud infrastructure, compliance, and automation requirements drawing from his over 20 years of experience in IT.