Tag Archives: Amazon Lookout for Metrics

AWS Week In Review – September 12, 2022

Post Syndicated from Sébastien Stormacq original https://aws.amazon.com/blogs/aws/aws-week-in-review-september-12-2022/

I am working from London, UK, this week to record sessions for the upcoming Innovate EMEA online conference—more about this in a future Week In Review. While I was crossing the channel, I took the time to review what happened on AWS last week.

Last Week’s Launches
Here are some launches that got my attention:

Seekable OCI for lazy loading container images. Seekable OCI (SOCI) is a technology open sourced by AWS that enables containers to launch faster by lazily loading the container image. SOCI works by creating an index of the files within an existing container image. This index is a key enabler to launching containers faster, providing the capability to extract an individual file from a container image before downloading the entire archive. Check out the source code on GitHub.

Amazon Lookout for Metrics now lets you filter data by dimensions and increased the limits on the number of measures and dimensions. Lookout for Metrics uses machine learning (ML) to automatically detect and diagnose anomalies (i.e., outliers from the norm) in business and operational data, such as a sudden dip in sales revenue or customer acquisition rates.

Amazon SageMaker has three new capabilities. First, SageMaker Canvas added additional capabilities to explore and analyze data with advanced visualizations. Second, SageMaker Studio now sends API user identity data to AWS CloudTrail. And third, SageMaker added TensorFlow image classification to its list of builtin algorithms.

The AWS console launches a widget to display the most recent AWS blog posts on the console landing page. Being part of the AWS News Blog team, I couldn’t be more excited about a launch this week. 😀

AW Console Blog widget

Other AWS News
Some other updates and news that you may have missed:

The Amazon Science blog published an article on the design of a pinch grasping robot. It is one of the many areas where we try to improve the efficiency of our fulfillment centers. A must-read if you’re into robotics or logistics.

The Public Sector blog has an article on how Satellogic and AWS are harnessing the power of space and cloud. Satellogic is creating a live catalog of Earth and delivering daily updates to create a complete picture of changes to our planet for decision-makers. Satellogic is generating massive volumes of data, with each of its satellites collecting an average of 50GB of data daily. They are using compute, storage, analytics, and ground station infrastructure in support of their growth.

Event Ruler is now open-source. Talking about open-source, the source code of the core rule engine built first for Amazon CloudWatch Events, and now the core of Amazon Event Bridge, is newly available on GitHub. This is a Java library that allows applications to identify events that match a set of rules. Events and rules are expressed as JSON documents. Rules are compiled for fast evaluation by a finite state engine. Read the announcement blog post to understand how Event Bridge works under the hood.

HP Anyware (formerly Teradici CAS) is now available for Amazon EC2 Mac instances, from the AWS Marketplace. HP Anyware is a remote access solution that provides pixel-perfect rendering for your remote Mac Mini running in the AWS cloud. It uses PCoIP™ to securely and efficiently access the remote macOS machines. You can connect from anywhere, using a PCoIP client application or from thin terminals such as Thin Clients or Zero Clients workstations.

Upcoming AWS Events
Check your calendars and sign up for these AWS events that are happening all over the world:

AWS Summits – Come together to connect, collaborate, and learn about AWS. Registration is open for the following in-person AWS Summits: Mexico City (September 21–22), Bogotá (October 4), and Singapore (October 6).

AWS Community DaysAWS Community Day events are community-led conferences to share and learn with one another. In September, the AWS community in the US will run events in Arlington, Virginia (September 30). In Europe, Community Day events will be held in October. Join us in Amersfoort, Netherlands (October 3), Warsaw, Poland (October 14), and Dresden, Germany (October 19).

That’s all from me for this week. Come back next Monday for another Week in Review!

— seb


This post is part of our Week in Review series. Check back each week for a quick roundup of interesting news and announcements from AWS!

Leverage DevOps Guru for RDS to detect anomalies and resolve operational issues

Post Syndicated from Kishore Dhamodaran original https://aws.amazon.com/blogs/devops/leverage-devops-guru-for-rds-to-detect-anomalies-and-resolve-operational-issues/

The Relational Database Management System (RDBMS) is a popular choice among organizations running critical applications that supports online transaction processing (OLTP) use-cases. But managing the RDBMS database comes with its own challenges. AWS has made it easier for organizations to operate these databases in the cloud, thereby addressing the undifferentiated heavy lifting with managed databases (Amazon Aurora, Amazon RDS). Although using managed services has freed up engineering from provisioning hardware, database setup, patching, and backups, they still face the challenges that come with running a highly performant database. As applications scale in size and sophistication, it becomes increasingly challenging for customers to detect and resolve relational database performance bottlenecks and other operational issues quickly.

Amazon RDS Performance Insights is a database performance tuning and monitoring feature, that lets you quickly assess your database load and determine when and where to take action. Performance Insights lets non-experts in database administration diagnose performance problems with an easy-to-understand dashboard that visualizes database load. Furthermore, Performance Insights expands on the existing Amazon RDS monitoring features to illustrate database performance and help analyze any issues that affect it. The Performance Insights dashboard also lets you visualize the database load and filter the load by waits, SQL statements, hosts, or users.

On Dec 1st, 2021, we announced Amazon DevOps Guru for RDS, a new capability for Amazon DevOps Guru. It’s a fully-managed machine learning (ML)-powered service that detects operational and performance related issues for Amazon Aurora engines. It uses the data that it collects from Performance Insights, and then automatically detects and alerts customers of application issues, including database problems. When DevOps Guru detects an issue in an RDS database, it publishes an insight in the DevOps Guru dashboard. The insight contains an anomaly for the resource AWS/RDS. If DevOps Guru for RDS is turned on for your instances, then the anomaly contains a detailed analysis of the problem. DevOps Guru for RDS also recommends that you perform an investigation, or it provides a specific corrective action. For example, the recommendation might be to investigate a specific high-load SQL statement or to scale database resources.

In this post, we’ll deep-dive into some of the common issues that you may encounter while running your workloads against Amazon Aurora MySQL-Compatible Edition databases, with simulated performance issues. We’ll also look at how DevOps Guru for RDS can help identify and resolve these issues. Simulating a performance issue is resource intensive, and it will cost you money to run these tests. If you choose the default options that are provided, and clean up your resources using the following clean-up instructions, then it will cost you approximately $15 to run the first test only. If you wish to run all of the tests, then you can choose “all” in the Tests parameter choice. This will cost you approximately $28 to run all three tests.

Prerequisites

To follow along with this walkthrough, you must have the following prerequisites:

  • An AWS account with a role that has sufficient access to provision the required infrastructure. The account should also not have exceeded its quota for the resources being deployed (VPCs, Amazon Aurora, etc.).
  • Credentials that enable you to interact with your AWS account.
  • If you already have Amazon DevOps Guru turned on, then make sure that it’s tagged properly to detect issues for the resource being deployed.

Solution overview

You will clone the project from GitHub and deploy an AWS CloudFormation template, which will set up the infrastructure required to run the tests. If you choose to use the defaults, then you can run only the first test. If you would like to run all of the tests, then choose the “all” option under Tests parameter.

We simulate some common scenarios that your database might encounter when running enterprise applications. The first test simulates locking issues. The second test simulates the behavior when the AUTOCOMMIT property of the database driver is set to: True. This could result in statement latency. The third test simulates performance issues when an index is missing on a large table.

Solution walk through

Clone the repo and deploy resources

  1. Utilize the following command to clone the GitHub repository that contains the CloudFormation template and the scripts necessary to simulate the database load. Note that by default, we’ve provided the command to run only the first test.
    git clone https://github.com/aws-samples/amazon-devops-guru-rds.git
    cd amazon-devops-guru-rds
    
    aws cloudformation create-stack --stack-name DevOpsGuru-Stack \
        --template-body file://DevOpsGuruMySQL.yaml \
        --capabilities CAPABILITY_IAM \
        --parameters ParameterKey=Tests,ParameterValue=one \
    ParameterKey=EnableDevOpsGuru,ParameterValue=y

    If you wish to run all four of the tests, then flip the ParameterValue of the Tests ParameterKey to “all”.

    If Amazon DevOps Guru is already enabled in your account, then change the ParameterValue of the EnableDevOpsGuru ParameterKey to “n”.

    It may take up to 30 minutes for CloudFormation to provision the necessary resources. Visit the CloudFormation console (make sure to choose the region where you have deployed your resources), and make sure that DevOpsGuru-Stack is in the CREATE_COMPLETE state before proceeding to the next step.

  2. Navigate to AWS Cloud9, then choose Your environments. Next, choose DevOpsGuruMySQLInstance followed by Open IDE. This opens a cloud-based IDE environment where you will be running your tests. Note that in this setup, AWS Cloud9 inherits the credentials that you used to deploy the CloudFormation template.
  3. Open a new terminal window which you will be using to clone the repository where the scripts are located.

  1. Clone the repo into your Cloud9 environment, then navigate to the directory where the scripts are located, and run initial setup.
git clone https://github.com/aws-samples/amazon-devops-guru-rds.git
cd amazon-devops-guru-rds/scripts
sh setup.sh 
# NOTE: If you are running all test cases, use sh setup.sh all command instead. 
source ~/.bashrc
  1. Initialize databases for all of the test cases, and add random data into them. The script to insert random data takes approximately five hours to complete. Your AWS Cloud9 instance is set up to run for up to 24 hours before shutting down. You can exit the browser and return between 5–24 hours to validate that the script ran successfully, then continue to the next step.
source ./connect.sh test 1
USE devopsgurusource;
CREATE TABLE IF NOT EXISTS test1 (id int, filler char(255), timer timestamp);
exit;
python3 ct.py

If you chose to run all test cases, and you ran the sh setup.sh all command in Step 4, open two new terminal windows and run the following commands to insert random data for test cases 2 and 3.

# Test case 2 – Open a new terminal window to run the commands
cd amazon-devops-guru-rds/scripts
source ./connect.sh test 2
USE devopsgurusource;
CREATE TABLE IF NOT EXISTS test1 (id int, filler char(255), timer timestamp);
exit;
python3 ct.py
# Test case 3 - Open a new terminal window to run the commands
cd amazon-devops-guru-rds/scripts
source ./connect.sh test 3
USE devopsgurusource;
CREATE TABLE IF NOT EXISTS test1 (id int, filler char(255), timer timestamp);
exit;
python3 ct.py
  1. Return between 5-24 hours to run the next set of commands.
  1. Add an index to the first database.
source ./connect.sh test 1
CREATE UNIQUE INDEX test1_pk ON test1(id);
INSERT INTO test1 VALUES (-1, 'locker', current_timestamp);
exit;
  1. If you chose to run all test cases, and you ran the sh setup.sh all command in Step 4, add an index to the second database. NOTE: Do no add an index to the third database.
source ./connect.sh test 2
CREATE UNIQUE INDEX test1_pk ON test1(id);
INSERT INTO test1 VALUES (-1, 'locker', current_timestamp);
exit;

DevOps Guru for RDS uses Performance Insights, and it establishes a baseline for the database metrics. Baselining involves analyzing the database performance metrics over a period of time to establish a “normal” behavior. DevOps Guru for RDS then uses ML to detect anomalies against the established baseline. If your workload pattern changes, then DevOps Guru for RDS establishes a new baseline that it uses to detect anomalies against the new “normal”. For new database instances, DevOps Guru for RDS takes up to two days to establish an initial baseline, as it requires an analysis of the database usage patterns and establishing what is considered a normal behavior.

  1. Allow two days before you start running the following tests.

Scenario 1: Locking Issues

In this scenario, multiple sessions compete for the same (“locked”) record, and they must wait for each other.
In real life, this often happens when:

  • A database session gets disconnected due to a (i.e., temporary network) malfunction, while still holding a critical lock.
  • Other sessions become stuck while waiting for the lock to be released.
  • The problem is often exacerbated by the application connection manager that keeps spawning additional sessions (because the existing sessions don’t complete the work on time), thus creating a distinct “inclined slope” pattern that you’ll see in this scenario.

Here’s how you can reproduce it:

  1. Connect to the database.
cd amazon-devops-guru-rds/scripts
source ./connect.sh test 1
  1. In your MySQL, enter the following SQL, and don’t exit the shell.
START TRANSACTION;
UPDATE test1 SET timer=current_timestamp WHERE id=-1;
-- Do NOT exit!
  1. Open a new terminal, and run the command to simulate competing transactions. Give it approximately five minutes before you run the commands in this step.
cd amazon-devops-guru-rds/scripts
source ./connect.sh test 1
exit;
python3 locking_scenario.py 1 1200 2
  1. After the program completes its execution, navigate to the Amazon DevOps Guru console, choose Insights, and then choose RDS DB Load Anomalous. You’ll notice a summary of the insight under Description.

Shows navigation to Amazon DevOps Guru Insights and RDS DB Load Anomalous screen to find the summary description of the anomaly.

  1. Choose the View Recommendations link on the top right, and observe the databases for which it’s showing the recommendations.
  2. Next, choose View detailed analysis for database performance anomaly for the following resources.
  3. Under To view a detailed analysis, choose a resource name, choose the database associated with the first test.

 Shows the detailed analysis of the database performance anomaly. The database experiencing load is chosen, and a graphical representation of how the Average active sessions (AAS) spikes, which Amazon DevOps Guru is able to identify.

  1. Observe the recommendations under Analysis and recommendations. It provides you with analysis, recommendations, and links to troubleshooting documentation.

Shows a different section of the detailed analysis screen that provides Analysis and recommendations and links to the troubleshooting documentation.

In this example, DevOps Guru for RDS has detected a high and unusual spike of database load, and then marked it as “performance anomaly”.

Note that the relative size of the anomaly is significant: 490 times higher than the “typical” database load, which is why it’s deemed: “HIGH severity”.

In the analysis section, note that a single “wait event”, wait/synch/mutex/innodb/aurora_lock_thread_slot_futex, is dominating the entire spike. Moreover, a single SQL is “responsible” (or more precisely: “suffering”) from this wait event at the time of the problem. Select the wait event name and see a simple explanation of what’s happening in the database. For example, it’s “record locking”, where multiple sessions are competing for the same database records. Additionally, you can select the SQL hash and see the exact text of the SQL that’s responsible for the issue.

If you’re interested in why DevOps Guru for RDS detected this problem, and why these particular wait events and an SQL were selected, the Why is this a problem? and Why do we recommend this? links will provide the answer.

Finally, the most relevant part of this analysis is a View troubleshooting doc link. It references a document that contains a detailed explanation of the likely causes for this problem, as well as the actions that you can take to troubleshoot and address it.

Scenario 2: Autocommit: ON

In this scenario, we must run multiple batch updates, and we’re using a fairly popular driver setting: AUTOCOMMIT: ON.

This setting can sometimes lead to performance issues as it causes each UPDATE statement in a batch to be “encased” in its own “transaction”. This leads to data changes being frequently synchronized to disk, thus dramatically increasing batch latency.

Here’s how you can reproduce the scenario:

  1. On your Cloud9 terminal, run the following commands:
cd amazon-devops-guru-rds/scripts
source ./connect.sh test 2
exit;
python3 batch_autocommit.py 50 1200 1000 10000000
  1. Once the program completes its execution, or after an hour, navigate to the Amazon DevOps Guru console, choose Insights, and then choose RDS DB Load Anomalous. Then choose Recommendations and choose View detailed analysis for database performance anomaly for the following resources. Under To view a detailed analysis, choose a resource name, choose the database associated with the second test.

  1. Observe the recommendations under Analysis and recommendations. It provides you with analysis, recommendations, and links to troubleshooting documentation.

Shows a different section of the detailed analysis screen that provides Analysis and recommendations and links to the troubleshooting documentation.

Note that DevOps Guru for RDS detected a significant (and unusual) spike of database load and marked it as a HIGH severity anomaly.

The spike looks similar to the previous example (albeit, “smaller”), but it describes a different database problem (“COMMIT slowdowns”). This is because of a different database wait event that dominates the spike: wait/io/aurora_redo_log_flush.

As in the previous example, you can select the wait event name to see a simple description of what’s going on, and you can select the SQL hash to see the actual statement that is slow. Furthermore, just as before, the View troubleshooting doc link references the document that describes what you can do to troubleshoot the problem further and address it.

Scenario 3: Missing index

Have you ever wondered what would happen if you drop a frequently accessed index on a large table?

In this relatively simple scenario, we’re testing exactly that – an index gets dropped causing queries to switch from fast index lookups to slow full table scans, thus dramatically increasing latency and resource use.

Here’s how you can reproduce this problem and see it for yourself:

  1. On your Cloud9 terminal, run the following commands:
cd amazon-devops-guru-rds/scripts
source ./connect.sh test 3
exit;
python3 no_index.py 50 1200 1000 10000000
  1. Once the program completes its execution, or after an hour, navigate to the Amazon DevOps Guru console, choose Insights, and then choose RDS DB Load Anomalous. Then choose Recommendations and choose View detailed analysis for database performance anomaly for the following resources. Under To view a detailed analysis, choose a resource name, choose the database associated with the third test.

Shows the detailed analysis of the database performance anomaly. The database experiencing load is chosen and a graphical representation of how the Average active sessions (AAS) spikes which Amazon DevOps Guru is able to identify.

  1. Observe the recommendations under Analysis and recommendations. It provides you with analysis, recommendations, and links to troubleshooting documentation.

Shows a different section of the detailed analysis screen that provides Analysis and recommendations and links to the troubleshooting documentation.

As with the previous examples, DevOps Guru for RDS detected a high and unusual spike of database load (in this case, ~ 50 times larger than the “typical” database load). It also identified that a single wait event, wait/io/table/sql/handler, and a single SQL, are responsible for this issue.

The analysis highlights the SQL that you must pay attention to, and it links a detailed troubleshooting document that lists the likely causes and recommended actions for the problems that you see. While it doesn’t tell you that the “missing index” is the real root cause of the issue (this is planned in future versions), it does offer many relevant details that can help you come to that conclusion yourself.

Cleanup

On your terminal where you originally ran the AWS Command Line Interface (AWS CLI) command to create the CloudFormation resources, run the following command:

aws cloudformation delete-stack --stack-name DevOpsGuru-Stack

Conclusion

In this post, you learned how to leverage DevOps Guru for RDS to alert you of any operational issues with recommendations. You simulated some of the commonly encountered, real-world production issues, such as locking contentions, AUTOCOMMIT, and missing indexes. Moreover, you saw how DevOps Guru for RDS helped you detect and resolve these issues. Try this out, and let us know how DevOps Guru for RDS was able to address your use-case.

Authors:

Kishore Dhamodaran

Kishore Dhamodaran is a Senior Solutions Architect at AWS. Kishore helps strategic customers with their cloud enterprise strategy and migration journey, leveraging his years of industry and cloud experience.

Simsek Mert

Simsek Mert is a Cloud Application Architect with AWS Professional Services.
Simsek helps customers with their application architecture, containers, serverless applications, leveraging his over 20 years of experience.

Maxym Kharchenko

Maxym Kharchenko is a Principal Database Engineer at AWS. He builds automated monitoring tools that use machine learning to discover and explain performance problems in relational databases.

Jared Keating

Jared Keating is a Senior Cloud Consultant with Amazon Web Services Professional Services. Jared assists customers with their cloud infrastructure, compliance, and automation requirements drawing from his over 20 years of experience in IT.

Build and deploy custom connectors for Amazon Redshift with Amazon Lookout for Metrics

Post Syndicated from Chris King original https://aws.amazon.com/blogs/big-data/build-and-deploy-custom-connectors-for-amazon-redshift-with-amazon-lookout-for-metrics/

Amazon Lookout for Metrics detects outliers in your time series data, determines their root causes, and enables you to quickly take action. Built from the same technology used by Amazon.com, Lookout for Metrics reflects 20 years of expertise in outlier detection and machine learning (ML). Read our GitHub repo to learn more about how to think about your data when setting up an anomaly detector.

In this post, we discuss how to build and deploy custom connectors for Amazon Redshift using Lookout for Metrics.

Introduction to time series data

You can use time series data to measure and monitor any values that shift from one point in time to another. A simple example is stock prices over a given time interval or the number of customers seen per day in a garage. You can use these values to spot trends and patterns and make better decisions about likely future events. Lookout for Metrics enables you to structure important data into a tabular format (like a spreadsheet or database table), to provide historical values to learn from, and to provide continuous values of data.

Connect your data to Lookout for Metrics

Since launch, Lookout for Metrics has supported providing data from the following AWS services:

It also supports external data sources such as Salesforce, Marketo, Dynatrace, ServiceNow, Google Analytics, and Amplitude, all via Amazon AppFlow.

These connectors all support continuous delivery of new data to Lookout for Metrics to learn to build a model for anomaly detection.

Native connectors are an effective option to get started quickly with CloudWatch, Amazon S3, and via Amazon AppFlow for the external services. Additionally, these work great for your relational database management system (RDBMS) data if you have stored your information in a singular table, or you can create a procedure to populate and maintain that table going forward.

When to use a custom connector

In cases where you want more flexibility, you can use Lookout for Metrics custom connectors. If your data is in a state that requires an extract, transform, and load (ETL) process, such as joining from multiple tables, transforming a series of values into a composite, or performing any complex postprocessing before delivering the data to Lookout for Metrics, you can use custom connectors. Additionally, if you’re starting with data in an RDBMS and you wish to provide a historical sample for Lookout for Metrics to learn from first, you should use a custom connector. This allows you to feed in a large volume of history first, bypassing the coldstart requirements and achieving a higher quality model sooner.

For this post, we use Amazon Redshift as our RDBMS, but you can modify this approach for other systems.

You should use custom connectors in the following situations:

  • Your data is spread over multiple tables
  • You need to perform more complex transformations or calculations before it fits to a detector’s configuration
  • You want to use all your historical data to train your detector

For a quicker start, you can use built-in connectors in the following situations:

  • Your data exists in a singular table that only contains information used by your anomaly detector
  • You’re comfortable using your historical data and then waiting for the coldstart period to elapse before beginning anomaly detection

Solution overview

All content discussed in this post is hosted on the GitHub repo.

For this post, we assume that you’re storing your data in Amazon Redshift over a few tables and that you wish to connect it Lookout for Metrics for anomaly detection.

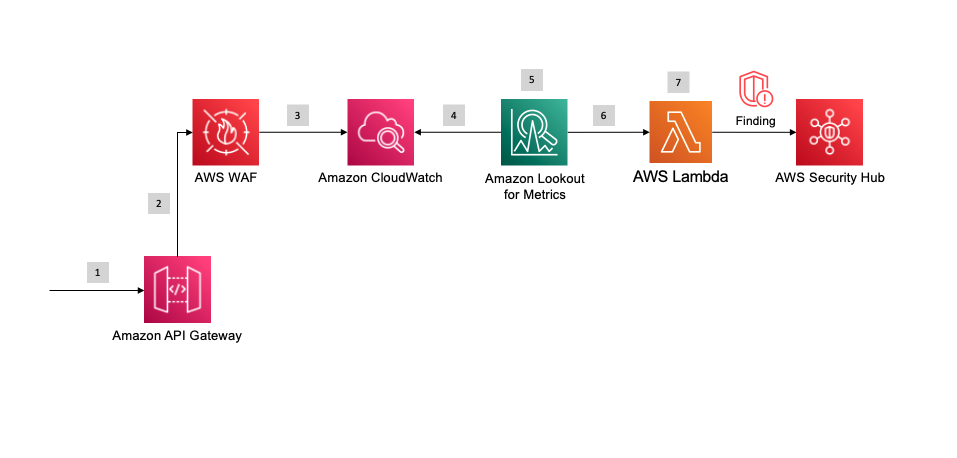
The following diagram illustrates our solution architecture.

Solution Architecture

At a high level, we start with an AWS CloudFormation template that deploys the following components:

  • An Amazon SageMaker notebook instance that deploys the custom connector solution.
  • An AWS Step Functions workflow. The first step performs a historical crawl of your data; the second configures your detector (the trained model and endpoint for Lookout for Metrics).
  • An S3 bucket to house all your AWS Lambda functions as deployed (omitted from the architecture diagram).
  • An S3 bucket to house all your historical and continuous data.
  • A CloudFormation template and Lambda function that starts crawling your data on a schedule.

To modify this solution to fit your own environment, update the following:

  • A JSON configuration template that describes how your data should look to Lookout for Metrics and the name of your AWS Secrets Manager location used to retrieve authentication credentials.
  • A SQL query that retrieves your historical data.
  • A SQL query that retrieves your continuous data.

After you modify those components, you can deploy the template and be up and running within an hour.

Deploy the solution

To make this solution explorable from end to end, we have included a CloudFormation template that deploys a production-like Amazon Redshift cluster. It’s loaded with sample data for testing with Lookout for Metrics. This is a sample ecommerce dataset that projects roughly 2 years into the future from the publication of this post.

Create your Amazon Redshift cluster

Deploy the provided template to create the following resources in your account:

  • An Amazon Redshift cluster inside a VPC
  • Secrets Manager for authentication
  • A SageMaker notebook instance that runs all the setup processes for the Amazon Redshift database and initial dataset loading
  • An S3 bucket that is used to load data into Amazon Redshift

The following diagram illustrates how these components work together.

Production Redshift Setup

We provide Secrets Manager with credential information for your database, which is passed to a SageMaker notebook’s lifecycle policy that runs on boot. Once booted, the automation creates tables inside your Amazon Redshift cluster and loads data from Amazon S3 into the cluster for use with our custom connector.

To deploy these resources, complete the following steps:

  1. Choose Launch Stack:
  2. Choose Next.
    Setup step described by text
  3. Leave the stack details at their default and choose Next again.Setup step described by text
  4. Leave the stack options at their default and choose Next again.Setup step described by text
  1. Select I acknowledge that AWS CloudFormation might create IAM resources, then Choose Create stack.Setup step described by text

The job takes a few minutes to complete. You can monitor its progress on the AWS CloudFormation console.

CloudFormation Status

When the status changes to CREATE_COMPLETE, you’re ready to deploy the rest of the solution.

Stack Complete

Data structure

We have taken our standard ecommerce dataset and split it into three specific tables so that we can join them later via the custom connector. In all probability, your data is spread over various tables and needs to be normalized in a similar manner.

The first table indicates the user’s platform, (what kind of device users are using, such as phone or web browser).

ID Name
1 pc_web

The next table indicates our marketplace (where the users are located).

ID Name
1 JP

Our ecommerce table shows the total values for views and revenue at this time.

ID TS Platform Marketplace Views Revenue
1 01/10/2022 10:00:00 1 1 90 2458.90

When we run queries later in this post, they’re against a database with this structure.

Deploy a custom connector

After you deploy the previous template, complete the following steps to deploy a custom connector:

  1. On the AWS CloudFormation console, navigate to the Outputs tab of the template you deployed earlier.
    Outputs Link
  2. Note the value of RedshiftCluster and RedshiftSecret, then save them in a temporary file to use later.
    Output Values
  3. Choose Launch stack to deploy your resources with AWS CloudFormation:
  4. Choose Next.
    CloudFormation Setup
  5. Update the value for the RedshiftCluster and RedshiftSecret with the information you copied earlier.
  6. Choose Next.CloudFormation Setup
  7. Leave the stack options at their default and choose Next.Cloudformation Setup
  8. Select I acknowledge that AWS CloudFormation might create IAM resources, then choose Create stack.Cloudformation Setup

The process takes 30–40 minutes to complete, after which you have a fully deployed solution with the demo environment.

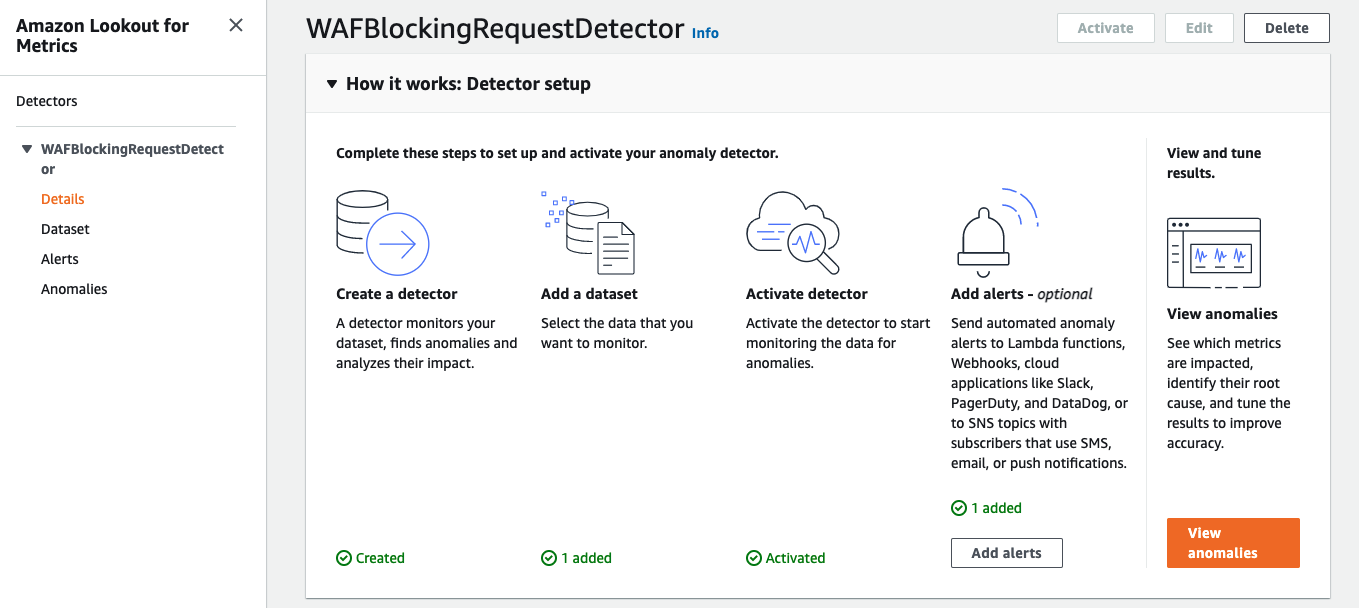
View your anomaly detector

After you deploy the solution, you can locate your detector and review any found anomalies.

  1. Sign in to the Lookout for Metrics console in us-east-1.
  2. In the navigation pane, choose Detectors.Lookout for Metrics Detectors Link

The Detectors page lists all your active detectors.

  1. Choose the detector l4m-custom-redshift-connector-detector.

Now you can view your detector’s configuration, configure alerts, and review anomalies.

To view anomalies, either choose Anomalies in the navigation page or choose View anomalies on the detector page.
View Anomalies Link

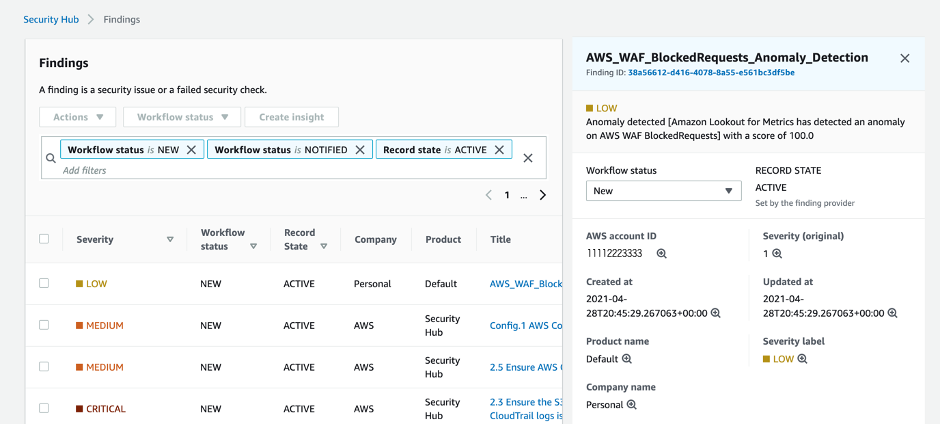
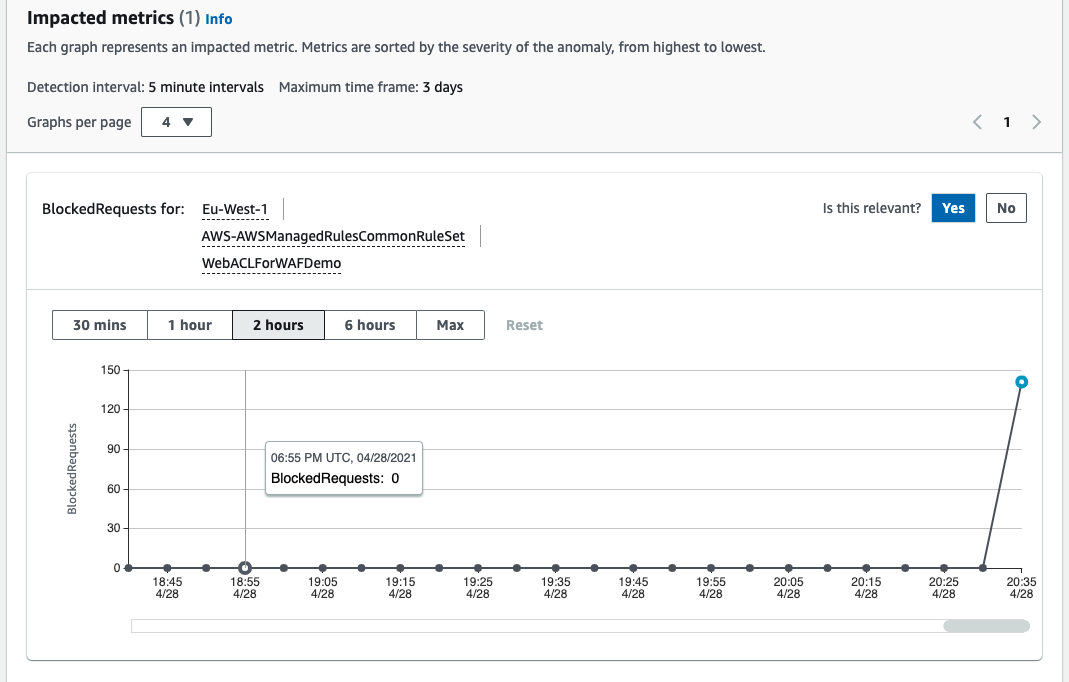
After a period of time, usually no more than a few days, you should see a list of anomalies on this page. You can explore them in depth to view how the data provided seemed anomalous. If you provided your own dataset, the anomalies may only show up after an unusual event.

Anomalies List

Now that you have the solution deployed and running, let’s discuss how this connector works in depth.

How a custom connector works

In this section, we discuss the connector’s core components. We also demonstrate how to build a custom connector, authenticate to Amazon Redshift, modify queries, and modify the detector and dataset.

Core components

You can run the following components and modify them to support your data needs:

When you deploy ai_ops/l4m-redshift-solution.yaml, it creates the following:

  • An S3 bucket for storing all Lambda functions.
  • A role for a SageMaker notebook that has access to modify all relevant resources.
  • A SageMaker notebook lifecycle config that contains the startup script to clone all automation onto the notebook and manage the params.json file. And runs the shell script (ai_ops/deploy_custom_connector.sh) to deploy the AWS SAM applications and further update the params.json file.

ai_ops/deploy_custom_connector.sh starts by deploying ai_ops/template.yaml, which creates the following:

  • An S3 bucket for storing the params.json file and all input data for Lookout for Metrics.
  • An S3 bucket policy to allow Lookout for Metrics to communicate with Amazon S3.
  • A Lambda function that is invoked on the bucket when the params.json file is uploaded and starts the Step Functions state machine.
  • An AWS Identity and Access Management (IAM) role to run the state machine.
  • A shared Lambda layer of support functions.
  • A role for Lookout for Metrics to access data in Amazon S3.
  • A Lambda function to crawl all historical data.
  • A Lambda function to create and activate a Lookout for Metrics detector.
  • A state machine that manages the flow between creating that historical dataset and the detector.

After ai_ops/deploy_custom_connector.sh creates the first batch of items, it updates the params.json file with new relevant information from the detector and the IAM roles. It also modifies the Amazon Redshift cluster to allow the new role for Lookout for Metrics to communicate with the cluster. After sleeping for 30 seconds to facilitate IAM propagation, the script copies the params.json file to the S3 bucket, which invokes the state machine deployed already.

Then the script deploys another AWS SAM application defined in l4m-redshift-continuous-crawl.yaml. This simple application defines and deploys an event trigger to initiate the crawling of live data on a schedule (hourly for example) and a Lambda function that performs the crawl.

Both the historical crawled data and the continuously crawled data arrives in the same S3 bucket. Lookout for Metrics uses the information first for training, then as inference data, where it’s checked for anomalies as it arrives.

Each Lambda function also contains a query.sql file that provides the base query that is handed to Amazon Redshift. Later the functions append UNLOAD to each query and deliver the data to Amazon S3 via CSV.

Build a custom connector

Start by forking this repository into your own account or downloading a copy for private development. When making substantial changes, make sure that the references to this particular repository in the following files are updated and point to publicly accessible endpoints for Git:

  • README.md – This file, in particular the Launch stack buttons, assumes you’re using the live version you see in this repository only
  • ai_ops/l4m-redshift-solution.yaml – In this template, a Jupyter notebook lifecycle configuration defines the repository to clone (deploys the custom connector)
  • sample_resources/redshift/l4m-redshift-sagemakernotebook.yaml – In this template, a Amazon SageMaker Notebook lifecycle configuration defines the repository to clone (deploys the production Amazon Redshift example).

Authenticate to Amazon Redshift

When exploring how to extend this into your own environment, the first thing to consider is the authentication to your Amazon Redshift cluster. You can accomplish this by using the Amazon Redshift Data API and by storing the credentials inside AWS Secrets Manager.

In Secrets Manager, this solution looks for the known secret name redshift-l4mintegration and contains a JSON structure like the following:

{
  "password": "DB_PASSWORD",
  "username": "DB_USERNAME",
  "dbClusterIdentifier": "REDSHIFT_CLUSTER_ID",
  "db": "DB_NAME",
  "host": "REDSHIFT_HOST",
  "port": 8192
}

If you want to use a different secret name than the one provided, you need to update the value in ai_ops/l4m-redshift-solution.yaml. If you want to change the other parameters’ names, you need to search for them in the repository and update their references accordingly.

Modify queries to Amazon Redshift

This solution uses the Amazon Redshift Data API to allow for queries that can be run asynchronously from the client calling for them.

Specifically, it allows a Lambda function to start a query with the database and then let the DB engine manage everything, including the writing of the data in a desired format to Amazon S3. Because we let the DB engine handle this, we simplify the operations of our Lambda functions and don’t have to worry about runtime limits. If you want to perform more complex transformations, you may want to build out more Step Functions-based AWS SAM applications to handle that work, perhaps even using Docker containers over Lambda.

For most modifications, you can edit the query files stored in the two Lambda functions provided:

Pay attention to the continuous crawl to make sure that the date ranges coincide with your desired detection interval. For example:

select ecommerce.ts as timestamp, ecommerce.views, ecommerce.revenue, platform.name as platform, marketplace.name as marketplace
from ecommerce, platform, marketplace
where ecommerce.platform = platform.id
	and ecommerce.marketplace = marketplace.id
    and ecommerce.ts < DATEADD(hour, 0, getdate())
    and ecommerce.ts > DATEADD(hour, -1, getdate())

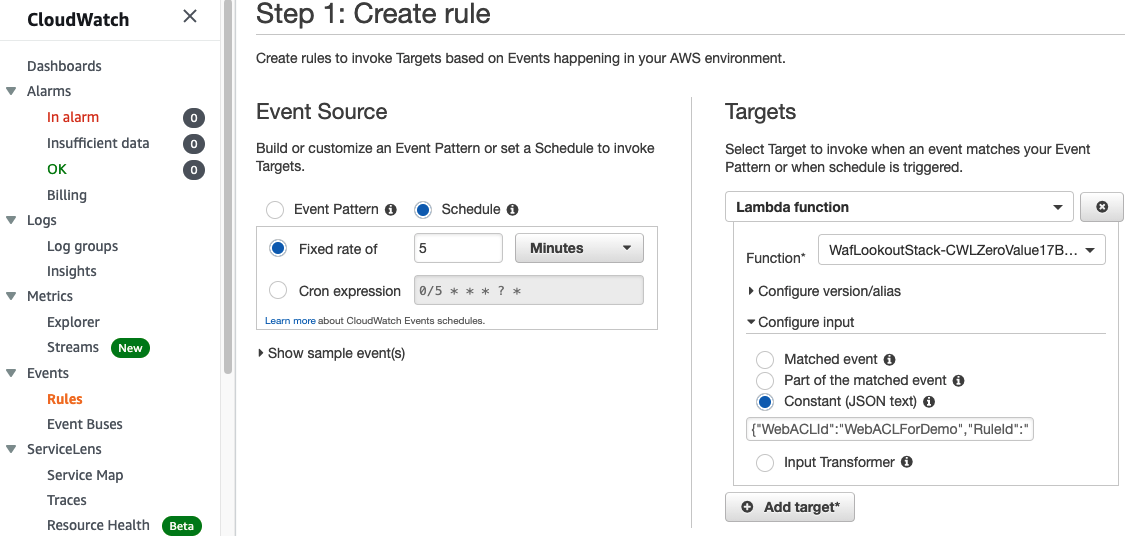
The preceding code snippet is our demo continuous crawl function and uses the DATEADD function to compute data within the last hour. Coupled with the CloudWatch Events trigger that schedules this function for hourly, it allows us to stream data to Lookout for Metrics reliably.

The work defined in the query.sql files is only a portion of the final computed query. The full query is built by the respective Python files in each folder and appends the following:

  • IAM role for Amazon Redshift to use for the query
  • S3 bucket information for where to place the files
  • CSV file export defined

It looks like the following code:

unload ('select ecommerce.ts as timestamp, ecommerce.views, ecommerce.revenue, platform.name as platform, marketplace.name as marketplace
from ecommerce, platform, marketplace
where ecommerce.platform = platform.id
	and ecommerce.marketplace = marketplace.id
    and ecommerce.ts < DATEADD(hour, 0, getdate())
    and ecommerce.ts > DATEADD(hour, -1, getdate())') 
to 's3://BUCKET/ecommerce/live/20220112/1800/' 
iam_role 'arn:aws:iam::ACCOUNT_ID:role/custom-rs-connector-LookoutForMetricsRole-' header CSV;

As long as your prepared query can be encapsulated by the UNLOAD statement, it should work with no issues.

If you need to change the frequency for how often the continuous detector function runs, update the cron expression in ai_ops/l4m-redshift-continuous-crawl.yaml. It’s defined in the last line as Schedule: cron(0 * * * ? *).

Modify the Lookout for Metrics detector and dataset

The final components focus on Lookout for Metrics itself, mainly the detector and dataset configurations. They’re both defined in ai_ops/params.json.

The included file looks like the following code:

{
  "database_type": "redshift",  
  "detector_name": "l4m-custom-redshift-connector-detector",
    "detector_description": "A quick sample config of how to use L4M.",
    "detector_frequency": "PT1H",
    "timestamp_column": {
        "ColumnFormat": "yyyy-MM-dd HH:mm:ss",
        "ColumnName": "timestamp"
    },
    "dimension_list": [
        "platform",
        "marketplace"
    ],
    "metrics_set": [
        {
            "AggregationFunction": "SUM",
            "MetricName": "views"
        },
        {
            "AggregationFunction": "SUM",
            "MetricName": "revenue"
        }
    ],
    "metric_source": {
        "S3SourceConfig": {
            "FileFormatDescriptor": {
                "CsvFormatDescriptor": {
                    "Charset": "UTF-8",
                    "ContainsHeader": true,
                    "Delimiter": ",",
                    "FileCompression": "NONE",
                    "QuoteSymbol": "\""
                }
            },
            "HistoricalDataPathList": [
                "s3://id-ml-ops2-inputbucket-18vaudty8qtec/ecommerce/backtest/"
            ],
            "RoleArn": "arn:aws:iam::ACCOUNT_ID:role/id-ml-ops2-LookoutForMetricsRole-IZ5PL6M7YKR1",
            "TemplatedPathList": [
                    ""
                ]
        }
    },
    "s3_bucket": "",
    "alert_name": "alerter",
    "alert_threshold": 1,
    "alert_description": "Exports anomalies into s3 for visualization",
    "alert_lambda_arn": "",
    "offset": 300,
    "secret_name": "redshift-l4mintegration"
}

ai_ops/params.json manages the following parameters:

  • database_type
  • detector_name
  • detector_description
  • detector_frequency
  • timestamp_column and details
  • dimension_list
  • metrics_set
  • offset

Not every value can be defined statically ahead of time; these are updated by ai_ops/params_builder.py:

  • HistoricalDataPathList
  • RoleArn
  • TemplatedPathList
  • s3_bucket

To modify any of these entities, update the file responsible for them and your detector is modified accordingly.

Clean up

Follow the steps in this section to clean up all resources created by this solution and make sure you’re not billed after evaluating or using the solution.

  1. Empty all data from the S3 buckets that were created from their respective templates:
    1. ProductionRedshiftDemoS3ContentBucket
    2. CustomRedshiftConnectorS3LambdaBucket
    3. custom-rs-connectorInputBucket
  2. Delete your detector via the Lookout for Metrics console.
  3. Delete the CloudFormation stacks in the following order (wait for one to complete before moving onto the next):
    1. custom-rs-connector-crawl
    2. custom-rs-connector
    3. CustomRedshiftConnector
    4. ProductionRedshiftDemo

Conclusion

You have now seen how to connect an Amazon Redshift database to Lookout for Metrics using the native Amazon Redshift Data APIs, CloudWatch Events, and Lambda functions. This approach allows you to create relevant datasets based on your information in Amazon Redshift to perform anomaly detection on your time series data in just a few minutes. If you can draft the SQL query to obtain the information, you can enable ML-powered anomaly detection on your data. From there, your anomalies should showcase anomalous events and help you understand how one anomaly may be caused or impacted by others, thereby reducing your time to understanding issues critical to your business or workload.


About the Authors

Chris King is a Principal Solutions Architect in Applied AI with AWS. He has a special interest in launching AI services and helped grow and build Amazon Personalize and Amazon Forecast before focusing on Amazon Lookout for Metrics. In his spare time he enjoys cooking, reading, boxing, and building models to predict the outcome of combat sports.

Alex Kim is a Sr. Product Manager for Amazon Forecast. His mission is to deliver AI/ML solutions to all customers who can benefit from it. In his free time, he enjoys all types of sports and discovering new places to eat.

Automating Anomaly Detection in Ecommerce Traffic Patterns

Post Syndicated from Aditya Pendyala original https://aws.amazon.com/blogs/architecture/automating-anomaly-detection-in-ecommerce-traffic-patterns/

Many organizations with large ecommerce presences have procedures to detect major anomalies in their user traffic. Often, these processes use static alerts or manual monitoring. However, the ability to detect minor anomalies in traffic patterns near real-time can be challenging. Early detection of these minor anomalies in ecommerce traffic (such as website page visits and order completions) helps organizations take corrective actions to address issues. This decreases negative impacts to business key performance indicators (KPIs).

In this blog post, we will demonstrate an artificial intelligence/machine learning (AI/ML) solution using AWS services. We’ll show how Amazon Kinesis and Amazon Lookout for Metrics can be used to detect major and minor anomalies near-real time, based on historical and current traffic trends.

The inconsistency of ecommerce traffic

The ecommerce traffic (and number of orders placed) varies based on season, month, date, and time of day. For example, ecommerce websites experience high traffic during weekday evening hours, compared to morning hours. Similarly, there is a spike in web traffic on weekends, compared to weekdays. However, the ecommerce traffic on holiday events (for example, Black Friday, Cyber Monday) does not follow this trend. Due to such dynamic and varying patterns, detecting minor anomalies in user traffic near-real time becomes difficult.

We need a smart solution that can detect the smallest deviation in user traffic based on historical data (date and time). As you can imagine, programming these trends based on static rules is time-intensive. In the next section, we discuss a solution that can help organizations automate and detect minor (and major) anomalies while still accounting for varying traffic trends.

The components of our anomaly detection solution

The architecture consists of three functional components:

  • The ecommerce application that customers use for interaction
  • The data ingesting, transforming, and storage platform
  • Anomaly detection and notification

This solution automates data ingestion and anomaly detection, and provides a graphical user interface to interact, tweak, and filter anomalies based on severity.

Figure 1 illustrates the architecture of this solution:

Figure 1. Architecture diagram of an anomaly detection solution for ecommerce traffic

Figure 1. Architecture diagram of an anomaly detection solution for ecommerce traffic

Let’s look at the individual components of this architecture before reviewing the overall solution.

The ecommerce application that customers use for interaction 

A customer’s journey of purchasing a product online involves user actions that include:

  • Searching for and viewing the product on the “Product Display Page” (PDP)
  • Adding to the “cart”
  • Completing the purchase on the “checkout“ page

The traffic on these pages is broken down into chunks based on time intervals. These serve as the data points that we can use to understand traffic patterns.

The data ingesting, transforming, and storage platform

Ecommerce applications generate data in multiple formats and in different volumes. This data must be fed into a streaming platform that can ingest and collect data continuously. Typically, the data must be transformed and stored for analysis and machine learning purposes. To satisfy these requirements, we will use Amazon Kinesis Data Streams as a streaming platform for data ingestion. Amazon Kinesis Data Firehose with AWS Lambda can transform the data. And we’ll store the data in Amazon Simple Storage Service (S3).

Anomaly detection and notification in near-real time

Once our data is ready, we must analyze it near-real time to identify anomalies. We must notify the concerned team about this anomaly so that they can take necessary corrective actions, if needed. We will use Lookout for Metrics and Amazon Simple Notification Service (SNS) to satisfy these requirements.

Lookout for Metrics can detect and diagnose anomalies in traffic patterns using ML. Amazon Lookout for Metrics accepts feedback on detected anomalies and tunes the results to improve accuracy over time. Lookout for Metrics is also capable of integrating with Amazon SNS, which can send notifications via SMS, mobile push, and emails.

Monitoring ecommerce traffic with Lookout for Metrics

As shown in Figure 1, data from user traffic and user interactions with the ecommerce application is captured as a function of time, and ingested into Kinesis Data Streams. Using Kinesis Data Firehose and Lambda, data is transformed and stored in an S3 bucket. We then create a detector in Lookout for Metrics and use the S3 bucket as the data source. Because of seamless integration between S3 and Lookout for Metrics, data from S3 bucket is automatically ingested into the detector we created.

Once the detector is activated, Lookout for Metrics will start monitoring the data for anomalies, and start identifying the anomalies near-real time. Lookout for Metrics also provides a mechanism to adjust severity threshold on a scale of 0-100, which will help decrease false positives as much as desired. In addition, it integrates with SNS, and can publish notifications to an SNS Topic. An email/ SMS or mobile push subscription can be created on this topic, which will notify users about any current anomalies.

 Conclusion

In this post, we discussed how minor anomalies are hard to detect near-real time in ecommerce traffic of organizations. We also discussed the services that can be used to monitor these anomalies, such as Lookout for Metrics. Use this architecture to help you monitor, detect anomalies in near-real time, and reduce any negative impact to your business KPIs.

For further reading:

How to improve visibility into AWS WAF with anomaly detection

Post Syndicated from Cyril Soler original https://aws.amazon.com/blogs/security/how-to-improve-visibility-into-aws-waf-with-anomaly-detection/

When your APIs are exposed on the internet, they naturally face unpredictable traffic. AWS WAF helps protect your application’s API against common web exploits, such as SQL injection and cross-site scripting. In this blog post, you’ll learn how to automatically detect anomalies in the AWS WAF metrics to improve your visibility into AWS WAF activity, identify malicious activity, and simplify your investigations. The service that this solution uses to detect anomalies is Amazon Lookout for Metrics.

Lookout for Metrics is a service you can use to monitor business or operational metrics such as successful or failed HTTP requests and detect anomalies by using machine learning (ML). You can configure Lookout for Metrics to monitor different data sources that contain AWS WAF metrics, including Amazon CloudWatch. Lookout for Metrics can also take actions such as publishing findings in AWS Security Hub.

Solution overview

The solution in this blog post uses Amazon API Gateway to serve a simple REST API. AWS WAF protects API Gateway with AWS Managed Rules for AWS WAF. Amazon Lookout for Metrics actively detects unusual patterns in AWS WAF rule actions and sends a finding to Security Hub when suspicious activity is detected. Figure 1 shows the solution architecture.

Because AWS WAF integrates with Application Load Balancer, Amazon CloudFront distributions, or AWS AppSync GraphQL APIs, this solution also applies to these services.
 

Figure 1: Solution architecture

Figure 1: Solution architecture

The workflow of the solution is as follows:

  1. An HTTP request reaches the API Gateway endpoint.
  2. AWS WAF analyzes the HTTP request using the configured rules.
  3. Amazon CloudWatch collects action metrics for each rule that is configured in AWS WAF.
  4. Amazon Lookout for Metrics monitors CloudWatch metrics, selects the best ML algorithm, and trains the ML model.
  5. Lookout for Metrics detects outliers and provides a severity score to diagnose the issue.
  6. Lookout for Metrics invokes an AWS Lambda function when an anomaly is detected.
  7. The Lambda function sends a finding to Security Hub for further analysis.

Let’s take a detailed look at the AWS services that you will use in this solution.

Amazon API Gateway

Amazon API Gateway is a serverless API management service that supports mock integrations for API methods. This is the easiest and the most cost-effective way to implement this solution. But you can also use Amazon CloudFront, AWS AppSync GraphQL API, and Application Load Balancer to implement this solution in your workload.

AWS WAF

AWS WAF is a web application firewall you can associate with API Gateway for REST APIs, Amazon CloudFront, AWS AppSync for GraphQL API, or Application Load Balancer. AWS WAF is integrated with other AWS services such as CloudWatch. AWS WAF uses rules to detect common web exploits in the incoming HTTP requests. You can configure your own rules, or use managed rulesets from AWS or from a third-party vendor. In this solution, you use AWS Managed Rules, which contains the CrossSiteScripting_QUERYARGUMENTS rule.

Amazon CloudWatch

Amazon CloudWatch is a monitoring and observability service. CloudWatch receives specific metrics from AWS WAF every 5 minutes. In particular, for each AWS WAF rule, CloudWatch provides PassedRequests, BlockedRequests, and CountedRequests metrics.

Amazon Lookout for Metrics

Amazon Lookout for Metrics uses machine learning (ML) algorithms to automatically detect and diagnose anomalies in your metrics. By using CloudWatch metrics as a data source for Lookout for Metrics, you can apply one of the Lookout for Metrics ML models to detect anomalies in a faster way. In addition, you can provide feedback on detected anomalies to help improve the model accuracy over time. Lookout for Metrics is available in the US East (Ohio), US East (N. Virginia), US West (Oregon), Asia Pacific (Singapore), Asia Pacific (Sydney), Asia Pacific (Tokyo), Europe (Frankfurt), Europe (Ireland), and Europe (Stockholm) AWS Regions.

AWS Lambda

In this solution, you use an AWS Lambda function as an alert mechanism for Lookout for Metrics. When the machine learning model detects an outlier, it invokes the Lambda function, which implements a custom code. The Lambda function then imports the anomaly as a finding to Security Hub.

AWS Security Hub

In this solution, you use AWS Security Hub as a centralized way to manage security findings. This integration has the advantage of providing a common place for the security team to diagnose security findings from various sources, and uniformly integrates with your existing Security Information and Event Management (SIEM) system.

Prerequisites

This solution uses Security Hub to collect anomaly detection findings. Before you deploy the solution, you need to enable Security Hub in your AWS account by following the instructions provided in to enable Security Hub manually. After you enable Security Hub, you can optionally select the security standards that are relevant for your workload, as shown in Figure 2.
 

Figure 2: Manually enabling Security Hub in the AWS Management Console

Figure 2: Manually enabling Security Hub in the AWS Management Console

Deploy the solution

A ready-to-use solution is provided as an AWS Cloud Development Kit (AWS CDK) application in the AWS WAF Anomaly Detection CDK project GitHub code repository. You can clone the GitHub repository and deploy the application by using the AWS CDK for Python.

Important: After you successfully deploy the solution, you should activate the Lookout for Metrics detector. This is not done as part of the CDK deployment. To activate the detector, in the AWS Management Console navigate to Amazon Lookout for Metrics, select the detector the solution created (WAFBlockingRequestDetector), and choose Activate. Alternatively, you can use the following AWS command to activate your detector.

aws lookoutmetrics activate-anomaly-detector --anomaly-detector-arn arn:aws:lookoutmetrics:<REGION_ID>:<ACCOUNT_ID>:AnomalyDetector:WAFBlockingRequestDetector

If you don’t want to run the CDK application, you can implement the same solution by using the AWS Management Console. In the following sections, I’ll go through the manual steps you can follow to achieve this.

Create an API to demonstrate the solution

First, you need an HTTP endpoint to protect. AWS WAF is integrated with CloudFront, Application Load Balancer, API Gateway, and AWS AppSync GraphQL API. In this blog post, I recommend a REST API Gateway because it’s a fully managed service to create and manage APIs. In addition, API Gateway provides a mechanism to implement mock APIs.

To build a REST API, follow the instructions for creating a REST API in Amazon API Gateway. After you create the API, create a GET method at the API root level and associate it to a mock endpoint, as shown in Figure 3. This is just enough to return an HTTP 200 status code to any GET requests.
 

Figure 3: Creating an API with mock integration

Figure 3: Creating an API with mock integration

Finally, deploy the API under the “prod” stage and keep all the default settings.

Create an AWS WAF web ACL to deploy the managed rules

Now that you’ve created an API in API Gateway, you need to create an AWS WAF web access control list (web ACL) by following the instructions in Creating a web ACL. A web ACL is the top-level configuration object of AWS WAF. This is the collection of AWS WAF rules that you will apply to your API. API Gateway is a regional service, so make sure to create a web ACL in the same AWS Region as the API. After you create the web ACL, add the Core rule set (CRS) rule group from AWS Managed Rules, also called AWSManagedRulesCommonRuleSet, as shown in Figure 4. This rule group contains the CrossSiteScripting_QUERYARGUMENTS rule, which you will use later to demonstrate the anomaly detection.
 

Figure 4: Adding AWSManagedRulesCommonRuleSet to the AWS WAF web ACL

Figure 4: Adding AWSManagedRulesCommonRuleSet to the AWS WAF web ACL

By observing Web ACL rule capacity units used, you can see that the Core rule set is consuming 700 web ACL capacity units (WCUs). The maximum capacity for a web ACL is 1,500, which is sufficient for most use cases. If you need more capacity, contact the AWS Support Center.

Associate the web ACL with the API deployment

After you create the web ACL, you associate it with the API. To do this, in the AWS WAF console, navigate to the web ACL you just created. On the Associated AWS resources tab, choose Add AWS resources. When prompted, choose the API you created earlier, and then choose Add.
 

Figure 5: Associating the web ACL with the API

Figure 5: Associating the web ACL with the API

Create a Lambda function to forward the anomaly to Security Hub

It’s useful to get visibility into the anomalies that are detected by the solution, and there are various ways to do that. In this solution, you provide such visibility as findings to Security Hub. Security Hub provides a centralized place to manage different findings from your AWS solutions. It also provides graphical tools to help with diagnostics.

You use a Lambda function that receives each anomaly and imports them into Security Hub. You can find the lookout_alarm Lambda function on GitHub, or follow the instructions to build a Lambda function with Python. You will use this Lambda function to provide additional context enrichment in the finding.

import boto3

securityHub = boto3.client('securityhub')

def lambda_handler(event, context):
    # submit the finding to Security Hub
    result = securityHub.batch_import_findings(Findings = [...])

Before you use this Lambda function, make sure you enable Security Hub.

Create the Lookout for Metrics detector, dataset, and alarm

Now you have an API that is protected by an AWS WAF web ACL. You also have configured a way to integrate with Security Hub through a Lambda function. The next step is to create a Lookout for Metrics detector and connect all these elements together. The key concepts and terminology of Lookout for Metrics are:

  • Detector – A Lookout for Metrics resource that monitors a dataset and identifies anomalies.
  • Dataset – The detector’s copy of the data that Lookout for Metrics is analyzing.
  • Alert – A mechanism to send a notification or initiate a processing workflow when the detector finds an anomaly.

First, follow the instructions to create a detector. The only information you need to provide is a name and an interval. The interval is the amount of time between two analyses. Your choice of the interval depends upon criteria such as the metrics you are processing, or the retention time of your data. For more information on the detector interval, see Lookout for Metrics quotas. In the example in Figure 6, I chose an interval of 5 minutes, which is the minimum.
 

Figure 6: Creating an Amazon Lookout for Metrics detector

Figure 6: Creating an Amazon Lookout for Metrics detector

After you create the detector, follow the instructions to configure a dataset that uses CloudWatch as a data source. Select Create a role in the service role, choose Next, and enter the following parameters:

  • For the CloudWatch namespace, choose AWS/WAFV2.
  • For Dimensions, choose Region, Rule, and WebACL.
  • For Measure, choose BlockedRequests.
  • For Aggregation function, choose SUM.

Figure 7 shows the data source fields that the detector will check for anomalies.
 

Figure 7: Creating an Amazon Lookout for Metrics dataset

Figure 7: Creating an Amazon Lookout for Metrics dataset

Next, create a Lookout for Metrics alert to invoke the Lambda function. To do so, follow the instructions for working with alerts. You provide a name, a channel (the Lambda function), and a severity threshold. One of the main advantages of Lookout for Metrics is the scoring of the detected anomaly, which indicates the severity. Anomalies have a score from 0 to 100. You can set up different alerts with different thresholds that are associated to the same detector. This way, you can provide alerts for different severity levels. In the example in Figure 8, I created a single alert with a severity threshold of 10.
 

Figure 8: Creating an Amazon Lookout for Metrics alert

Figure 8: Creating an Amazon Lookout for Metrics alert

The last steps are to activate the detector and configure Lookout for Metrics to select a ML model and train it. To do so, choose Activate on the detector details page.
 

Figure 9: Activating the Amazon Lookout for Metrics detector

Figure 9: Activating the Amazon Lookout for Metrics detector

Why does this solution use Lookout for Metrics anomaly detection?

Amazon CloudWatch offers native anomaly detection on a given metric. This function is useful to apply statistical and ML algorithms that continuously analyze metrics, determine normal baselines, and identify anomalies with minimal user intervention.

Lookout for Metrics provides a more sophisticated version of anomaly detection, which makes it the better choice for this solution. Lookout for Metrics automatically supports a collection of ML algorithms. For example, no one algorithm works for all kinds of data, so Lookout for Metrics inspects the data and applies the right ML algorithm to the right data to accurately detect anomalies. In addition, Lookout for Metrics groups concurrent anomalies into logical groups, and sends a single alert for the anomaly group rather than separate alerts, so you can see the full picture. Finally, Lookout for Metrics allows you to provide feedback on the detected anomalies, which AWS uses to continuously improve the accuracy and performance of the models.

Publish the value zero in CloudWatch metrics

The reporting criteria for AWS WAF metrics is a nonzero value. This means that the BlockedRequests metric isn’t updated if AWS WAF isn’t blocking any requests. In the absence of real HTTP traffic, typically in a testing environment, the value zero must be published. In production, because AWS WAF is actively blocking illegitimate requests, this publication is not required. To train the ML model in the absence of blocked requests, you need to publish the value zero by calling the PutMetricData CloudWatch API method every 5 minutes.

In my example, I selected a 5-minute period to be aligned with the Lookout for Metrics interval. It’s possible to publish a zero value every five minutes by using the CloudWatch metrics API, as shown following. The zero value doesn’t impact the SUM and ensures that at least one value is published every five minutes. You can use the cloudwatch_zero Lambda function on GitHub to publish the value zero by using the AWS SDK for Python.

import boto3

cloudwatch = boto3.client('cloudwatch')

def lambda_handler(event, context):

    result = cloudwatch.put_metric_data(
        Namespace='AWS/WAFV2',
        MetricData=[{
                'MetricName': 'BlockedRequests',
                'Dimensions': [...],
                'Value': 0
        }]
    )

To create a CloudWatch Events rule to schedule the call every 5 minutes

  1. Navigate to the CloudWatch Event console and choose Create Rule.
  2. Choose Schedule, keep the 5-minute default interval, and choose Add target.
  3. Select the name of the function you previously created, expand the Configure input section.
  4. Choose Constant (JSON text), as shown in Figure 10. In the text field, paste the following configuration:
    {"WebACLId":"WebACLForWAFDemo","RuleId":"AWS-AWSManagedRulesCommonRuleSet"}
    

  5. Choose Configure details.
  6. Enter a name for your rule, and then choose Create rule.


Figure 10: Creating a CloudWatch Events rule scheduled every 5 minutes

Figure 10: Creating a CloudWatch Events rule scheduled every 5 minutes

Training time

Before the activated detector attempts to find anomalies, it uses data from several intervals to learn. If no historical data is available, the training process takes approximately one day for a five-minute interval. When you first deploy this solution, you have no historical data in CloudWatch for your AWS WAF resources, and you’re facing a cold start of Lookout for Metrics anomaly detection. Because the Lookout for Metrics detector interval is set to 5 minutes, you have to wait for 25 hours before being able to detect an anomaly. If you deploy the solution against an AWS WAF resource that’s been in production for days, you’ll have a reduced training time.

Test the anomaly detection

After 25 hours, Lookout for Metrics correctly selects an ML model that fits your metrics behavior, and correctly trains it based on your actual data. You can then start to test the anomaly detection. You can use a simple curl command, injecting a JavaScript alert() call in a query parameter as described in the AWS WAF documentation, to invoke the CrossSiteScripting_QUERYARGUMENTS managed rule. Make sure to inject a significant number of requests to ensure detection of blocked requests anomalies.

for i in {1..150}
do
  curl https://<api_gateway_endpoint>?test=%3Cscript%3Ealert%28%22hello%22%29%3C%2Fscript%3E
done

After you run the injection script, wait for the system to detect the anomaly. The CloudWatch BlockedRequests metric takes up to 5 minutes to update, and Lookout for Metrics is configured to detect anomalies in the CloudWatch data every 5 minutes. For those reasons, it can take 10 minutes to detect the simulated anomaly.

After detection and processing time, the finding is visible in Security Hub. To view the finding, go to the AWS Management Console, choose Services, choose Security Hub, and then choose Findings.
 

Figure 11: AWS Security Hub findings

Figure 11: AWS Security Hub findings

In Figure 11, you can see the new finding, coming from Lookout for Metrics, with a Low severity and an anomaly score of 100. You can use the remediation field to open the Lookout for Metrics console, where you can give feedback on the anomaly detection to improve the model for future detections.
 

Figure 12: Lookout for Metrics console, Finding view

Figure 12: Lookout for Metrics console, Finding view

Figure 12 shows the Lookout for Metrics graphical interface, where you can see the metrics related to the finding. The previous injection script impacted only one metric, but the same setup works to observe anomalies that arise between two or more metrics together. This feature makes diagnosis of issues easier.

For each of the impacted metrics, to confirm that the anomaly is relevant, choose the Yes button next to Is this relevant? above the graph.

Extend the solution

The solution in this post detects anomalies in the AWS WAF blocked request behavior. But you can also configure AWS WAF rule actions to count your requests instead of blocking them. This is usually done on legacy systems or for some particular rules of a managed ruleset that present an incompatibility with your workload. When you configure the rule action as a count, you increase the need for a comprehensive observability approach. By implementing anomaly detection against counted requests, this solution will help you to achieve better observability for your system.

Concerning the remediation, it’s possible to modify this solution by integrating it with different AWS services. As an example, you can integrate the anomaly detection with your own SIEM system, or simply notify your security team distribution list by using Amazon Simple Notification Service (Amazon SNS).

AWS WAF provides additional information in its logs, such as the IP address for the client. To detect anomalies in AWS WAF logs, you can ingest the AWS WAF logs to Amazon Simple Storage Service (Amazon S3), and then use Lookout for Metrics with Amazon S3 as a data source.

Conclusion

AWS WAF is integrated with CloudWatch and provides metrics for passed requests, blocked requests, or counted requests. With Lookout for Metrics, you can detect unexpected behavior in CloudWatch metrics by using a machine learning (ML) model. In this blog, I showed you how to integrate both services to provide AWS WAF with an ML-based anomaly detection mechanism. ML is a way to gain more visibility into your AWS WAF behavior. In addition, you can easily be notified when the system detects abnormal levels of blocked (or counted) requests, in order to take the right remediation action.

If you have feedback about this post, submit comments in the Comments section below. If you have questions about this post, start a new thread on the AWS WAF forum or contact AWS Support.

Want more AWS Security how-to content, news, and feature announcements? Follow us on Twitter.

Author

Cyril Soler

Cyril is a Senior Solutions Architect at AWS, working with Spain-based enterprises. His interests include security and data protection. He has been passionate about computer science since he was 7. When he’s far from a keyboard, he enjoys mechanics. Cyril holds a Master’s degree from Polytech Marseille, School of Engineering.