Post Syndicated from Brody Pearman original https://aws.amazon.com/blogs/big-data/accelerate-your-data-quality-journey-for-lakehouse-architecture-with-amazon-sagemaker-apache-iceberg-on-aws-amazon-s3-tables-and-aws-glue-data-quality/
In an era where data drives innovation and decision-making, organizations are increasingly focused on not only accumulating data but on maintaining its quality and reliability. High-quality data is essential for building trust in analytics, enhancing the performance of machine learning (ML) models, and supporting strategic business initiatives.
By using AWS Glue Data Quality, you can measure and monitor the quality of your data. It analyzes your data, recommends data quality rules, evaluates data quality, and provides you with a score that quantifies the quality of your data. With this, you can make confident business decisions. With this launch, AWS Glue Data Quality is now integrated with the lakehouse architecture of Amazon SageMaker, Apache Iceberg on general purpose Amazon Simple Storage Service (Amazon S3) buckets, and Amazon S3 Tables. This integration brings together serverless data integration, quality management, and advanced ML capabilities in a unified environment.
This post explores how you can use AWS Glue Data Quality to maintain data quality of S3 Tables and Apache Iceberg tables on general purpose S3 buckets. We’ll discuss strategies for verifying the quality of published data and how these integrated technologies can be used to implement effective data quality workflows.
Solution overview
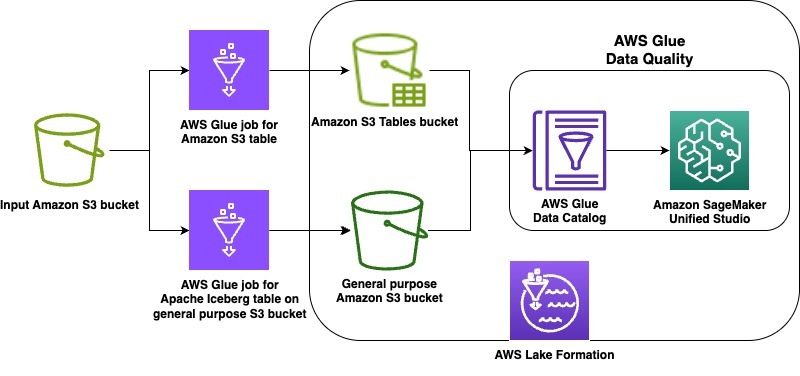
In this launch, we’re supporting the lakehouse architecture of Amazon SageMaker, Apache Iceberg on general purpose S3 buckets, and Amazon S3 Tables. As example use cases, we demonstrate data quality on an Apache Iceberg table stored in a general purpose S3 bucket as well as on Amazon S3 Tables. The steps will cover the following:
- Create an Apache Iceberg table on a general purpose Amazon S3 bucket and an Amazon S3 table in a table bucket using two AWS Glue extract, transform, and load (ETL) jobs
- Grant appropriate AWS Lake Formation permissions on each table
- Run data quality recommendations at rest on the Apache Iceberg table on general purpose S3 bucket
- Run the data quality rules and visualize the results in Amazon SageMaker Unified Studio
- Run data quality recommendations at rest on the S3 table
- Run the data quality rules and visualize the results in SageMaker Unified Studio
The following diagram is the solution architecture.
Prerequisites
To implement the instructions, you must have the following prerequisites:
- An AWS account
- AWS CLI installed and configured with your credentials
- A SageMaker Unified Studio domain
- A SageMaker Unified Studio project with All capabilities project profile
- A Lake Formation data lake administrator
Create S3 tables and Apache Iceberg on general purpose S3 bucket
First, complete the following steps to upload data and scripts:
- Upload the attached AWS Glue job scripts to your designated script bucket in S3
- To download the New York City Taxi – Yellow Trip Data dataset for January 2025 (Parquet file), navigate to NYC TLC Trip Record Data, expand 2025, and choose Yellow Taxi Trip records under January section. A file called
yellow_tripdata_2025-01.parquetwill be downloaded to your computer. - On the Amazon S3 console, open an input bucket of your choice and create a folder called
nyc_yellow_trip_data. The stack will create aGlueJobRolewith permissions to this bucket. - Upload the
yellow_tripdata_2025-01.parquetfile to the folder. - Download the CloudFormation stack file. Navigate to the CloudFormation console. Choose Create stack. Choose Upload a template file and select the CloudFormation template you downloaded. Choose Next.
- Enter a unique name for Stack name.
- Configure the stack parameters. Default values are provided in the following table:
| Parameter | Default value | Description |
ScriptBucketName |
N/A – user-supplied | Name of the referenced Amazon S3 general purpose bucket containing the AWS Glue job scripts |
DatabaseName |
iceberg_dq_demo |
Name of the AWS Glue Database to be created for the Apache Iceberg table on general purpose Amazon S3 bucket |
GlueIcebergJobName |
create_iceberg_table_on_s3 |
The name of the created AWS Glue job that creates the Apache Iceberg table on general purpose Amazon S3 bucket |
GlueS3TableJobName |
create_s3_table_on_s3_bucket |
The name of the created AWS Glue job that creates the Amazon S3 table |
S3TableBucketName |
dataquality-demo-bucket |
Name of the Amazon S3 table bucket to be created. |
S3TableNamespaceName |
s3_table_dq_demo |
Name of the Amazon S3 table bucket namespace to be created |
S3TableTableName |
ny_taxi |
Name of the Amazon S3 table to be created by the AWS Glue job |
IcebergTableName |
ny_taxi |
Name of the Apache Iceberg table on general purpose Amazon S3 to be created by the AWS Glue job |
IcebergScriptPath |
scripts/create_iceberg_table_on_s3.py |
The referenced Amazon S3 path to the AWS Glue script file for the Apache Iceberg table creation job. Verify the file name matches the corresponding GlueIcebergJobName |
S3TableScriptPath |
scripts/create_s3_table_on_s3_bucket.py |
The referenced Amazon S3 path to the AWS Glue script file for the Amazon S3 table creation job. Verify the file name matches the corresponding GlueS3TableJobName |
InputS3Bucket |
N/A – user-supplied bucket | Name of the referenced Amazon S3 bucket with which the NY Taxi data was uploaded |
InputS3Path |
nyc_yellow_trip_data |
The referenced Amazon S3 path with which the NY Taxi data was uploaded |
OutputBucketName |
N/A – user-supplied | Name of the created Amazon S3 general purpose bucket for the AWS Glue job for Apache Iceberg table data |
Complete the following steps to configure AWS Identity and Access Management (IAM) and Lake Formation permissions:
- If you haven’t previously worked with S3 Tables and analytics services, navigate to Amazon S3.
- Choose Table buckets.
- Choose Enable integration to enable analytics service integrations with your S3 table buckets.
- Navigate to the Resources tab for your AWS CloudFormation stack. Note the IAM role with the logical ID
GlueJobRoleand the database name with the logical IDGlueDatabase. Additionally, note the name of the S3 table bucket with the logical IDS3TableBucketas well as the namespace name with the logical IDS3TableBucketNamespace. The S3 table bucket name is the portion of the Amazon Resource Name (ARN) which follows:arn:aws:s3tables:<region>:<accountID>:bucket/{S3 Table bucket Name}. The namespace name is the portion of the namespace ARN which follows:arn:aws:s3tables:<region>:<accountID>:bucket/{S3 Table bucket Name}|{namespace name}. - Navigate to the Lake Formation console with a Lake Formation data lake administrator.
- Navigate to the Databases tab and select your
GlueDatabase. Note the selected default catalog should match your AWS account ID. - Select the Actions dropdown menu and under Permissions, choose Grant.
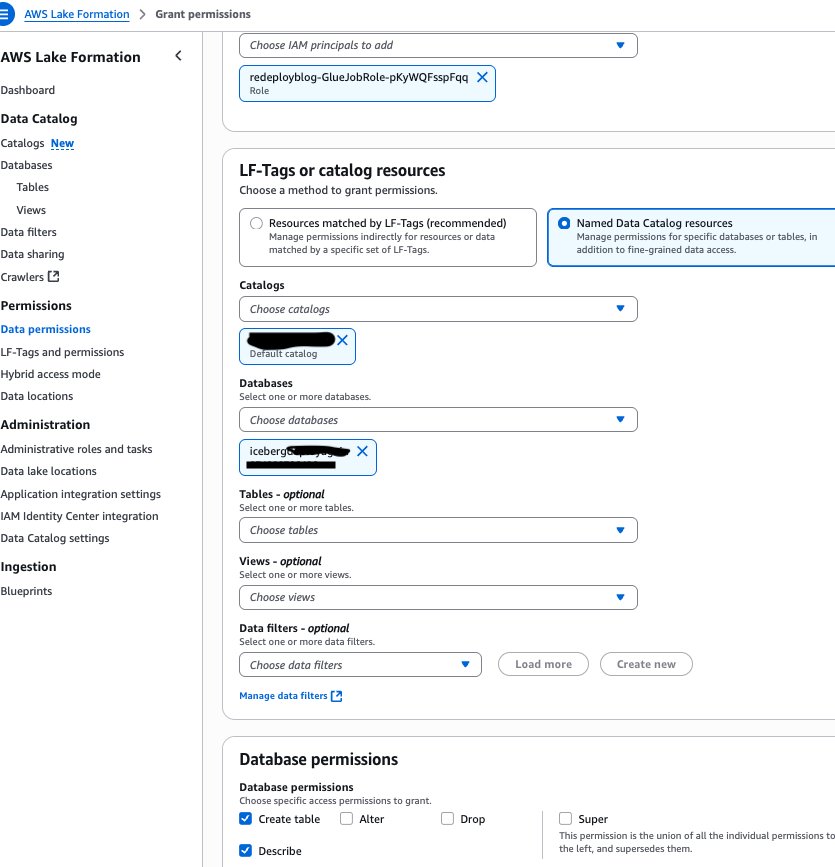
- Grant your
GlueJobRolefrom step 4 the necessary permissions. Under Database permissions, select Create table and Describe, as shown in the following screenshot.
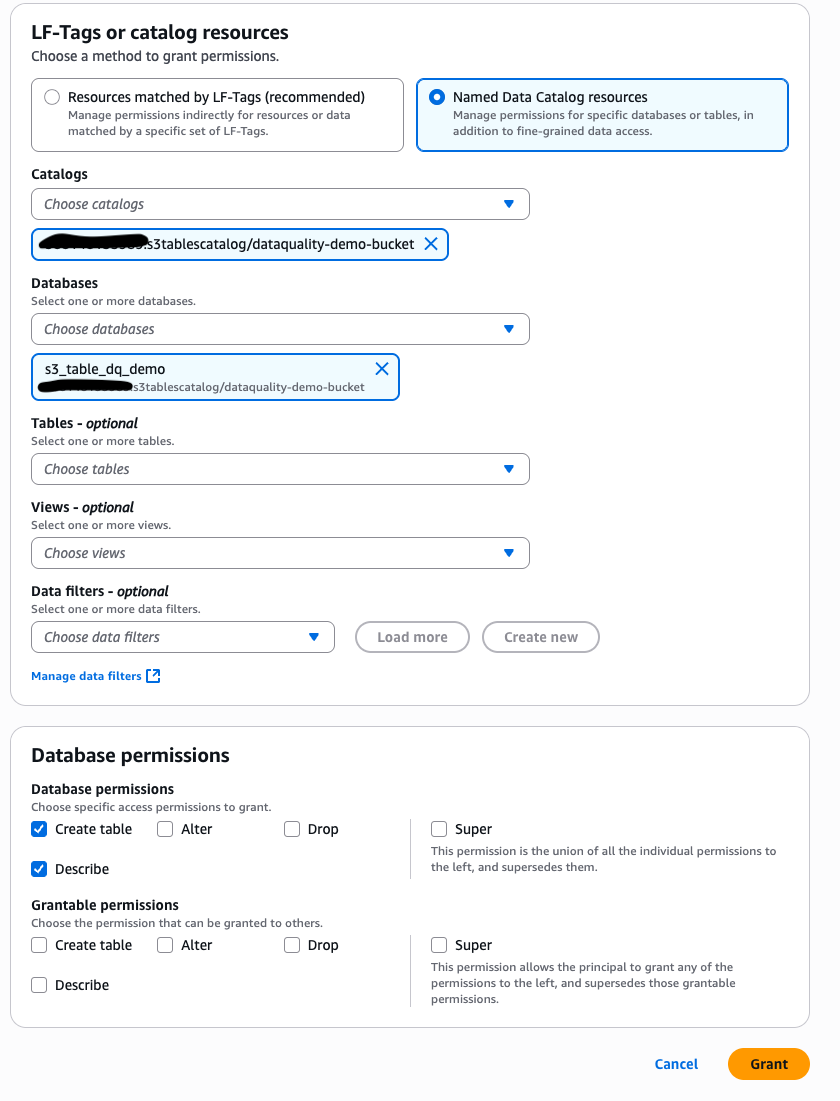
Navigate back to the Databases tab in Lake Formation and select the catalog that matches with the value of S3TableBucket you noted in step 4 in the format: <AWS account ID>:s3tablescatalog/<S3 Table Bucket name>
- Select your namespace name. From the Actions dropdown menu, under Permissions, choose Grant.
- Grant your GlueJobRole from step 4 the necessary permissions Under Database permissions, select Create table and Describe, as shown in the following screenshot.
To run the jobs created in the CloudFormation stack to create the sample tables and configure Lake Formation permissions for the DataQualityRole, complete the following steps:
- In the Resources tab of your CloudFormation stack, note the AWS Glue job names for the logical resource IDs:
GlueS3TableJobandGlueIcebergJob. - Navigate to the AWS Glue console and select ETL jobs. Select your
GlueIcebergJobfrom step 11 and choose Run job. Select yourGlueS3TableJoband choose Run job. - To verify the successful creation of your Apache Iceberg table on general purpose S3 bucket in the database, navigate to Lake Formation with your Lake Formation data lake administrator permissions. Under Databases, select your
GlueDatabase. The selected default catalog should match your AWS account ID. - On the dropdown menu, choose View and then Tables. You should see a new tab with the table name you specified for
IcebergTableName. You have verified the table creation. - Select this table and grant your DataQualityRole (
<stack_name>-DataQualityRole-<xxxxxx>) the necessary Lake Formation permissions by choosing the Grant link in the Actions tab. Choose Select, Describe from Table permissions for the new Apache Iceberg table. - To verify the S3 table in the S3 table bucket, navigate to Databases in the Lake Formation console with your Lake Formation data lake administrator permissions. Make sure the selected catalog is your S3 table bucket catalog:
<AWS account ID>:s3tablescatalog/<S3 Table Bucket name> - Select your S3 table namespace and choose the dropdown menu View.
- Choose Tables and you should see a new tab with the table name you specified for
S3TableTableName. You have verified the table creation. - Choose the link for the table and under Actions, choose Grant. Grant your
DataQualityRolethe necessary Lake Formation permissions. Choose Select, Describe from Table permissions for the S3 table. - In the Lake Formation console with your Lake Formation data lake administrator permissions, on the Administration tab, choose Data lake locations .
- Choose Register location. Input your
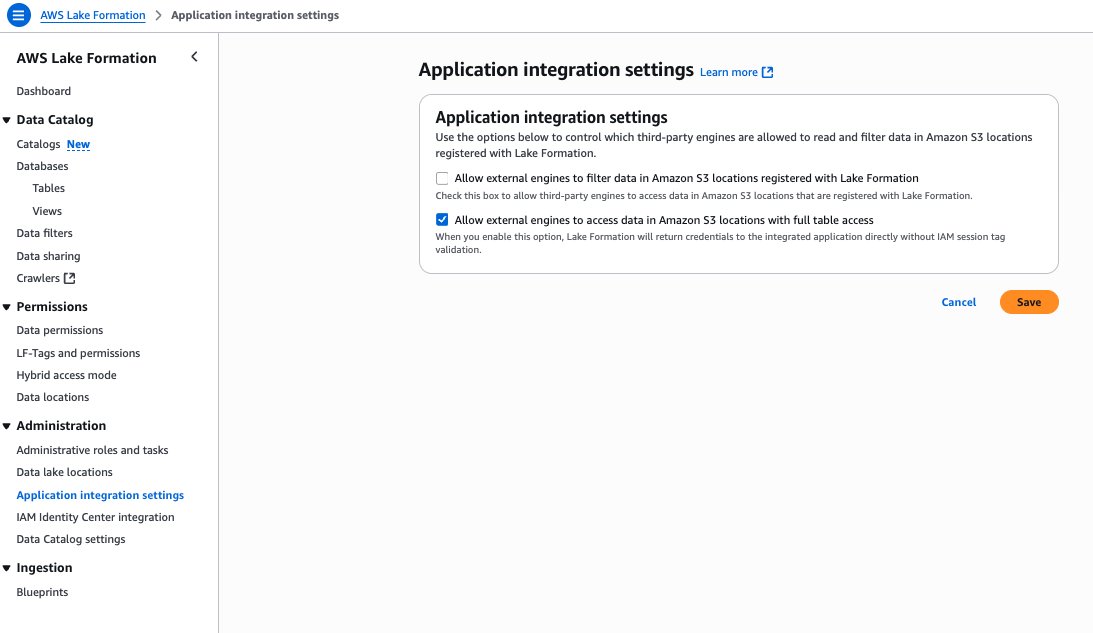
OutputBucketNameas the Amazon S3 path. Input theLakeFormationRolefrom the stack resources as the IAM role. Under Permission mode, choose Lake Formation. - On the Lake Formation console under Application integration settings, select Allow external engines to access data in Amazon S3 locations with full table access, as shown in the following screenshot.
Generate recommendations for Apache Iceberg table on general purpose S3 bucket managed by Lake Formation
In this section, we show how to generate data quality rules using the data quality rule recommendations feature of AWS Glue Data Quality for your Apache Iceberg table on a general purpose S3 bucket. Follow these steps:
- Navigate to the AWS Glue console. Under Data Catalog, choose Databases. Choose the
GlueDatabase. - Under Tables, select your
IcebergTableName. On the Data quality tab, choose Run history. - Under Recommendation runs, choose Recommend rules.
- Use the
DataQualityRole(<stack_name>-DataQualityRole-<xxxxxx>) to generate data quality rule recommendations, leaving the other settings as default. The results are shown in the following screenshot.
Run data quality rules for Apache Iceberg table on general purpose S3 bucket managed by Lake Formation
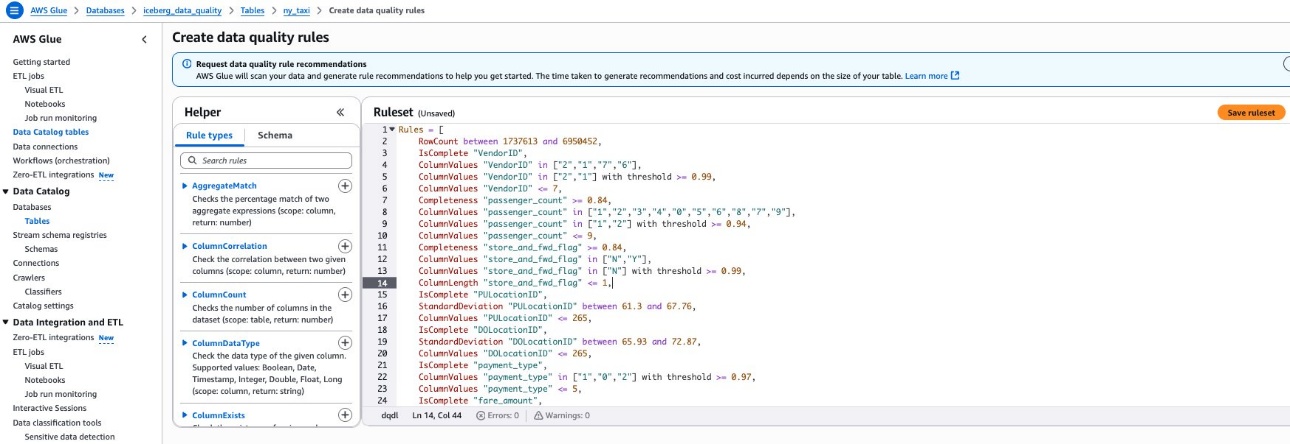
In this section, we show how to create a data quality ruleset with the recommended rules. After creating the ruleset, we run the data quality rules. Follow these steps:
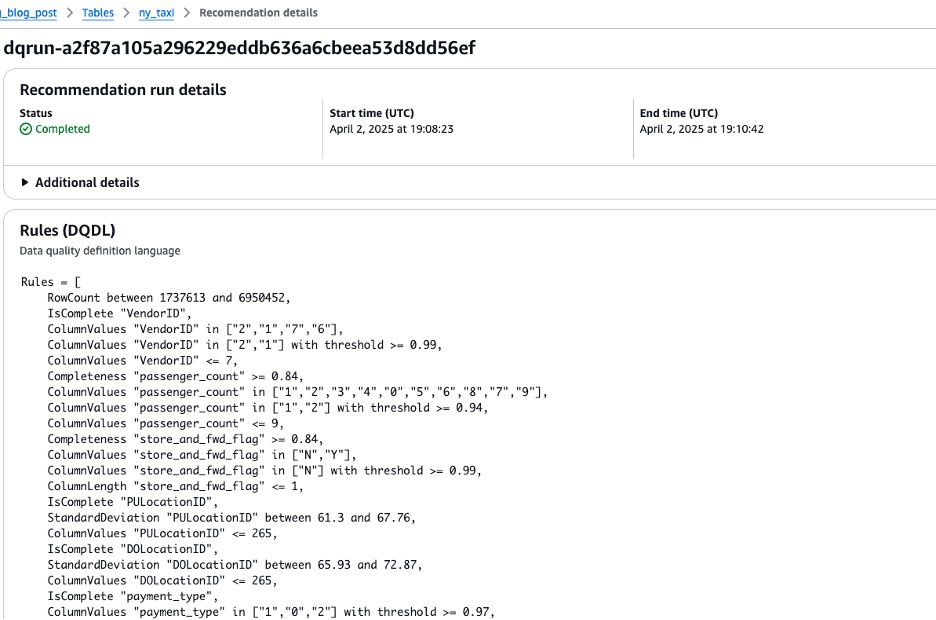
- Copy the resulting rules from your recommendation run by selecting the dq-run ID and choosing Copy.
- Navigate back to the table under the Data quality tab and choose Create data quality rules. Paste the ruleset from step 1 here. Choose Save ruleset, as shown in the following screenshot.
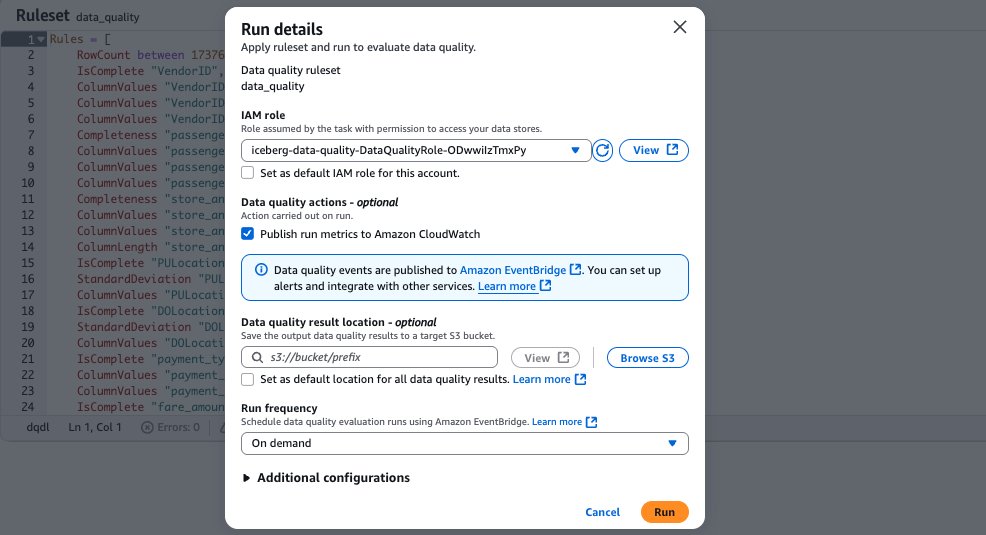
- After saving your ruleset, navigate back to the Data Quality tab for your Apache Iceberg table on the general purpose S3 bucket. Select the ruleset you created. To run the data quality evaluation run on the ruleset using your data quality role, choose Run, as shown in the following screenshot.
Generate recommendations for the S3 table on the S3 table bucket
In this section, we show how to use the AWS Command Line Interface (AWS CLI) to generate recommendations for your S3 table on the S3 table bucket. This will also create a data quality ruleset for the S3 table. Follow these steps:
- Fill in your S3 table
namespace name, S3 tabletable name,Catalog ID, andData Quality role ARNin the following JSON file and save it locally:
- Enter the following AWS CLI command replacing local
file nameandregionwith your own information:
- Run the following AWS CLI command to confirm the recommendation run succeeds:
Run data quality rules for the S3 table on the S3 table bucket
In this section, we show how to use the AWS CLI to evaluate the data quality ruleset on the S3 tables bucket that we just created. Follow these steps:
- Replace S3 table
namespace name, S3 tablestable name,Catalog ID, andData Quality role ARNwith your own information in the following JSON file and save it locally:
- Run the following AWS CLI command replacing local
file nameandregionwith your information:
- Run the following AWS CLI command replacing
regionand data qualityrun IDwith your information:
View results in SageMaker Unified Studio
Complete the following steps to view results from your data quality evaluation runs in SageMaker Unified Studio:
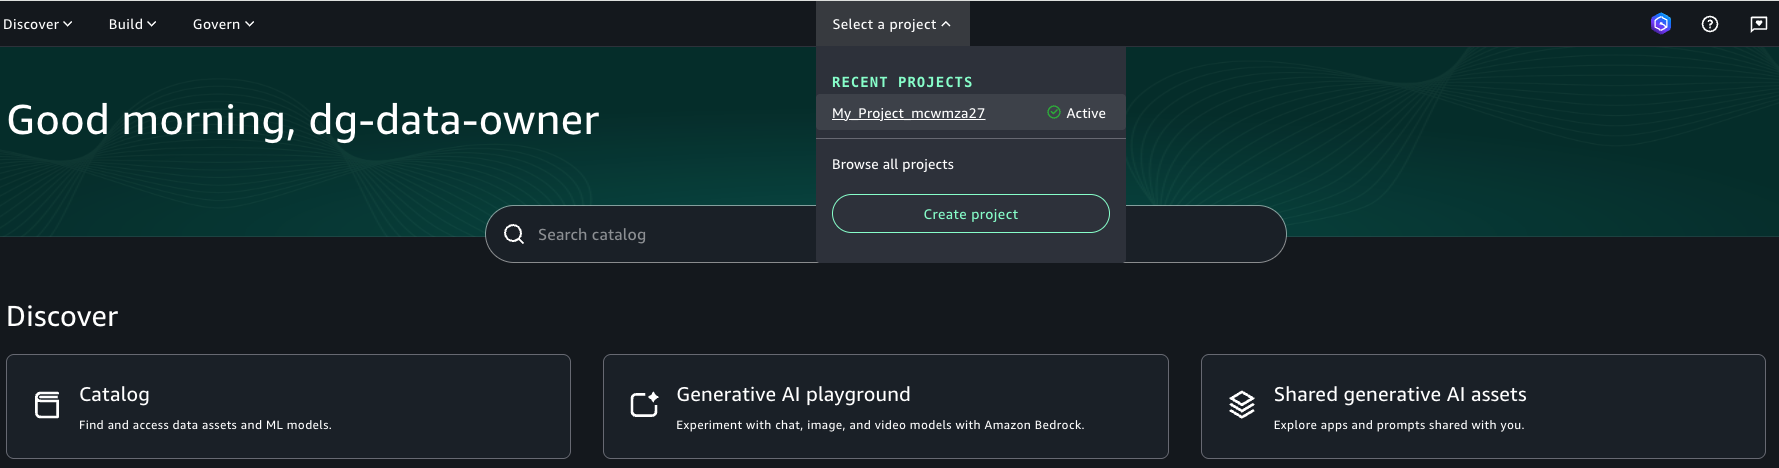
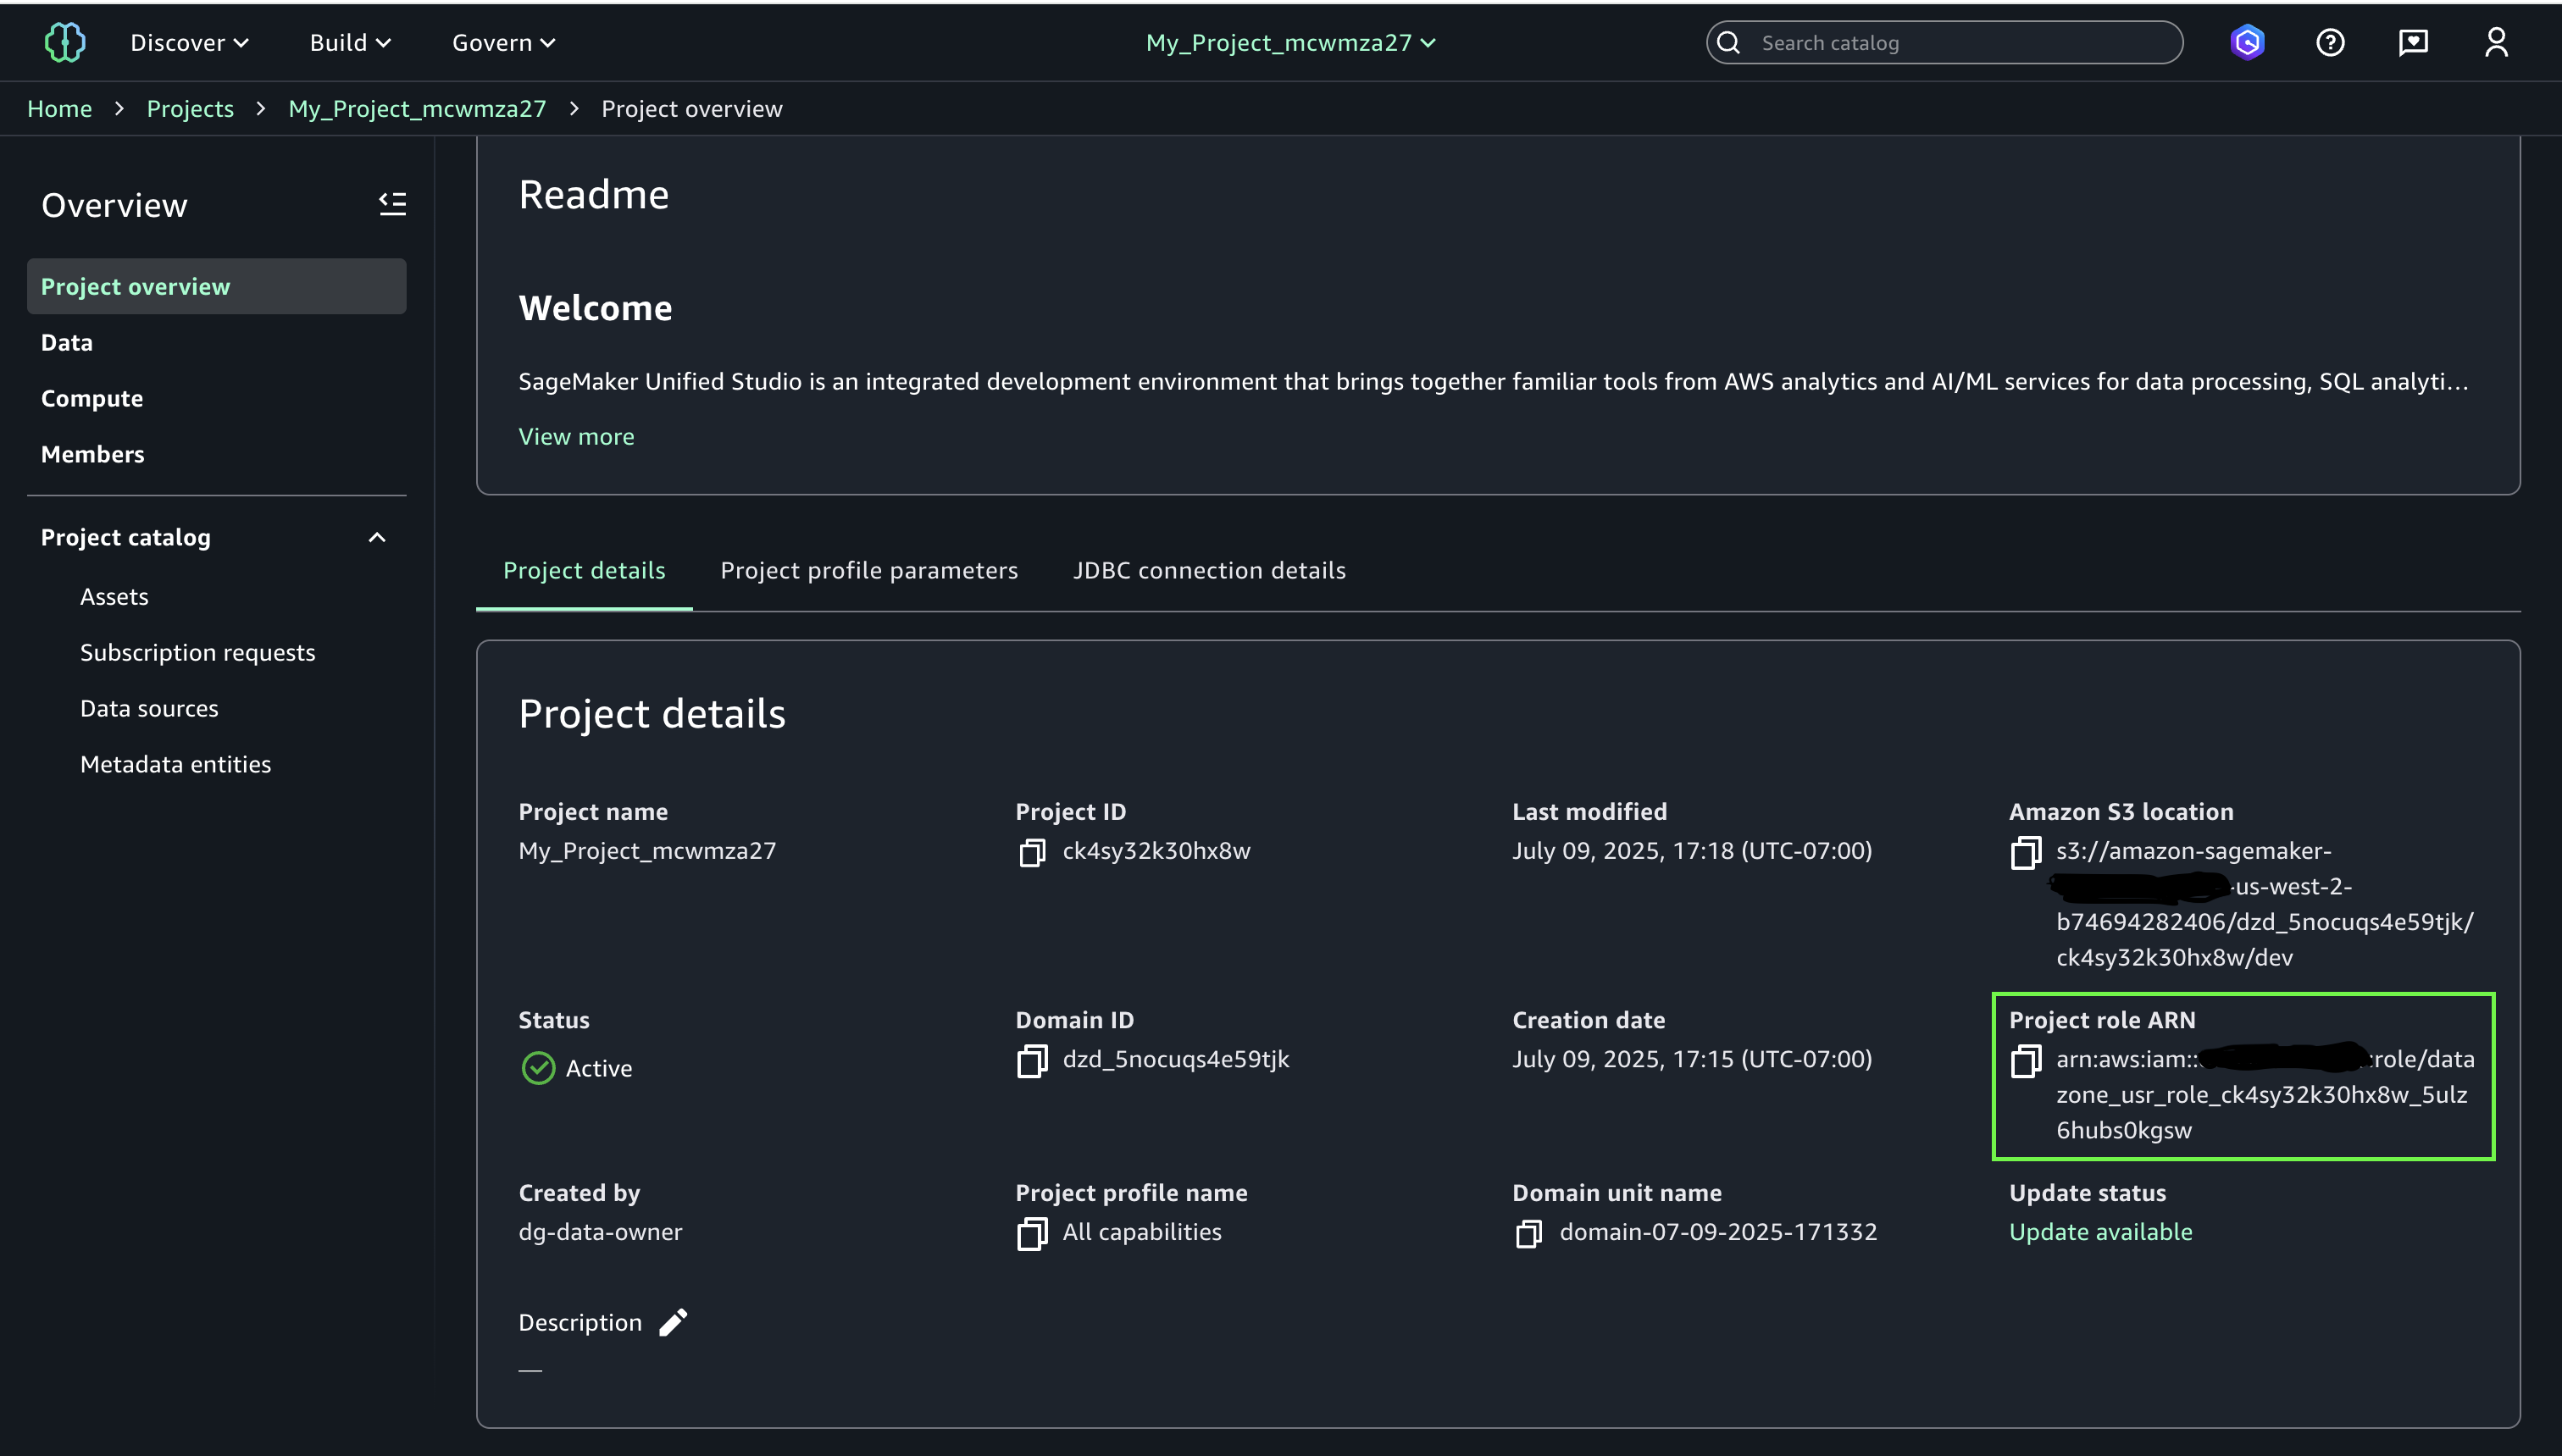
- Log in to the SageMaker Unified Studio portal using your single sign-on (SSO).
- Navigate to your project and note the project role ARN


- Navigate to the Lake Formation console with your Lake Formation data lake administrator permissions. Select your Apache Iceberg table that you created on general purpose S3 bucket and choose Grant from the Actions dropdown menu. Grant the following Lake Formation permissions to your SageMaker Unified Studio project role from step 2:
- Describe for Table permissions and Grantable permissions
- Next, select your S3 Table from the S3 Table bucket catalog in Lake Formation and choose Grant from the Actions drop-down. Grant the below Lake Formation permissions to your SageMaker Unified Studio project role from step 2:
- Describe for Table permissions and Grantable permissions
- Follow the steps at Create an Amazon SageMaker Unified Studio data source for AWS Glue in the project catalog to configure your data source for your
GlueDatabaseand your S3 tables namespace.- Choose a name and optionally enter a description for your data source details.
- Choose AWS Glue (Lakehouse) for your Data source type. Leave connection and data lineage as the default values.
- Choose Use the AwsDataCatalog for the Apache Iceberg table on general purpose S3 bucket AWS Glue database.
- Choose the Database name corresponding to the
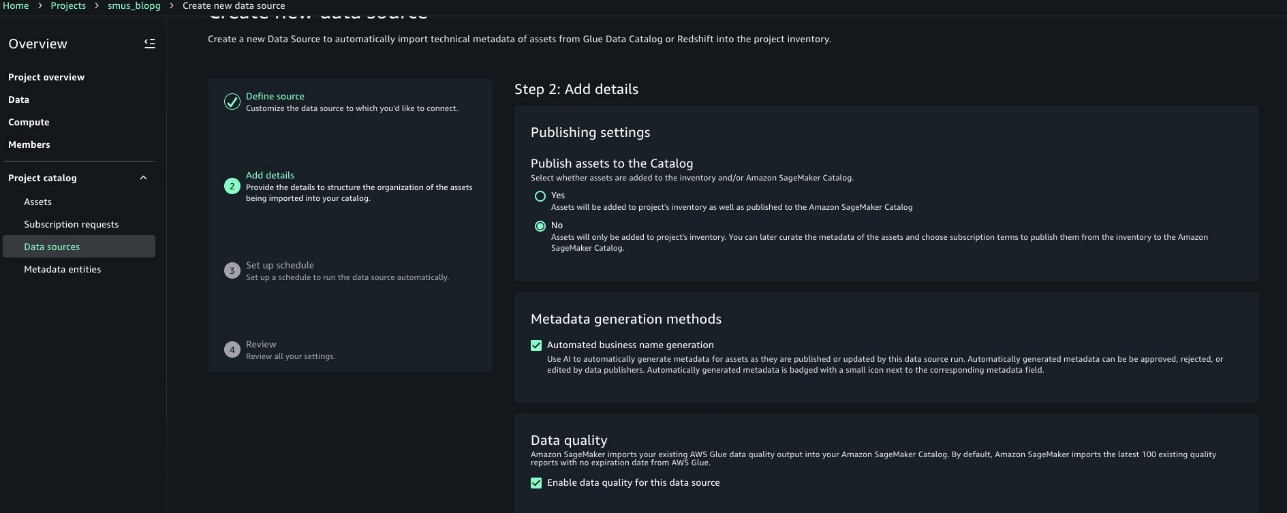
GlueDatabase.Choose Next. - Under Data quality, select Enable data quality for this data source. Leave the rest of the defaults.

- Configure the next data source with a name for your S3 table namespace. Optionally, enter a description for your data source details.
- Choose AWS Glue (Lakehouse) for your Data source type. Leave connection and data lineage as the default values.
- Choose to enter the catalog name:
s3tablescatalog/<S3TableBucketName> - Choose the Database name corresponding to the S3 table namespace. Choose Next.
- Select Enable data quality for this data source. Leave the rest of the defaults.
- Run each dataset.

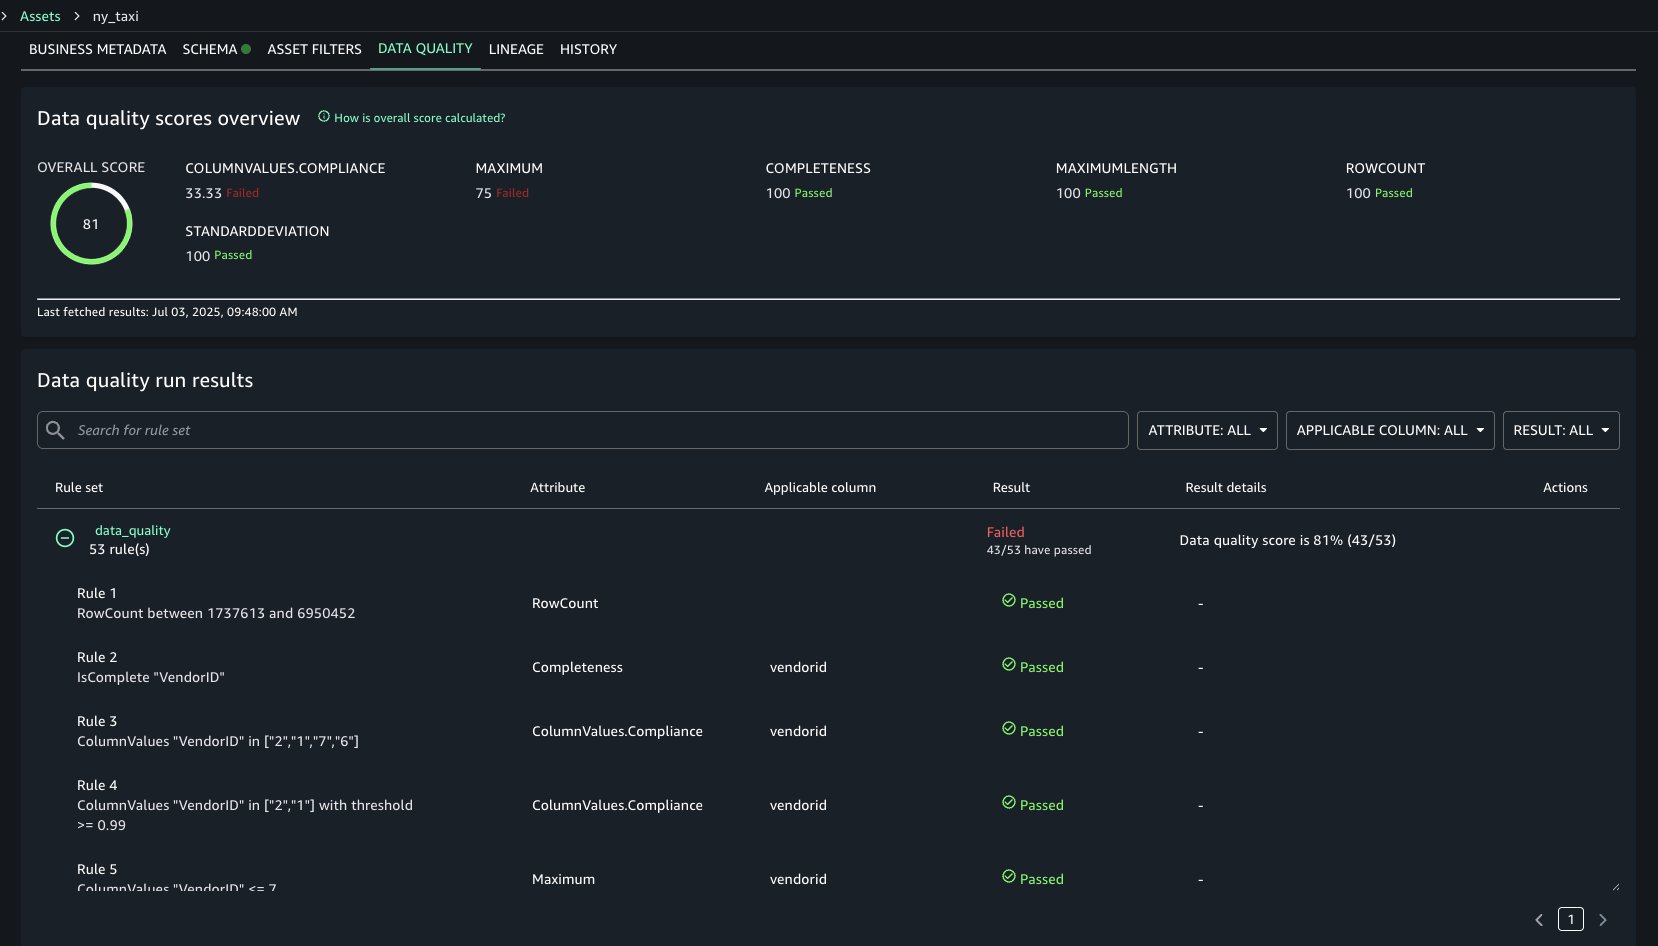
- Navigate to your project’s Assets and select the related asset that you created for Apache Iceberg table on general purpose S3 bucket. Navigate to the Data Quality tab to view your data quality results. You should be able to see the data quality results for the S3 table asset similarly.

The data quality results in the following screenshot show each rule evaluated in the selected data quality evaluation run and its result. The data quality score calculates the percentage of rules that passed, and the overview shows how certain rule types faired across the evaluation. For example, Completeness rule types all passed, but ColumnValues rule types passed only three out of nine times.
Cleanup
To avoid incurring future charges, clean up the resources you created during this walkthrough:
- Navigate to the blog post output bucket and delete its contents.
- Un-register the data lake location for your output bucket in Lake Formation
- Revoke the Lake Formation permissions for your SageMaker project role, for your data quality role, and for your AWS Glue job role.
- Delete the input data file and the job scripts from your bucket.
- Delete the S3 table.
- Delete the CloudFormation stack.
- [Optional] Delete your SageMaker Unified Studio domain and the associated CloudFormation stacks it created on your behalf.
Conclusion
In this post, we demonstrated how you can now generate data quality recommendation for your lakehouse architecture using Apache Iceberg tables on general purpose Amazon S3 buckets and Amazon S3 Tables. Then we showed how to integrate and view these data quality results in Amazon SageMaker Unified Studio. Try this out for your own use case and share your feedback and questions in the comments.
About the Authors
 Brody Pearman is a Senior Cloud Support Engineer at Amazon Web Services (AWS). He’s passionate about helping customers use AWS Glue ETL to transform and create their data lakes on AWS while maintaining high data quality. In his free time, he enjoys watching football with his friends and walking his dog.
 Shiv Narayanan is a Technical Product Manager for AWS Glue’s data management capabilities like data quality, sensitive data detection and streaming capabilities. Shiv has over 20 years of data management experience in consulting, business development and product management.
 Shriya Vanvari is a Software Developer Engineer in AWS Glue. She is passionate about learning how to build efficient and scalable systems to provide better experience for customers. Outside of work, she enjoys reading and chasing sunsets.
 Narayani Ambashta is an Analytics Specialist Solutions Architect at AWS, focusing on the automotive and manufacturing sector, where she guides strategic customers in developing modern data and AI strategies. With over 15 years of cross-industry experience, she specializes in big data architecture, real-time analytics, and AI/ML technologies, helping organizations implement modern data architectures. Her expertise spans across lakehouse architecture, generative AI, and IoT platforms, enabling customers to drive digital transformation initiatives. When not architecting modern solutions, she enjoys staying active through sports and yoga.


 Tomohiro Tanaka is a Senior Cloud Support Engineer at Amazon Web Services. He’s passionate about helping customers use Apache Iceberg for their data lakes on AWS. In his free time, he enjoys a coffee break with his colleagues and making coffee at home.
 Sotaro Hikita is a Solutions Architect. He supports customers in a wide range of industries, especially the financial industry, to build better solutions. He is particularly passionate about big data technologies and open source software.
 Noritaka Sekiyama is a Principal Big Data Architect on the AWS Glue team. He works based in Tokyo, Japan. He is responsible for building software artifacts to help customers. In his spare time, he enjoys cycling with his road bike.


 Fabrizio Napolitano is a Principal Specialist Solutions Architect for DB and Analytics. He has worked in the analytics space for the last 20 years, and has recently and quite by surprise become a Hockey Dad after moving to Canada.
 Lakshmi Nair is a Senior Analytics Specialist Solutions Architect at AWS. She specializes in designing advanced analytics systems across industries. She focuses on crafting cloud-based data platforms, enabling real-time streaming, big data processing, and robust data governance.
 Varsha Velagapudi is a Senior Technical Product Manager with Amazon DataZone at AWS. She focuses on improving data discovery and curation required for data analytics. She is passionate about simplifying customers’ AI/ML and analytics journey to help them succeed in their day-to-day tasks. Outside of work, she enjoys nature and outdoor activities, reading, and traveling.