Tag Archives: data governance

Breaking down data silos: Volkswagen’s approach with Amazon DataZone

Post Syndicated from Bandana Das original https://aws.amazon.com/blogs/big-data/breaking-down-data-silos-volkswagens-approach-with-amazon-datazone/

Over the years, organizations have invested in building purpose-built cloud-based data warehouses that are siloed from one another. One of the major challenges these organizations encounter today is enabling cross-organization discovery and access to data across these siloed data warehouses built using different technology stacks. The data mesh pattern addresses these issues, founded in four principles: domain-oriented decentralized data ownership and architecture, treating data as a product, providing self-serve data infrastructure as a platform, and implementing federated governance. The data mesh pattern helps organizations mimic their organizational structure into data domains and makes it possible to share the data across the organization and beyond to improve their business models.

In 2019, Volkswagen AG and Amazon Web Services (AWS) started their collaboration to co-develop the Digital Production Platform (DPP), with the goal of enhancing production and logistics efficiency by 30% while reducing production costs by the same margin. The DPP was developed to streamline access to data from shop floor devices and manufacturing systems by handling integrations and providing a range of standardized interfaces. However, as applications and use cases evolved on the platform, a significant challenge emerged: the ability to share data across applications stored in isolated data warehouses (within Amazon Redshift in isolated AWS accounts designated for specific use cases), without the need to consolidate data into a central data warehouse. Another challenge was discovering all the available data stored across multiple data warehouses and facilitating a workflow to request access to data across business domains within each plant. The common method used was largely manual, relying on emails and general communication (through tickets and emails). The manual approach not only increased the overhead but also varied from one use case to another in terms of data governance.

In this post, we introduce Amazon DataZone and explore how Volkswagen used Amazon DataZone to build their data mesh, tackle the challenges encountered, and break the data silos. A key aspect of the solution was enabling data providers to automatically publish their data products to Amazon DataZone, serving as a central data mesh for enhanced data discoverability. Additionally, we provide code to guide you through the deployment and implementation process.

Introduction to Amazon DataZone

Amazon DataZone is a data management service that makes it faster and straightforward to catalog, discover, share, and govern data stored across AWS, on-premises, and third-party sources. Key features of Amazon DataZone include the business data catalog, with which users can search for published data, request access, and start working on data in days instead of weeks. In addition, the service facilitates collaboration across teams and helps them manage and monitor data assets across different organizational units. The service also includes the Amazon DataZone portal, which offers a personalized analytics experience for data assets through a web-based application or API. Lastly, Amazon DataZone offers governed data sharing, which makes sure the right data is accessed by the right user for the right purpose with a governed workflow.

Solution overview

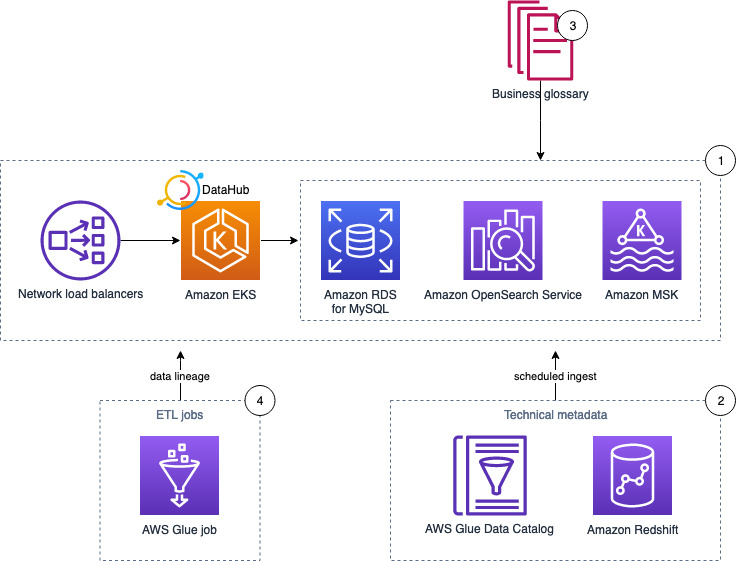
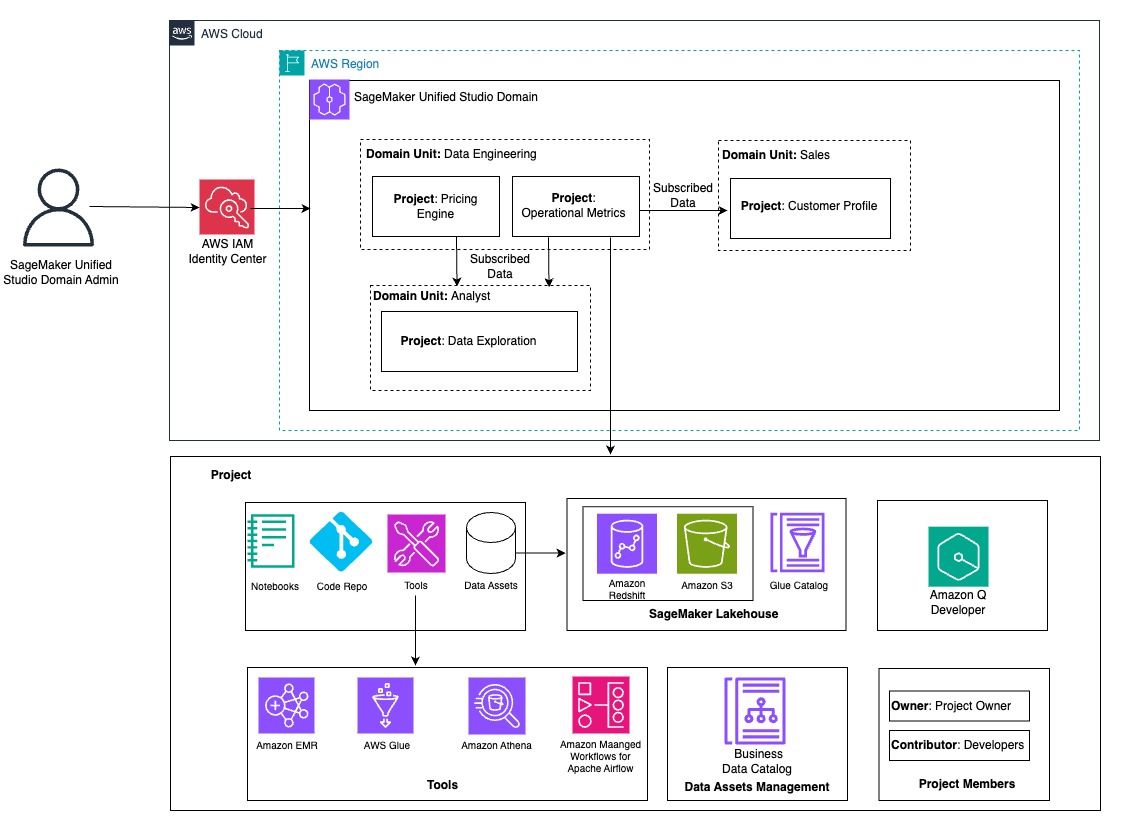
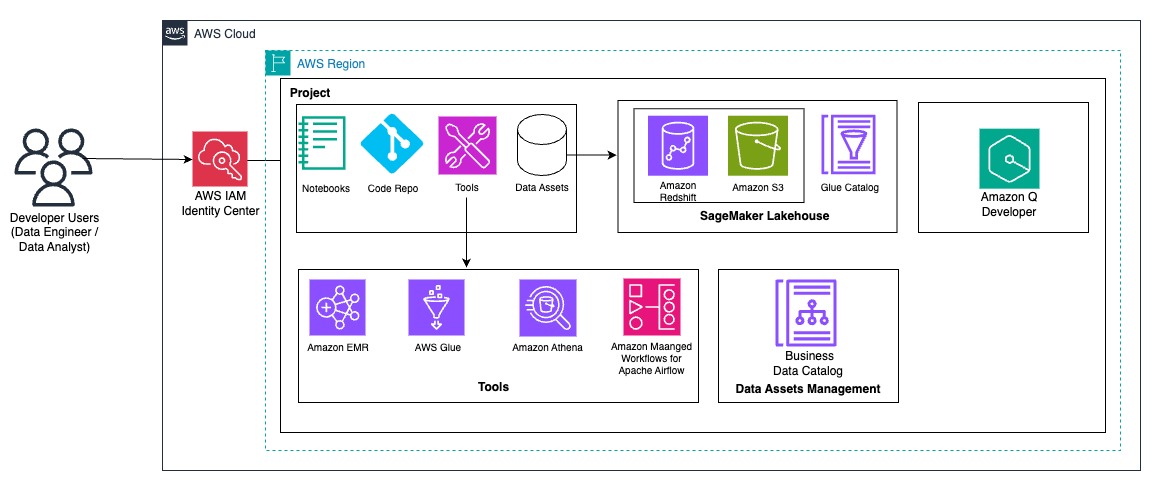
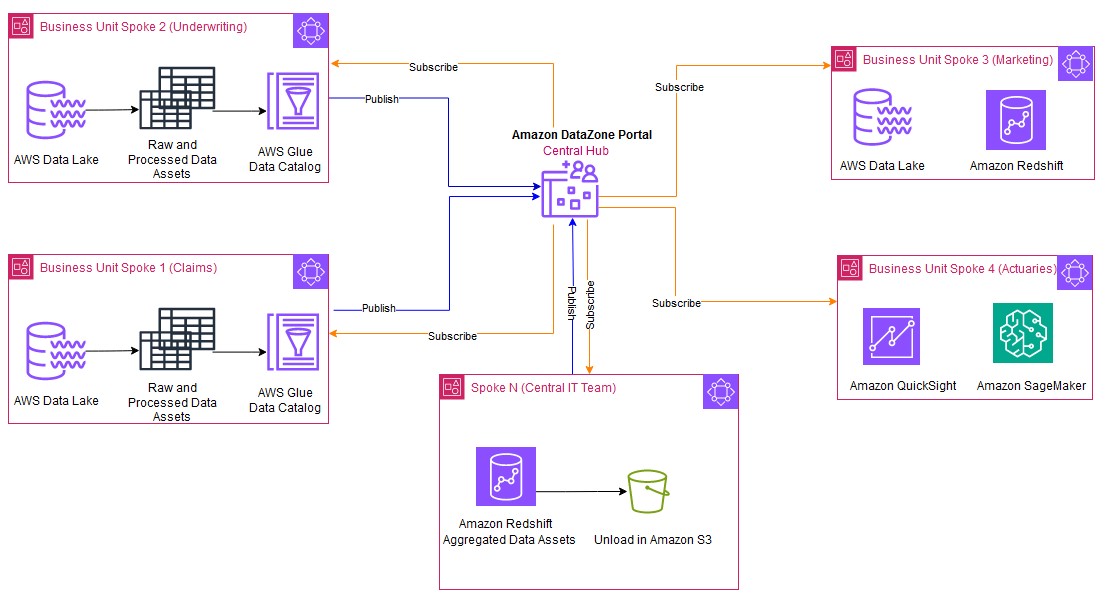
The following architecture diagram represents a high-level design that is built on top of the data mesh pattern. It separates source systems, data domain producers (data publishers), data domain subscribers (data consumers), and central governance to highlight the key aspects. This data mesh architecture is specially tailored for cross-AWS account usage. The objective of this approach is to create a foundation for building data governance on a scale, supporting the objectives of data producers and consumers with strong and consistent governance.

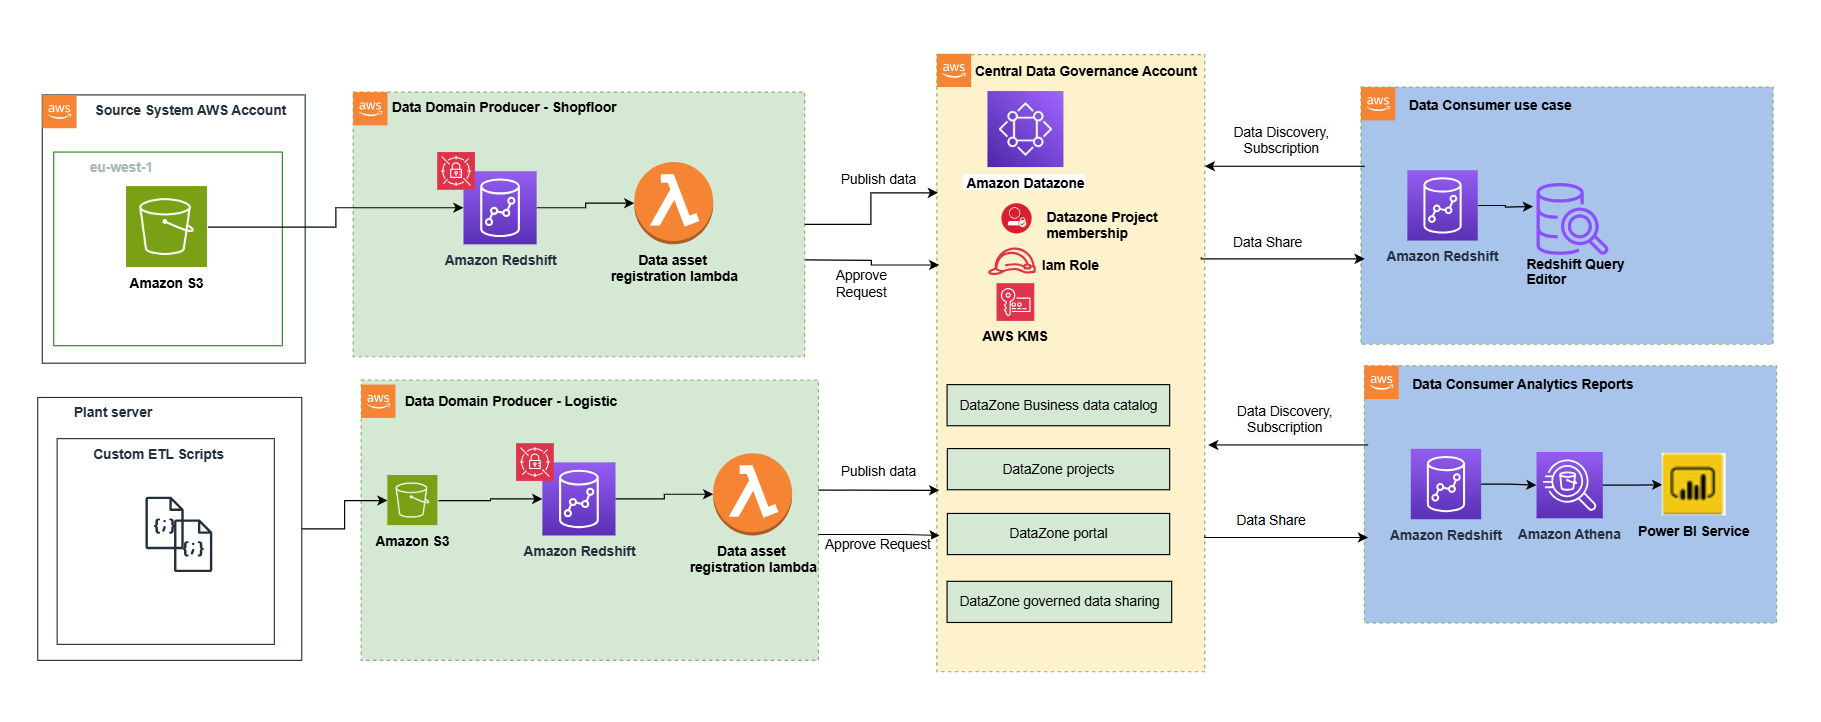
This architecture allows for the integration of multiple data warehouses into a centralized governance account that stores all the metadata from each environment.

A data domain producer uses Amazon Redshift as their analytical data warehouse to store, process, and manage structured and semi-structured data. The data domain producers load data into their respective Amazon Redshift clusters through extract, transform, and load (ETL) pipelines they manage, own, and operate. The producers maintain control over their data through Amazon Redshift security features, including column-level access controls and dynamic data masking, supporting data governance at the source. A data domain producer uses Amazon Redshift ETL and Amazon Redshift Spectrum to process and transform raw data into consumable data products. The data products could be Amazon Redshift tables, views, or materialized views.

Data domain producers expose datasets to the rest of the organization by registering them to Amazon DataZone service, which acts as a central data catalog. They can choose what data assets to share, for how long, and how consumers can interact with these. They’re also responsible for maintaining the data and making sure it’s accurate and current.

The data assets from the producers are then published using the data source run to Amazon DataZone in the central governance account. This process populates the technical metadata into the business data catalog for each data asset. The business metadata can be added by business users (data analysts) to provide business context, tags, and data classification for the datasets. This approach provides the required features to allow producers to create catalog entries with Amazon Redshift from all their data warehouses built in with Redshift clusters. In addition, the central data governance account is used to share datasets securely between producers and consumers. It’s important to note that sharing is done through metadata linking alone. No data (except logs) exists in the governance account. The data isn’t copied to the central account; just a reference to the data is used, so that the data ownership remains with the producer.

Amazon DataZone provides a streamlined way to search for data. The Amazon DataZone data portal provides a personalized view for users to discover and search data assets. An Amazon DataZone user (consumer) with permissions to access the data portal can search for assets and submit requests for subscription of data assets using a web-based application. An approver can then approve or reject the subscription request.

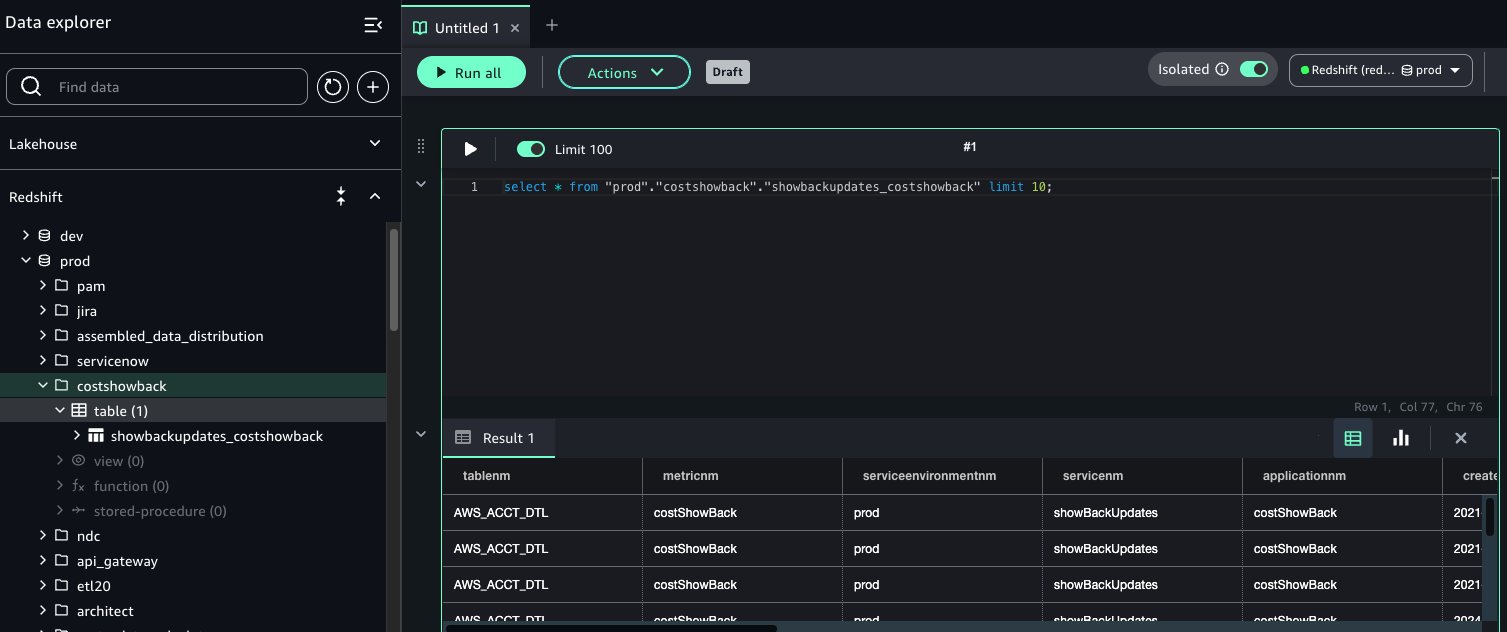
When a data domain consumer has access to an asset in the catalog, they can consume it (query and analyze) using the Amazon Redshift query editor. Each consumer runs their own workload based on their use case. In this way, the team can choose the tools for the job to perform analytics and machine learning activities in its AWS consumer environment.

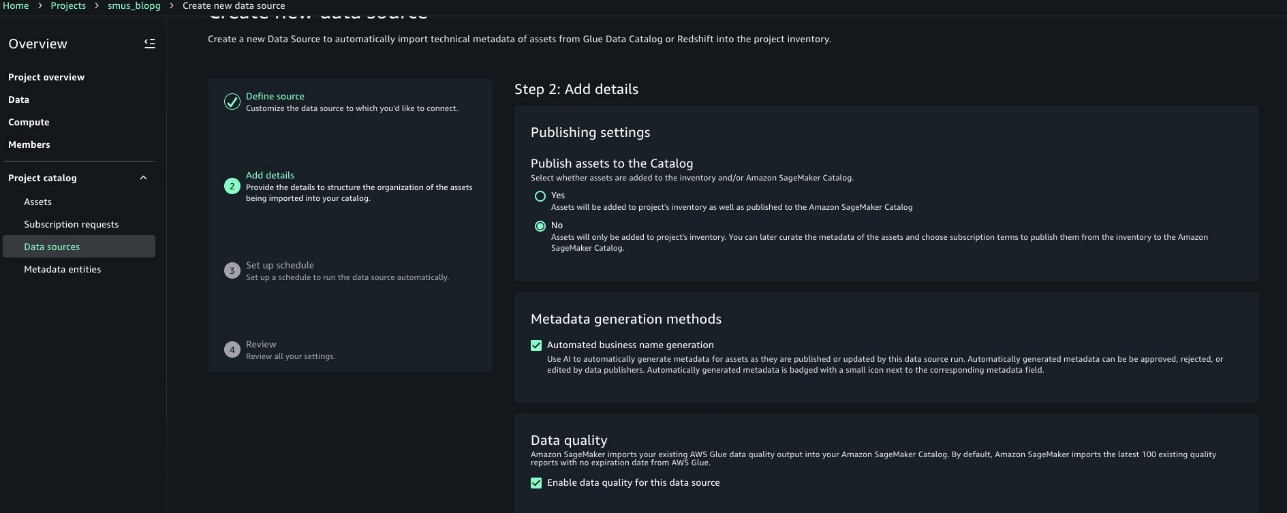
Publishing and registering data assets to Amazon DataZone

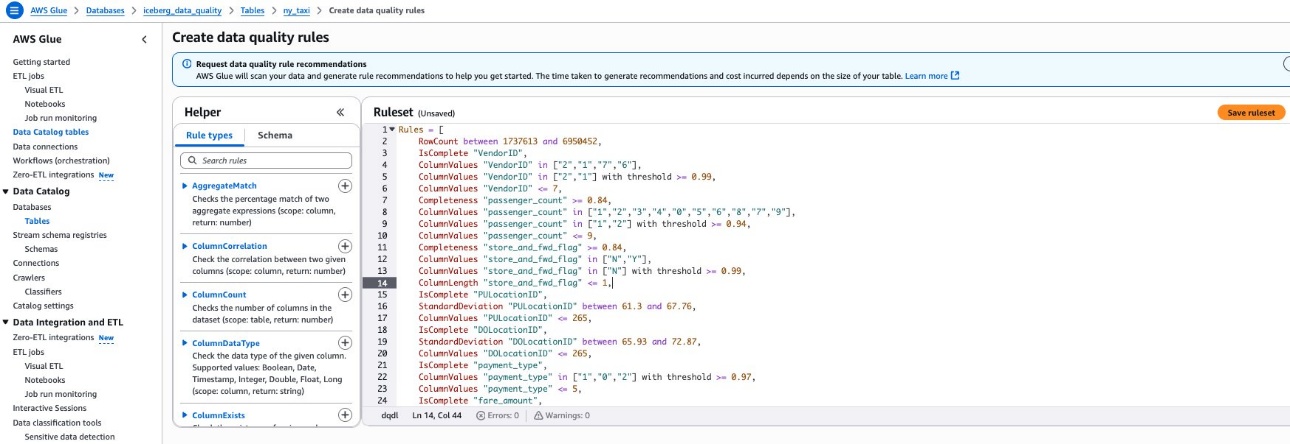
To publish a data asset from the producer account, each asset must be registered in Amazon DataZone for consumer subscription. For more information, refer to Create and run an Amazon DataZone data source for Amazon Redshift. In the absence of an automated registration process, required tasks must be completed manually for each data asset.

Using the automated registration workflow, the manual steps can be automated for the Amazon Redshift data asset (Redshift table or view) that needs to be published in an Amazon DataZone domain or when there’s a schema change in an already published data asset.

The following architecture diagram represents how data assets from Amazon Redshift data warehouses have been automatically published to the data mesh created with Amazon DataZone.

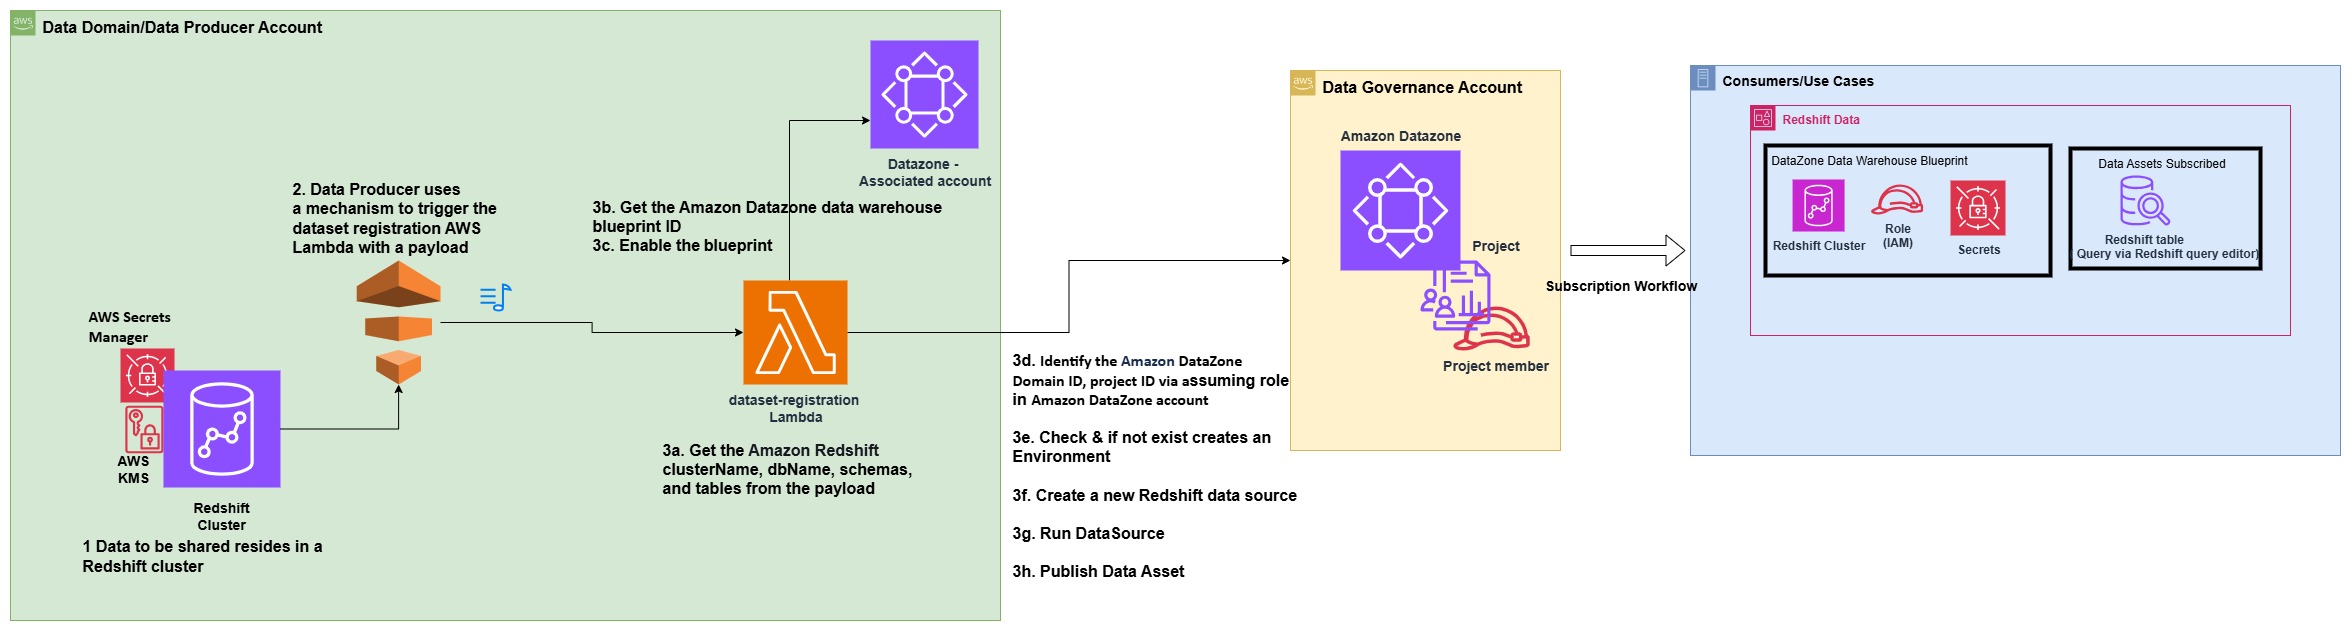
The process consists of the following steps:

  1. In the producer account (Account B), the data to be shared resides in a Redshift cluster.
  2. The producer account (Account B) uses a mechanism to trigger the dataset registration AWS Lambda function with a specific payload containing the information and name of the database, schema, table, or view that has a change in metadata.
  3. The Lambda function performs the steps to automatically register and publish the dataset in Amazon DataZone:
    1. Get the Amazon Redshift clusterName, dbName, schemas, and tables from the JSON payload, which is used as the event to trigger the Lambda function.
    2. Get the Amazon DataZone data warehouse blueprint ID.
    3. Enable the blueprint in the data producer account.
    4. Identify the Amazon DataZone Domain ID and project ID for the producer via assuming role in Amazon DataZone account (Account A).
    5. Check if an environment already exists in the project. If not, create an environment.
    6. Create a new Redshift data source by providing the correct Redshift database information in the newly created environment.
    7. Initiate a data source run request in the data source to make the Redshift tables or views available in Amazon DataZone.
    8. Publish the tables or views in the Amazon DataZone catalog.

Prerequisites

The following prerequisites are required before starting:

  • Two AWS accounts to implement the solution have been described in this post. However, you can also use Amazon DataZone to publish data within a single account or across multiple accounts.
    • Amazon DataZone account (Account A) – This is the central data governance account, which will have the Amazon DataZone domain and project.
    • Data domain producer account (Account B) – This account acts as the data domain producer. It has been added as an associated account to Account A.

Prerequisites in data domain producer account (Account B)

As part of this post, we want to publish assets and subscribe to assets from a Redshift cluster that already exists. Complete the following prerequisite steps to set up Account B:

  1. Set up the Redshift cluster, including database, schema, tables, and views (optional). The node type must be from the RA3 family. For more information, see Amazon Redshift provisioned clusters.

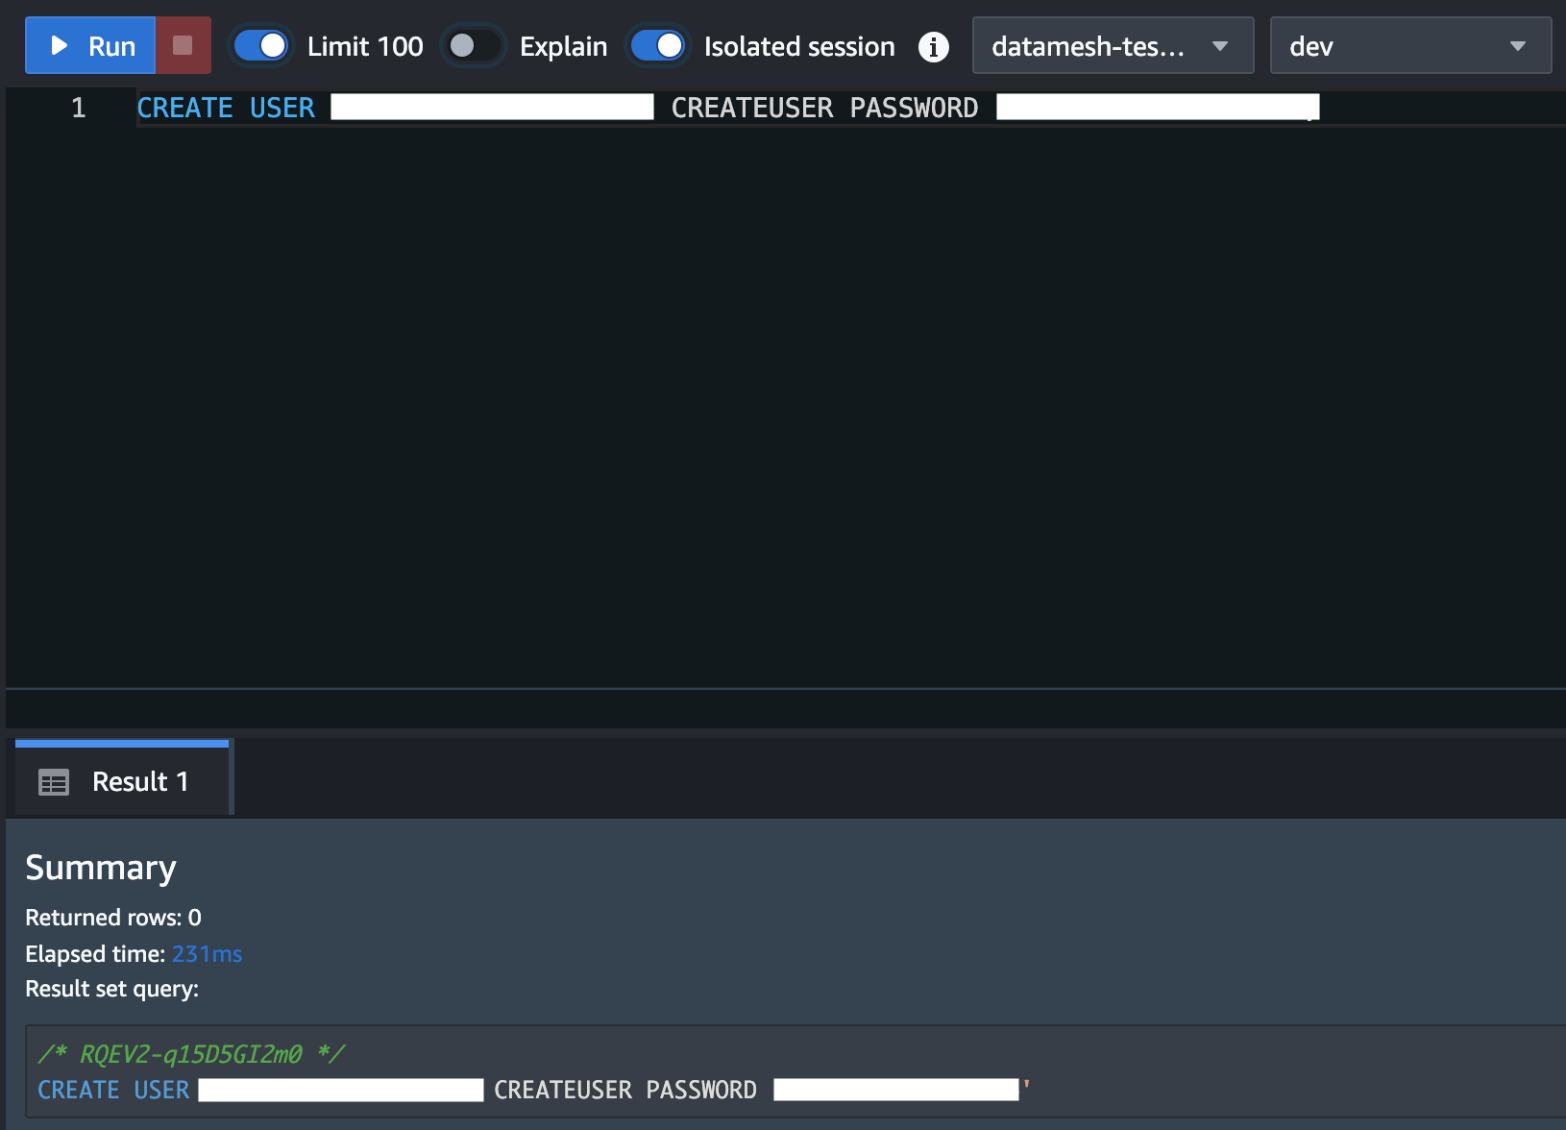
    Create a superuser in Amazon Redshift for Amazon DataZone. For the Redshift cluster, the database user you provide in AWS Secrets Manager must have superuser permissions. For reference please see the note section in this QuickStart guide with sample Amazon Redshift data

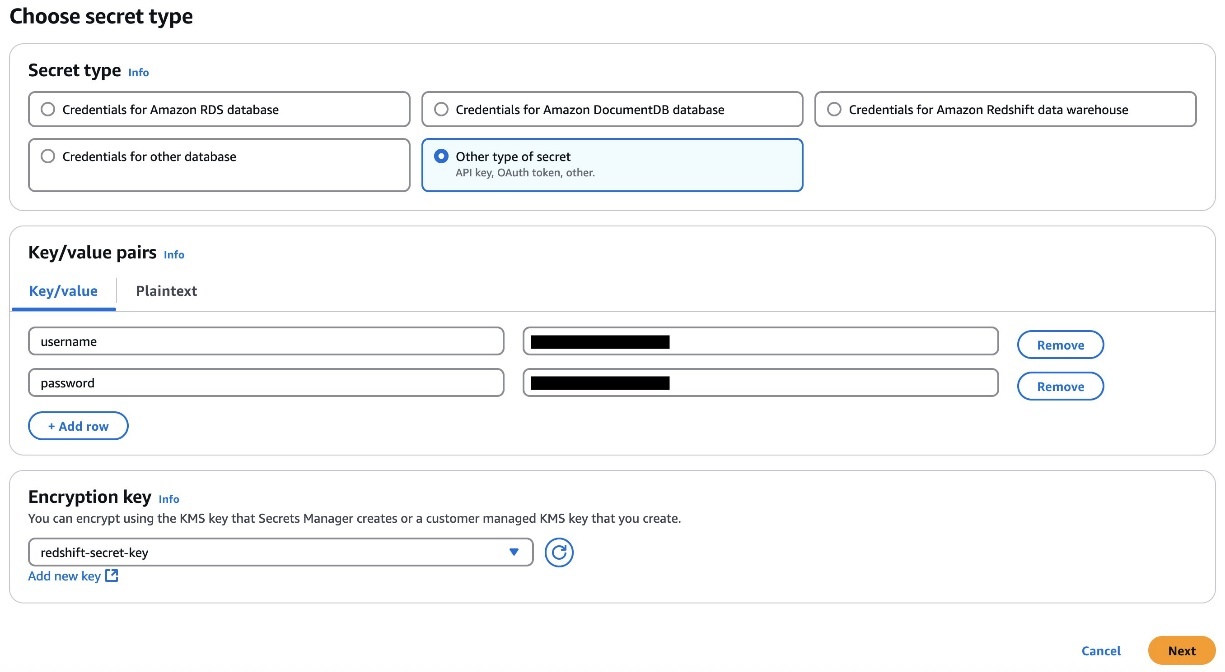
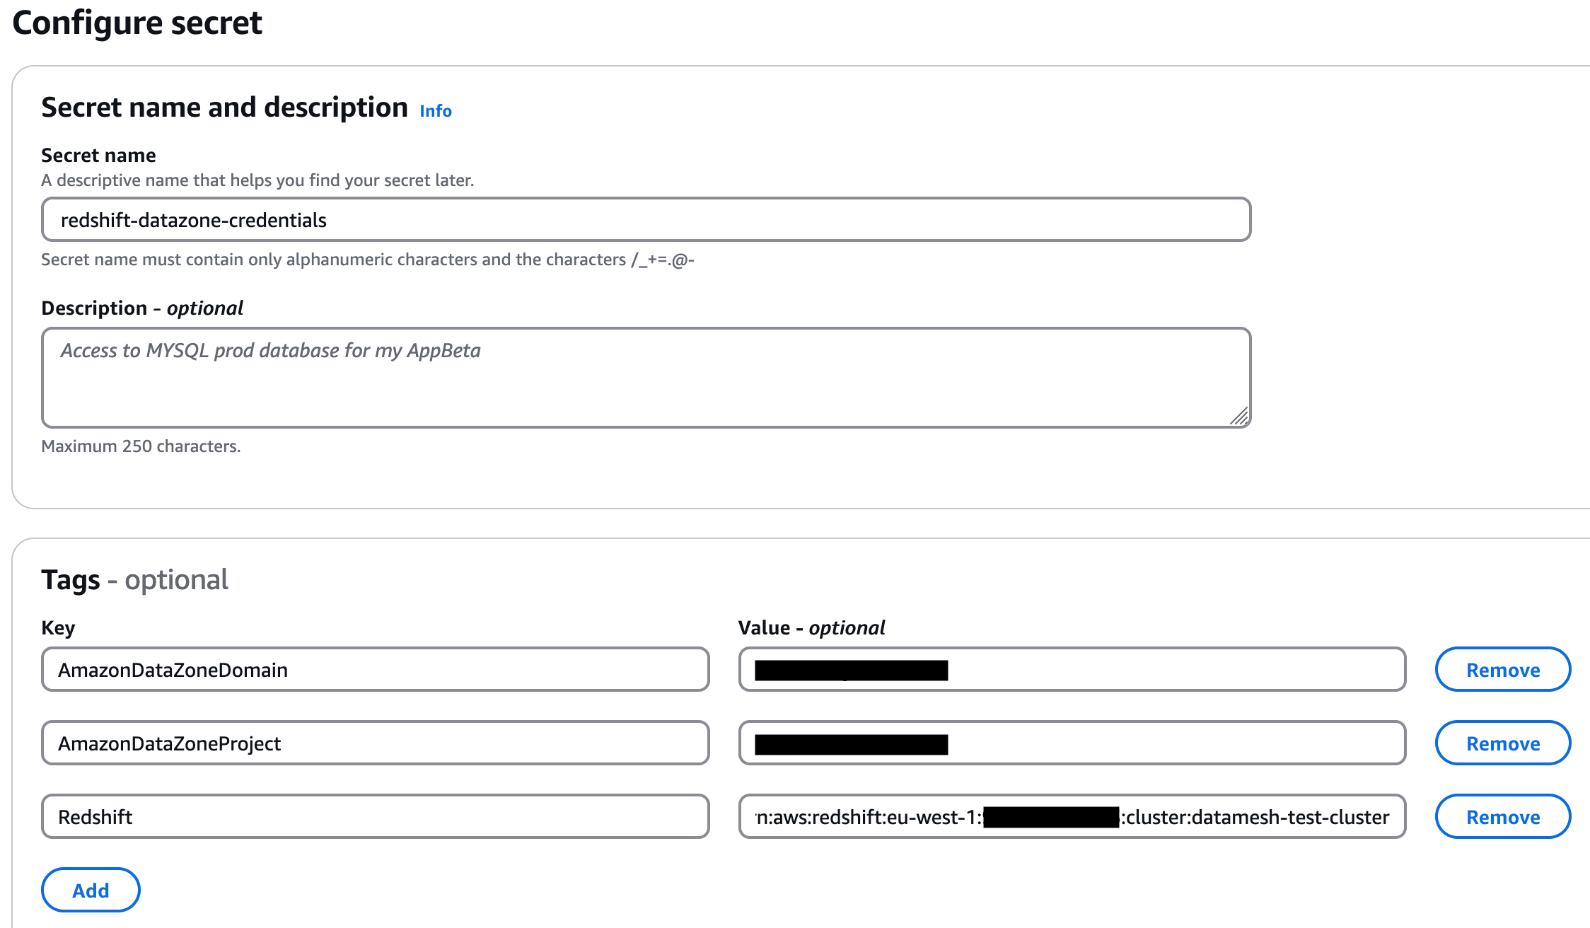
  2. Store the user’s credentials in Secrets Manager. Select the credential type, enter the credential values, and choose the AWS Key Management Service (AWS KMS) key with which to encrypt the secret.
  3. Add the tags to the Secret Manager secret to allow Amazon DataZone to find this secret and limit the access to a particular Amazon DataZone domain and Amazon DataZone project. The Redshift cluster Amazon Resource Name (ARN) must be added as a tag so it can be used by Amazon Redshift as a valid credential. For reference please see the note section in this QuickStart guide with sample Amazon Redshift data
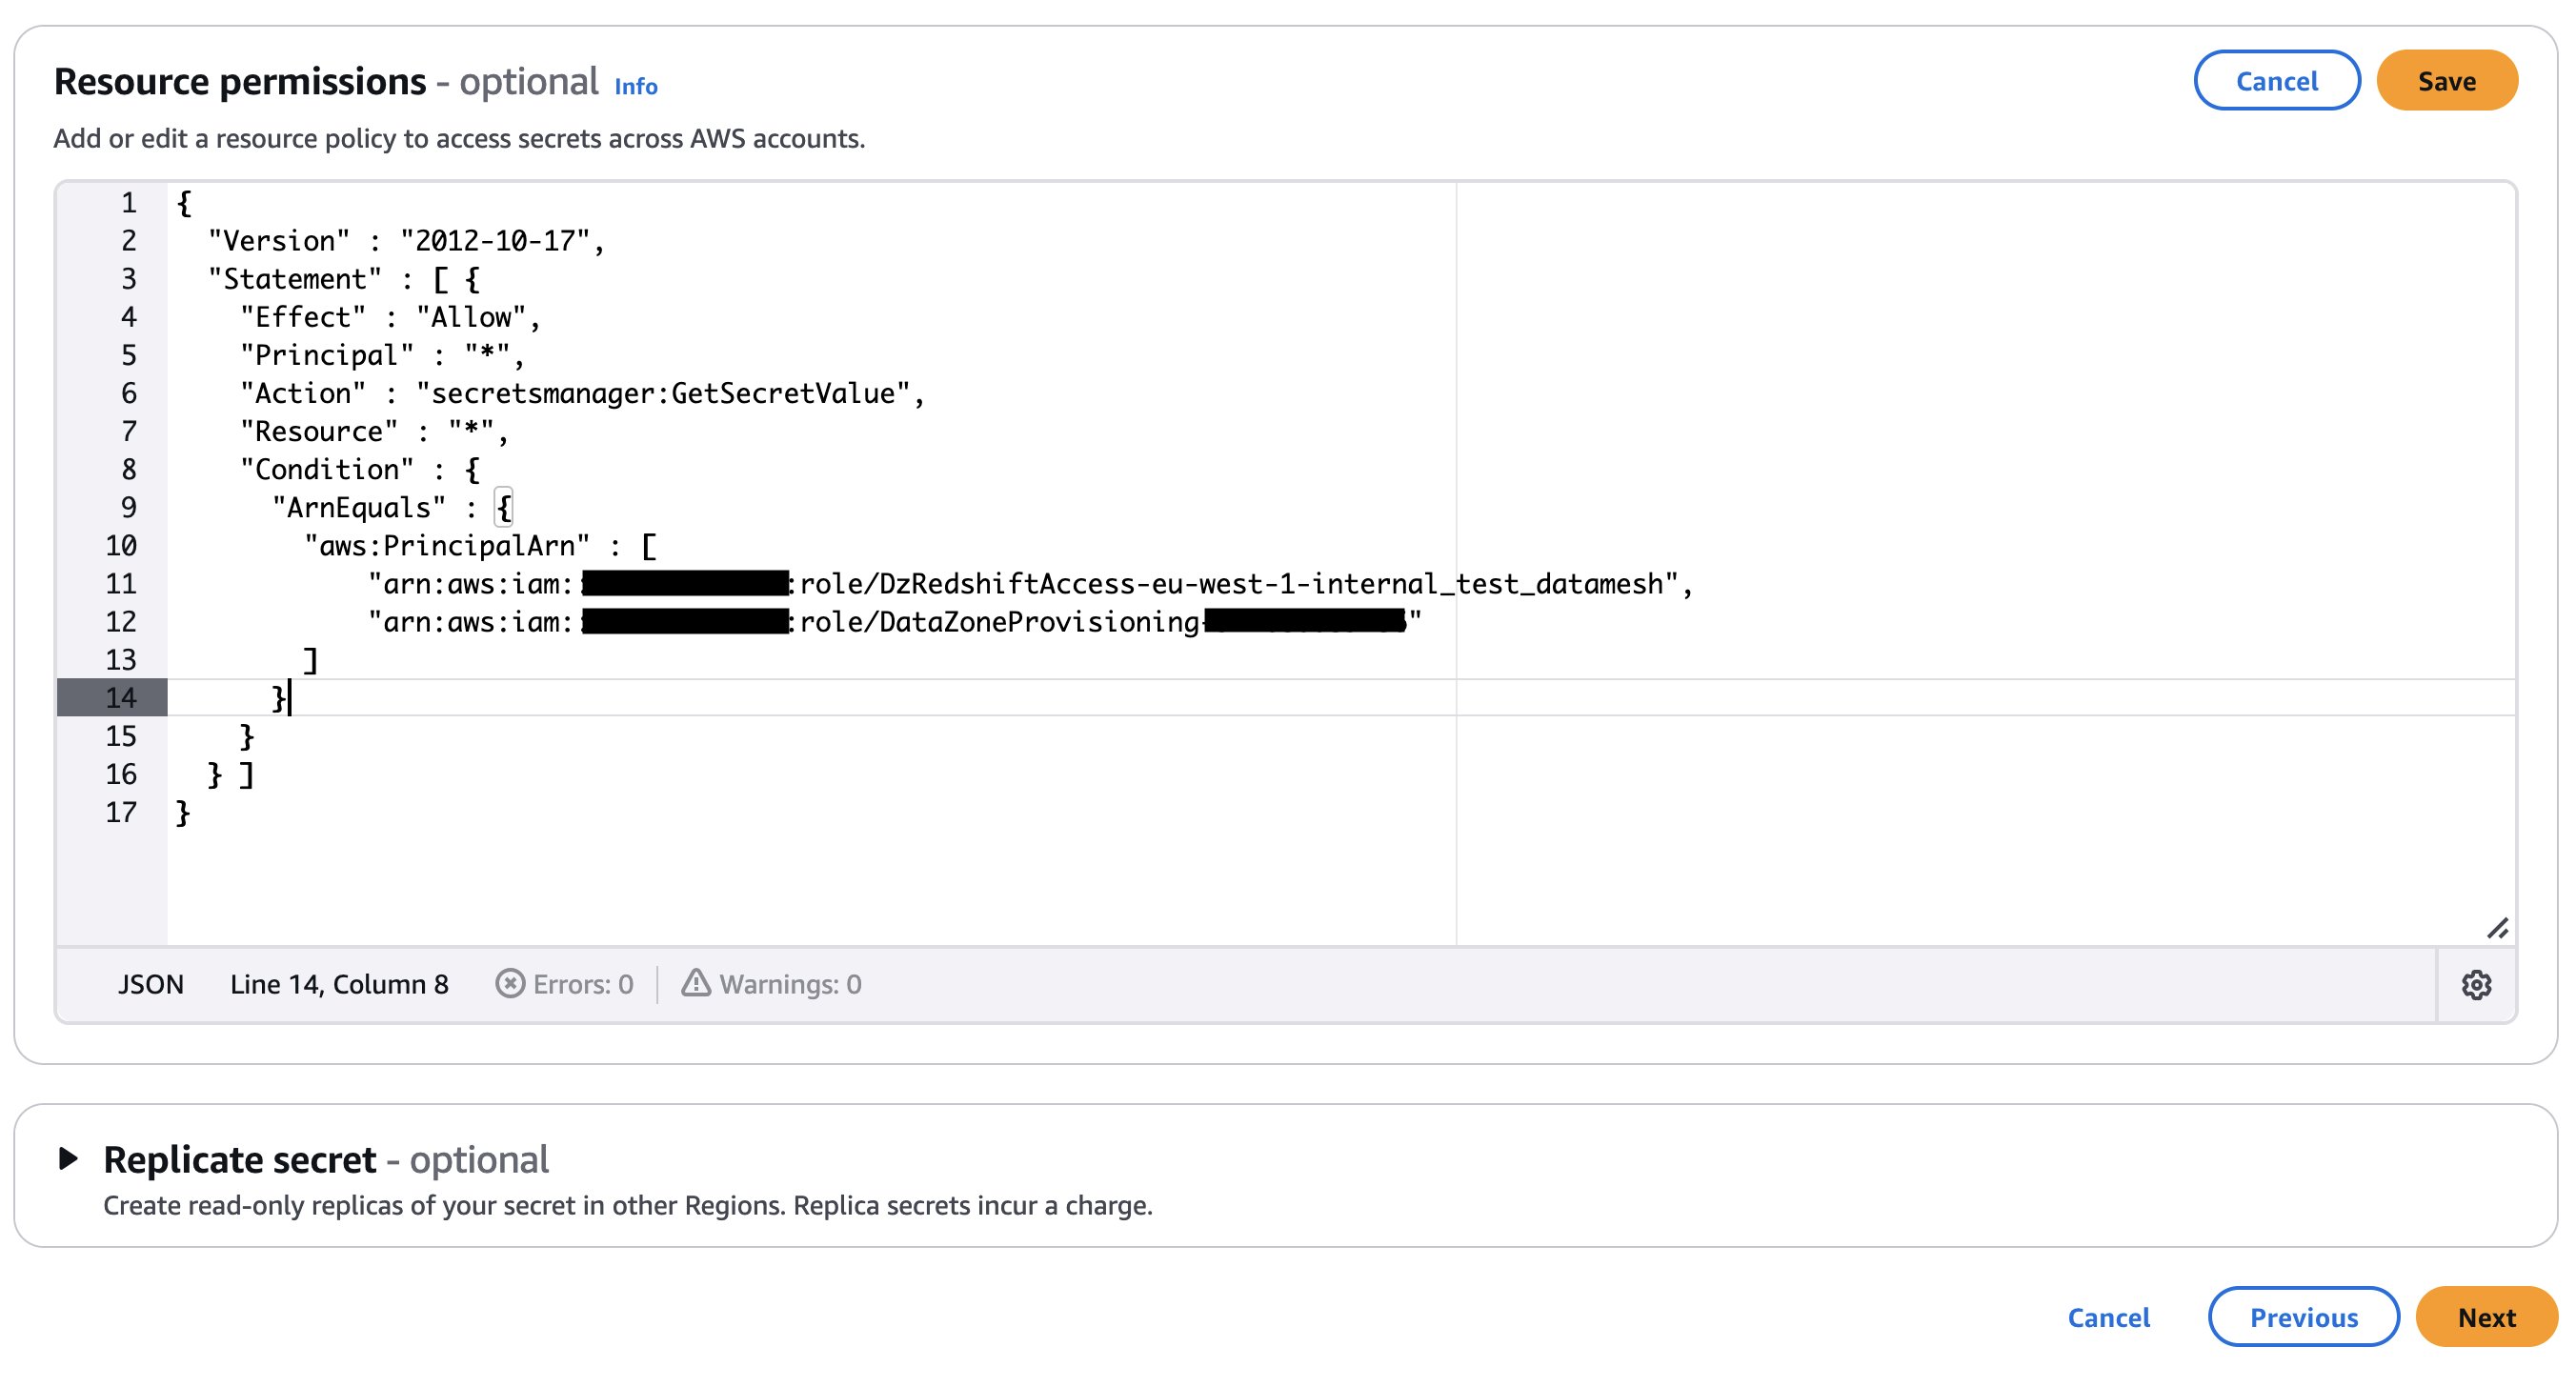
  4. Add an Amazon DataZone provisioning IAM role and Amazon Redshift manage access IAM role in the secret’s resource policy. The AWS Identity and Access Management (IAM) roles are created as part of the AWS Cloud Development Kit (AWS CDK) deployment (discussed later in this post). The following code shows an example of the Secrets Manager secret’s resource policy. Store the secret ARN in an AWS Systems Manager parameter.
    {
      "Version" : "2012-10-17",
      "Statement" : [ {
        "Effect" : "Allow",
        "Principal" : "*",
        "Action" : "secretsmanager:GetSecretValue",
        "Resource" : "*",
        "Condition" : {
          "ArnEquals" : {
            "aws:PrincipalArn" : [ 
              "arn:aws:iam::<<Data_Producer_Acct_Id(Account B)>>:role/DzRedshiftAccess-<<AWS_Region>>-<< Amazon_DataZone _Domain_Name>>",
              "arn:aws:iam::<<Data_Producer_Acct_Id(Account B)>>:role/DataZoneProvisioning-<< Amazon_DataZone_Account_id(Account A)>>"
            ]
          }
        }
      } ]
    }

    If your secret is encrypted with a custom KMS key, append the key policy with the following statement and add a tag to the key: AmazonDatazoneEnvironment = All. You can skip this step if you’re using an AWS managed KMS key.

    {
        "Effect": "Allow",
        "Principal": {
            "Service": "logs.<<AWS_Region>>.amazonaws.com",
            "AWS": "arn:aws:iam::<<Data_Producer_Acct_Id(Account B)>>:root"
        },
        "Action": [
            "kms:Decrypt",
            "kms:Encrypt",
            "kms:GenerateDataKey*",
            "kms:ReEncrypt*"
        ],
        "Resource": "*"
     },
     {
        "Sid": "AllowDatazoneRoles-DEV",
        "Effect": "Allow",
        "Principal": {
            "AWS": "*"
        },
        "Action": [
            "kms:Decrypt",
            "kms:Describe*",
            "kms:Get*",
            "kms:Encrypt",
            "kms:GenerateDataKey",
            "kms:ReEncrypt*",
            "kms:CreateGrant"
        ],
        "Resource": "*",
        "Condition": {
            "StringLike": {
                "aws:PrincipalArn": [
                    "arn:aws:iam::<<Data_Producer_Acct_Id(Account B)>>:role/aws-service-role/redshift.amazonaws.com/AWSServiceRoleForRedshift",
                    "arn:aws:iam::<<Data_Producer_Acct_Id(Account B)>>:role/datazone_*",
                    "arn:aws:iam::<<Data_Producer_Acct_Id(Account B)>>:role/<<Redshift_Cluster_IAM_Role>>",
                    "arn:aws:iam::<<Data_Producer_Acct_Id(Account B)>>:role/service-role/AmazonDataZoneRedshiftAccess-<<AWS_Region>>-*"
                ]
             }
         }
     } 

  5. Place a mechanism to generate the following payload to trigger the dataset registration Lambda function. The payload must contain the relevant Redshift database, schema, and table or view that you want to publish in the Amazon DataZone domain. The following example code assumes you have three databases in your Redshift cluster and within those databases you have different schemas, tables, and views. You should adjust the payload based on your use case.
    {
        "source": "redshift-user-initiated",
        "detail-type": "Amazon Redshift dataset registration in Amazon DataZone",
        "datasets": [
            {
                "clusterName": "<<YOUR_REDSHIFT_CLUSTER_NAME>>",
                "dbName":"<<YOUR_REDSHIFT_DATABASE_NAME_1>>",
                "schemas": [
                    {
                        "schemaName":"<<YOUR_REDSHIFT_SCHEMA_NAME>>",
                        "addAllTables":false,
                        "addAllViews":false,
                        "tables":[
                            "<<YOUR_REDSHIFT_TABLE_NAME>>",
                            "<<YOUR_REDSHIFT_TABLE_NAME>>"
                        ],
                        "views":[
                            "<<YOUR_REDSHIFT_VIEW_NAME>>"
                        ]
                    }
                ]
            },
            {
                "clusterName": "<<YOUR_REDSHIFT_CLUSTER_NAME>>",
                "dbName":"<<YOUR_REDSHIFT_DATABASE_NAME_2>>",
                "schemas": [
                    {
                        "schemaName":"<<YOUR_REDSHIFT_SCHEMA_NAME>>",
                        "addAllTables":true,
                        "addAllViews":true,
                        "tables":[],
                        "views":[]
                    }
                ]
            },
            {
                "clusterName": "<<YOUR_REDSHIFT_CLUSTER_NAME>>",
                "dbName":"<<YOUR_REDSHIFT_DATABASE_NAME_3>>",
                "schemas": [
                    {
                        "schemaName":"<<YOUR_REDSHIFT_SCHEMA_NAME>>",
                        "addAllTables":true,
                        "addAllViews":false,
                        "tables":[],
                        "views":[
                            "<<YOUR_REDSHIFT_VIEW_NAME>>"
                        ]
                    }
                ]
            }
        ]
    }

Prerequisites in Amazon DataZone account (Account A)

Complete the following steps to set up your Amazon DataZone account (Account A):

  1. Sign in to Account A and make sure you have already deployed an Amazon DataZone domain and a project within that domain. Refer to Create Amazon DataZone domains for instructions to create a domain.
  2. If your Amazon DataZone domain is encrypted with a KMS key, add the data domain account (Account B) to the KMS key policy with the following actions:
    "Action": [
        "kms:Encrypt",
        "kms:Decrypt",
        "kms:ReEncrypt*",
        "kms:GenerateDataKey*",
        "kms:DescribeKey"
    ]

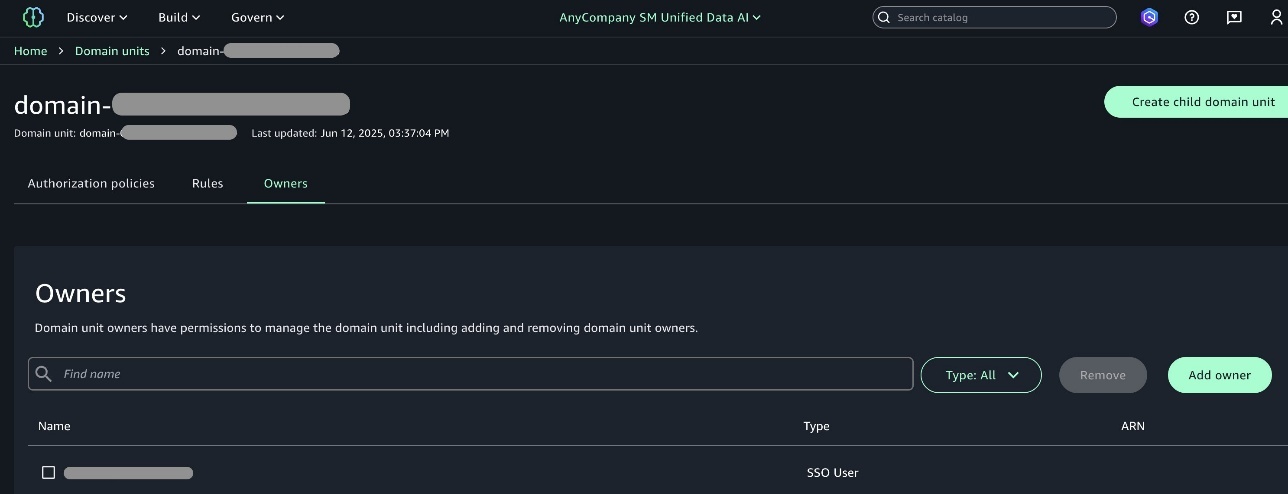
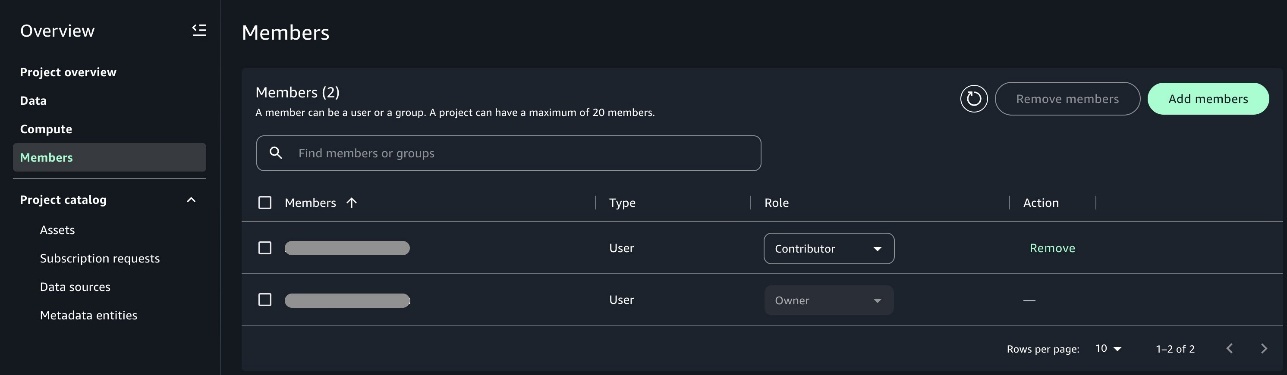
  3. Create an IAM role that is assumable by Account B and make sure the role has a following policy attached and is a member (as contributor) of your Amazon DataZone project. For this post, we call the role dz-assumable-env-dataset-registration-role. By adding this role, you can successfully run the registration Lambda function.
    1. In the following policy, provide the AWS Region and account ID corresponding to where your Amazon DataZone domain is created, and the KMS key ARN used to encrypt the domain:
        {
          "Version": "2012-10-17",
          "Statement": [
              {
                  "Action": [
                      "datazone:CreateDataSource",
                      "datazone:CreateEnvironment",
                      "datazone:CreateEnvironmentProfile",
                      "datazone:GetDataSource",
                      "datazone:GetDataSourceRun",
                      "datazone:GetEnvironment",
                      "datazone:GetEnvironmentProfile",
                      "datazone:GetIamPortalLoginUrl",
                      "datazone:ListDataSources",
                      "datazone:ListDomains",
                      "datazone:ListEnvironmentProfiles",
                      "datazone:ListEnvironments",
                      "datazone:ListProjectMemberships",
                      "datazone:ListProjects",
                      "datazone:StartDataSourceRun",
                      "datazone:UpdateDataSource",
                      "datazone:SearchUserProfiles"
                  ],
                  "Resource": "*",
                  "Effect": "Allow"
              },
              {
                  "Action": [
                      "kms:Decrypt",
                      "kms:DescribeKey",
                      "kms:GenerateDataKey"
                  ],
                  "Resource": "arn:aws:kms:<<account_region>>:<<Datazone_Account_id(Account A)>>
      
      
      }:key/${DataZonekmsKey}",
                  "Effect": "Allow"
              }
          ]
      }

    2. Add Account B in the trust relationship of this role with the following trust relationship:
      {
          "Version": "2012-10-17",
          "Statement": [
              {
                  "Effect": "Allow",
                  "Principal": {
                      "AWS": [
                          "arn:aws:iam::<<Data_Producer_Acct_Id(Account B)>>:root",
                          "arn:aws:iam::<<Datazone_Account_id(Account A)>>:root",
                      ]
                  },
                  "Action": "sts:AssumeRole"
              }
          ]
      }

    3. Add the role as a member of the Amazon DataZone project in which you want to register your data sources. For more information, see Add members to a project.

Additional tools

The following tools are needed to deploy the solution using the AWS CDK:

Deploy the solution

After you complete the prerequisites, use the AWS CDK stack provided on the GitHub repo to deploy the solution for automatic registration of data assets into the Amazon DataZone domain. Complete the following steps:

  1. Clone the repository from GitHub to your preferred integrated development environment (IDE) using the following commands:
    git clone https://github.com/aws-samples/sample-how-to-automate-amazon-redshift-cluster-data-asset-publish-to-amazon-datazone

    $ cd sample-how-to-automate-amazon-redshift-cluster-data-asset-publish-to-amazon-datazone

  2. At the base of the repository folder, run the following commands to build and deploy resources to AWS:
    $ npm install

    $ npm run lint

  3. Sign in to Account B (the data domain producer account) using the AWS CLI with your profile name.
  4. Make sure you have configured the Region in your credential’s configuration file.
  5. Bootstrap the AWS CDK environment with the following commands at the base of the repository folder. Provide the profile name of your deployment account (Account B). Bootstrapping is a one-time activity and is not needed if your AWS account is already bootstrapped.
    $ export AWS_PROFILE=<<PROFILE_NAME>>

    $ npm run cdk bootstrap

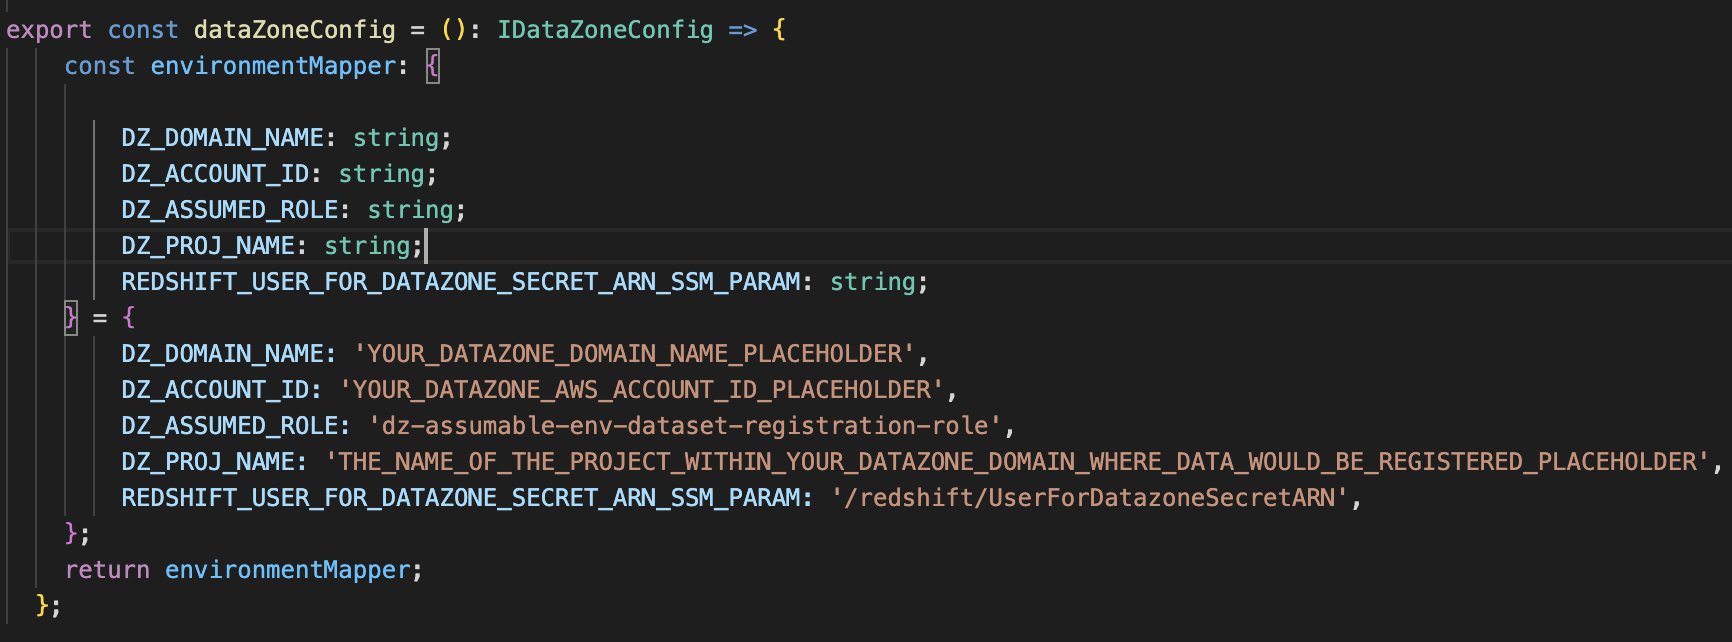
  6. Replace the placeholder parameters (marked with the suffix _PLACEHOLDER) in the file config/DataZoneConfig.ts:
    1. Amazon DataZone domain and project name of your Amazon DataZone instance. Make sure all names are in lowercase.
    2. The AWS account ID of the Amazon DataZone account (Account A).
    3. The assumable IAM role from the prerequisites.
    4. The AWS Systems Manager parameter name containing the Secrets Manager secret ARN of the Amazon Redshift credentials.

  7. Use the following command in the base folder to deploy the AWS CDK solution. During deployment, enter
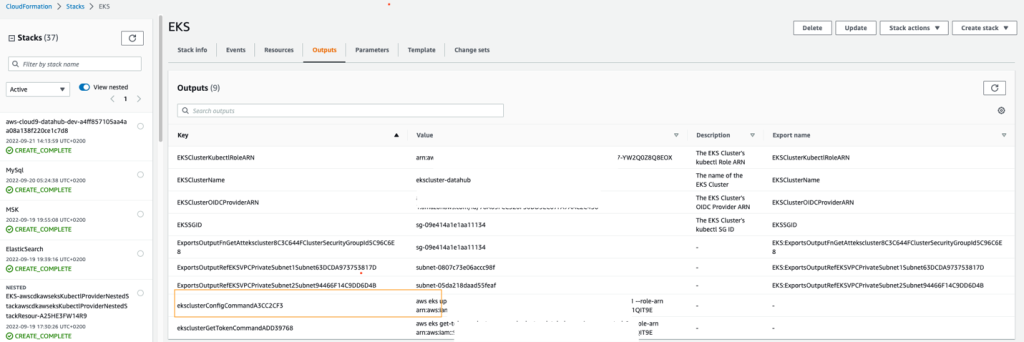
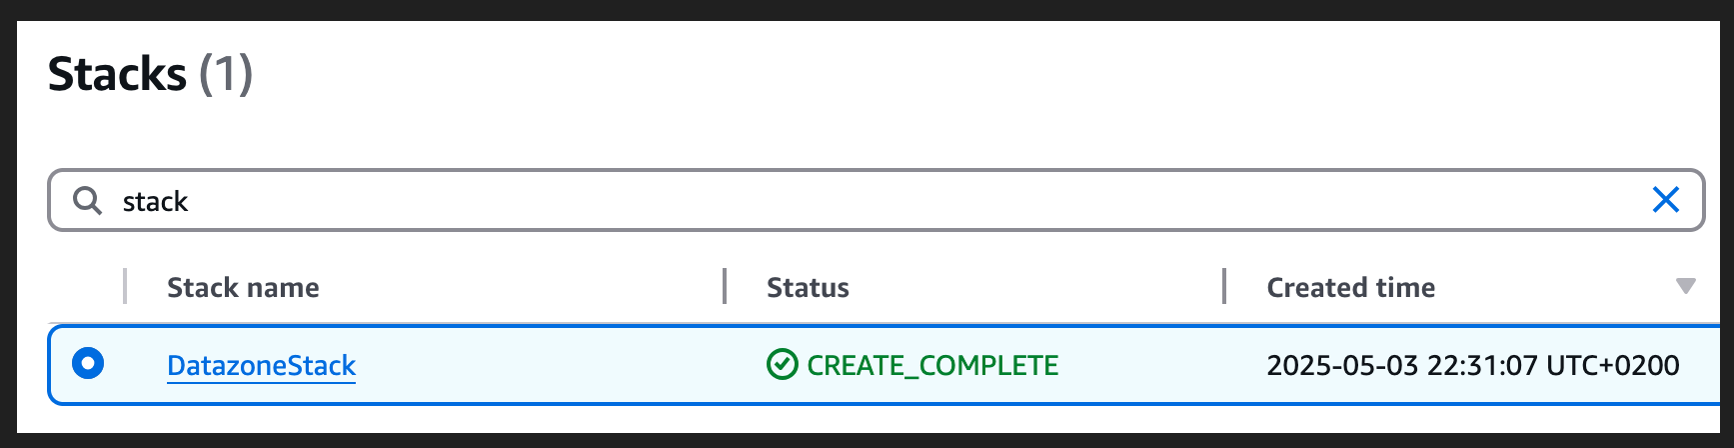
 y if you want to deploy the changes for some stacks when you see the prompt Do you wish to deploy these changes (y/n)?
    npm run cdk deploy --all

  8. After the deployment is complete, sign in to Account B and open the AWS CloudFormation console to verify that the infrastructure was deployed.

Test automatic data registration to Amazon DataZone

Complete the following steps to test the solution:

  1. Sign in to Account B (producer account).
  2. On the Lambda console, open the datazone-redshift-dataset-registration function.
  3. Under TEST EVENTS, choose Create new test event.
  4. For Event name, enter Redshift, and for Event JSON, enter the following JSON structure (change the cluster, schema, database, and table names according to your environment):
    {
      "source": "redshift-user-initiated",
      "detail-type": "Amazon Redshift dataset registration in Amazon DataZone",
      "datasets": [
        {
          "clusterName": "YOUR_REDSHIFT_CLUSTER_NAME",
          "dbName": "DATABASE_NAME",
          "schemas": [
            {
              "schemaName": "SCHEMA_NAME_1",
              "addAllTables": false,
              "addAllViews": false,
              "tables": [
                "TABLE_NAME"
              ],
              "views": []
            },
            {
              "schemaName": "SCHEMA_NAME_2",
              "addAllTables": false,
              "addAllViews": false,
              "tables": [],
              "views": [
                "VIEW_NAME"
              ]
            }
          ]
        }
      ]
    }

  5. Choose Save.
  6. Choose Invoke.
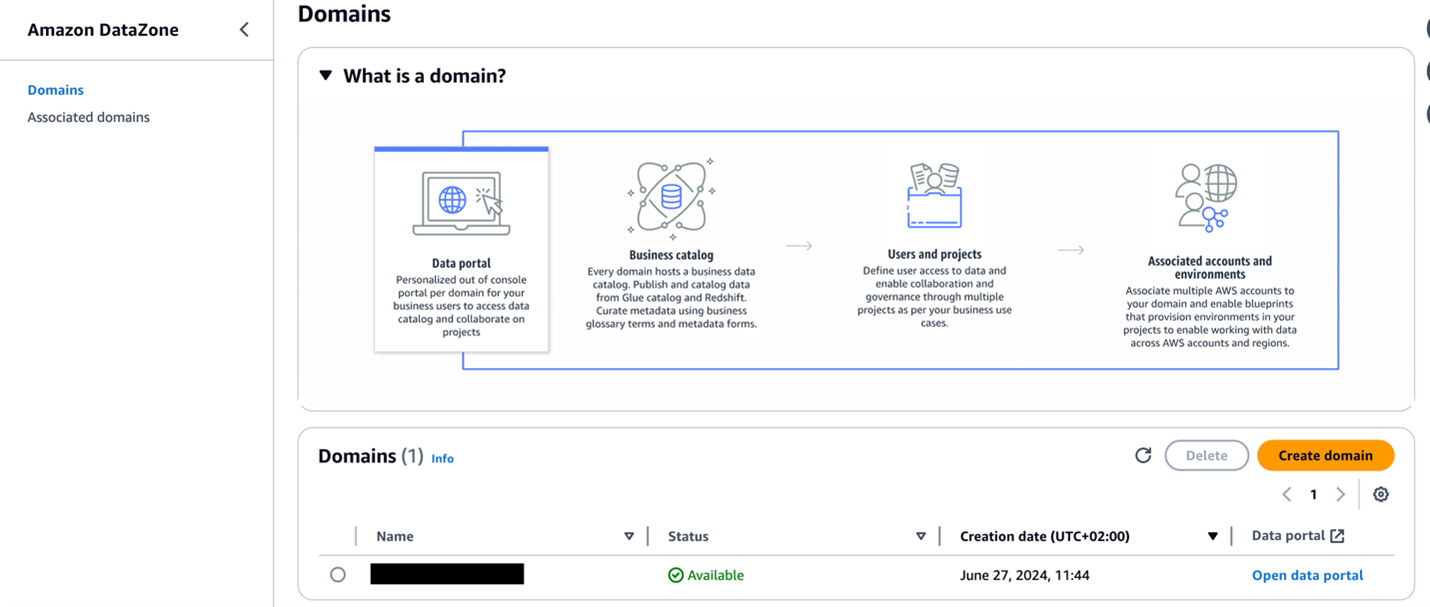
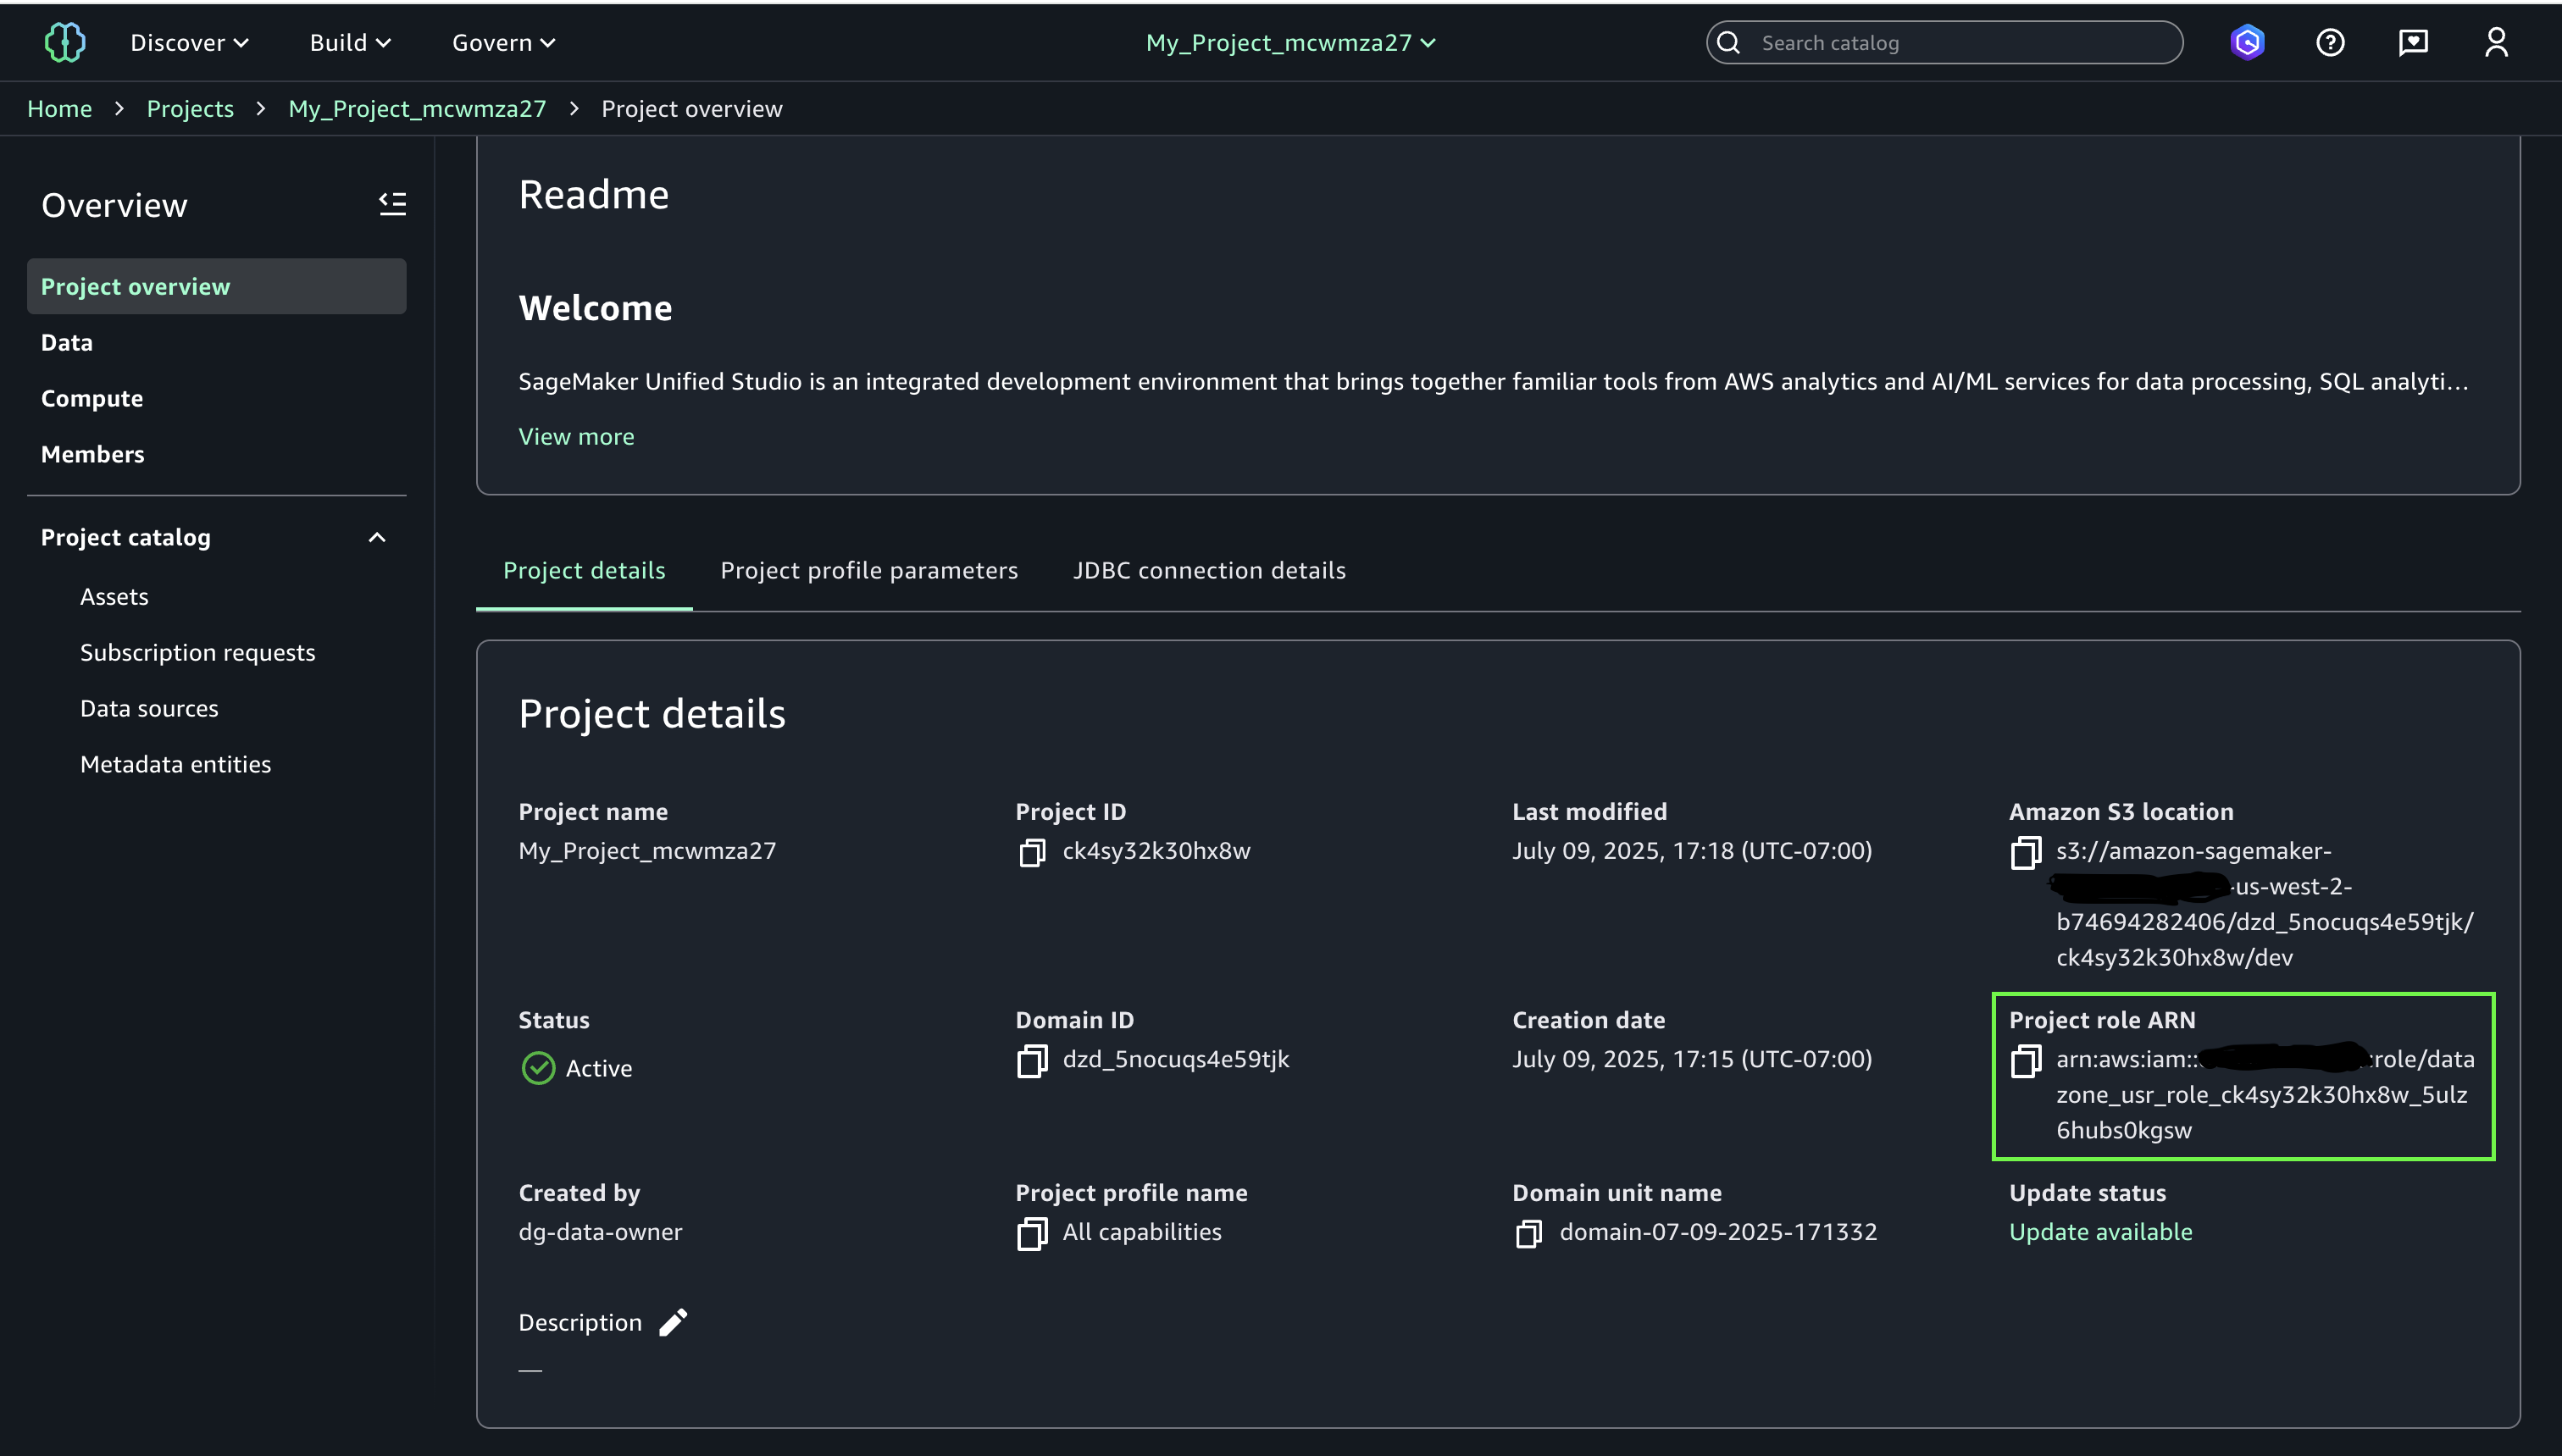
  7. Open the Amazon DataZone console in Account A where you deployed the resources.
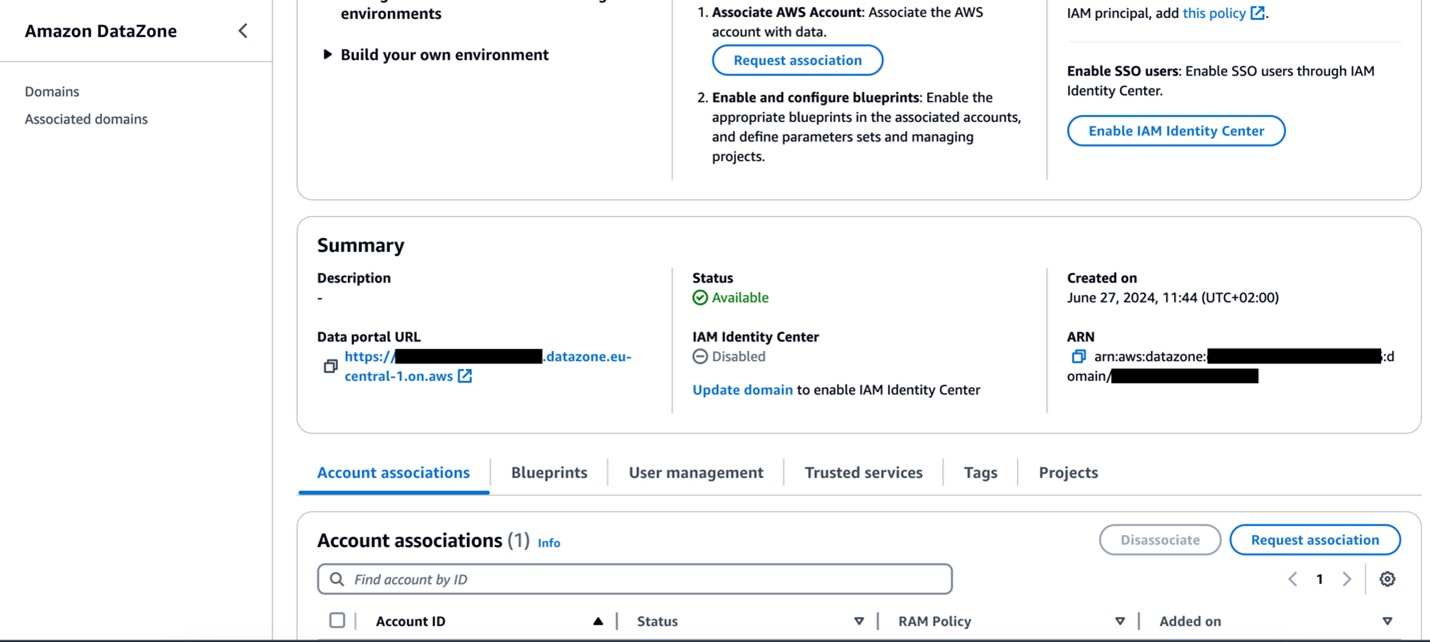
  8. Choose Domains in the navigation pane, then open your domain.
  9. On the domain details page, locate the Amazon DataZone data portal URL in the Summary section. Choose the link to the data portal.

    For more details about accessing Amazon DataZone, refer to How can I access Amazon DataZone?

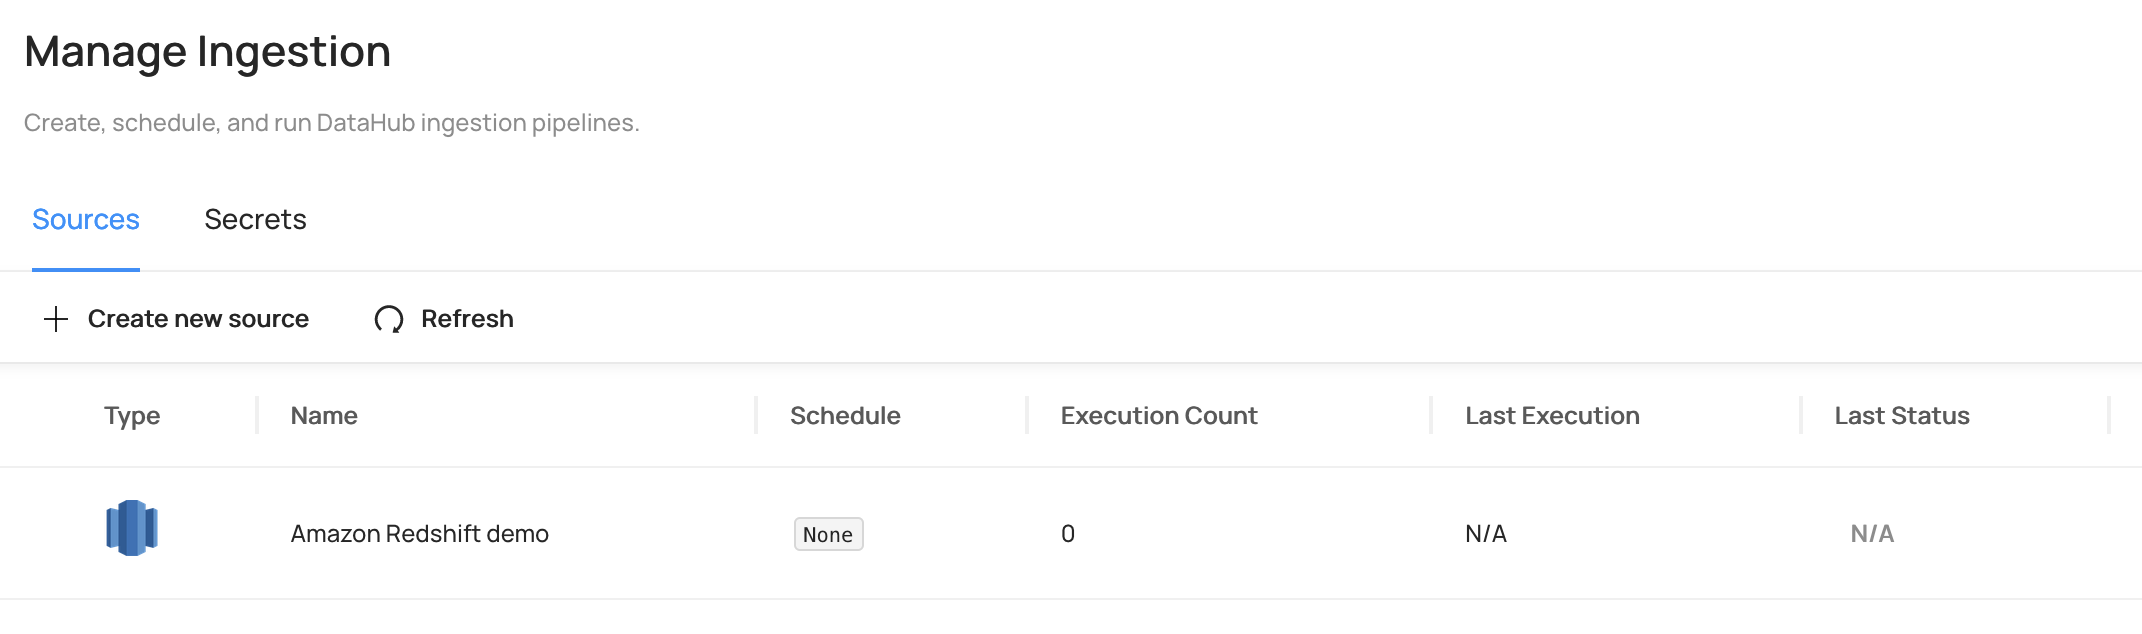
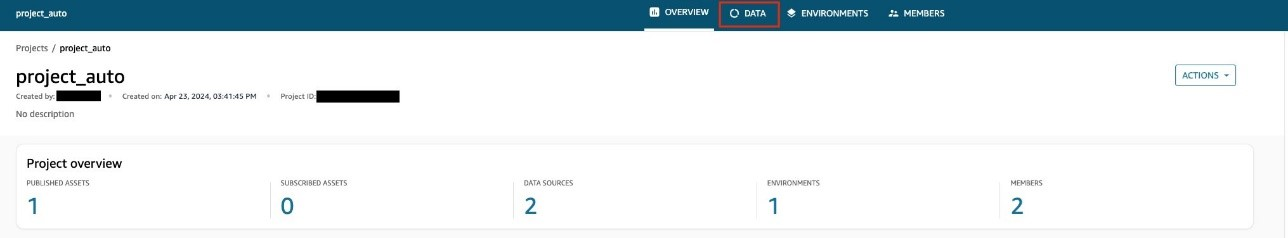
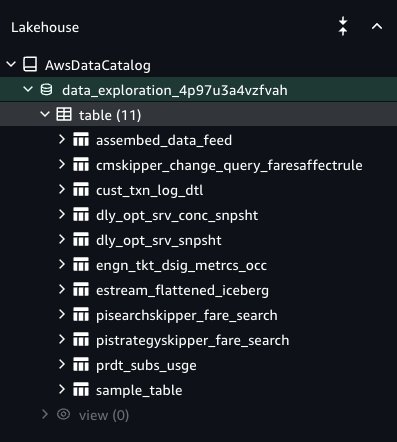
  10. In the data portal, open your project and choose the Data tab.
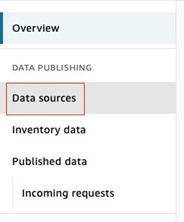
  11. In the navigation pane, choose Data sources and find the newly created data source for Amazon Redshift.
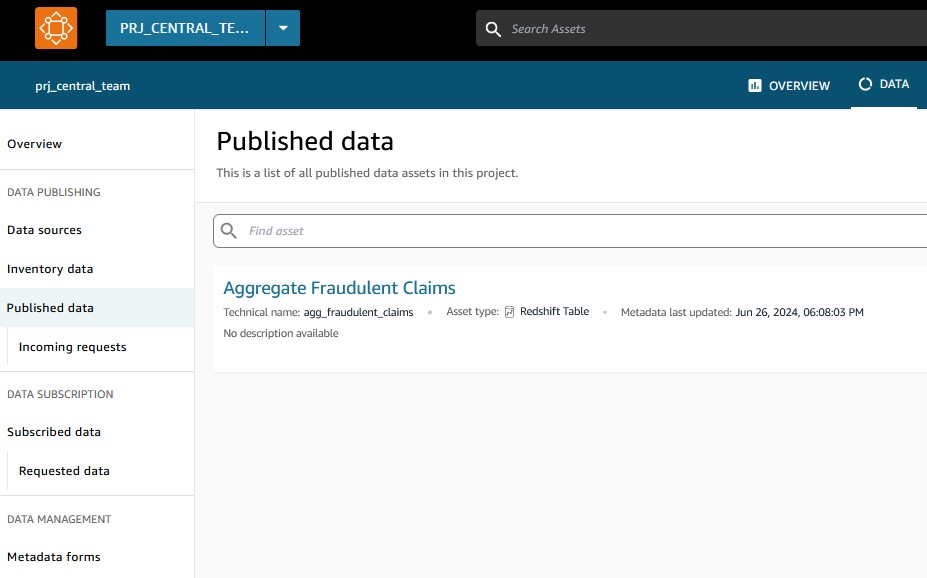
  12. Verify that the data source has been successfully published.

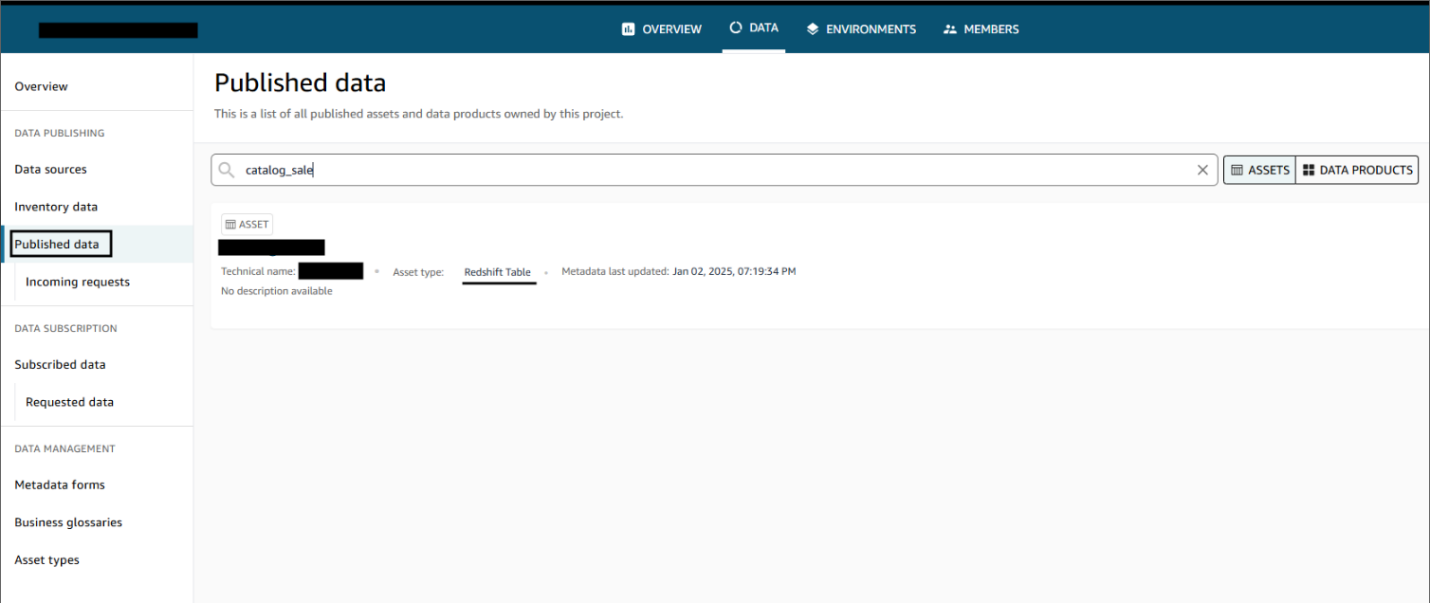
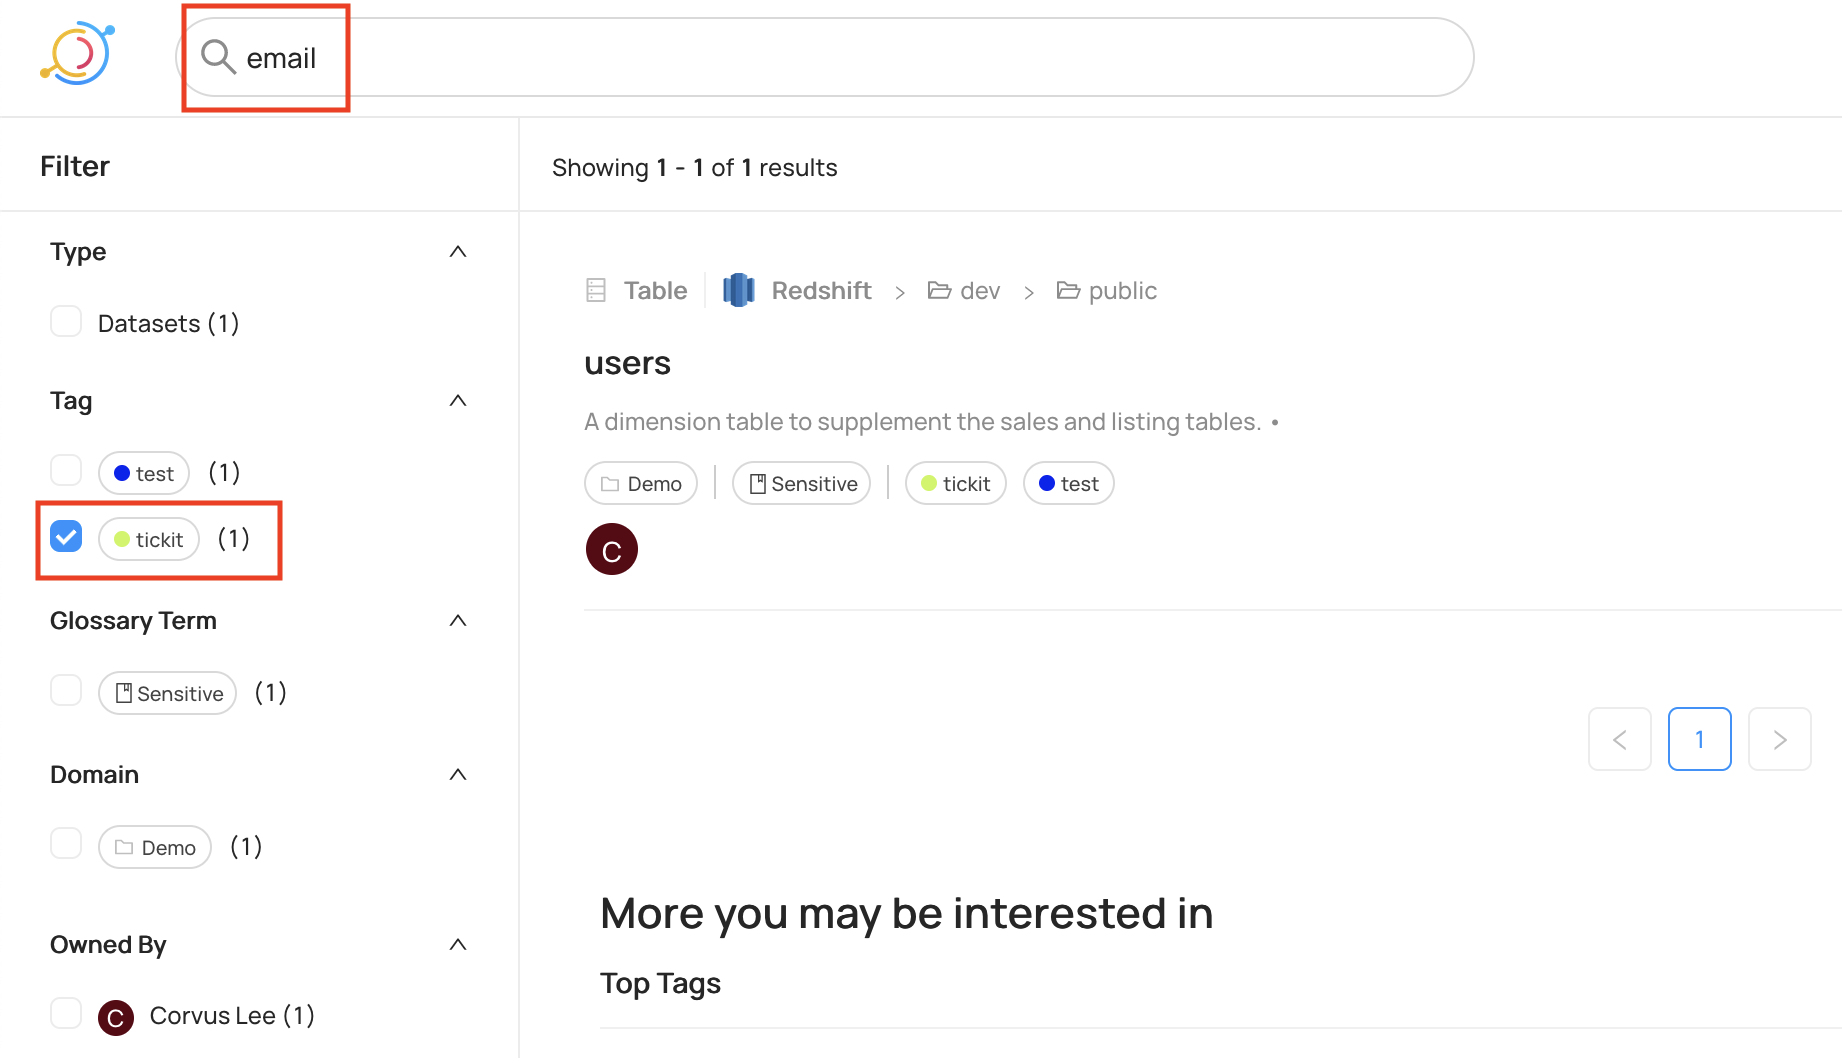
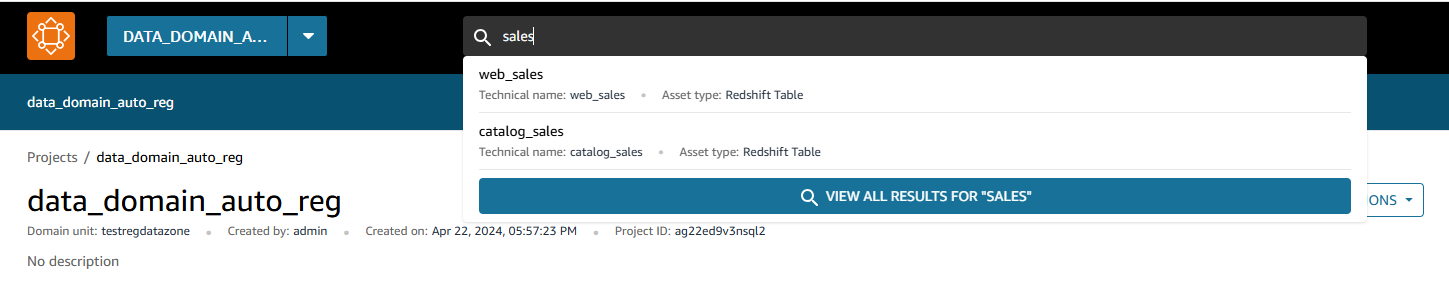
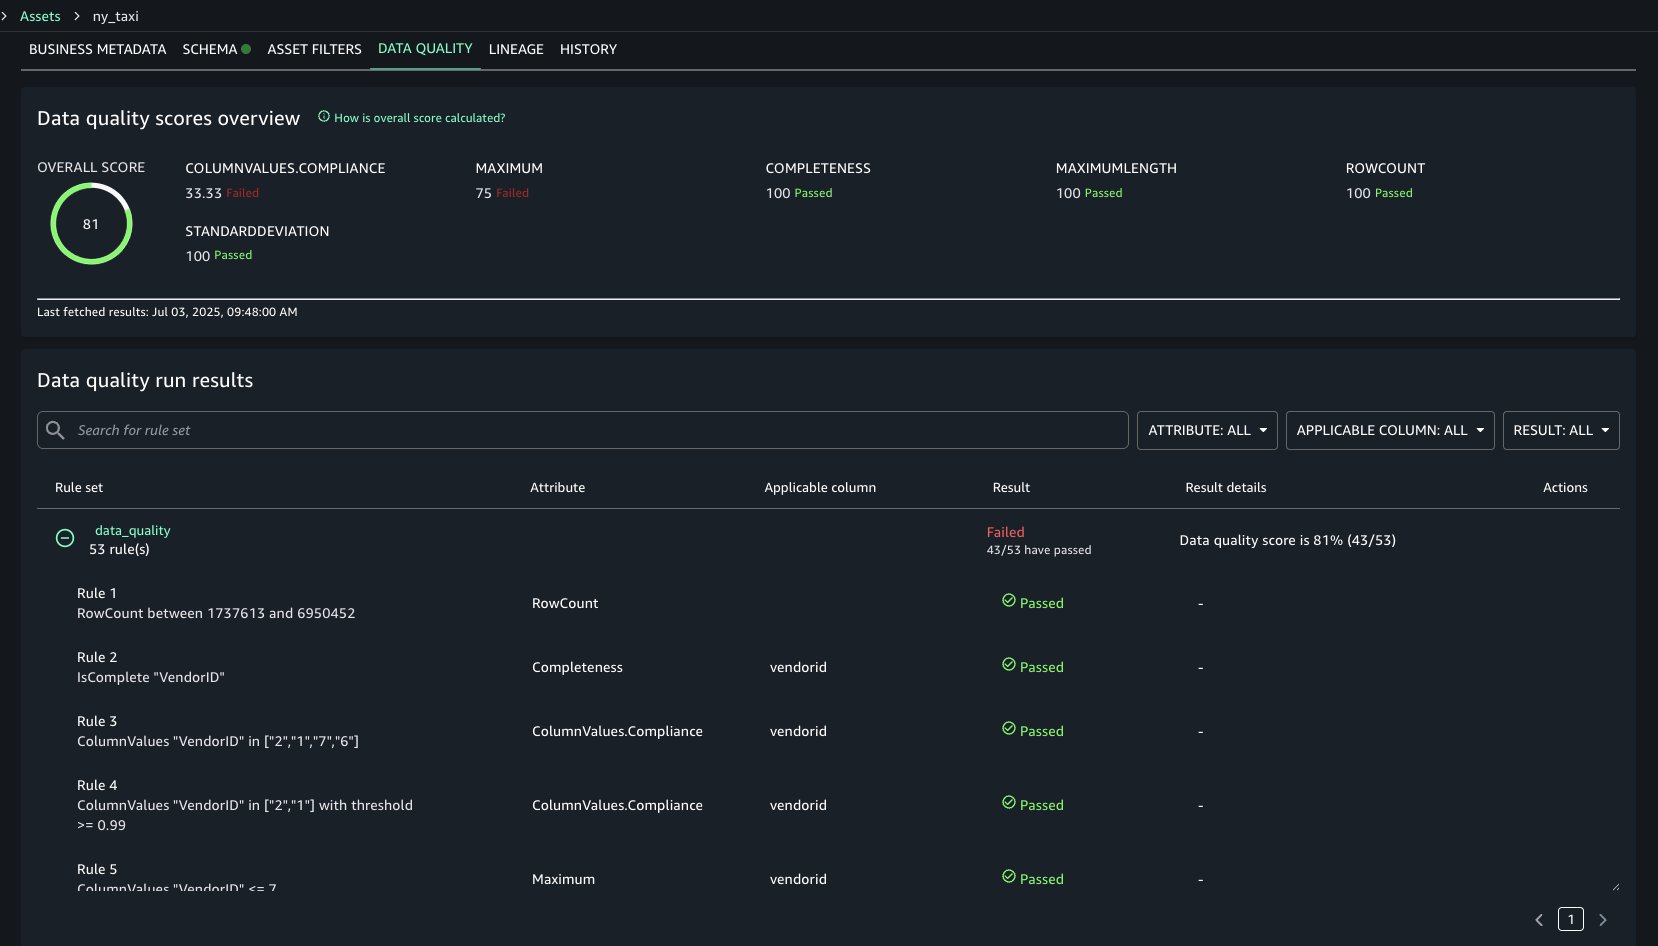
After the data sources are published, users can discover the published data and submit a subscription request. The data producer can approve or reject requests. Upon approval, users can consume the data by querying the data in the Amazon Redshift query editor. The following screenshot illustrates data discovery in the Amazon DataZone data portal.

Clean up

Complete the following steps to clean up the resources deployed through the AWS CDK:

  1. Sign in to Account B, go to the Amazon DataZone domain portal, and check there is no subscription for your published data asset. If there is a subscription, either ask the subscriber to unsubscribe or revoke the subscription request.
  2. Delete the published data assets that were created in the Amazon DataZone project by the dataset registration Lambda function.
  3. Delete the remaining resources created using the following command in the base folder:
    npm run cdk destroy –all

Conclusion

Amazon DataZone offers a seamless integration with AWS services, providing a powerful solution for organizations like Volkswagen to break down their data silos and implement effective data mesh architectures through a straightforward implementation highlighted in this post. By using Amazon DataZone, Volkswagen addressed its immediate data sharing hurdles and laid the groundwork for a more agile, data-driven future in automotive manufacturing. The automated data publishing from various warehouses, coupled with standardized governance workflows, has significantly reduced the manual overhead that once slowed down Volkswagen’s data engineering teams. Now, instead of navigating a labyrinth of emails, tickets, and communication, Volkswagen’s data engineers and data scientists can quickly discover and access the data they need, all while maintaining their security and compliance standards.

By using Amazon DataZone, organizations can bring their isolated data together in ways that make it simpler for teams to collaborate while maintaining security and compliance at scale. This approach not only addresses current data governance challenges but also creates a highly scalable foundation for future data-driven innovations. For guidance on establishing your organization’s data mesh with Amazon DataZone, contact your AWS team today.


About the Authors

Bandana Das

Bandana Das

Bandana is a Senior Data Architect in AWS and specializes in data and analytics. She builds event-driven data architectures to support customers in data management and data-driven decision-making. She is also passionate about helping customers on their data management journey to the cloud.

Anirban Saha

Anirban Saha

Anirban is a DevOps Architect at AWS, specializing in architecting and implementation of solutions for customer challenges in the automotive domain. He is passionate about well-architected infrastructures, automation, data-driven solutions, and helping make the customer’s cloud journey as seamless as possible. In his spare time, he likes to keep himself engaged with reading, painting, language learning, and traveling.

Stoyan Stoyanov

Stoyan Stoyanov

Stoyan works for AWS as a DevOps Engineer. He has more than 10 years of experience in software engineering, cloud technologies, DevOps, data engineering, and security.

Sindi Cali

Sindi Cali

Sindi is a ProServe Associate Consultant with AWS Professional Services. She supports customers in building data-driven applications in AWS.

Guide to adopting Amazon SageMaker Unified Studio from ATPCO’s Journey

Post Syndicated from Mitesh Patel original https://aws.amazon.com/blogs/big-data/guide-to-adopting-amazon-sagemaker-unified-studio-from-atpcos-journey/

This blog post is co-written with Raj Samineni from ATPCO.

Launched at AWS re:Invent 2024, the next generation of Amazon SageMaker is expediting innovation for organizations such as ATPCO through a unified data management and tooling experience for analytics and AI use cases. This comprehensive service provides both technical and business users with Amazon SageMaker Unified Studio, a single data and AI development environment to discover the data and put it to work using familiar AWS tools. SageMaker Unified Studio offers a single governed environment to complete end-to-end development workflows, including data analysis, data processing, model training, generative AI application building, and more. It simplifies the creation of analytics and AI applications, fast-tracking the journey from raw data to actionable insights through its integrated data and tooling environment.

ATPCO is the backbone of modern airline retailing, helping airlines and third-party channels deliver the right offers to customers at the right time. ATPCO’s vision is to be the platform driving innovation in airline retailing while remaining a trusted partner to the airline ecosystem. ATPCO aims to support data-driven decision-making by making high-quality data discoverable by every business unit, with the appropriate governance on who can access what, and required tooling to support their needs. ATPCO addressed data governance challenges using Amazon DataZone. SageMaker Unified Studio, built on the same architecture as Amazon DataZone, offers additional capabilities, so users can complete various tasks such as building data pipelines using AWS Glue and Amazon EMR, or conducting analyses using Amazon Athena and Amazon Redshift query editor across diverse datasets, all within a single, unified environment.

In this post, we walk you through the challenges ATPCO addresses for their business using SageMaker Unified Studio. We start with the admin flow, a one-time setup process that lays the foundation for non-admin users in preparation for a company-wide rollout. When onboarding users from different business units to SageMaker Unified Studio, it’s crucial to make sure they have immediate access to their data sources such as Amazon Simple Storage Service (Amazon S3), AWS Glue Data Catalog, and Redshift tables as well as tools like Amazon EMR, AWS Glue, and Amazon Redshift that they already use. This helps users become productive swiftly and use the full potential of SageMaker Unified Studio. Next, we walk you through the developer flow, detailing how non-admin users can use SageMaker Unified Studio to access their data and act on it using their choice of tools.

“SageMaker Unified Studio has transformed how our teams access and collaborate on data. It’s the first time business and technical users can work together in a single, intuitive environment—no more tool switching or fragmented workflows.”
–Rajesh Samineni, Director of Data Engineering at ATPCO

ATPCO’s challenges

The implementation of SageMaker Unified Studio at ATPCO has been instrumental in addressing several critical challenges and unlocking new use cases across various business units within the organization. By building on the foundation laid by Amazon DataZone, ATPCO is helping users self-serve insights and fostering a culture of shared understanding and reusability of data assets, leading to more informed decision-making and a robust data culture.

SageMaker Unified Studio helped address the following challenges:

  • Data silos and discoverability – Analysts often struggled to locate the right data sources, verify data freshness, and maintain consistent definitions across different departments. By offering a single entry point for searching and subscribing to curated datasets, SageMaker Unified Studio minimizes these barriers. Integrated tools for data exploration, querying, and visualization, along with contextual metadata and lineage, builds trust in the data, making it straightforward for users to find and use the information they need.
  • Manual data handling – Teams relied heavily on manual exports and custom reports to gather insights, leading to inefficiencies and delays in decision-making. SageMaker Unified Studio helps users across departments, including product, sales, operations, and analytics, self-serve insights without manual intervention. This accelerates the decision-making process and helps teams focus on strategic initiatives rather than data collection.

Solution overview

The following diagram illustrates ATPCO’s architecture for SageMaker Unified Studio.

ATPCO-Solution-SMUS-AdminFlow-1

The following sections walk you through the steps that ATPCO went through to prepare the SageMaker Unified Studio environment for use by different personas in engineering and business units.

Prerequisites

If you’re new to SageMaker Unified Studio, you should first become familiar with concepts such as domains, domain units, projects, project profiles, blueprints, lakehouses, and catalogs before continuing with this post. For a company-wide rollout of SageMaker Unified Studio, it’s important to understand the foundation setup required as an admin user. For more information about the role of a SageMaker Unified Studio admin user and steps required to set up a SageMaker Unified Studio domain,refer to Foundational blocks of Amazon SageMaker Unified Studio: An admin’s guide to implement unified access to all your data, analytics, andAI. As an admin user, start with domain units and projects based on the need of different business units for the data and tooling.

Create domain units and set up projects with required tools

As an admin or root domain owner, you begin with the design of domain units and projects to organize different teams and users to their respective domain units. When non-admin users log in to the SageMaker Unified Studio portal, they should have seamless access to necessary AWS resources. These resources include the required tools and data sources to perform their job. Providing users access to these resources is critical for the successful adoption and utilization of SageMaker Unified Studio in your organization. ATPCO created separate domain units for engineering teams and non-engineering business units, as shown in the preceding architecture diagram. It only shows few examples. In reality, they have more domain units to meet their business needs, which we discuss in the following sections.

Data engineering domain

This domain unit has the Operational Metrics project, managed by the data engineering team, which supports a key backbone of visibility across the organization: understanding how ATPCO’s products perform in real time. Data engineers bring together signals from infrastructure, application logs, API monitoring, and internal systems to build aggregated, curated datasets that track latency, availability, adoption, and reliability. These operational metrics are published using SageMaker Unified Studio for consumption by other domains. Rather than fielding one-off requests or maintaining bespoke dashboards for different stakeholders, the engineering team now:

  • Builds reusable data assets that can be subscribed to one time and reused by many
  • Creates unified views of system health that are automatically updated and versioned
  • Supports other teams such as Product, Sales, and analysts with quick access to performance indicators in a format aligned with their needs

SageMaker Unified Studio becomes the center for operational intelligence, reducing duplication and making sure data engineers can focus on scale and automation rather than ticket-based support.

Analyst domain

The Data Exploration project in this domain unit serves the entire ATPCO community. Its purpose is to make available datasets regardless of their owning domain easily discoverable and ready for analysis. Previously, analysts struggled with locating the right data source, verifying its freshness, or aligning on consistent definitions. With SageMaker Unified Studio, those barriers are removed. The project provides:

  • A single entry point where users can search and subscribe to curated datasets
  • Integrated tools for exploration, query, and visualization
  • Contextual metadata and lineage to build trust in the data

Users in product, strategy, operations, or analytics can self-serve insights without waiting on manual exports or custom reports.

Sales domain

The Customer Profile project in this domain unit helps the Sales team understand which customers are actively engaging with ATPCO’s products, how they are using them, and where there might be opportunities to strengthen relationships. By using SageMaker Unified Studio, Sales team members can access the following:

  • Customer data sourced from CRM systems, including interaction history, product adoption, and support engagement
  • Operational metrics from the Data Engineering team, revealing which features are being used, how often, and whether the customer is experiencing reliability issues

With this combined insight, the Sales team can accomplish the following:

  • Identify high-value accounts for follow-up based on recent usage
  • Detect drop-off in engagement or technical issues before a customer raises a concern
  • Tailor outreach and proposals using objective data, not assumptions

All of this happens within SageMaker Unified Studio, reducing the time spent on manual data gathering and enabling more strategic, proactive customer engagement.

Onboard data sources to domain units and projects

Now that domain units and projects are created for different business units, the next step is to onboard existing Amazon S3 data sources, Data Catalog tables, and database tables available in Amazon Redshift. After logging in, users have access to the required data and tools. This required the ATPCO team to build the inventory to see which team has access to what data sources and what level of permissions are needed. For example, the Data Engineering team needs access to raw, processed and curated S3 buckets for building data processing jobs. They must also read and write to the Data Catalog, and prepare and write curated and aggregated data to the Redshift tables. The following sections guide you through configuring these various data sources within SageMaker Unified Studio, making sure users can access the data sources to continue their work in SageMaker Unified Studio.

Configure existing Amazon S3 data sources into SageMaker Unified Studio

To use an existing S3 bucket in SageMaker Unified Studio, configure an S3 bucket policy that allows the appropriate actions for the project AWS Identity and Access Management (IAM) role.

The Data Engineering team that owns the data processing pipeline must grant access to raw, processed, and curated S3 buckets to the data engineering project role. To learn more about using existing S3 buckets, refer to Access your existing data and resources through Amazon SageMaker Unified Studio, Part 2: Amazon S3, Amazon RDS, Amazon DynamoDB, and Amazon EMR.

Configure an existing Data Catalog into SageMaker Unified Studio

The next generation of SageMaker is built on a lakehouse architecture, which streamlines cataloging and managing permissions on data from multiple sources. Built on the Data Catalog and AWS Lake Formation, it organizes data through catalogs that can be accessed through an open, Apache Iceberg REST API to help enforce secure access to data with consistent, fine-grained access controls. SageMaker Lakehouse organizes data access through two types of catalogs: federated catalogs andmanaged catalogs (shown in the following figure). A catalog is a logical container that organizes objects from a data store, such as schemas, tables, views, or materialized views from Amazon Redshift. The following diagram illustrates this architecture.

ATPCO-Solution-SMUS-Catalog-2

ATPCO built a data lake on Amazon S3 using the Data Catalog and implemented data governance and fine-grained access control using Lake Formation. When developer users log in to SageMaker Unified Studio, they need access to the Data Catalog tables owned by their respective team. Existing Data Catalog databases are made available in SageMaker Lakehouse as a federated catalog because they’re created outside of SageMaker Lakehouse and not managed by it.

To access an existing Data Catalog, you must provide explicit permissions to SageMaker Unified Studio to be able to access the Data Catalog databases and tables. For more details, see Configure Lake Formation permissions for Amazon SageMaker Unified Studio. To onboard Data Catalog tables to SageMaker Lakehouse in SageMaker Unified Studio, the Lake Formation admin must grant access to specific Data Catalog database tables to the SageMaker Unified Studio project role. For more details, refer to Access your existing data and resources through Amazon SageMaker Unified Studio, Part 1: AWS Glue Data Catalog and Amazon Redshift. The Lake Formation permission model is the prerequisite to grant access to SageMaker Unified Studio. If Lake Formation is not the permission model for the Data Catalog, then you must register the S3 path and delegate the permission model to Lake Formation before it can be granted to the SageMaker Unified Studio project role. After you complete these steps, users of the project can access the Data Catalog database and are granted tables under the AwsDataCatalog namespace, and your tables will be visible in the Data Explorer (see the following screenshot). Your data is now ready for tagging, searching, enrichment, and data analysis.

ATPCO-Solution-SMUS-Catalog-2

Configure Redshift data into SageMaker Unified Studio

ATPCO relies on Amazon Redshift as their enterprise data warehouse and stores their aggregated data for insights and dashboarding. Users can combine the data from Amazon Redshift and SageMaker Lakehouse for unified data analysis in SageMaker Unified Studio without leaving SageMaker Unified Studio. For more information about how to add existing Redshift data sources, refer to Access your existing data and resources through Amazon SageMaker Unified Studio, Part 1: AWS Glue Data Catalog and Amazon Redshift.

After it’s connected, the Amazon Redshift compute engine becomes visible in the Data Explorer of your project. Project users can perform the following actions:

  • Write and run SQL queries directly against Amazon Redshift
  • Explore Redshift schemas and tables
  • Use Redshift tables to define SageMaker Unified Studio data sources
  • Combine Redshift data with metadata tagging, glossary linking, and publishing

ATPCO-Solution-SMUS-Compute-4

This doesn’t require copying or duplicating data. You’re using the data exactly where it lives in your Redshift cluster while benefiting from the collaborative features of SageMaker Unified Studio. Adding compute makes the data within the warehouse available to query inside the SageMaker Unified Studio query editor.

ATPCO-Solution-SMUS-DataExplore-5

Onboard users to their respective domain units and projects

Now that as an admin you have created the environments for different business units, your next step is to add domain owner users to the respective domain units. First, you must add domain and project owners’ users for them to get access to the SageMaker Unified Studio domain portal.

ATPCO-Solution-SMUS-Domain-6

Domain units make it possible to organize your assets and other domain entities under specific business units and teams. Domain unit owners can create policies such as membership, domain, and project creation.

ATPCO-Solution-SMUS-Owner-7

Domain unit owners can add one of the members as owner of the project so that when the owner user logs in, they can add other users of their team as an owner or contributor to the project. This helps other users get access to the projects when they login to SageMaker Unified Studio.

ATPCO-Solution-SMUS-members-8

Use the SageMaker Unified Studio environment

After the admin completes the required setup for different business units and onboardsproject members, users can log in to the portal and start using the preconfigured SageMaker Unified Studio environment. Users have access to respective data sources and tools as shown in the following developer flow diagram.

ATPCO-Solution-SMUS-DeveloperFlow-9

At ATPCO, developers must often combine data from various sources to perform extract, transform, and load (ETL) processes efficiently. In this section, we demonstrate how developers can benefit from the SageMaker unified lakehouse environment by seamlessly integrating data from both Amazon Redshift and the Data Catalog. Using PySpark within SageMaker Unified Studio notebooks, we read transactional data from Amazon Redshift and enrich it with metadata stored in AWS Glue backed S3 tables such as warehouse or product attributes. This integrated view supports complex transformations and aggregations across disparate sources without needing to move or duplicate data. By using native connectors and Spark’s distributed processing, users can join, filter, and analyze multi-source datasets efficiently and write the results back to Amazon Redshift for downstream analytics or dashboarding, all within a single, interactive lakehouse interface.

The following code snippet sets up a Spark session to directly query Amazon Redshift managed storage tables using the lakehouse architecture. It registers an AWS Glue backed Iceberg catalog (rmscatalog) that points to a specific Redshift lakehouse catalog and database, allowing Spark to read from and write to Redshift Iceberg tables. By enabling Iceberg extensions and linking the catalog to AWS Glue and Lake Formation, this setup provides seamless, scalable access to Amazon Redshift managed data using standard Spark SQL.

from pyspark.sql import SparkSession
from pyspark.sql.functions import count, avg, round as _round, col
catalog_name = "rmscatalog"
#Change <your_account_id> with your AWS account ID
rms_catalog_id = "<your_account_id>:rms-catalog-demo/dev"
#Change with your AWS region
aws_region="<region>"
spark = SparkSession.builder.appName('rms_demo') \
.config(f'spark.sql.catalog.{catalog_name}', 'org.apache.iceberg.spark.SparkCatalog') \
.config(f'spark.sql.catalog.{catalog_name}.type', 'glue') \
.config(f'spark.sql.catalog.{catalog_name}.glue.id', rms_catalog_id) \
.config(f'spark.sql.catalog.{catalog_name}.client.region', aws_region) \
.config('spark.sql.extensions','org.apache.iceberg.spark.extensions.IcebergSparkSessionExtensions').getOrCreate()

ATPCO-Solution-SMUS-Code-10

=== Check for the tables and load them into dataframes
SHOW TABLES IN rmscatalog.salesdb

ATPCO-Solution-SMUS-Code-11

city_info_df = spark.table("rmscatalog.salesdb.city_info") 
carrier_info_df = spark.table("rmscatalog.salesdb.carrier_info")

ATPCO-Solution-SMUS-Code-12

The following step sets the active AWS Glue database to shopping_data and retrieves metadata for the shopping_data_catalog table using DESCRIBE EXTENDED. It filters for key properties like Provider, Location, and Table Properties to understand the table’s storage and configuration. Finally, it loads the entire table into a Spark DataFrame (shopping_data_df) for downstream processing.

# === Use Glue Catalog and Load Shopping Data ===
spark.sql("USE shopping_data")
# describing the glue table properties
desc_df = spark.sql("DESCRIBE EXTENDED shopping_data_catalog")
desc_df.filter("col_name IN ('Provider', 'Location', 'Table Properties')") \
.selectExpr("col_name AS Property", "data_type AS Value") \
.show(truncate=True)
shopping_data_df = spark.sql("SELECT * FROM shopping_data_catalog")

ATPCO-Solution-SMUS-Code-13

The following code shows how you can seamlessly combine and aggregate two disparate data sources, Amazon Redshift and the Data Catalog, within SageMaker Unified Studio. Using PySpark, we perform transformations and derive meaningful summaries across the unified view. This facilitates streamlined analysis and reporting without the need for complex data movement or duplication.

# == Join and Aggregate Data ===
shopping_with_cities_df = shopping_data_df \
.join(city_info_df.alias("origin_city"), shopping_data_df.origincitycode == col("origin_city.citycode"), "left") \
.join(city_info_df.alias("dest_city"), shopping_data_df.destinationcitycode == col("dest_city.citycode"), "left")
shopping_full_df = shopping_with_cities_df \
.join(carrier_info_df, col("validatingcarrier") == col("carrier_code"), "left")
result_df = shopping_full_df.groupBy("origin_city.region", "alliance") \
.agg(
count("*").alias("total_trips"),
_round(avg("totalamount"), 2).alias("avg_amount")
) \
.orderBy("total_trips", ascending=False)
result_df.show(10, truncate=False)

ATPCO-Solution-SMUS-Code-14

After the job runs, it writes the transformed dataset directly into a Data Catalog table that is Iceberg-compatible. This integration makes sure the data is stored in Amazon S3 with ACID transaction support, and also registered and tracked in the Data Catalog for unified governance, schema discovery, and downstream query access. The Iceberg table format organizes the data into Parquet files under a data/ directory and maintains rich versioned metadata in a metadata/ folder, supporting features like schema evolution, time travel, and partition pruning. This design facilitates scalable, reliable, and SQL-compatible analytics on modern data lakes.

ATPCO-Solution-SMUS-Code-15

ATPCO-Solution-SMUS-Data-File-16

The table becomes immediately available for querying through the Athena query editor, providing interactive access to fresh, transactional data without additional ingestion steps or manual registration.This approach streamlines the end-to-end data flow, from processing in Spark to interactive querying in Athena within the modern SageMaker Lakehouse environment.

ATPCO-Solution-SMUS-Query-Data-16

Conclusion

This post walked you through the steps to prepare a SageMaker Unified Studio environment for a company-wide rollout, using APTCO’s journey as an example. We covered the domain design and admin flow, which is a one-time setup to prepare the SageMaker Unified Studio environment for different teams in the organization who requires different levels of access to the data and tools. After the admin flow, we demonstrated the developer flow and how to use tools like a Jupyter notebook and SQL editor to use the data across different sources such as Amazon S3, the Data Catalog, and Redshift assets to perform a unified analysis.

Try out this solution and get started with SageMaker Unified Studio and modernize with the next generation of SageMaker. To learn more about SageMaker Unified Studio and how to get started, refer to the Amazon SageMaker Unified Studio Administrator Guide, and the latest AWS Big Data Blog posts.


About the authors

Mitesh Patel is a Principal Solutions Architect at AWS. His passion is helping customers harness the power of Analytics, Machine Learning, AI & GenAI to drive business growth. He engages with customers to create innovative solutions on AWS.

Nikki Rouda works in product marketing at AWS. He has many years experience across a wide range of IT infrastructure, storage, networking, security, IoT, analytics, and modern applications.

Raj Samineni is the Director of Data Engineering at ATPCO, leading the creation of advanced cloud-based data platforms. His work ensures robust, scalable solutions that support the airline industry’s strategic transformational objectives. By leveraging machine learning and AI, Raj drives innovation and data culture, positioning ATPCO at the forefront of technological advancement.

Saurabh Rawat is a Solution Architect at AWS with 13 years of experience working with enterprise data systems. He has designed and delivered large-scale, cloud-native solutions for customers across industries, with a focus on data engineering, analytics, and well-architected architectures. Over his career, he has helped organizations modernize their data platforms, optimize for performance, and cost, and adopt best practices for scalability and security. Outside of work, he is a passionate musician and enjoys playing with his band.

Accelerate your data quality journey for lakehouse architecture with Amazon SageMaker, Apache Iceberg on AWS, Amazon S3 tables, and AWS Glue Data Quality

Post Syndicated from Brody Pearman original https://aws.amazon.com/blogs/big-data/accelerate-your-data-quality-journey-for-lakehouse-architecture-with-amazon-sagemaker-apache-iceberg-on-aws-amazon-s3-tables-and-aws-glue-data-quality/

In an era where data drives innovation and decision-making, organizations are increasingly focused on not only accumulating data but on maintaining its quality and reliability. High-quality data is essential for building trust in analytics, enhancing the performance of machine learning (ML) models, and supporting strategic business initiatives.

By using AWS Glue Data Quality, you can measure and monitor the quality of your data. It analyzes your data, recommends data quality rules, evaluates data quality, and provides you with a score that quantifies the quality of your data. With this, you can make confident business decisions. With this launch, AWS Glue Data Quality is now integrated with the lakehouse architecture of Amazon SageMaker, Apache Iceberg on general purpose Amazon Simple Storage Service (Amazon S3) buckets, and Amazon S3 Tables. This integration brings together serverless data integration, quality management, and advanced ML capabilities in a unified environment.

This post explores how you can use AWS Glue Data Quality to maintain data quality of S3 Tables and Apache Iceberg tables on general purpose S3 buckets. We’ll discuss strategies for verifying the quality of published data and how these integrated technologies can be used to implement effective data quality workflows.

Solution overview

In this launch, we’re supporting the lakehouse architecture of Amazon SageMaker, Apache Iceberg on general purpose S3 buckets, and Amazon S3 Tables. As example use cases, we demonstrate data quality on an Apache Iceberg table stored in a general purpose S3 bucket as well as on Amazon S3 Tables. The steps will cover the following:

  1. Create an Apache Iceberg table on a general purpose Amazon S3 bucket and an Amazon S3 table in a table bucket using two AWS Glue extract, transform, and load (ETL) jobs
  2. Grant appropriate AWS Lake Formation permissions on each table
  3. Run data quality recommendations at rest on the Apache Iceberg table on general purpose S3 bucket
  4. Run the data quality rules and visualize the results in Amazon SageMaker Unified Studio
  5. Run data quality recommendations at rest on the S3 table
  6. Run the data quality rules and visualize the results in SageMaker Unified Studio

The following diagram is the solution architecture.

Prerequisites

To implement the instructions, you must have the following prerequisites:

Create S3 tables and Apache Iceberg on general purpose S3 bucket

First, complete the following steps to upload data and scripts:

  1. Upload the attached AWS Glue job scripts to your designated script bucket in S3
    1. create_iceberg_table_on_s3.py
    2. create_s3_table_on_s3_bucket.py
  2. To download the New York City Taxi – Yellow Trip Data dataset for January 2025 (Parquet file), navigate to NYC TLC Trip Record Data, expand 2025, and choose Yellow Taxi Trip records under January section. A file called yellow_tripdata_2025-01.parquet will be downloaded to your computer.
  3. On the Amazon S3 console, open an input bucket of your choice and create a folder called nyc_yellow_trip_data. The stack will create a GlueJobRole with permissions to this bucket.
  4. Upload the yellow_tripdata_2025-01.parquet file to the folder.
  5. Download the CloudFormation stack file. Navigate to the CloudFormation console. Choose Create stack. Choose Upload a template file and select the CloudFormation template you downloaded. Choose Next.
  6. Enter a unique name for Stack name.
  7. Configure the stack parameters. Default values are provided in the following table:
Parameter Default value Description
ScriptBucketName N/A – user-supplied Name of the referenced Amazon S3 general purpose bucket containing the AWS Glue job scripts
DatabaseName iceberg_dq_demo Name of the AWS Glue Database to be created for the Apache Iceberg table on general purpose Amazon S3 bucket
GlueIcebergJobName create_iceberg_table_on_s3 The name of the created AWS Glue job that creates the Apache Iceberg table on general purpose Amazon S3 bucket
GlueS3TableJobName create_s3_table_on_s3_bucket The name of the created AWS Glue job that creates the Amazon S3 table
S3TableBucketName dataquality-demo-bucket Name of the Amazon S3 table bucket to be created.
S3TableNamespaceName s3_table_dq_demo Name of the Amazon S3 table bucket namespace to be created
S3TableTableName ny_taxi Name of the Amazon S3 table to be created by the AWS Glue job
IcebergTableName ny_taxi Name of the Apache Iceberg table on general purpose Amazon S3 to be created by the AWS Glue job
IcebergScriptPath scripts/create_iceberg_table_on_s3.py The referenced Amazon S3 path to the AWS Glue script file for the Apache Iceberg table creation job. Verify the file name matches the corresponding GlueIcebergJobName
S3TableScriptPath scripts/create_s3_table_on_s3_bucket.py The referenced Amazon S3 path to the AWS Glue script file for the Amazon S3 table creation job. Verify the file name matches the corresponding GlueS3TableJobName
InputS3Bucket N/A – user-supplied bucket Name of the referenced Amazon S3 bucket with which the NY Taxi data was uploaded
InputS3Path nyc_yellow_trip_data The referenced Amazon S3 path with which the NY Taxi data was uploaded
OutputBucketName N/A – user-supplied Name of the created Amazon S3 general purpose bucket for the AWS Glue job for Apache Iceberg table data

Complete the following steps to configure AWS Identity and Access Management (IAM) and Lake Formation permissions:

  1. If you haven’t previously worked with S3 Tables and analytics services, navigate to Amazon S3.
  2. Choose Table buckets.
  3. Choose Enable integration to enable analytics service integrations with your S3 table buckets.
  4. Navigate to the Resources tab for your AWS CloudFormation stack. Note the IAM role with the logical ID GlueJobRole and the database name with the logical ID GlueDatabase. Additionally, note the name of the S3 table bucket with the logical ID S3TableBucket as well as the namespace name with the logical ID S3TableBucketNamespace. The S3 table bucket name is the portion of the Amazon Resource Name (ARN) which follows: arn:aws:s3tables:<region>:<accountID>:bucket/{S3 Table bucket Name}. The namespace name is the portion of the namespace ARN which follows: arn:aws:s3tables:<region>:<accountID>:bucket/{S3 Table bucket Name}|{namespace name}.
  5. Navigate to the Lake Formation console with a Lake Formation data lake administrator.
  6. Navigate to the Databases tab and select your GlueDatabase. Note the selected default catalog should match your AWS account ID.
  7. Select the Actions dropdown menu and under Permissions, choose Grant.
  8. Grant your GlueJobRole from step 4 the necessary permissions. Under Database permissions, select Create table and Describe, as shown in the following screenshot.

Navigate back to the Databases tab in Lake Formation and select the catalog that matches with the value of S3TableBucket you noted in step 4 in the format: <AWS account ID>:s3tablescatalog/<S3 Table Bucket name>

  1. Select your namespace name. From the Actions dropdown menu, under Permissions, choose Grant.
  2. Grant your GlueJobRole from step 4 the necessary permissions Under Database permissions, select Create table and Describe, as shown in the following screenshot.

To run the jobs created in the CloudFormation stack to create the sample tables and configure Lake Formation permissions for the DataQualityRole, complete the following steps:

  1. In the Resources tab of your CloudFormation stack, note the AWS Glue job names for the logical resource IDs: GlueS3TableJob and GlueIcebergJob.
  2. Navigate to the AWS Glue console and select ETL jobs. Select your GlueIcebergJob from step 11 and choose Run job. Select your GlueS3TableJob and choose Run job.
  3. To verify the successful creation of your Apache Iceberg table on general purpose S3 bucket in the database, navigate to Lake Formation with your Lake Formation data lake administrator permissions. Under Databases, select your GlueDatabase. The selected default catalog should match your AWS account ID.
  4. On the dropdown menu, choose View and then Tables. You should see a new tab with the table name you specified for IcebergTableName. You have verified the table creation.
  5. Select this table and grant your DataQualityRole (<stack_name>-DataQualityRole-<xxxxxx>) the necessary Lake Formation permissions by choosing the Grant link in the Actions tab. Choose Select, Describe from Table permissions for the new Apache Iceberg table.
  6. To verify the S3 table in the S3 table bucket, navigate to Databases in the Lake Formation console with your Lake Formation data lake administrator permissions. Make sure the selected catalog is your S3 table bucket catalog: <AWS account ID>:s3tablescatalog/<S3 Table Bucket name>
  7. Select your S3 table namespace and choose the dropdown menu View.
  8. Choose Tables and you should see a new tab with the table name you specified for S3TableTableName. You have verified the table creation.
  9. Choose the link for the table and under Actions, choose Grant. Grant your DataQualityRole the necessary Lake Formation permissions. Choose Select, Describe from Table permissions for the S3 table.
  10. In the Lake Formation console with your Lake Formation data lake administrator permissions, on the Administration tab, choose Data lake locations .
  11. Choose Register location. Input your OutputBucketName as the Amazon S3 path. Input the LakeFormationRole from the stack resources as the IAM role. Under Permission mode, choose Lake Formation.
  12. On the Lake Formation console under Application integration settings, select Allow external engines to access data in Amazon S3 locations with full table access, as shown in the following screenshot.

Generate recommendations for Apache Iceberg table on general purpose S3 bucket managed by Lake Formation

In this section, we show how to generate data quality rules using the data quality rule recommendations feature of AWS Glue Data Quality for your Apache Iceberg table on a general purpose S3 bucket. Follow these steps:

  1. Navigate to the AWS Glue console. Under Data Catalog, choose Databases. Choose the GlueDatabase.
  2. Under Tables, select your IcebergTableName. On the Data quality tab, choose Run history.
  3. Under Recommendation runs, choose Recommend rules.
  4. Use the DataQualityRole (<stack_name>-DataQualityRole-<xxxxxx>) to generate data quality rule recommendations, leaving the other settings as default. The results are shown in the following screenshot.

Run data quality rules for Apache Iceberg table on general purpose S3 bucket managed by Lake Formation

In this section, we show how to create a data quality ruleset with the recommended rules. After creating the ruleset, we run the data quality rules. Follow these steps:

  1. Copy the resulting rules from your recommendation run by selecting the dq-run ID and choosing Copy.
  2. Navigate back to the table under the Data quality tab and choose Create data quality rules. Paste the ruleset from step 1 here. Choose Save ruleset, as shown in the following screenshot.

  1. After saving your ruleset, navigate back to the Data Quality tab for your Apache Iceberg table on the general purpose S3 bucket. Select the ruleset you created. To run the data quality evaluation run on the ruleset using your data quality role, choose Run, as shown in the following screenshot.

Generate recommendations for the S3 table on the S3 table bucket

In this section, we show how to use the AWS Command Line Interface (AWS CLI) to generate recommendations for your S3 table on the S3 table bucket. This will also create a data quality ruleset for the S3 table. Follow these steps:

  1. Fill in your S3 table namespace name, S3 table table name, Catalog ID, and Data Quality role ARN in the following JSON file and save it locally:
{
    "DataSource": {
        "GlueTable": {
            "DatabaseName": "<namespace name>",
            "TableName": "<table name>",
            "CatalogId": "<account ID>:s3tablescatalog/<s3 table bucket name>"
        }
    },
    "Role": "<Data Quality role ARN>",
    "NumberOfWorkers": 5,
    "Timeout": 120,
    "CreatedRulesetName": "data_quality_s3_table_demo_ruleset"
}
  1. Enter the following AWS CLI command replacing local file name and region with your own information:
aws glue start-data-quality-rule-recommendation-run --cli-input-json file://<file name> --region <region>
  1. Run the following AWS CLI command to confirm the recommendation run succeeds:
aws glue get-data-quality-rule-recommendation-run --run-id <input run ID from step 2> --region <region>

Run data quality rules for the S3 table on the S3 table bucket

In this section, we show how to use the AWS CLI to evaluate the data quality ruleset on the S3 tables bucket that we just created. Follow these steps:

  1. Replace S3 table namespace name, S3 tables table name, Catalog ID, and Data Quality role ARN with your own information in the following JSON file and save it locally:
{
    "DataSource": {
         "GlueTable": {
            "DatabaseName": "<namespace name>",
            "TableName": "<table name>",
            "CatalogId": "<account ID>:s3tablescatalog/<s3 table bucket name>"
        }
    },
    "Role": "<>",
    "NumberOfWorkers": 2,
    "Timeout": 120,
    "AdditionalRunOptions": {
        "CloudWatchMetricsEnabled": true,
        "CompositeRuleEvaluationMethod": "COLUMN"
    },
    "RulesetNames": ["data_quality_s3_table_demo_ruleset"]
}
  1. Run the following AWS CLI command replacing local file name and region with your information:
aws glue start-data-quality-ruleset-evaluation-run --cli-input-json file://<file name> --region <region>
  1. Run the following AWS CLI command replacing region and data quality run ID with your information:
aws glue get-data-quality-ruleset-evaluation-run --run-id <input run ID from step 2> --region <region>

View results in SageMaker Unified Studio

Complete the following steps to view results from your data quality evaluation runs in SageMaker Unified Studio:

  1. Log in to the SageMaker Unified Studio portal using your single sign-on (SSO).
  2. Navigate to your project and note the project role ARN
  3. Navigate to the Lake Formation console with your Lake Formation data lake administrator permissions. Select your Apache Iceberg table that you created on general purpose S3 bucket and choose Grant from the Actions dropdown menu. Grant the following Lake Formation permissions to your SageMaker Unified Studio project role from step 2:
    1. Describe for Table permissions and Grantable permissions
  4. Next, select your S3 Table from the S3 Table bucket catalog in Lake Formation and choose Grant from the Actions drop-down. Grant the below Lake Formation permissions to your SageMaker Unified Studio project role from step 2:
    1. Describe for Table permissions and Grantable permissions
  5. Follow the steps at Create an Amazon SageMaker Unified Studio data source for AWS Glue in the project catalog to configure your data source for your GlueDatabase and your S3 tables namespace.
    1. Choose a name and optionally enter a description for your data source details.
    2. Choose AWS Glue (Lakehouse) for your Data source type. Leave connection and data lineage as the default values.
    3. Choose Use the AwsDataCatalog for the Apache Iceberg table on general purpose S3 bucket AWS Glue database.
    4. Choose the Database name corresponding to the GlueDatabase.Choose Next.
    5. Under Data quality, select Enable data quality for this data source. Leave the rest of the defaults.
    6. Configure the next data source with a name for your S3 table namespace. Optionally, enter a description for your data source details.
    7. Choose AWS Glue (Lakehouse) for your Data source type. Leave connection and data lineage as the default values.
    8. Choose to enter the catalog name: s3tablescatalog/<S3TableBucketName>
    9. Choose the Database name corresponding to the S3 table namespace. Choose Next.
    10. Select Enable data quality for this data source. Leave the rest of the defaults.
  6. Run each dataset.
  7. Navigate to your project’s Assets and select the related asset that you created for Apache Iceberg table on general purpose S3 bucket. Navigate to the Data Quality tab to view your data quality results. You should be able to see the data quality results for the S3 table asset similarly.

The data quality results in the following screenshot show each rule evaluated in the selected data quality evaluation run and its result. The data quality score calculates the percentage of rules that passed, and the overview shows how certain rule types faired across the evaluation. For example, Completeness rule types all passed, but ColumnValues rule types passed only three out of nine times.

Cleanup

To avoid incurring future charges, clean up the resources you created during this walkthrough:

  1. Navigate to the blog post output bucket and delete its contents.
  2. Un-register the data lake location for your output bucket in Lake Formation
  3. Revoke the Lake Formation permissions for your SageMaker project role, for your data quality role, and for your AWS Glue job role.
  4. Delete the input data file and the job scripts from your bucket.
  5. Delete the S3 table.
  6. Delete the CloudFormation stack.
  7. [Optional] Delete your SageMaker Unified Studio domain and the associated CloudFormation stacks it created on your behalf.

Conclusion

In this post, we demonstrated how you can now generate data quality recommendation for your lakehouse architecture using Apache Iceberg tables on general purpose Amazon S3 buckets and Amazon S3 Tables. Then we showed how to integrate and view these data quality results in Amazon SageMaker Unified Studio. Try this out for your own use case and share your feedback and questions in the comments.


About the Authors

Brody Pearman is a Senior Cloud Support Engineer at Amazon Web Services (AWS). He’s passionate about helping customers use AWS Glue ETL to transform and create their data lakes on AWS while maintaining high data quality. In his free time, he enjoys watching football with his friends and walking his dog.

Shiv Narayanan is a Technical Product Manager for AWS Glue’s data management capabilities like data quality, sensitive data detection and streaming capabilities. Shiv has over 20 years of data management experience in consulting, business development and product management.

Shriya Vanvari is a Software Developer Engineer in AWS Glue. She is passionate about learning how to build efficient and scalable systems to provide better experience for customers. Outside of work, she enjoys reading and chasing sunsets.

Narayani Ambashta is an Analytics Specialist Solutions Architect at AWS, focusing on the automotive and manufacturing sector, where she guides strategic customers in developing modern data and AI strategies. With over 15 years of cross-industry experience, she specializes in big data architecture, real-time analytics, and AI/ML technologies, helping organizations implement modern data architectures. Her expertise spans across lakehouse architecture, generative AI, and IoT platforms, enabling customers to drive digital transformation initiatives. When not architecting modern solutions, she enjoys staying active through sports and yoga.

Connect, share, and query where your data sits using Amazon SageMaker Unified Studio

Post Syndicated from Lakshmi Nair original https://aws.amazon.com/blogs/big-data/connect-share-and-query-where-your-data-sits-using-amazon-sagemaker-unified-studio/

The ability for organizations to quickly analyze data across multiple sources is crucial for maintaining a competitive advantage. Imagine a scenario where the retail analytics team is trying to answer a simple question: Among customers who purchased summer jackets last season, which customers are likely to be interested in the new spring collection?

While the question is straightforward, getting the answer requires piecing together data across multiple data sources such as customer profiles stored in Amazon Simple Storage Service (Amazon S3) from customer relationship management (CRM) systems, historical purchase transactions in an Amazon Redshift data warehouse, and current product catalog information in Amazon DynamoDB. Traditionally, answering this question would involve multiple data exports, complex extract, transform, and load (ETL) processes, and careful data synchronization across systems.

In this blog post, we will demonstrate how business units can use Amazon SageMaker Unified Studio to discover, subscribe to, and analyze these distributed data assets. Through this unified query capability, you can create comprehensive insights into customer transaction patterns and purchase behavior for active products without the traditional barriers of data silos or the need to copy data between systems.

SageMaker Unified Studio provides a unified experience for using data, analytics, and AI capabilities. You can use familiar AWS services for model development, generative AI, data processing, and analytics—all within a single, governed environment. To strike a fine balance of democratizing data and AI access while maintaining strict compliance and regulatory standards, Amazon SageMaker Data and AI Governance is built into SageMaker Unified Studio. With Amazon SageMaker Catalog, teams can collaborate through projects, discover, and access approved data and models using semantic search with generative AI-created metadata, or you can use natural language to ask Amazon Q to find your data. Within SageMaker Unified Studio, organizations can implement a single, centralized permission model with fine-grained access controls, facilitating seamless data and AI asset sharing through streamlined publishing and subscription workflows. Teams can also query the data directly from sources such as Amazon S3 and Amazon Redshift, through Amazon SageMaker Lakehouse.

SageMaker Lakehouse streamlines connecting to, cataloging, and managing permissions on data from multiple sources. Built on AWS Glue Data Catalog and AWS Lake Formation, it organizes data through catalogs that can be accessed through an open, Apache Iceberg REST API to help ensure secure access to data with consistent, fine-grained access controls. SageMaker Lakehouse organizes data access through two types of catalogs: federated catalogs and managed catalogs (shown in the following figure). A catalog is a logical container that organizes objects from a data store, such as schemas, tables, views, or materialized views such as from Amazon Redshift. You can also create nested catalogs to mirror the hierarchical structure of your data sources within SageMaker Lakehouse.

  • Federated catalogs: Through SageMaker Unified Studio, you can create connections to external data sources such as Amazon DynamoDB. See Data connections in Amazon SageMaker Lakehouse for all the supported external data sources. These connections are stored in the AWS Glue Data Catalog (Data Catalog) and registered with Lake Formation, allowing you to create a federated catalog for each available data source.
  • Managed catalogs: A managed catalog refers to the data that resides on Amazon S3 or Redshift Managed Storage (RMS).

The existing Data Catalog becomes the Default catalog (identified by the AWS account number) and is readily available in SageMaker Lakehouse.

If the business units don’t have a data warehouse but need the benefits of one—such as a query result cache and query rewrite optimizations—then, they can create an RMS managed catalog in SageMaker Unified Studio. This is a SageMaker Lakehouse managed catalog backed by RMS storage. The table metadata is managed by Data Catalog. When you create an RMS managed catalog, it deploys an Amazon Redshift managed serverless workgroup. Users can write data to managed RMS tables using Iceberg APIs, Amazon Redshift, or Zero-ETL ingestion from supported data sources.

Functional working model

In SageMaker Unified Studio, the infrastructure team will enable the blueprints and configure the project profiles for tools and technologies to the respective business units to build and monitor their pipelines. They will also onboard the teams to SageMaker Unified Studio, enabling them to build the data products in a single integrated, governed environment. To enforce standardization within the organization, the central governance team can also create hierarchical representations of business units through domain units and dictate certain actions that these teams can perform under a domain unit. Global policies such as data dictionaries (business glossaries), data classification tags, and additional information with metadata forms can be created by the governance team to ensure standardization and consistency within the organization.

Individual business units will use these project profiles based on their needs to process the data using the authorized tool of their choice and create data products. Business units can enjoy the full flexibility to process and consume the data without worrying about the maintenance of the underlying infrastructure. Depending on the nature of the workloads, business units can choose a storage solution that best fits their use case. You can use SageMaker Lakehouse to unify the data across different data sources.

To share the data outside the business unit, the teams will publish the metadata of their data to a SageMaker catalog and make it discoverable and accessible to other business units. Amazon SageMaker Catalog serves as a central repository hub to store both technical and business catalog information of the data product. To establish trust between the data producers and data consumers, SageMaker Catalog also integrates the data quality metrics and data lineage events to track and drive transparency in data pipelines. While sharing the data, data producers of these business units can apply fine grained access control permissions at row and column level to these assets during subscription approval workflows. SageMaker Unified Studio automatically grants subscription access to the subscribed data assets after the subscription request is approved by the data producer. As shown in the following figure, the data sharing capability highlights that the data remains at its origin with the data producer, while consumers from other business units can consume and analyze it using their own compute resources. This approach eliminates any data duplication or data movement.

Solution overview

In this post, we explore two scenarios for sharing data between different teams (retail, marketing, and data analysts). The solution in this post gives you the implementation for a single account use case.

Scenario 1

The retail team needs to create a comprehensive view of customer behavior to optimize their spring collection launch. Their data landscape is diverse:

  • Customer profiles stored in Amazon S3 (default Data Catalog)
  • Historical purchase transactions stored in RMS (SageMaker Lakehouse managed RMS catalog)
  • Inventory information of the product in DynamoDB. (federated catalog)

The team needs to share this unified view with their regional data analysts while maintaining strict data governance protocols. Data analysts discover the data and subscribe to the data. We will also walk through the publishing and subscription workflow as part of the data sharing process. To get a unified view of the customer sales transactions for active products, the data analysts will use Amazon Athena.

Here are the high level steps of the solution implementation as shown in the preceding diagram:

  1. In this post, we take an example of two teams who participate in the collaboration. The retail team has created a project retailsales-sql-project and the data analysts team has created a project dataanalyst-sql-project within SageMaker Unified Studio.
  2. The retail team creates and stores their data in various sources:
    1. customer data in Amazon S3 (contains customer data)
    2. inventory data in a DynamoDB table (contains product catalog information)
    3. store_sales_lakehouse in SageMaker Lakehouse managed RMS (contains purchase history)
  3. The retail team publishes the assets to the project catalog to make them discoverable to other domain members within the organization.
  4. The data analysts team discovers the data and subscribes to the data assets.
  5. An incoming request is sent to the retail team, who then approves the subscription request. After the subscription is approved, data analysts use Athena to create a unified query from all the subscribed data assets to get insights into the data.

In this scenario, we will review how SageMaker Catalog manages the subscription grants to Data Catalog assets (both federated and managed).

For this scenario, we assume that the retail team doesn’t have their own data warehouse and they want to create and manage Amazon Redshift tables using Data Catalog.

Scenario 2

The marketing team needs access to transaction data for campaign optimization. They have campaign performance data stored in an Amazon Redshift data warehouse. However, to have improved campaign ROI and better resource allocation, they need data from the retail team to understand actual customer purchase behavior. To improve the campaign ROI, they need answers to crucial questions such as:

  • What is the true conversion rate across different customer segments?
  • Which customers should be targeted for upcoming promotions?
  • How do seasonal buying patterns affect campaign success?

Here the retail team shares the purchase history data store_sales to the marketing team. In this scenario, shown in the preceding figure, we assume that the retail team has their own data warehouse and uses Amazon Redshift to store the purchase history data.

The high level steps of the solution implementation for this scenario are:

  1. The marketing team has created the project marketing-sql-project within SageMaker Unified Studio.
  2. The retail team has store_sales in Amazon Redshift data warehouse (contains purchase history)
  3. The retail team has published the assets to the project catalog
  4. The marketing team discovers the data and subscribes to the data assets.
  5. An incoming request is sent to the retail team, who then approves the subscription request. After the subscription is approved, the marketing team uses Amazon Redshift to consume the purchase history and identify high-value customer segments.

In this scenario, we will review the process of how SageMaker Catalog grants access to managed Amazon Redshift assets.

Prerequisites

To follow the step by step guide, you must complete the following prerequisites:

Note that the default SQL analytics project profile provides you with a RedshiftServerless blueprint. However, in this post, we want to showcase the data sharing capabilities of different types of SageMaker Lakehouse catalogs (managed and federated).

For the simplicity, we chose the SQL analytics project profile. However, you can also test this by using the Custom project profile by selecting specific blueprints such as LakehouseCatalog and LakeHouseDatabase for scenarios where the business unit doesn’t have their own data warehouse.

Solution walkthrough (Scenario 1)

The first step focuses on preparing the data for each data source for unified access.

Data preparation

In this section, you will create the following data sets:

  • customer data in Amazon S3 (default Data Catalog)
  • inventory data in a DynamoDB table (federated catalog)
  • store_sales_lakehouse in SageMaker Lakehouse managed RMS (managed catalog)
  1. Sign in to SageMaker Unified Studio as a member of the retail team and select the project retailsales-sql-project.
  2. On the top menu, choose Build, and under DATA ANALYSIS & INTEGRATION, select Query Editor.

  1. Select the following options:
    1. Under CONNECTIONS, select Athena (Lakehouse).
    2. Under CATALOGS, select AwsDataCatalog.
    3. Under DATABASES, select glue_db_<environmentid> or the customer glue database name you provided during project creation.
    4. After the options are selected, choose Choose.

When users select a project profile within SageMaker Unified Studio, the system automatically triggers the relevant AWS CloudFormation stack (DataZone-Env-<environmentid>) and deploys the necessary infrastructure resources in the form of environments. Environments are the actual data infrastructure behind a project.

  1. Run the following SQL:
CREATE TABLE customer AS
SELECT 13251813 cust_id,'Joyce Deaton'   cust_name,'Greece'   cust_country, '[email protected]'   cust_email
UNION
SELECT 1581546  ,'Daniel Dow'  ,'India'  , '[email protected]'  
UNION
SELECT 1581536  ,'Marie Lange'  ,'Canada'  , '[email protected]'  
UNION
SELECT 1827661  ,'Wesley Harris'  ,'Rome'  , '[email protected]'  
UNION
SELECT 1581536  ,'Alexander Salyer'  ,'Germany'  , '[email protected]'  
UNION
SELECT 3581536  ,'Jerry Tracy'  ,'Swiss'  , '[email protected]' 
  1. After the SQL is executed, you will find that the customer table has been created in the Lakehouse section under Lakehouse/AwsDataCatalog/glue_db_<environmentid>.

  1. The product catalog is stored in DynamoDB. You can create a new table named inventory in DynamoDB with partition key prod_id through AWS CloudShell with the following command:
aws dynamodb create-table \
    --table-name inventory\
    --attribute-definitions \
AttributeName=prod_id,AttributeType=N \
    --key-schema \
AttributeName=prod_id,KeyType=HASH \
    --provisioned-throughput \
ReadCapacityUnits=5,WriteCapacityUnits=5 \
    --table-class STANDARD
  1. Populate the DynamoDB table using the following commands:
aws dynamodb put-item --table-name inventory --item '{"prod_id": {"N": "1"}, "prod_name": {"S": "Widget A"},"active": {"S": "Y"}}' 

aws dynamodb put-item --table-name inventory --item '{"prod_id": {"N": "2"}, "prod_name": {"S": "Gadget B"},"active": {"S": "Y"}}'

aws dynamodb put-item --table-name inventory --item '{"prod_id": {"N": "3"}, "prod_name": {"S": "Item C"},"active": {"S": "N"}}' 
  1. To use the DynamoDB table in SageMaker Unified Studio, you need to configure a resource-based policy that allows the appropriate actions for the project role.
    1. To create the resource-based policy, navigate to the DynamoDB console and choose Tables from the navigation pane.
    2. Select the Permissions table and choose Create table policy.

  1. The following is an example policy that allows connecting to DynamoDB tables as a federated source. Replace the <aws_region> with the Region you are working on, <aws_account_id> with the AWS Account ID where DynamoDB is deployed, <dynamodb_table> with the DynamoDB table (in this case inventory) that you intend to query from Amazon SageMaker Unified Studio and <datazone_usr_role_xxxxxxxxxxxxxx_yyyyyyyyyyyyyy> with the Project role Amazon Resource Name (ARN) in SageMaker Unified Studio portal. You can get the project role ARN by navigating to the project in SageMaker Unified Studio and then to Project overview.

{
    "Version": "2012-10-17",
    "Statement": [
        {
            "Effect": "Allow",
            "Principal": "*",
            "Action": [
                "dynamodb:Query",
                "dynamodb:Scan",
                "dynamodb:DescribeTable",
                "dynamodb:PartiQLSelect",
                "dynamodb:BatchWriteItem"
            ],
            "Resource": "arn:aws:dynamodb:<aws_region>:<aws_accountid>:table/<dynamodb_table>",
            "Condition": {
                "ArnEquals": {
                    "aws:PrincipalArn": "arn:aws:iam::<aws_accountid>:role/<datazone_usr_role_xxxxxxxxxxxxxx_yyyyyyyyyyyyyy>"
                }
            }
        }
    ]
}

After the policies are incorporated on the DynamoDB table, create an SageMaker Lakehouse connection within SageMaker Unified Studio. As shown in the example, dynamodb-connection-catalogs is created.

  1. After the connection is successfully established, you will see the DynamoDB table inventory under Lakehouse.

The next step is to create a managed catalog for RMS objects using SageMaker Lakehouse.

  1. Choose Data in the navigation pane.
  2. In the data explorer, choose the plus icon to add a data source.
  3. Select Create Lakehouse catalog.
  4. Choose Next.

  1. Enter the name of the catalog. The catalog name provided in the example is redshift-lakehouse-connection-catalogs. Choose Add data.

  1. After the connection is created, you will see the catalog under Lakehouse.

  1. This creates a managed Amazon Redshift Serverless workgroup in your AWS account. You will see a new database dev@<redshift-catalog-name> in the managed Amazon Redshift Serverless workgroup.
    1. On the top menu, choose Build, and under DATA ANALYSIS & INTEGRATION, select Query Editor.
    2. Select Redshift (Lakehouse) from CONNECTIONSdev@<redshift-catalog-name> from DATABASES and public from SCHEMAS

  1. Run the following SQL in order. The SQL creates the store_sales_lakehouse table in the dev database in the public schema. The retail team inserts data into the store_sales_lakehouse table.
CREATE TABLE public.store_sales_lakehouse (
    sale_id INTEGER IDENTITY(1,1) PRIMARY KEY,
    cust_id INTEGER NOT NULL,
    sale_date DATE NOT NULL,
    sale_amount DECIMAL(10, 2) NOT NULL,
    prod_id INTEGER  NOT NULL,
    last_purchase_date DATE
);
INSERT INTO public.store_sales_lakehouse (cust_id, sale_date, sale_amount, prod_id, last_purchase_date)
VALUES
(13251813, '2023-01-15', 150.00, 1, '2023-01-15'),
(29033279, '2023-01-20', 200.00, 4, '2023-01-20'),
(12755125, '2023-02-01', 75.50, 3, '2023-02-01'),
(26009249, '2023-02-10', 300.00, 2, '2023-02-10'),
(3270685, '2023-02-15', 125.00, 2, '2023-02-15'),
(6520539, '2023-03-01', 100.00, 2, '2023-03-01'),
(10251183, '2023-03-10', 250.00, 1, '2023-03-10'),
(10251283, '2023-03-15', 180.00, 1, '2023-03-15'),
(10251383, '2023-04-01', 90.00, 2, '2023-04-01'),
(10251483, '2023-04-10', 220.00, 3, '2023-04-10'),
(10251583, '2023-04-15', 175.00, 3, '2023-04-15'),
(10251683, '2023-05-01', 130.00, 1, '2023-05-01'),
(10251783, '2023-05-10', 280.00, 1, '2023-05-10'),
(10251883, '2023-05-15', 195.00, 4, '2023-05-15'),
(10251983, '2023-06-01', 110.00, 2, '2023-06-01'),
(10251083, '2023-06-10', 270.00, 1, '2023-06-10'),
(10252783, '2023-06-15', 185.00, 2, '2023-06-15'),
(10253783, '2023-07-01', 95.00, 3, '2023-07-01'),
(10254783, '2023-07-10', 240.00, 1, '2023-07-10'),
(10255783, '2023-07-15', 160.00, 3, '2023-07-15');
  1. On successful creation of the table, you should now be able to query the data. Select the table store_sales_lakehouse and select Query with Redshift.

Import assets to the project catalog from various data sources

To share your assets outside your own project to other business units, you must first bring your metadata to SageMaker Catalog. To import the assets into the project’s inventory, you need to create a data source in the project catalog. In this section, we show you how to import the technical metadata from AWS Glue data catalogs. Here, you will import data assets from various sources that you have created as part of your data preparation.

  1. Sign in to SageMaker Unified Studio as a member of the retail team. Select the project retailsales-sql-project, under Project catalog. Choose Data sources and import the assets by choosing Run.

  1. To import the federated catalog, create a new data source and choose Run. This will import the metadata of the inventory data from DynamoDB table.

  1. After successful run of all the data sources, choose Assets under Project catalog in the navigation plane. You will find all the assets in the Inventory of Project catalog.

Publish the assets

To make the assets discoverable to the data analysts team, the retail team must publish their assets.

  1. In the project retailsales-sql-project, choose Project catalog and select Assets.
  2. Select each asset in the INVENTORY tab, enrich the asset with the automated metadata generation and PUBLISH ASSET.

Discover the assets

SageMaker Catalog within SageMaker Unified Studio enables efficient data asset discovery and access management. The data analysts team signs in to SageMaker Unified Studio and selects the project dataanalyst-sql-project. The data analysts team then locates the desired assets in SageMaker Catalog and initiates the subscription request.

In this section, members of dataanalyst-sql-project browse the catalog and find the assets. There are multiple ways to find the desired assets.

  • Sign in to SageMaker Unified Studio as a member of the data analysts team. Choose Discover in the top navigation bar and select Catalog. Find the desired asset by browsing or entering the name of the asset into the search bar.
  • Search for the asset through a conversational interface using Amazon Q.
  • Use the faceted filter search by selecting the desired project in the BROWSE CATALOG.

The data analysts team selects the project retailsales-sql-project.

Subscribe to the assets

The data analysts team submits a subscription request with an appropriate justification for each of these assets.

  1. For each asset, choose SUBSCRIBE.
  2. Select dataanalyst-sql-project in Project.
  3. Provide the Reason for request as “need this data for analysis”.

Note that during the subscription process, the requester sees a message that the asset access control and fulfillment will be Managed. This means that SageMaker Unified Studio automatically manages subscription access grants and permissions for these assets.

Subscription approval workflow

To approve the subscription request, you must be a member of the retail team and select the project that has published the asset.

  1. Sign in to SageMaker Unified Studio as a member of the retail team and select the project retailsales-sql-project.
  2. In the navigation pane, choose Project catalog and then select Subscription requests.
  3. In INCOMING REQUESTS, choose the REQUESTED tab and select View request for each asset to see detailed information of the subscription request.

  • REQUEST DETAILS provides information about the subscribing project, the requestor, and the justification to access the asset.
  • RESPONSE DETAILS provides an option to approve the subscription with full access to the data (Full access) or restricted access to the data (Approve with row or column filters). With restricted access to data, the subscription approval workflow process offers granular access control for sensitive data through row-level filtering and column-level filtering. Using row filters, approvers can restrict access to specific records based on defined criteria. Using column filters, approvers can control access to specific columns within the data sets. This allows excluding sensitive fields while sharing the relevant data. Approvers can implement these filters during the approval process, helping to ensure that the data access aligns with the organization’s security requirements and compliance policies. For this post, select Full access in the RESPONSE DETAILS
  • (Optional) Decision comment is where you can add a comment about accepting or rejecting the subscription request.
  • Choose APPROVE.

  1. Repeat the subscription approval workflow process for all the requested assets.
  2. After all the subscription requests are approved, choose the APPROVED tab to view all the approved assets.

Subscription fulfillment methods

After subscription approval, a fulfillment process manages access to the assets. SageMaker Unified Studio provides fulfillment methods for managed assets and unmanaged assets.

  • Managed assets: SageMaker Unified Studio automatically manages the fulfillment and permissions for assets such as AWS Glue tables and Amazon Redshift tables and views.
  • Unmanaged assets: For unmanaged assets, permissions are handled externally. SageMaker Unified Studio publishes standard events for actions such as approvals through Amazon EventBridge, enabling integration with other AWS services or third-party solutions for custom integrations.

In this scenario 1, because the assets are Data Catalogs, SageMaker Unified Studio grants and manages access to these managed assets on your behalf through Lake Formation. See the SageMaker Unified Studio subscription workflow for updates on sharing options.

Analyze the data

The data analysts team uses the subscribed data assets from varied sources to get unified insights.

  1. As a data analyst, sign in to SageMaker Unified Studio and select the project dataanalyst-sql-project. In the navigation pane, choose Project catalog and select Assets.
  2. Choose the SUBSCRIBED tab to find all the subscribed assets from the retailsales-sql-project.
  3. The status under each asset is Asset accessible. This indicates that the subscription grants are fulfilled and the data analysts team can now consume the assets with the compute of their choice.

Query using Athena (subscription grants fulfilled using Lake Formation)

As a member of the data analysts team, create a unified view to get purchase history with customer information for active products.

  1. In the dataanalyst-sql-project project, go to Build and select Query Editor.
  2. Use the following sample query to get the required information. Replace glue_db_<environmentid> with your subscribed glue database.
select * from "redshift-lakehouse-connection-catalogs/dev"."public"."store_sales_lakehouse" sales 
 left  join "awsdatacatalog"."glue_db_<environmentid>"."customer" customer
 on sales.cust_id=customer.cust_id
 inner  join "dynamodb-connection-catalogs"."default"."inventory" inventory
 on sales.prod_id = inventory.prod_id
 where inventory.active ='Y'

Solution walk-through (Scenario 2)

In this scenario, we assume that the retail team stores the purchase history data in their Amazon Redshift data warehouse. Because you’re using the default SQL analytics project profile to create the project, you will use a Redshift Serverless compute (project.redshift). The purchase history data is shared with the marketing team for enhanced campaign performance.

  1. Sign in to SageMaker Unified Studio as a member of the retail team and select the project retailsales-sql-project.
  2. On the top menu, choose Build, and under DATA ANALYSIS & INTEGRATION, select Query Editor
  3. Select the following options:
    • Under CONNECTIONS, select Redshift(Lakehouse).
    • Under CATALOGS, select dev.
    • Under DATABASES, select public.
  4. Run the following SQL:
CREATE TABLE public.store_sales (
sale_id INTEGER IDENTITY(1,1) PRIMARY KEY,
cust_id INTEGER NOT NULL,
sale_date DATE NOT NULL,
sale_amount DECIMAL(10, 2) NOT NULL,
prod_id INTEGER  NOT NULL,
last_purchase_date DATE
);
INSERT INTO public.store_sales (cust_id, sale_date, sale_amount, prod_id, last_purchase_date)
VALUES
(13251813, '2023-01-15', 150.00, 1, '2023-01-15'),
(29033279, '2023-01-20', 200.00, 4, '2023-01-20'),
(12755125, '2023-02-01', 75.50, 3, '2023-02-01'),
(26009249, '2023-02-10', 300.00, 2, '2023-02-10'),
(3270685, '2023-02-15', 125.00, 2, '2023-02-15'),
(6520539, '2023-03-01', 100.00, 2, '2023-03-01'),
(10251183, '2023-03-10', 250.00, 1, '2023-03-10'),
(10251283, '2023-03-15', 180.00, 1, '2023-03-15'),
(10251383, '2023-04-01', 90.00, 2, '2023-04-01'),
(10251483, '2023-04-10', 220.00, 3, '2023-04-10'),
(10251583, '2023-04-15', 175.00, 3, '2023-04-15'),
(10251683, '2023-05-01', 130.00, 1, '2023-05-01'),
(10251783, '2023-05-10', 280.00, 1, '2023-05-10'),
(10251883, '2023-05-15', 195.00, 4, '2023-05-15'),
(10251983, '2023-06-01', 110.00, 2, '2023-06-01'),
(10251083, '2023-06-10', 270.00, 1, '2023-06-10'),
(10252783, '2023-06-15', 185.00, 2, '2023-06-15'),
(10253783, '2023-07-01', 95.00, 3, '2023-07-01'),
(10254783, '2023-07-10', 240.00, 1, '2023-07-10'),
(10255783, '2023-07-15', 160.00, 3, '2023-07-15');

5. On successful execution of the query, you will see store_sales under Redshift in the navigation pane.

Import the asset to the project catalog inventory

To share your assets outside your own project to other marketing business units, you must first share your metadata to SageMaker Catalog. To import the assets into the project’s inventory, you need to run the data source in the project catalog.

In the project retailsales-sql-project, under Project catalog, select Data sources and import the asset store-sales. Select the highlighted data source and choose Run as shown in the screenshot.

Publish the asset

To make the assets discoverable to the marketing team, the retail team must publish their asset.

  1. Go to the navigation pane and choose Project catalog, and then select Assets.
  2. Select store-sales in the INVENTORY tab, enrich the asset with the automated metadata generation and PUBLISH ASSET as illustrated in the screenshot.

Discover and subscribe the asset

The marketing team discovers and subscribes to the store-sales asset.

  1. Sign in to SageMaker Unified Studio as a member of the marketing team and select marketing-sql-project.
  2. Navigate to the Discover menu in the top navigation bar and choose Catalog. Find the desired asset by browsing or entering the name of the asset into the search bar.
  3. Select the asset and choose SUBSCRIBE.
  4. Enter a justification in Reason for request and choose REQUEST.

Subscription approval workflow

The retail team gets an incoming request in their project to approve the subscription request.

  1. Sign in to the SageMaker Unified Studio and select the project retailsales-sql-project as a member of the retail team. Under Project catalog, select Subscription requests.
  2. In the INCOMING REQUESTS, under the REQUESTED tab, select View request for store-sales.

  1. You will see detailed information for the subscription request.
  2. Select Full access in the RESPONSE DETAILS and choose APPROVE.

Analyze the data

Sign in to SageMaker Unified Studio as a member of the marketing team and select marketing-sql-project.

  1. In the Project catalog, select Assets and choose the SUBSCRIBED tab to find all the subscribed assets from the retailsales-sql-project.
  2. Notice the status under the asset marked as Asset accessible. This indicates that the subscription grants are fulfilled and the marketing team can now consume the asset with the compute of their choice.

Query using Amazon Redshift (subscription grants fulfilled using native Amazon Redshift data sharing)

To query the shared data with Amazon Redshift compute, select Build and then Query Editor. Select the following options

  1. Under CONNECTIONS, select Redshift(Lakehouse).
  2. Under CATALOGS, select dev.
  3. Under DATABASES, select project.
select * from "dev"."project"."store_sales" sales  

When a subscription to an Amazon Redshift table or view is approved, SageMaker Unified Studio automatically adds the subscribed asset to the consumer’s Amazon Redshift Serverless workgroup for the project. Notice the subscribed asset is shared under the folder project. In the Redshift navigation pane, you can also see the datashare created between the source and the target cluster. In this case, because the data is shared in the same account but between different clusters, SageMaker Unified Studio creates a view in the target database and permissions are granted on the view. See Grant access to managed Amazon Redshift assets in Amazon SageMaker Unified Studio for information about data sharing options within Amazon Redshift.

Clean up

Make sure you remove the SageMaker Unified Studio resources to avoid any unexpected costs. Start by deleting the connections, catalogs, underlying data sources, projects, databases, and domain that you created for this post. For additional details, see the Amazon SageMaker Unified Studio Administrator Guide.

Conclusion

In this post, we explored two distinct approaches to data sharing and analytics.

Business units without an existing data warehouse can use a SageMaker Lakehouse managed RMS catalog. In the first scenario, we showcased subscription fulfillment of AWS Glue Data Catalogs using AWS Lake Formation for federated and managed catalogs. The data analysts team was able to connect and subscribe to the data shared by the retail team that resided in Amazon S3, Amazon Redshift, and other data sources such as DynamoDB through SageMaker Lakehouse.

In the second scenario, we demonstrated the native data-sharing capabilities of Amazon Redshift. In this scenario, we assume that the retail team has sales transactions stored in an Amazon Redshift data warehouse. Using the data sharing feature of Amazon Redshift, the asset was shared to the marketing team using Amazon SageMaker Unified Studio.

Both approaches enable unified querying across varied data sources with teams able to efficiently discover, publish, and subscribe to data assets while maintaining strict access controls through Amazon SageMaker Data and AI Governance. Subscription fulfillment is automated, reducing the administrative overhead. Using the query-in-place approach eliminates data redundancy and maintains data consistency while allowing unified analysis across data sources through a single integrated experience.

To learn more, see the Amazon SageMaker Unified Studio Administrator Guide and the following resources:


About the authors

Lakshmi Nair is a Senior Analytics Specialist Solutions Architect at AWS. She specializes in designing advanced analytics systems across industries. She focuses on crafting cloud-based data platforms, enabling real-time streaming, big data processing, and robust data governance. She can be reached through LinkedIn

Ramkumar Nottath is a Principal Solutions Architect at AWS focusing on Analytics services. He enjoys working with various customers to help them build scalable, reliable big data and analytics solutions. His interests extend to various technologies such as analytics, data warehousing, streaming, data governance, and machine learning. He loves spending time with his family and friends. 

How EUROGATE established a data mesh architecture using Amazon DataZone

Post Syndicated from Dr. Leonard Heilig original https://aws.amazon.com/blogs/big-data/how-eurogate-established-a-data-mesh-architecture-using-amazon-datazone/

This post is co-written by Dr. Leonard Heilig and Meliena Zlotos from EUROGATE.

For container terminal operators, data-driven decision-making and efficient data sharing are vital to optimizing operations and boosting supply chain efficiency. Internally, making data accessible and fostering cross-departmental processing through advanced analytics and data science enhances information use and decision-making, leading to better resource allocation, reduced bottlenecks, and improved operational performance. Externally, sharing real-time data with partners such as shipping lines, trucking companies, and customs agencies fosters better coordination, visibility, and faster decision-making across the logistics chain. Together, these capabilities enable terminal operators to enhance efficiency and competitiveness in an industry that is increasingly data driven.

EUROGATE is a leading independent container terminal operator in Europe, known for its reliable and professional container handling services. Every day, EUROGATE handles thousands of freight containers moving in and out of ports as part of global supply chains. Their terminal operations rely heavily on seamless data flows and the management of vast volumes of data. Recently, EUROGATE has developed a digital twin for its container terminal Hamburg (CTH), generating millions of data points every second from Internet of Things (IoT)devices attached to its container handling equipment (CHE).

In this post, we show you how EUROGATE uses AWS services, including Amazon DataZone, to make data discoverable by data consumers across different business units so that they can innovate faster. Two use cases illustrate how this can be applied for business intelligence (BI) and data science applications, using AWS services such as Amazon Redshift and Amazon SageMaker. We encourage you to read Amazon DataZone concepts and terminology to become familiar with the terms used in this post.

Data landscape in EUROGATE and current challenges faced in data governance

The EUROGATE Group is a conglomerate of container terminals and service providers, providing container handling, intermodal transports, maintenance and repair, and seaworthy packaging services. In recent years, EUROGATE has made significant investments in modern cloud applications to enhance its operations and services along the logistics chains. With the addition of these technologies alongside existing systems like terminal operating systems (TOS) and SAP, the number of data producers has grown substantially. However, much of this data remains siloed and making it accessible for different purposes and other departments remains complex. Thus, managing data at scale and establishing data-driven decision support across different companies and departments within the EUROGATE Group remains a challenge.

Need for a data mesh architecture

Because entities in the EUROGATE group generate vast amounts of data from various sources—across departments, locations, and technologies—the traditional centralized data architecture struggles to keep up with the demands for real-time insights, agility, and scalability. The following requirements were essential to decide for adopting a modern data mesh architecture:

  • Domain-oriented ownership and data-as-a-product: EUROGATE aims to:
    • Enable scalable and straightforward data sharing across organizational boundaries.
    • Enhance agility by localizing changes within business domains and clear data contracts.
    • Improve accuracy and resiliency of analytics and machine learning by fostering data standards and high-quality data products.
    • Eliminate centralized bottlenecks and complex data pipelines.
  • Self-service and data governance: EUROGATE wants to ensure that the discovery, access, and use of data by consumers is as direct as possible through a data portal where information about shared data sets can be published, while data governance is streamlined through automated policy enforcement, ensuring compliance during key stages such as data discovery, access, and deployment.
  • Plug-and-play integration: A seamless, plug-and-play integration between data producers and consumers should facilitate rapid use of new data sets and enable quick proof of concepts, such as in the data science teams.

How Amazon DataZone helped EUROGATE address those challenges

In the first phase of establishing a data mesh, EUROGATE focused on standardized processes to allow data producers to share data in Amazon DataZone and to allow data consumers to discover and access data. The vision, as shown in the following figure, is that data from digital services, such as from the terminal operating system (TOS) and TwinSim (a project to create a digital twin of real-world operations), can be shared with Amazon DataZone and used by BI dashboards and data science teams, among others, while those digital services and other domain users can also consume subscribed data from Amazon DataZone.

EUROGATE_pic1

In the following section, two use cases demonstrate how the data mesh is established with Amazon DataZone to better facilitate machine learning for an IoT-based digital twin and BI dashboards and reporting using Tableau.

Use case 1: Machine learning for IoT-based digital twin

Through the TwinSim project, EUROGATE has developed a digital twin using AWS services that gathers real-time data (for example, positions, machinery, and pick/deck events) from CHE (including straddle carriers and quay cranes), integrates it with planning data from the TOS, and enhances it with additional sources such as weather information. In addition to real-time analytics and visualization, the data needs to be shared for long-term data analytics and machine learning applications. EUROGATE’s data science team aims to create machine learning models that integrate key data sources from various AWS accounts, allowing for training and deployment across different container terminals. To achieve this, EUROGATE designed an architecture that uses Amazon DataZone to publish specific digital twin data sets, enabling access to them with SageMaker in a separate AWS account.

As part of the required data, CHE data is shared using Amazon DataZone. The data originates in Amazon Kinesis Data Streams, from which it is copied to a dedicated Amazon Simple Storage Service (Amazon S3) bucket by using Amazon Data Firehose in combination with an AWS Lambda function for data filtering. An extract, transform, and load (ETL) process using AWS Glue is triggered once a day to extract the required data and transform it into the required format and quality, following the data product principle of data mesh architectures. From here, the metadata is published to Amazon DataZone by using AWS Glue Data Catalog. This process is shown in the following figure.

EUROGATE_2

To work with the shared data, the data science and AI teams subscribe to the data and query it using Amazon Athena by using Amazon SageMaker Data Wrangler. The following is an example query.

import awswrangler as wr
wr.athena.read_sql_query('SELECT * FROM "sagemakedatalakeenvironment_sub_db"."cycle_end"', "sagemakedatalakeenvironment_sub_db", ctas_approach=False)

A similar approach is used to connect to shared data from Amazon Redshift, which is also shared using Amazon DataZone.

import awswrangler as wr
con = wr.redshift.connect(secret_id="ai-dev-redshift-credentials",is_serverless=True,serverless_work_group="ai-dev-workgroup")
with con.cursor() as cursor:
cursor.execute('SELECT * FROM 
"datazone_datashare_db_269e5790f589258657fcc48d8cfd65ea3f3cd7f7"."datazone_env_twinsimsilverdata"."cycle_end";')
con.close()

With this, as the data lands in the curated data lake (Amazon S3 in parquet format) in the producer account, the data science and AI teams gain instant access to the source data eliminating traditional delays in the data availability. The data science and AI teams are able to explore and use new data sources as they become available through Amazon DataZone. Because Amazon DataZone integrates the data quality results, by subscribing to the data from Amazon DataZone, the teams can make sure that the data product meets consistent quality standards.

After experimentation, the data science teams can share their assets and publish their models to an Amazon DataZone business catalog using the integration between Amazon SageMaker and Amazon DataZone. This will be the future use case of EUROGATE where the ability to publish trained machine learning (ML) models back to an Amazon DataZone catalog promotes reusability, allowing models to be discovered by other teams and projects. This approach fosters knowledge sharing across the ML lifecycle.

Use case 2: BI for cloud applications

In recent years, EUROGATE has developed several cloud applications for supporting key container logistics processes and services, such as special container terminal and container depot applications or digital platforms for organizing container transports using rail and truck. The applications are hosted in dedicated AWS accounts and require a BI dashboard and reporting services based on Tableau. In the past, one-to-one connections were established between Tableau and respective applications. This led to a complex and slow computations. In this use case, EUROGATE implemented a hybrid data mesh architecture using Amazon Redshift as a centralized data platform. This approach transformed their fragmented Tableau connections into a scalable, efficient analytics ecosystem.

By centralizing container and logistics application data through Amazon Redshift and establishing a governance framework with Amazon DataZone, EUROGATE achieved both performance optimization and cost efficiency. The hybrid data mesh enables batch processing at scale while maintaining the data access controls, security, and governance; effectively balancing the distributed ownership with centralized analytics capabilities.

The data is shared from on-premises to an Amazon Relational Database Service (Amazon RDS) database in the AWS Cloud. AWS Database Migration Service (AWS DMS) is used to securely transfer the relevant data to a central Amazon Redshift cluster. AWS DMS tasks are orchestrated using AWS Step Functions. A Step Functions state machine is run on a daily using Amazon EventBridge scheduler. The data in the central data warehouse in Amazon Redshift is then processed for analytical needs and the metadata is shared to the consumers through Amazon DataZone. The consumer subscribes to the data product from Amazon DataZone and consumes the data with their own Amazon Redshift instance. This is further integrated into Tableau dashboards. The architecture is depicted in the following figure.

EUROGATE_3

Implementation benefits

As we continue to scale, efficient and seamless data sharing across services and applications becomes increasingly important. By using Amazon DataZone and other AWS services including Amazon Redshift and Amazon SageMaker, we can achieve a secure, streamlined, and scalable solution for data and ML model management, fostering effective collaboration and generating valuable insights. This approach supports both the immediate needs of visualization tools such as Tableau and the long-term demands of digital twin and IoT data analytics.

  • Centralized, scalable data sharing and native integration

Amazon DataZone facilitates integration with applications such as Tableau, enabling data to flow seamlessly within the AWS ecosystem. Those integrations reduce the need for complex, manual configurations, allowing EUROGATE to share data across the organization efficiently. The architecture centralizes key data, such as CHE data, for analytics and ML, ensuring that teams across the organization have access to consistent, up-to-date information, enhancing collaboration and decision-making at all levels. Insights from ML models can be channeled through Amazon DataZone to inform internal key decision makers internally and external partners.

  • Reduced complexity, greater scalability, and cost efficiency

The Amazon DataZone architecture reduces unnecessary complexity and scales with EUROGATE’s growing needs, whether through new data sources or increased user demand. In parallel, using Amazon Data Firehose to stream data into an S3 bucket and AWS Glue for daily ETL transformations provides an automated pipeline that prepares the data for long-term analytics. This batch-oriented approach reduces computational overhead and associated costs, allowing resources to be allocated efficiently. While real-time data is processed by other applications, this setup maintains high-performance analytics without the expense of continuous processing.

  • Faster and easier data integration for Tableau and enhanced data preparation for ML

Amazon DataZone streamlines data integration for tools such as Tableau, enabling BI teams to quickly add and visualize data without building complex pipelines. This agility accelerates EUROGATE’s insight generation, keeping decision-making aligned with current data. Additionally, daily ETL transformations through AWS Glue ensure high-quality, structured data for ML, enabling efficient model training and predictive analytics. This combination of ease and depth in data management equips EUROGATE to support both rapid BI needs and robust analytical processing for IoT and digital twin projects.

  • Faster onboarding and data sharing of data assets between organizational units

Amazon DataZone helps the teams to autonomously discover data assets that are created in the organization and to onboard data assets across AWS accounts within minutes with metadata synchronization. EUROGATE has already onboarded 500 data assets from different organizational units using Amazon DataZone. The new process of onboarding data assets is 15 times faster, leading to immediate visibility of data assets while simplifying data sharing and discovery through an intuitive point-and-click interface that removes traditional barriers to data access.

Conclusion

The implementation of Amazon DataZone marks a transformative step for EUROGATE’s data management by providing a scalable, and efficient solution for data sharing, machine learning and analytics. By integrating various data producers and connecting them to data consumers such as Amazon SageMaker and Tableau, Amazon DataZone functions as a digital library to streamline data sharing and integration across EUROGATE’s operations. In the first phase of production, Amazon DataZone has already demonstrated measurable benefits, including access to data and ML and the ability to incorporate a wider range of datasets to its unified catalog repository. By centralizing metadata with Amazon DataZone, EUROGATE is setting a solid foundation for efficient operations and improved data and ML governance, because teams can now discover, govern, and analyze data with greater confidence and speed. This capability supports rapid responses to business needs, helping EUROGATE to maintain agility and stay ahead of the curve. With this, EUROGATE is better positioned to onboard new data sources, integrate additional terminals, and expand machine learning applications across our container terminals.

Amazon DataZone empowers EUROGATE by setting the stage for long-term operational excellence and scalability. With a unified catalog, enhanced analytics capabilities, and efficient data transformation processes, we’re laying the groundwork for future growth. This infrastructure enables EUROGATE to extract predictive insights, drive smarter business decisions, and scale operations efficiently, ultimately supporting our goal of sustained innovation and competitive advantage.

Future vision and next steps

As EUROGATE continues to advance its digital transformation, the integration of Amazon DataZone and EUROGATE’s architecture lays the groundwork for a more data-driven and intelligent future. In the upcoming phases, the vision is to further expand the role of Amazon DataZone as the central platform for all data management, enabling seamless integration across an even broader set of data sources and consumers. This will include additional data from more container terminals and logistics service providers, enhanced operational metrics, IoT sensor data, and advanced third-party sources such as global supply chain data and maritime analytics.

The continued focus on secure data sharing and governance will also foster better collaboration with partners, suppliers, and customers, leading to improved service levels and a more resilient supply chain. This future vision will help EUROGATE maintain its position as a leader in container terminal operations while continuously adapting to technological advancements and market dynamics.

Ultimately, EUROGATE’s investment in this architecture ensures that the organization is well-positioned to scale and innovate in a dynamic industry through a future of smarter, more connected, and highly efficient container terminal operations.

To learn more about Amazon DataZone and how to get started, see the Getting started guide. See the YouTube playlist for some of the latest demos of Amazon DataZone and short descriptions of the capabilities available.


About the Authors

Dr. Leonard Heilig is CTO at driveMybox and drives digitalization and AI initiatives at EUROGATE, bringing over 10 years of research and industry experience in cloud-based platform development, data management, and AI. Combining a deep understanding of advanced technologies with a passion for innovation, Leonard is dedicated to transforming logistics processes through digitalization and AI-driven solutions.

Meliena ZlotosMeliena Zlotos is a DevOps Engineer at EUROGATE with a background in Industrial Engineering. She has been heavily involved in the Data Sharing Project, focusing on the implementation of Amazon DataZone into EUROGATE’s IT environment. Through this project, Meliena has gained valuable experience and insights into DataZone and Data Engineering, contributing to the successful integration and optimization of data management solutions within the organization.

Lakshmi Nair is a Senior Specialist Solutions Architect for Data Analytics at AWS. She focuses on architecting solutions for organizations across their end-to-end data analytics estate, including batch and real-time streaming, data governance, big data, data warehousing, and data lake workloads. She can reached via LinkedIn.

Siamak NarimanSiamak Nariman is a Senior Product Manager at AWS. He is focused on AI/ML technology, ML model management, and ML governance to improve overall organizational efficiency and productivity. He has extensive experience automating processes and deploying various technologies.

Seamless integration of data lake and data warehouse using Amazon Redshift Spectrum and Amazon DataZone

Post Syndicated from Lakshmi Nair original https://aws.amazon.com/blogs/big-data/seamless-integration-of-data-lake-and-data-warehouse-using-amazon-redshift-spectrum-and-amazon-datazone/

Unlocking the true value of data often gets impeded by siloed information. Traditional data management—wherein each business unit ingests raw data in separate data lakes or warehouses—hinders visibility and cross-functional analysis. A data mesh framework empowers business units with data ownership and facilitates seamless sharing.

However, integrating datasets from different business units can present several challenges. Each business unit exposes data assets with varying formats and granularity levels, and applies different data validation checks. Unifying these necessitates additional data processing, requiring each business unit to provision and maintain a separate data warehouse. This burdens business units focused solely on consuming the curated data for analysis and not concerned with data management tasks, cleansing, or comprehensive data processing.

In this post, we explore a robust architecture pattern of a data sharing mechanism by bridging the gap between data lake and data warehouse using Amazon DataZone and Amazon Redshift.

Solution overview

Amazon DataZone is a data management service that makes it straightforward for business units to catalog, discover, share, and govern their data assets. Business units can curate and expose their readily available domain-specific data products through Amazon DataZone, providing discoverability and controlled access.

Amazon Redshift is a fast, scalable, and fully managed cloud data warehouse that allows you to process and run your complex SQL analytics workloads on structured and semi-structured data. Thousands of customers use Amazon Redshift data sharing to enable instant, granular, and fast data access across Amazon Redshift provisioned clusters and serverless workgroups. This allows you to scale your read and write workloads to thousands of concurrent users without having to move or copy the data. Amazon DataZone natively supports data sharing for Amazon Redshift data assets. With Amazon Redshift Spectrum, you can query the data in your Amazon Simple Storage Service (Amazon S3) data lake using a central AWS Glue metastore from your Redshift data warehouse. This capability extends your petabyte-scale Redshift data warehouse to unbounded data storage limits, which allows you to scale to exabytes of data cost-effectively.

The following figure shows a typical distributed and collaborative architectural pattern implemented using Amazon DataZone. Business units can simply share data and collaborate by publishing and subscribing to the data assets.

hubandspoke

The Central IT team (Spoke N) subscribes the data from individual business units and consumes this data using Redshift Spectrum. The Central IT team applies standardization and performs the tasks on the subscribed data such as schema alignment, data validation checks, collating the data, and enrichment by adding additional context or derived attributes to the final data asset. This processed unified data can then persist as a new data asset in Amazon Redshift managed storage to meet the SLA requirements of the business units. The new processed data asset produced by the Central IT team is then published back to Amazon DataZone. With Amazon DataZone, individual business units can discover and directly consume these new data assets, gaining insights to a holistic view of the data (360-degree insights) across the organization.

The Central IT team manages a unified Redshift data warehouse, handling all data integration, processing, and maintenance. Business units access clean, standardized data. To consume the data, they can choose between a provisioned Redshift cluster for consistent high-volume needs or Amazon Redshift Serverless for variable, on-demand analysis. This model enables the units to focus on insights, with costs aligned to actual consumption. This allows the business units to derive value from data without the burden of data management tasks.

This streamlined architecture approach offers several advantages:

  • Single source of truth – The Central IT team acts as the custodian of the combined and curated data from all business units, thereby providing a unified and consistent dataset. The Central IT team implements data governance practices, providing data quality, security, and compliance with established policies. A centralized data warehouse for processing is often more cost-efficient, and its scalability allows organizations to dynamically adjust their storage needs. Similarly, individual business units produce their own domain-specific data. There are no duplicate data products created by business units or the Central IT team.
  • Eliminating dependency on business units – Redshift Spectrum uses a metadata layer to directly query the data residing in S3 data lakes, eliminating the need for data copying or relying on individual business units to initiate the copy jobs. This significantly reduces the risk of errors associated with data transfer or movement and data copies.
  • Eliminating stale data – Avoiding duplication of data also eliminates the risk of stale data existing in multiple locations.
  • Incremental loading – Because the Central IT team can directly query the data on the data lakes using Redshift Spectrum, they have the flexibility to query only the relevant columns needed for the unified analysis and aggregations. This can be done using mechanisms to detect the incremental data from the data lakes and process only the new or updated data, further optimizing resource utilization.
  • Federated governance – Amazon DataZone facilitates centralized governance policies, providing consistent data access and security across all business units. Sharing and access controls remain confined within Amazon DataZone.
  • Enhanced cost appropriation and efficiency – This method confines the cost overhead of processing and integrating the data with the Central IT team. Individual business units can provision the Redshift Serverless data warehouse to solely consume the data. This way, each unit can clearly demarcate the consumption costs and impose limits. Additionally, the Central IT team can choose to apply chargeback mechanisms to each of these units.

In this post, we use a simplified use case, as shown in the following figure, to bridge the gap between data lakes and data warehouses using Redshift Spectrum and Amazon DataZone.

custom blueprints and spectrum

The underwriting business unit curates the data asset using AWS Glue and publishes the data asset Policies in Amazon DataZone. The Central IT team subscribes to the data asset from the underwriting business unit. 

We focus on how the Central IT team consumes the subscribed data lake asset from business units using Redshift Spectrum and creates a new unified data asset.

Prerequisites

The following prerequisites must be in place:

  • AWS accounts – You should have active AWS accounts before you proceed. If you don’t have one, refer to How do I create and activate a new AWS account? In this post, we use three AWS accounts. If you’re new to Amazon DataZone, refer to Getting started.
  • A Redshift data warehouse – You can create a provisioned cluster following the instructions in Create a sample Amazon Redshift cluster, or provision a serverless workgroup following the instructions in Get started with Amazon Redshift Serverless data warehouses.
  • Amazon Data Zone resources – You need a domain for Amazon DataZone, an Amazon DataZone project, and a new Amazon DataZone environment (with a custom AWS service blueprint).
  • Data lake asset – The data lake asset Policies from the business units was already onboarded to Amazon DataZone and subscribed by the Central IT team. To understand how to associate multiple accounts and consume the subscribed assets using Amazon Athena, refer to Working with associated accounts to publish and consume data.
  • Central IT environment – The Central IT team has created an environment called env_central_team and uses an existing AWS Identity and Access Management (IAM) role called custom_role, which grants Amazon DataZone access to AWS services and resources, such as Athena, AWS Glue, and Amazon Redshift, in this environment. To add all the subscribed data assets to a common AWS Glue database, the Central IT team configures a subscription target and uses central_db as the AWS Glue database.
  • IAM role – Make sure that the IAM role that you want to enable in the Amazon DataZone environment has necessary permissions to your AWS services and resources. The following example policy provides sufficient AWS Lake Formation and AWS Glue permissions to access Redshift Spectrum:
{
	"Version": "2012-10-17",
	"Statement": [{
		"Effect": "Allow",
		"Action": [
			"lakeformation:GetDataAccess",
			"glue:GetTable",
			"glue:GetTables",
			"glue:SearchTables",
			"glue:GetDatabase",
			"glue:GetDatabases",
			"glue:GetPartition",
			"glue:GetPartitions"
		],
		"Resource": "*"
	}]
}

As shown in the following screenshot, the Central IT team has subscribed to the data Policies. The data asset is added to the env_central_team environment. Amazon DataZone will assume the custom_role to help federate the environment user (central_user) to the action link in Athena. The subscribed asset Policies is added to the central_db database. This asset is then queried and consumed using Athena.

The goal of the Central IT team is to consume the subscribed data lake asset Policies with Redshift Spectrum. This data is further processed and curated into the central data warehouse using the Amazon Redshift Query Editor v2 and stored as a single source of truth in Amazon Redshift managed storage. In the following sections, we illustrate how to consume the subscribed data lake asset Policies from Redshift Spectrum without copying the data.

Automatically mount access grants to the Amazon DataZone environment role

Amazon Redshift automatically mounts the AWS Glue Data Catalog in the Central IT Team account as a database and allows it to query the data lake tables with three-part notation. This is available by default with the Admin role.

To grant the required access to the mounted Data Catalog tables for the environment role (custom_role), complete the following steps:

  1. Log in to the Amazon Redshift Query Editor v2 using the Amazon DataZone deep link.
  2. In the Query Editor v2, choose your Redshift Serverless endpoint and choose Edit Connection.
  3. For Authentication, select Federated user.
  4. For Database, enter the database you want to connect to.
  5. Get the current user IAM role as illustrated in the following screenshot.

getcurrentUser from Redshift QEv2

  1. Connect to Redshift Query Editor v2 using the database user name and password authentication method. For example, connect to dev database using the admin user name and password. Grant usage on the awsdatacatalog database to the environment user role custom_role (replace the value of current_user with the value you copied):
GRANT USAGE ON DATABASE awsdatacatalog to "IAMR:current_user"

grantpermissions to awsdatacatalog

Query using Redshift Spectrum

Using the federated user authentication method, log in to Amazon Redshift. The Central IT team will be able to query the subscribed data asset Policies (table: policy) that was automatically mounted under awsdatacatalog.

query with spectrum

Aggregate tables and unify products

The Central IT team applies the necessary checks and standardization to aggregate and unify the data assets from all business units, bringing them at the same granularity. As shown in the following screenshot, both the Policies and Claims data assets are combined to form a unified aggregate data asset called agg_fraudulent_claims.

creatingunified product

These unified data assets are then published back to the Amazon DataZone central hub for business units to consume them.

unified asset published

The Central IT team also unloads the data assets to Amazon S3 so that each business unit has the flexibility to use either a Redshift Serverless data warehouse or Athena to consume the data. Each business unit can now isolate and put limits to the consumption costs on their individual data warehouses.

Because the intention of the Central IT team was to consume data lake assets within a data warehouse, the recommended solution would be to use custom AWS service blueprints and deploy them as part of one environment. In this case, we created one environment (env_central_team) to consume the asset using Athena or Amazon Redshift. This accelerates the development of the data sharing process because the same environment role is used to manage the permissions across multiple analytical engines.

Clean up

To clean up your resources, complete the following steps:

  1. Delete any S3 buckets you created.
  2. On the Amazon DataZone console, delete the projects used in this post. This will delete most project-related objects like data assets and environments.
  3. Delete the Amazon DataZone domain.
  4. On the Lake Formation console, delete the Lake Formation admins registered by Amazon DataZone along with the tables and databases created by Amazon DataZone.
  5. If you used a provisioned Redshift cluster, delete the cluster. If you used Redshift Serverless, delete any tables created as part of this post.

Conclusion

In this post, we explored a pattern of seamless data sharing with data lakes and data warehouses with Amazon DataZone and Redshift Spectrum. We discussed the challenges associated with traditional data management approaches, data silos, and the burden of maintaining individual data warehouses for business units.

In order to curb operating and maintenance costs, we proposed a solution that uses Amazon DataZone as a central hub for data discovery and access control, where business units can readily share their domain-specific data. To consolidate and unify the data from these business units and provide a 360-degree insight, the Central IT team uses Redshift Spectrum to directly query and analyze the data residing in their respective data lakes. This eliminates the need for creating separate data copy jobs and duplication of data residing in multiple places.

The team also takes on the responsibility of bringing all the data assets to the same granularity and process a unified data asset. These combined data products can then be shared through Amazon DataZone to these business units. Business units can only focus on consuming the unified data assets that aren’t specific to their domain. This way, the processing costs can be controlled and tightly monitored across all business units. The Central IT team can also implement chargeback mechanisms based on the consumption of the unified products for each business unit.

To learn more about Amazon DataZone and how to get started, refer to Getting started. Check out the YouTube playlist for some of the latest demos of Amazon DataZone and more information about the capabilities available.


About the Authors

Lakshmi Nair is a Senior Analytics Specialist Solutions Architect at AWS. She specializes in designing advanced analytics systems across industries. She focuses on crafting cloud-based data platforms, enabling real-time streaming, big data processing, and robust data governance.

Srividya Parthasarathy is a Senior Big Data Architect on the AWS Lake Formation team. She enjoys building analytics and data mesh solutions on AWS and sharing them with the community.

Implement data quality checks on Amazon Redshift data assets and integrate with Amazon DataZone

Post Syndicated from Lakshmi Nair original https://aws.amazon.com/blogs/big-data/implement-data-quality-checks-on-amazon-redshift-data-assets-and-integrate-with-amazon-datazone/

Data quality is crucial in data pipelines because it directly impacts the validity of the business insights derived from the data. Today, many organizations use AWS Glue Data Quality to define and enforce data quality rules on their data at rest and in transit. However, one of the most pressing challenges faced by organizations is providing users with visibility into the health and reliability of their data assets. This is particularly crucial in the context of business data catalogs using Amazon DataZone, where users rely on the trustworthiness of the data for informed decision-making. As the data gets updated and refreshed, there is a risk of quality degradation due to upstream processes.

Amazon DataZone is a data management service designed to streamline data discovery, data cataloging, data sharing, and governance. It allows your organization to have a single secure data hub where everyone in the organization can find, access, and collaborate on data across AWS, on premises, and even third-party sources. It simplifies the data access for analysts, engineers, and business users, allowing them to discover, use, and share data seamlessly. Data producers (data owners) can add context and control access through predefined approvals, providing secure and governed data sharing. The following diagram illustrates the Amazon DataZone high-level architecture. To learn more about the core components of Amazon DataZone, refer to Amazon DataZone terminology and concepts.

DataZone High Level Architecture

To address the issue of data quality, Amazon DataZone now integrates directly with AWS Glue Data Quality, allowing you to visualize data quality scores for AWS Glue Data Catalog assets directly within the Amazon DataZone web portal. You can access the insights about data quality scores on various key performance indicators (KPIs) such as data completeness, uniqueness, and accuracy.

By providing a comprehensive view of the data quality validation rules applied on the data asset, you can make informed decisions about the suitability of the specific data assets for their intended use. Amazon DataZone also integrates historical trends of the data quality runs of the asset, giving full visibility and indicating if the quality of the asset improved or degraded over time. With the Amazon DataZone APIs, data owners can integrate data quality rules from third-party systems into a specific data asset. The following screenshot shows an example of data quality insights embedded in the Amazon DataZone business catalog. To learn more, see Amazon DataZone now integrates with AWS Glue Data Quality and external data quality solutions.

In this post, we show how to capture the data quality metrics for data assets produced in Amazon Redshift.

Amazon Redshift is a fast, scalable, and fully managed cloud data warehouse that allows you to process and run your complex SQL analytics workloads on structured and semi-structured data. Amazon DataZone natively supports data sharing for Amazon Redshift data assets.

With Amazon DataZone, the data owner can directly import the technical metadata of a Redshift database table and views to the Amazon DataZone project’s inventory. As these data assets gets imported into Amazon DataZone, it bypasses the AWS Glue Data Catalog, creating a gap in data quality integration. This post proposes a solution to enrich the Amazon Redshift data asset with data quality scores and KPI metrics.

Solution overview

The proposed solution uses AWS Glue Studio to create a visual extract, transform, and load (ETL) pipeline for data quality validation and a custom visual transform to post the data quality results to Amazon DataZone. The following screenshot illustrates this pipeline.

Glue ETL pipeline

The pipeline starts by establishing a connection directly to Amazon Redshift and then applies necessary data quality rules defined in AWS Glue based on the organization’s business needs. After applying the rules, the pipeline validates the data against those rules. The outcome of the rules is then pushed to Amazon DataZone using a custom visual transform that implements Amazon DataZone APIs.

The custom visual transform in the data pipeline makes the complex logic of Python code reusable so that data engineers can encapsulate this module in their own data pipelines to post the data quality results. The transform can be used independently of the source data being analyzed.

Each business unit can use this solution by retaining complete autonomy in defining and applying their own data quality rules tailored to their specific domain. These rules maintain the accuracy and integrity of their data. The prebuilt custom transform acts as a central component for each of these business units, where they can reuse this module in their domain-specific pipelines, thereby simplifying the integration. To post the domain-specific data quality results using a custom visual transform, each business unit can simply reuse the code libraries and configure parameters such as Amazon DataZone domain, role to assume, and name of the table and schema in Amazon DataZone where the data quality results need to be posted.

In the following sections, we walk through the steps to post the AWS Glue Data Quality score and results for your Redshift table to Amazon DataZone.

Prerequisites

To follow along, you should have the following:

The solution uses a custom visual transform to post the data quality scores from AWS Glue Studio. For more information, refer to Create your own reusable visual transforms for AWS Glue Studio.

A custom visual transform lets you define, reuse, and share business-specific ETL logic with your teams. Each business unit can apply their own data quality checks relevant to their domain and reuse the custom visual transform to push the data quality result to Amazon DataZone and integrate the data quality metrics with their data assets. This eliminates the risk of inconsistencies that might arise when writing similar logic in different code bases and helps achieve a faster development cycle and improved efficiency.

For the custom transform to work, you need to upload two files to an Amazon Simple Storage Service (Amazon S3) bucket in the same AWS account where you intend to run AWS Glue. Download the following files:

Copy these downloaded files to your AWS Glue assets S3 bucket in the folder transforms (s3://aws-glue-assets<account id>-<region>/transforms). By default, AWS Glue Studio will read all JSON files from the transforms folder in the same S3 bucket.

customtransform files

In the following sections, we walk you through the steps of building an ETL pipeline for data quality validation using AWS Glue Studio.

Create a new AWS Glue visual ETL job

You can use AWS Glue for Spark to read from and write to tables in Redshift databases. AWS Glue provides built-in support for Amazon Redshift. On the AWS Glue console, choose Author and edit ETL jobs to create a new visual ETL job.

Establish an Amazon Redshift connection

In the job pane, choose Amazon Redshift as the source. For Redshift connection, choose the connection created as prerequisite, then specify the relevant schema and table on which the data quality checks need to be applied.

dqrulesonredshift

Apply data quality rules and validation checks on the source

The next step is to add the Evaluate Data Quality node to your visual job editor. This node allows you to define and apply domain-specific data quality rules relevant to your data. After the rules are defined, you can choose to output the data quality results. The outcomes of these rules can be stored in an Amazon S3 location. You can additionally choose to publish the data quality results to Amazon CloudWatch and set alert notifications based on the thresholds.

Preview data quality results

Choosing the data quality results automatically adds the new node ruleOutcomes. The preview of the data quality results from the ruleOutcomes node is illustrated in the following screenshot. The node outputs the data quality results, including the outcomes of each rule and its failure reason.

previewdqresults

Post the data quality results to Amazon DataZone

The output of the ruleOutcomes node is then passed to the custom visual transform. After both files are uploaded, the AWS Glue Studio visual editor automatically lists the transform as mentioned in post_dq_results_to_datazone.json (in this case, Datazone DQ Result Sink) among the other transforms. Additionally, AWS Glue Studio will parse the JSON definition file to display the transform metadata such as name, description, and list of parameters. In this case, it lists parameters such as the role to assume, domain ID of the Amazon DataZone domain, and table and schema name of the data asset.

Fill in the parameters:

  • Role to assume is optional and can be left empty; it’s only needed when your AWS Glue job runs in an associated account
  • For Domain ID, the ID for your Amazon DataZone domain can be found in the Amazon DataZone portal by choosing the user profile name

datazone page

  • Table name and Schema name are the same ones you used when creating the Redshift source transform
  • Data quality ruleset name is the name you want to give to the ruleset in Amazon DataZone; you could have multiple rulesets for the same table
  • Max results is the maximum number of Amazon DataZone assets you want the script to return in case multiple matches are available for the same table and schema name

Edit the job details and in the job parameters, add the following key-value pair to import the right version of Boto3 containing the latest Amazon DataZone APIs:

--additional-python-modules

boto3>=1.34.105

Finally, save and run the job.

dqrules post datazone

The implementation logic of inserting the data quality values in Amazon DataZone is mentioned in the post Amazon DataZone now integrates with AWS Glue Data Quality and external data quality solutions . In the post_dq_results_to_datazone.py script, we only adapted the code to extract the metadata from the AWS Glue Evaluate Data Quality transform results, and added methods to find the right DataZone asset based on the table information. You can review the code in the script if you are curious.

After the AWS Glue ETL job run is complete, you can navigate to the Amazon DataZone console and confirm that the data quality information is now displayed on the relevant asset page.

Conclusion

In this post, we demonstrated how you can use the power of AWS Glue Data Quality and Amazon DataZone to implement comprehensive data quality monitoring on your Amazon Redshift data assets. By integrating these two services, you can provide data consumers with valuable insights into the quality and reliability of the data, fostering trust and enabling self-service data discovery and more informed decision-making across your organization.

If you’re looking to enhance the data quality of your Amazon Redshift environment and improve data-driven decision-making, we encourage you to explore the integration of AWS Glue Data Quality and Amazon DataZone, and the new preview for OpenLineage-compatible data lineage visualization in Amazon DataZone. For more information and detailed implementation guidance, refer to the following resources:


About the Authors

Fabrizio Napolitano is a Principal Specialist Solutions Architect for DB and Analytics. He has worked in the analytics space for the last 20 years, and has recently and quite by surprise become a Hockey Dad after moving to Canada.

Lakshmi Nair is a Senior Analytics Specialist Solutions Architect at AWS. She specializes in designing advanced analytics systems across industries. She focuses on crafting cloud-based data platforms, enabling real-time streaming, big data processing, and robust data governance.

Varsha Velagapudi is a Senior Technical Product Manager with Amazon DataZone at AWS. She focuses on improving data discovery and curation required for data analytics. She is passionate about simplifying customers’ AI/ML and analytics journey to help them succeed in their day-to-day tasks. Outside of work, she enjoys nature and outdoor activities, reading, and traveling.

Streamline your data governance by deploying Amazon DataZone with the AWS CDK

Post Syndicated from Bandana Das original https://aws.amazon.com/blogs/big-data/streamline-your-data-governance-by-deploying-amazon-datazone-with-the-aws-cdk/

Managing data across diverse environments can be a complex and daunting task. Amazon DataZone simplifies this so you can catalog, discover, share, and govern data stored across AWS, on premises, and third-party sources.

Many organizations manage vast amounts of data assets owned by various teams, creating a complex landscape that poses challenges for scalable data management. These organizations require a robust infrastructure as code (IaC) approach to deploy and manage their data governance solutions. In this post, we explore how to deploy Amazon DataZone using the AWS Cloud Development Kit (AWS CDK) to achieve seamless, scalable, and secure data governance.

Overview of solution

By using IaC with the AWS CDK, organizations can efficiently deploy and manage their data governance solutions. This approach provides scalability, security, and seamless integration across all teams, allowing for consistent and automated deployments.

The AWS CDK is a framework for defining cloud IaC and provisioning it through AWS CloudFormation. Developers can use any of the supported programming languages to define reusable cloud components known as constructs. A construct is a reusable and programmable component that represents AWS resources. The AWS CDK translates the high-level constructs defined by you into equivalent CloudFormation templates. AWS CloudFormation provisions the resources specified in the template, streamlining the usage of IaC on AWS.

Amazon DataZone core components are the building blocks to create a comprehensive end-to-end solution for data management and data governance. The following are the Amazon DataZone core components. For more details, see Amazon DataZone terminology and concepts.

  • Amazon DataZone domain – You can use an Amazon DataZone domain to organize your assets, users, and their projects. By associating additional AWS accounts with your Amazon DataZone domains, you can bring together your data sources.
  • Data portal – The data portal is outside the AWS Management Console. This is a browser-based web application where different users can catalog, discover, govern, share, and analyze data in a self-service fashion.
  • Business data catalog – You can use this component to catalog data across your organization with business context and enable everyone in your organization to find and understand data quickly.
  • Projects – In Amazon DataZone, projects are business use case-based groupings of people, assets (data), and tools used to simplify access to AWS analytics.
  • Environments – Within Amazon DataZone projects, environments are collections of zero or more configured resources on which a given set of AWS Identity and Access Management (IAM) principals (for example, users with a contributor permissions) can operate.
  • Amazon DataZone data source – In Amazon DataZone, you can publish an AWS Glue Data Catalog data source or Amazon Redshift data source.
  • Publish and subscribe workflows – You can use these automated workflows to secure data between producers and consumers in a self-service manner and make sure that everyone in your organization has access to the right data for the right purpose.

We use an AWS CDK app to demonstrate how to create and deploy core components of Amazon DataZone in an AWS account. The following diagram illustrates the primary core components that we create.

In addition to the core components deployed with the AWS CDK, we provide a custom resource module to create Amazon DataZone components such as glossaries, glossary terms, and metadata forms, which are not supported by AWS CDK constructs (at the time of writing).

Prerequisites

The following local machine prerequisites are required before starting:

Deploy the solution

Complete the following steps to deploy the solution:

  1. Clone the GitHub repository and go to the root of your downloaded repository folder:
    git clone https://github.com/aws-samples/amazon-datazone-cdk-example.git
    cd amazon-datazone-cdk-example

  2. Install local dependencies:
    $ npm ci ### this will install the packages configured in package-lock.json

  3. Sign in to your AWS account using the AWS CLI by configuring your credential file (replace <PROFILE_NAME> with the profile name of your deployment AWS account):
    $ export AWS_PROFILE=<PROFILE_NAME>

  4. Bootstrap the AWS CDK environment (this is a one-time activity and not needed if your AWS account is already bootstrapped):
    $ npm run cdk bootstrap

  5. Run the script to replace the placeholders for your AWS account and AWS Region in the config files:
    $ ./scripts/prepare.sh <<YOUR_AWS_ACCOUNT_ID>> <<YOUR_AWS_REGION>>

The preceding command will replace the AWS_ACCOUNT_ID_PLACEHOLDER and AWS_REGION_PLACEHOLDER values in the following config files:

  • lib/config/project_config.json
  • lib/config/project_environment_config.json
  • lib/constants.ts

Next, you configure your Amazon DataZone domain, project, business glossary, metadata forms, and environments with your data source.

  1. Go to the file lib/constants.ts. You can keep the DOMAIN_NAME provided or update it as needed.
  2. Go to the file lib/config/project_config.json. You can keep the example values for projectName and projectDescription or update them. An example value for projectMembers has also been provided (as shown in the following code snippet). Update the value of the memberIdentifier parameter with an IAM role ARN of your choice that you would like to be the owner of this project.
    "projectMembers": [
                {
                    "memberIdentifier": "arn:aws:iam::AWS_ACCOUNT_ID_PLACEHOLDER:role/Admin",
                    "memberIdentifierType": "UserIdentifier"
                }
            ]

  3. Go to the file lib/config/project_glossary_config.json. An example business glossary and glossary terms are provided for the projects; you can keep them as is or update them with your project name, business glossary, and glossary terms.
  4. Go to the lib/config/project_form_config.json file. You can keep the example metadata forms provided for the projects or update your project name and metadata forms.
  5. Go to the lib/config/project_enviornment_config.json file. Update EXISTING_GLUE_DB_NAME_PLACEHOLDER with the existing AWS Glue database name in the same AWS account where you are deploying the Amazon DataZone core components with the AWS CDK. Make sure you have at least one existing AWS Glue table in this AWS Glue database to publish as a data source within Amazon DataZone. Replace DATA_SOURCE_NAME_PLACEHOLDER and DATA_SOURCE_DESCRIPTION_PLACEHOLDER with your choice of Amazon DataZone data source name and description. An example of a cron schedule has been provided (see the following code snippet). This is the schedule for your data source run; you can keep the same or update it.
    "Schedule":{
       "schedule":"cron(0 7 * * ? *)"
    }

Next, you update the trust policy of the AWS CDK deployment IAM role to deploy a custom resource module.

  1. On the IAM console, update the trust policy of the IAM role for your AWS CDK deployment that starts with cdk-hnb659fds-cfn-exec-role- by adding the following permissions. Replace ${ACCOUNT_ID} and ${REGION} with your specific AWS account and Region.
         {
             "Effect": "Allow",
             "Principal": {
                 "Service": "lambda.amazonaws.com"
             },
             "Action": "sts:AssumeRole",
             "Condition": {
                 "ArnLike": {
                     "aws:SourceArn": [
                         
                         "arn:aws:lambda:${REGION}:{ACCOUNT_ID}:function:DataZonePreqStack-GlossaryLambda*",
                         "arn:aws:lambda:${REGION}:{ACCOUNT_ID}:function:DataZonePreqStack-GlossaryTermLambda*",
                         "arn:aws:lambda:${REGION}:{ACCOUNT_ID}:function:DataZonePreqStack-FormLambda*"
                     ]
                 }
             }
         }

Now you can configure data lake administrators in Lake Formation.

  1. On the Lake Formation console, choose Administrative roles and tasks in the navigation pane.
  2. Under Data lake administrators, choose Add and add the IAM role for AWS CDK deployment that starts with cdk-hnb659fds-cfn-exec-role- as an administrator.

This IAM role needs permissions in Lake Formation to create resources, such as an AWS Glue database. Without these permissions, the AWS CDK stack deployment will fail.

  1. Deploy the solution:
    $ npm run cdk deploy --all

  2. During deployment, enter y if you want to deploy the changes for some stacks when you see the prompt Do you wish to deploy these changes (y/n)?.
  3. After the deployment is complete, sign in to your AWS account and navigate to the AWS CloudFormation console to verify that the infrastructure deployed.

You should see a list of the deployed CloudFormation stacks, as shown in the following screenshot.

  1. Open the Amazon DataZone console in your AWS account and open your domain.
  2. Open the data portal URL available in the Summary section.
  3. Find your project in the data portal and run the data source job.

This is a one-time activity if you want to publish and search the data source immediately within Amazon DataZone. Otherwise, wait for the data source runs according to the cron schedule mentioned in the preceding steps.

Troubleshooting

If you get the message "Domain name already exists under this account, please use another one (Service: DataZone, Status Code: 409, Request ID: 2d054cb0-0 fb7-466f-ae04-c53ff3c57c9a)" (RequestToken: 85ab4aa7-9e22-c7e6-8f00-80b5871e4bf7, HandlerErrorCode: AlreadyExists), change the domain name under lib/constants.ts and try to deploy again.

If you get the message "Resource of type 'AWS::IAM::Role' with identifier 'CustomResourceProviderRole1' already exists." (RequestToken: 17a6384e-7b0f-03b3 -1161-198fb044464d, HandlerErrorCode: AlreadyExists), this means you’re accidentally trying to deploy everything in the same account but a different Region. Make sure to use the Region you configured in your initial deployment. For the sake of simplicity, the DataZonePreReqStack is in one Region in the same account.

If you get the message “Unmanaged asset” Warning in the data asset on your datazone project, you must explicitly provide Amazon DataZone with Lake Formation permissions to access tables in this external AWS Glue database. For instructions, refer to Configure Lake Formation permissions for Amazon DataZone.

Clean up

To avoid incurring future charges, delete the resources. If you have already shared the data source using Amazon DataZone, then you have to remove those manually first in the Amazon DataZone data portal because the AWS CDK isn’t able to automatically do that.

  1. Unpublish the data within the Amazon DataZone data portal.
  2. Delete the data asset from the Amazon DataZone data portal.
  3. From the root of your repository folder, run the following command:
    $ npm run cdk destroy --all

  4. Delete the Amazon DataZone created databases in AWS Glue. Refer to the tips to troubleshoot Lake Formation permission errors in AWS Glue if needed.
  5. Remove the created IAM roles from Lake Formation administrative roles and tasks.

Conclusion

Amazon DataZone offers a comprehensive solution for implementing a data mesh architecture, enabling organizations to address advanced data governance challenges effectively. Using the AWS CDK for IaC streamlines the deployment and management of Amazon DataZone resources, promoting consistency, reproducibility, and automation. This approach enhances data organization and sharing across your organization.

Ready to streamline your data governance? Dive deeper into Amazon DataZone by visiting the Amazon DataZone User Guide. To learn more about the AWS CDK, explore the AWS CDK Developer Guide.


About the Authors

Bandana Das is a Senior Data Architect at Amazon Web Services and specializes in data and analytics. She builds event-driven data architectures to support customers in data management and data-driven decision-making. She is also passionate about enabling customers on their data management journey to the cloud.

Gezim Musliaj is a Senior DevOps Consultant with AWS Professional Services. He is interested in various things CI/CD, data, and their application in the field of IoT, massive data ingestion, and recently MLOps and GenAI.

Sameer Ranjha is a Software Development Engineer on the Amazon DataZone team. He works in the domain of modern data architectures and software engineering, developing scalable and efficient solutions.

Sindi Cali is an Associate Consultant with AWS Professional Services. She supports customers in building data-driven applications in AWS.

Bhaskar Singh is a Software Development Engineer on the Amazon DataZone team. He has contributed to implementing AWS CloudFormation support for Amazon DataZone. He is passionate about distributed systems and dedicated to solving customers’ problems.