This week, a group of US lawmakers introduced the Stopping Grinch Bots Act — new legislation that could stop holiday hoarders on the Internet. This inspired us to put a spin on a Dr. Seuss classic:
Each person on the Internet liked Christmas a lot But the Grinch Bot, built by the scalper did not! The Grinch Bot hated Christmas! The whole Christmas season! Now, please don’t ask why. No one quite knows the reason.
Cloudflare stops billions of bad bots every day. As you might have guessed, we see all types of attacks, but none is more painful than a Grinch Bot attack. Join us as we take a closer look at this notorious holiday villain…
25 days seconds of Christmas
What is the Grinch Bot? Technically speaking, it’s just a program running on a computer, making automated requests that reach different websites. We’ve come to refer to these requests as “bots” on the Internet. Bots move quickly, leveraging the efficiency of computers to carry out tasks at scale. The Grinch Bot is a very special type that satisfies two conditions:
It only pursues online inventory, attempting to purchase items before humans can complete their orders.
It only operates during the holiday season.
Now, attackers use bots to perform these tasks all year long. But in these winter months, we like to use the term “Grinch Bot” as seasonal terminology.
The Grinch Bot strikes first around Black Friday. It knows that the best discounts come around Thanksgiving, and it loves to get a good deal. Exclusive items are always the first to go, so attackers use the Grinch Bot to cut every (virtual) line and checkpoint. Cloudflare detected nearly 1.5 trillion bot requests on Black Friday. That’s about half of all our traffic; but more on this in a bit.
The Grinch Bot strikes again on Cyber Monday. As shoppers find gifts for their loved ones, bots are ten steps ahead — selecting “add to cart” automatically. Many bots have payment details ready (perhaps even stolen from your account!).
The Grinch Bot will buy 500 pairs of Lululemon joggers before you even get one. And it’ll do so in seconds.
Nearly 44% of traffic comes from bad bots
The Grinch Bot has friends working throughout the year, putting pressure on security teams and moving undetected. 43.8% of Internet traffic comes from these bots. When the holidays arrive, the Grinch Bot can ask its friends how to attack the largest sites. They have already been testing tactics for months.
In response, many sites block individual IP addresses, groups of devices, or even entire countries. Other sites use Rate Limiting to reduce traffic volume. At Cloudflare, we’ve advocated not only for Rate Limiting, but also for a more sophisticated approach known as Bot Management, which dynamically identifies threats as they appear. Here’s a look at bot traffic before the holidays (1H 2021):
When we looked at bot traffic on Black Friday, we found that it had surged to nearly 50%.Cloudflare Radar showed data close to 55% (if you want to include the good bots as well). Businesses tell us this is the most vulnerable time of the year for their sites.
Over 300 billion bots…
Bots are highly effective at scale. While humans can purchase one or two items within a few minutes, bots can purchase far more inventory with little effort.
During the year, Cloudflare observed over 300 billion bots try to “add to cart.” How did we find this? We ran our bot detection engines on every endpoint that contains the word “cart.” Keep in mind, most bots are stopped before they can even view item details. There are trillions of inventory hoarding bots that were caught earlier in their efforts by our Bot Management and security solutions.
Even worse, some bots want to steal your holiday funds. They skip the ecommerce sites and head right for your bank, where they test stolen credentials and try to break into your account. 71% of login traffic comes from bots:
Bots operate at such an immense scale that they occasionally succeed. When this happens, they can break into accounts, retrieve your credit card information, and begin a holiday shopping spree.
Deck the halls with JS Challenges
We hate CAPTCHAs almost as much as we hate the Grinch Bot, so we built JS challenges as a lightweight, non-interactive alternative:
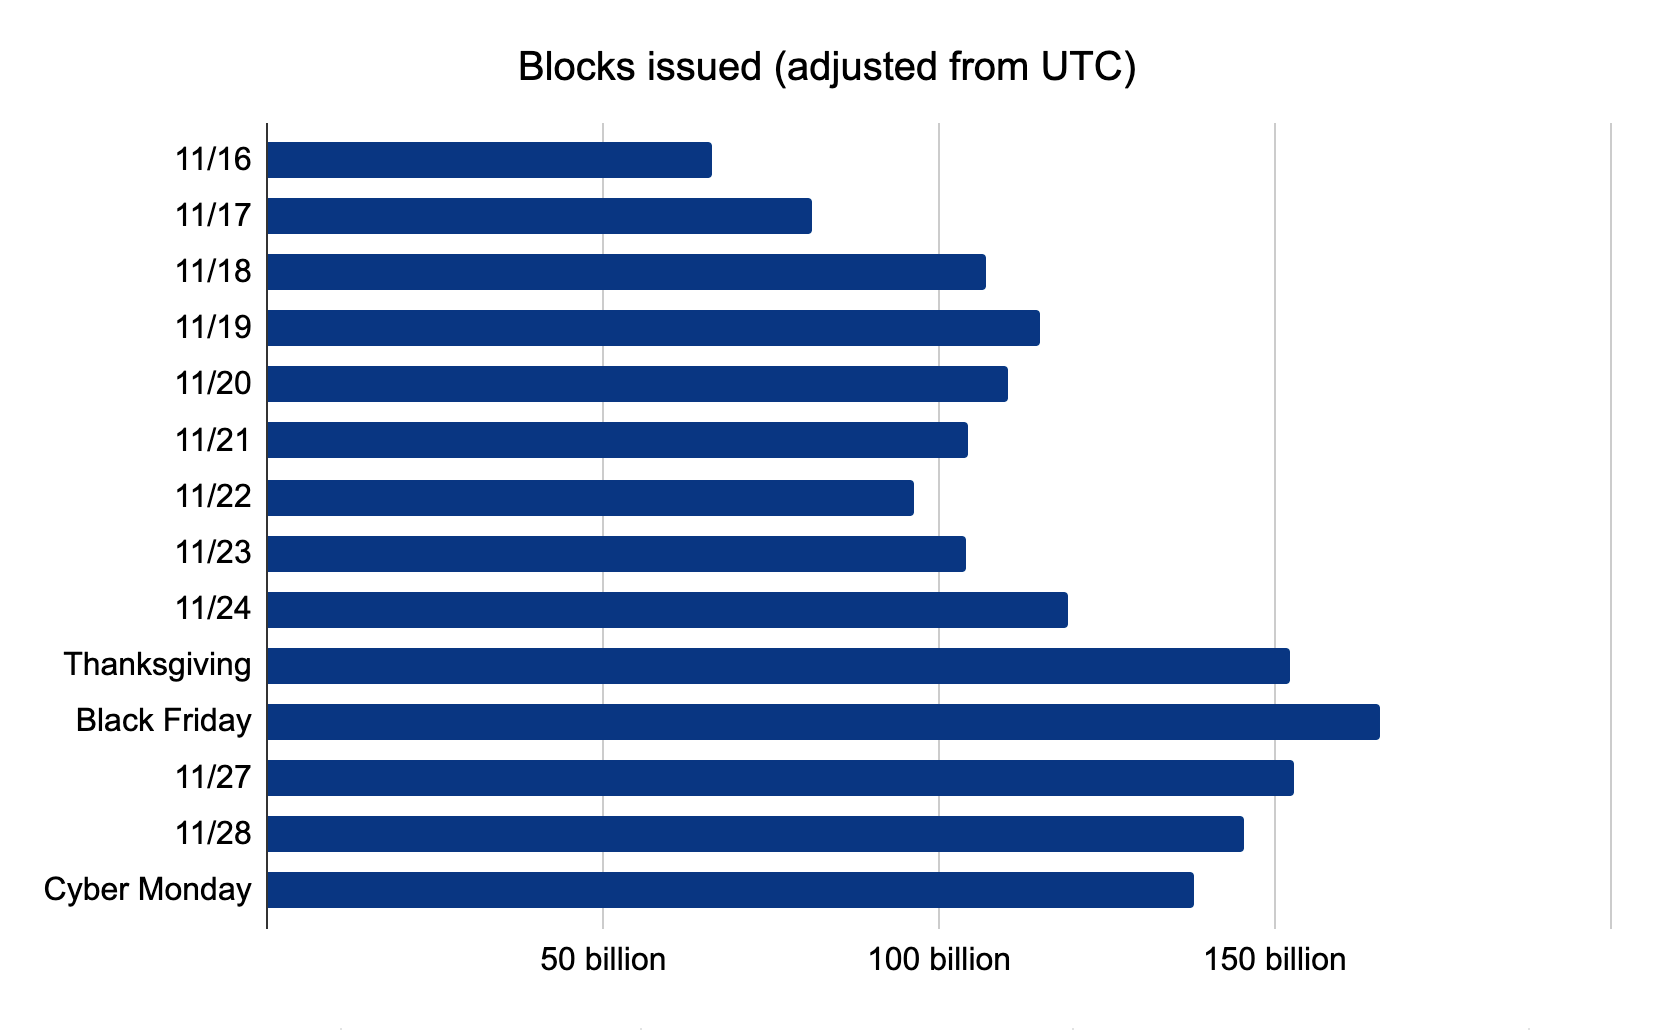
Not surprisingly, we issue more JS Challenges when more bots reach our network. These challenges are traditionally a middle ground between taking no action and completely blocking requests. They offer a chance for suspicious looking requests to prove their legitimacy. Cloudflare issued over 35 billion JS Challenges over the shopping weekend.
Even more impressive, however, is the number of threats blocked around this time. On Black Friday, Cloudflare blocked over 150 billion threats:
While we expected the Grinch Bot to make its move on Friday, we did not expect it to recede as it did on Cyber Monday. Bot traffic decreased as the shopping weekend continued. We like to think the Grinch Bot spent its time furiously trying to avoid blocks and JS Challenges, but eventually gave up.
Saving the Internet (and Christmas)
While large retailers can afford to purchase bot solutions, not every site is so fortunate. We decided to fix that.
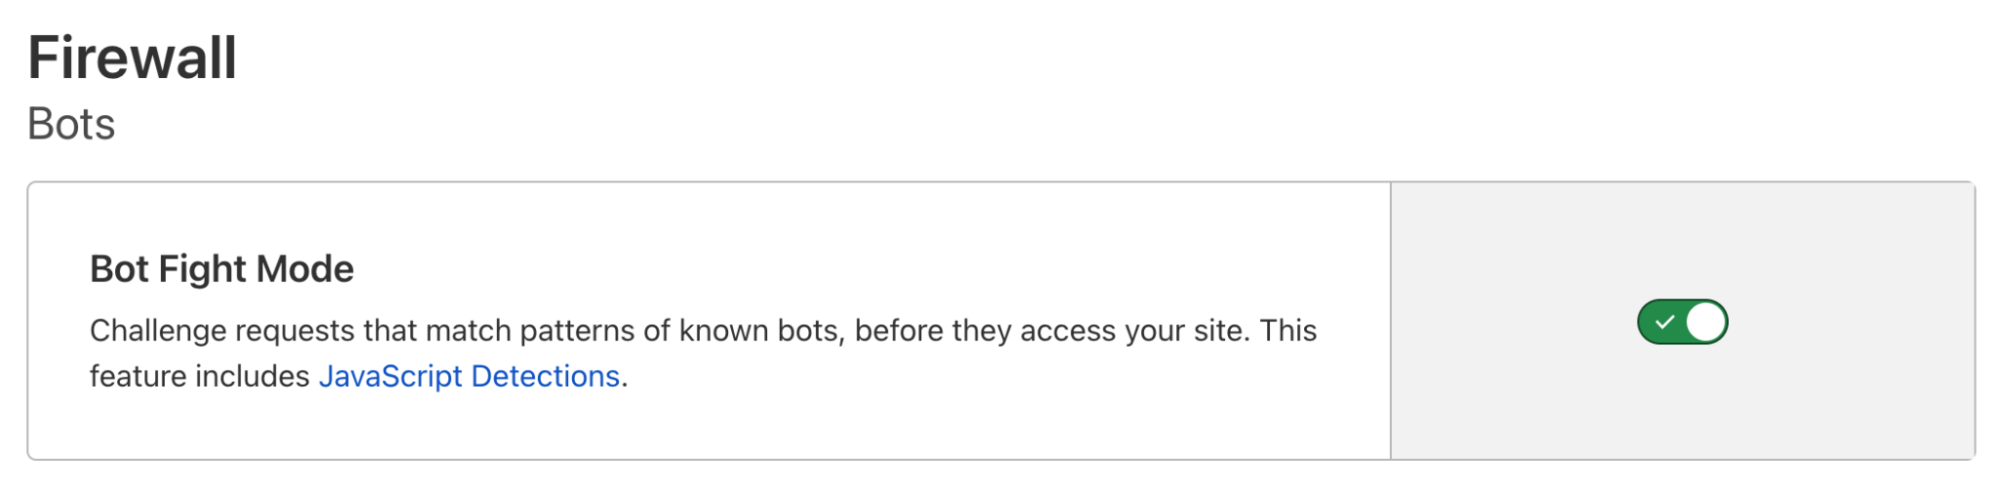
Cloudflare’s Bot Fight Mode is a completely free tool that stops bots. You can activate it with one click, drawing on our advanced detection engines to protect your site. It’s easy:
And Bot Fight Mode doesn’t just stop bots — it makes them pay. We unleash a tarpit challenge that preoccupies each bot with nonsense puzzles, ultimately handing bot operators a special gift: a massive server bill. We even plant trees to offset the carbon emissions of these expensive challenges. In fact, with so many bots stopped in the snow, there’s really just one thing left to say…
Every person on the Internet, the tall and the small, Called out with joy that their shopping didn’t stall! He hadn’t stopped Christmas from coming! It came! Somehow or other, it came just the same! And the Grinch Bot, with his grinch feet ice-cold in the snow, Stood puzzling and puzzling. “How could it be so?”
Cloudflare provides our customers with security tools that help them protect their Internet applications against malicious or undesired traffic. Malicious traffic can include scraping content from a website, spamming form submissions, and a variety of other cyberattacks. To protect themselves from these types of threats while minimizing the blocking of legitimate site visitors, Cloudflare’s customers need to be able to identify traffic that might be malicious.
We know some of our customers rely on IP addresses to distinguish between traffic from legitimate users and potentially malicious users. However, in many cases the IP address of a request does not correspond to a particular user or even device. Furthermore, Cloudflare believes that in the long term, the IP address will be an even more unreliable signal for identifying the origin of a request. We envision a day where IP will be completely unassociated with identity. With that vision in mind, multi-user IP address detection represents our first step: pointing out situations where the IP address of a request cannot be assumed to be a single user. This gives our customers the ability to make more judicious decisions when responding to traffic from an IP address, instead of indiscriminately treating that traffic as though it was coming from a single user.
Historically, companies commonly treated IP addresses like mobile phone numbers: each phone number in theory corresponds to a single person. If you get several spam calls within an hour from the same phone number, you might safely assume that phone number represents a single person and ignore future calls or even block that number. Similarly, many Internet security detection engines rely on IP addresses to discern which requests are legitimate and which are malicious.
However, this analogy is flawed and can present a problem for security. In practice, IP addresses are more like postal addresses because they can be shared by more than one person at a time (and because of NAT and CG-NAT the number of people sharing an IP can be very large!). Many existing Internet security tools accept IP addresses as a reliable way to distinguish between site visitors. However, if multiple visitors share the same IP address, security products cannot rely on the IP address as a unique identifying signal. Thousands of requests from thousands of different users need to be treated differently from thousands of requests from the same user. The former is likely normal traffic, while the latter is almost certainly automated, malicious traffic.
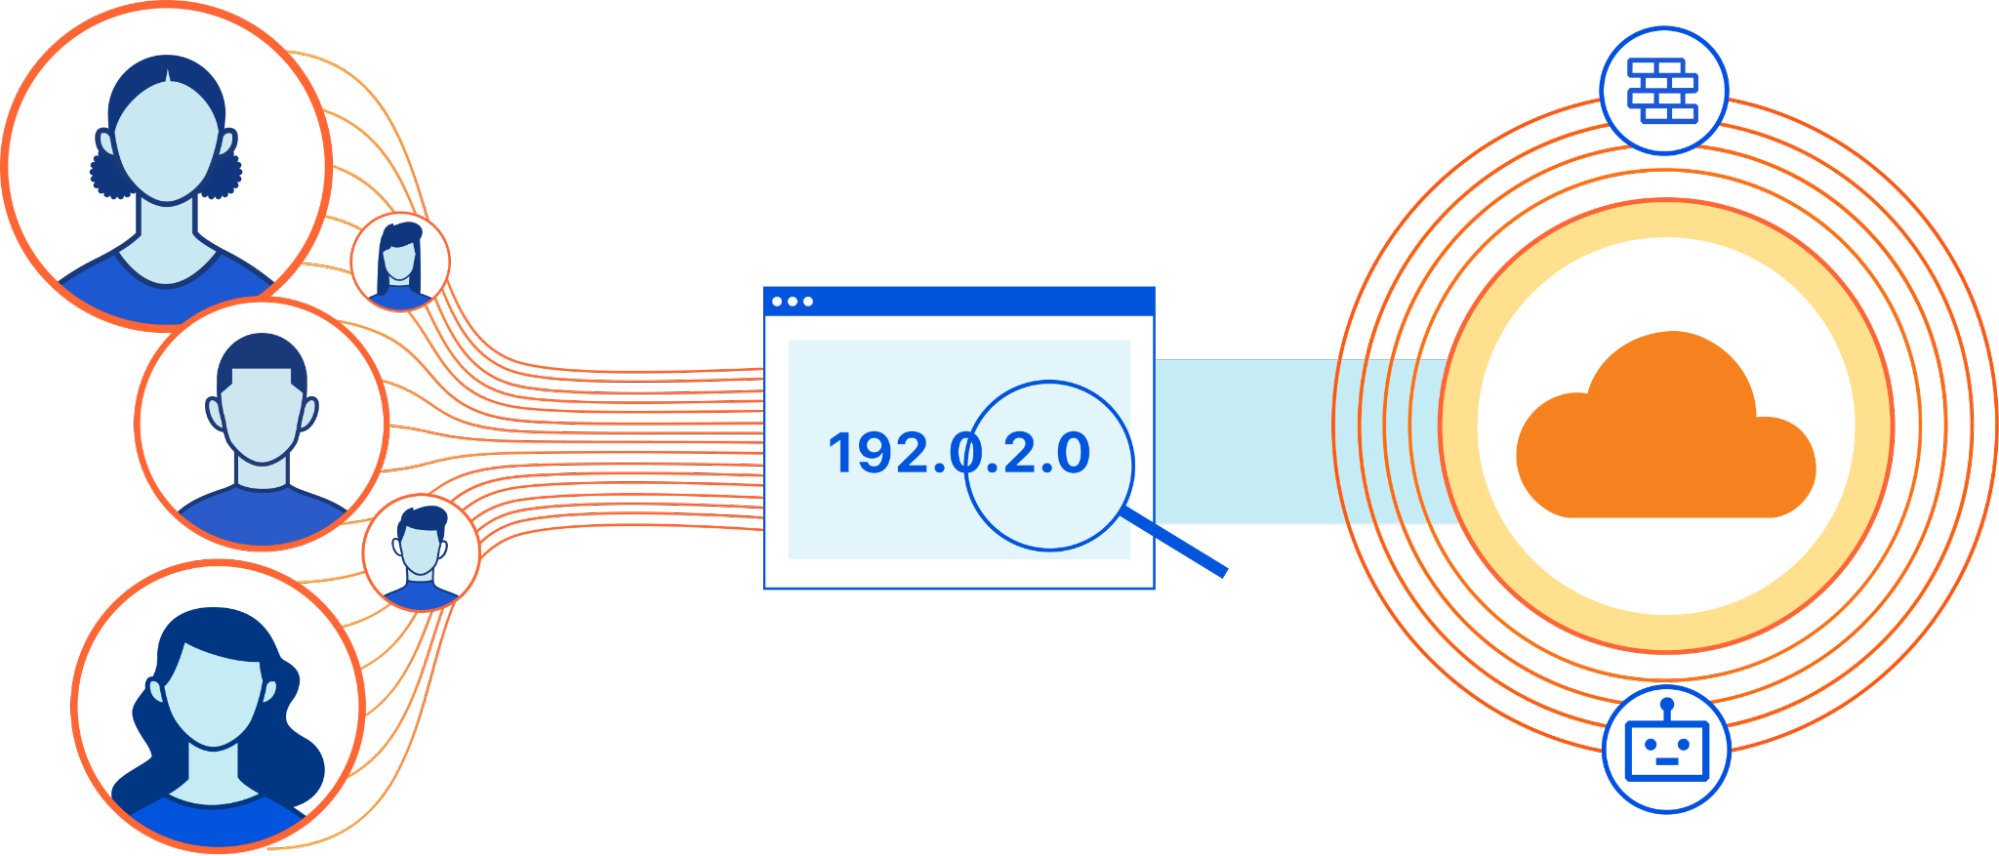
For example, if several people in the same apartment building accessed the same site, it’s possible all of their requests would be routed through a middlebox operated by their Internet service provider that has only one IP address. But this sudden series of requests from the same IP address could closely resemble the behavior of a bot. In this case, IP addresses can’t be used by our customers to distinguish this activity from a real threat, leading them to mistakenly block or challenge their legitimate site visitors.
By adding multi-user IP address detection to Cloudflare products, we’re improving the quality of our detection techniques and reducing false positives for our customers.
Examples of Multi-User IP Addresses
Multi-user IP addresses take on many forms. When your company uses an enterprise VPN, for example, employees may share the same IP address when accessing external websites. Other types of VPNs and proxies also place multiple users behind a single IP address.
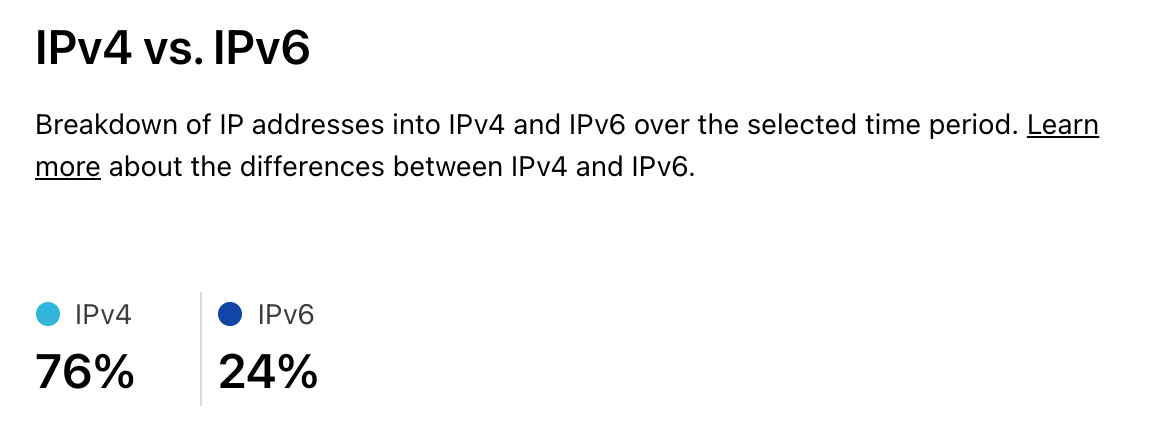
Another type of multi-user IP address originated from the core communications protocol of the Internet. IPv4 was developed in the 1980s. The protocol uses a 32-bit address space, allowing for over four billion unique addresses. Today, however, there are many times more devices than IPv4 addresses, meaning that not every device can have a unique IP address. Though IPv6 (IPv4’s successor protocol) solves the problem with 128-bit addresses (supporting 2128 unique addresses), IPv4 still routes the majority of Internet traffic (76% of human-only traffic is IPv4, as shown on Cloudflare Radar).
To solve this issue, many devices in the same Local Area Network (LAN) can share a single Internet-addressable IP address to communicate with the public Internet, while using private Internet addresses to communicate within the LAN. Since private addresses are to be used only within a LAN, different LANs can number their hosts using the same private IP address space. The Internet gateway of the LAN does the Network Address Translation (NAT), namely takes messages which arrive on that single public IP and forwards them to the private IP of the appropriate device on their local network. In effect it’s similar to how everyone in an office building shares the same street address, and the front desk worker is responsible for sorting out what mail was meant for which person.
While NAT allows multiple devices behind the same Internet gateway to share the same public IP address, the explosive growth of the Internet population necessitated further reuse of the limited IPv4 address space. Internet Service Providers (ISPs) required users in different LANs to share the same IP address for their service to scale. Carrier-Grade Network Address Translation (CG-NAT) emerged as another solution for address space reuse. Network operators can use CG-NAT middleboxes to translate hundreds or thousands of private IPv4 addresses into a single (or pool of) public IPv4 address. However, this sharing is not without side-effects. CG-NAT results in IP addresses that cannot be tied to single devices, users, or broadband subscriptions, creating issues for security products that rely on the IP address as a way to distinguish between requests from different users.
What We Built
We built a tool to help our customers detect when a /24 IP prefix (set of IP addresses that have the same first 24 bits) is likely to contain multi-user IP addresses, so they can more finely tune the security rules that protect their websites. In order to identify multi-user IP prefixes, we leverage both internal data and public data sources. Within this data, we look at a few key parameters.
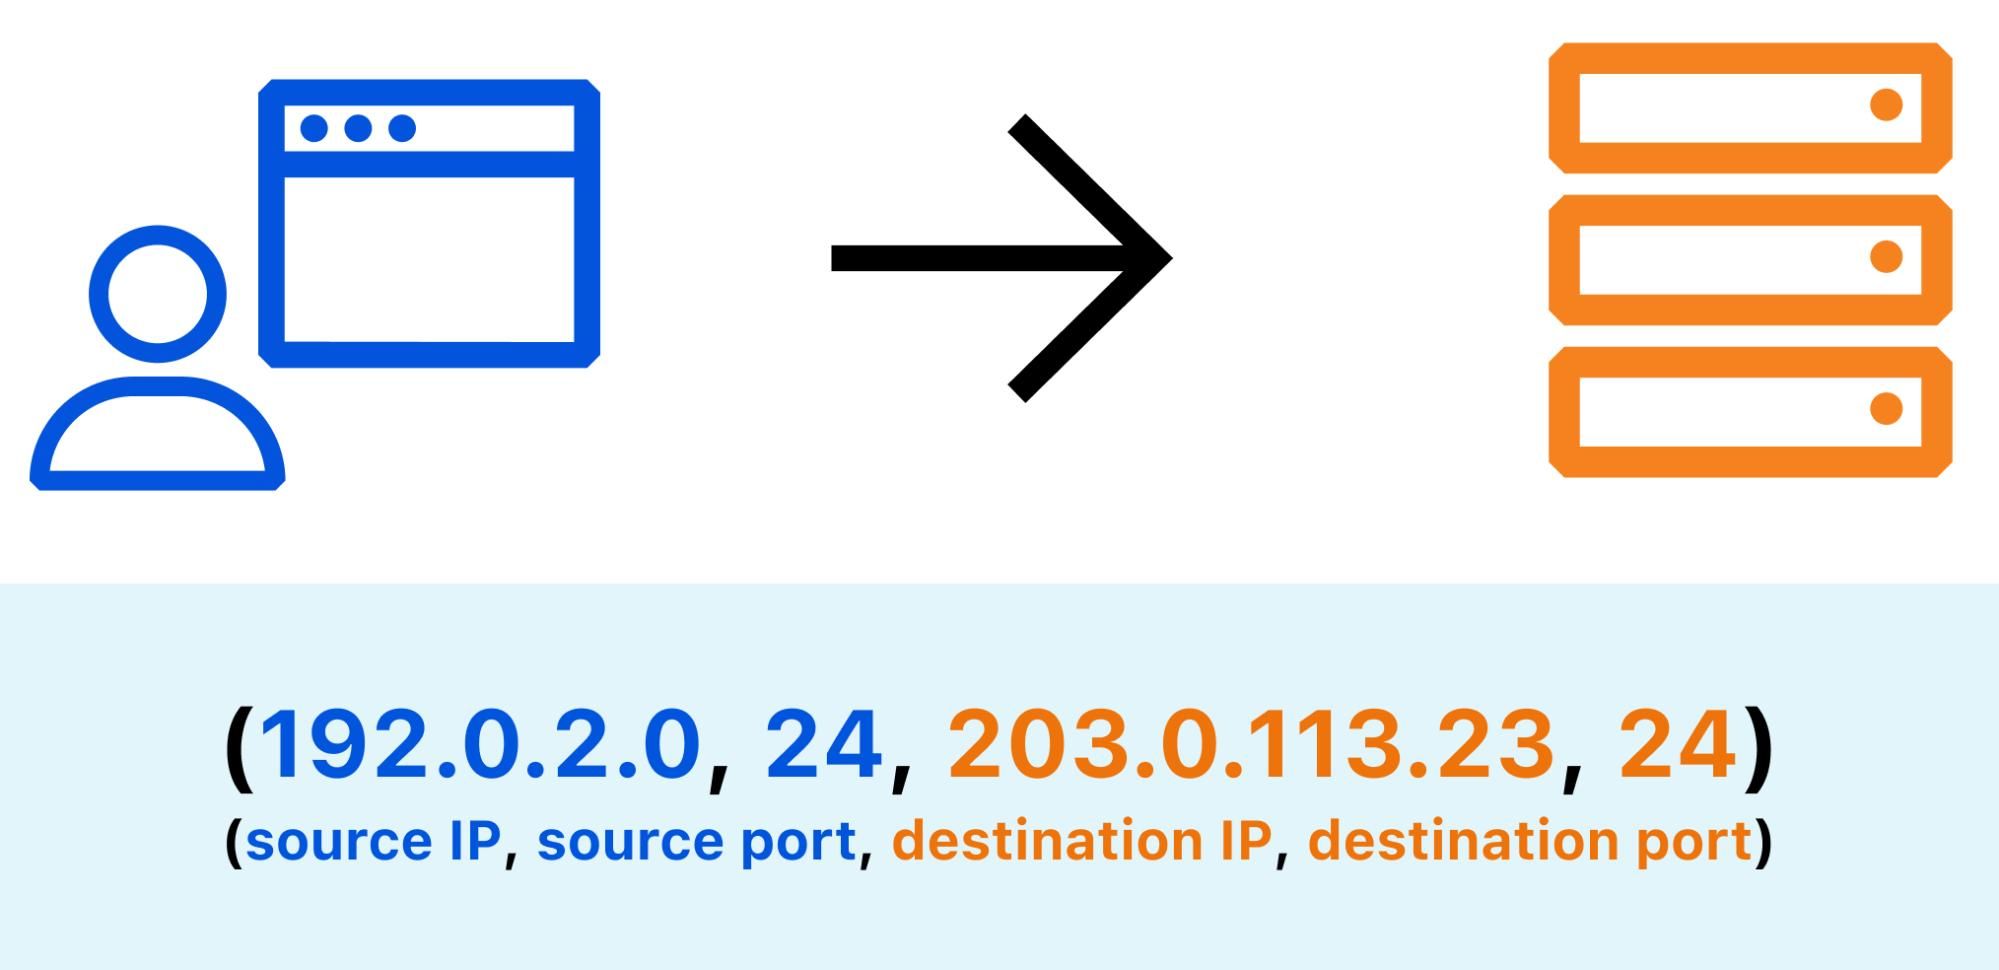
Each TCP connection between a source (client) and a destination (server) is identified by 4 identifiers (source IP, source port, destination IP, destination port)
When an Internet user visits a website, the underlying TCP stack opens a number of connections in order to send and receive data from remote servers. Each connection is identified by a 4-tuple (source IP, source port, destination IP, destination port). Repeating requests from the same web client will likely be mapped to the same source port, so the number of distinct source ports can serve as a good indication of the number of distinct client applications. By counting the number of open source ports for a given IP address, you can estimate whether this address is shared by multiple users.
User agents provide device-reported information about themselves such as browser and operating system versions. For multi-user IP detection, you can count the number of distinct user agents in requests from a given IP. To avoid overcounting web clients per device, you can exclude requests that are identified as triggered by bots and we only count requests from user agents that are used by web browsers. There are some tradeoffs to this approach: some users may use multiple web browsers and some other users may have exactly the same user agent. Nevertheless, past research has shown that the number of unique web browser user agents is the best tradeoff to most accurately determine CG-NAT usage.
Mozilla/5.0 (X11; Linux x86_64; rv:92.0) Gecko/20100101 Firefox/92.0
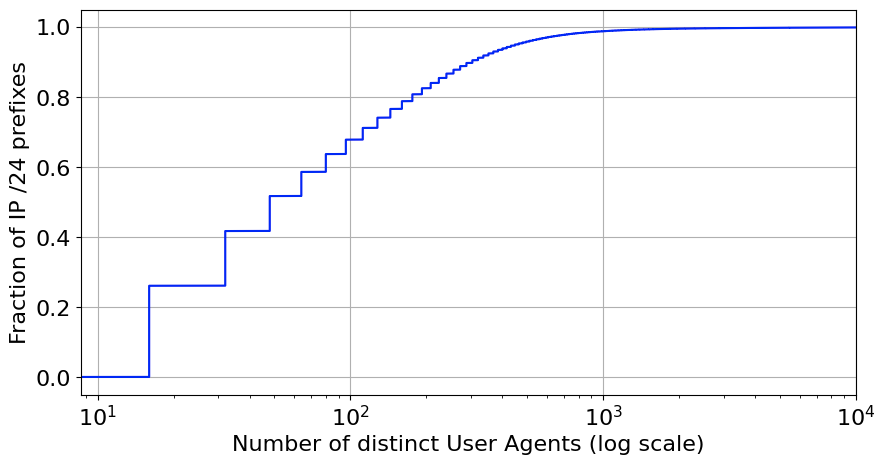
For our inferences, we group IP addresses to their corresponding /24 IP prefix. The figure below shows the distribution of browser User Agents per /24 IP prefix, based on data accumulated over the period of a day. About 35% of the prefixes have more than 100 different browser clients behind them.
Our service also uses other publicly available data sources to further refine the accuracy of our identification and to classify the type of multi-user IP address. For example, we collect data from PeeringDB, which is a database where network operators self-identify their network type, traffic levels, interconnection points, and peering policy. This data only covers a fraction of the Internet’s autonomous systems (ASes). To overcome this limitation, we use this data and our own data (number of requests per AS, number of websites in each AS) to infer AS type. We also use external data sources such as IRR to identify requests from VPNs and proxy servers.
These details (especially AS type) can provide more information on the type of multi-user IP address. For instance, CG-NAT systems are almost exclusively deployed by broadband providers, so by inferring the AS type (ISP, CDN, Enterprise, etc.), we can more confidently infer the type of each multi-user IP address. A scheduled job periodically executes code to pull data from these sources, process it, and write the list of multi-user IP addresses to a database. That IP info data is then ingested by another system that deploys it to Cloudflare’s edge, enabling our security products to detect potential threats with minimal latency.
To validate our inferences for which IP addresses are multi-user, we created a dataset relying on separate data and measurements which we believe are more reliable indicators. One method we used was running traceroute queries through RIPE Atlas, from each RIPE Atlas probe to the probe’s public IP address. By examining the traceroute hops, we can determine if an IP is behind a CG-NAT or another middlebox. For example, if an IP is not behind a CG-NAT, the traceroute should terminate immediately or just have one hop (likely a home NAT). On the other hand, if a traceroute path includes addresses within the RFC 6598 CGNAT prefix or other hops in the private or shared address space, it is likely the corresponding probe is behind CG-NAT.
To further improve our validation datasets, we’re also reaching out to our ISP partners to confirm the known IP addresses of CG-NATs. As we refine our validation data, we can more accurately tune our multi-user IP address inference parameters and provide a better experience to ISP customers on sites protected by Cloudflare security products.
The multi-user IP detection service currently recognizes approximately 500,000 unique multi-user IP addresses and is being tuned to further improve detection accuracy. Be on the lookout for an upcoming technical blog post, where we will take a deeper look at the system we built and the metrics collected after running this service for a longer period of time.
How Will This Impact Bot Management and Rate Limiting Customers?
Our initial launch will integrate multi-user IP address detection into our Bot Management and Rate Limiting products.
The three modules that comprise the bot detection system.
The Cloudflare Bot Management product has five detection mechanisms. The integration will improve three of the five: the machine learning (ML) detection mechanism, the heuristics engine, and the behavioral analysis models. Multi-user IP addresses and their types will serve as additional features to train our ML model. Furthermore, logic will be added to ensure multi-user IP addresses are treated differently in our other detection mechanisms. For instance, our behavioral analysis detection mechanism shouldn’t treat a series of requests from a multi-user IP the same as a series of requests from a single-user IP. There won’t be any new ways to see or interact with this feature, but you should expect to see a decrease in false positive bot detections involving multi-user IP addresses.
The integration with Rate Limiting will allow us to increase the set rate limiting threshold when receiving requests coming from multi-user IP addresses. The factor by which we increase the threshold will be conservative so as not to completely bypass the rate limit. However, the increased threshold should greatly reduce cases where legitimate users behind multi-user IP addresses are blocked or challenged.
We will also continue to make improvements to our multi-user IP address detection system to incorporate additional data sources and improve accuracy. One data source would allow us to get a fraction for the estimated number of subscribers over the total number of IPs advertised (owned) by an AS. ASes that have more estimated subscribers than available IPs would have to rely on CG-NAT to provide service to all subscribers.
As mentioned above, with the help of our ISP partners we hope to improve the validation datasets we use to test and refine the accuracy of our inferences. Additionally, our integration with Bot Management will also unlock an opportunity to create a feedback loop that further validates our datasets. The challenge solve rate (CSR) is a metric generated by Bot Management that indicates the proportion of requests that were challenged and solved (and thus assumed to be human). Examining requests with both high and low CSRs will allow us to check if the multi-user IP addresses we have initially identified indeed represent mostly legitimate human traffic that our customers should not block.
The continued adoption of IPv6 might someday make CG-NATs and other IPv4 sharing technologies irrelevant, as the address space will no longer be limited. This could reduce the prevalence of multi-user IP addresses. However, with the development of new networking technologies that obfuscate IP addresses for user privacy (for example, IPv6 randomized address assignment), it seems unlikely it will become any easier to tie an IP address to a single user. Cloudflare firmly believes that eventually, IP will be completely unassociated with identity.
Yet in the short term, we recognize that IP addresses still play a pivotal role for the security of our customers. By integrating this multi-user IP address detection capability into our products, we aim to deliver a more free and fluid experience for everyone using the Internet.
Cloudflare is deprecating the __cfduid cookie. Starting on 10 May 2021, we will stop adding a “Set-Cookie” header on all HTTP responses. The last __cfduid cookies will expire 30 days after that.
We never used the __cfduid cookie for any purpose other than providing critical performance and security services on behalf of our customers. Although, we must admit, calling it something with “uid” in it really made it sound like it was some sort of user ID. It wasn’t. Cloudflare never tracks end users across sites or sells their personal data. However, we didn’t want there to be any questions about our cookie use, and we don’t want any customer to think they need a cookie banner because of what we do.
So why did we use the __cfduid cookie before, and why can we remove it now?
The primary use of the cookie is for detectingbots on the web. Malicious bots may disrupt a service that has been explicitly requested by an end user (through DDoS attacks) or compromise the security of a user’s account (e.g. through brute force password cracking or credential stuffing, among others). We use many signals to build machine learning models that can detect automated bot traffic. The presence and age of the cfduid cookie was just one signal in our models. So for our customers who benefit from our bot management products, the cfduid cookie is a tool that allows them to provide a service explicitly requested by the end user.
The value of the cfduid cookie is derived from a one-way MD5 hash of the cookie’s IP address, date/time, user agent, hostname, and referring website — which means we can’t tie a cookie to a specific person. Still, as a privacy-first company, we thought: Can we find a better way to detect bots that doesn’t rely on collecting end user IP addresses?
For the past few weeks, we’ve been experimenting to see if it’s possible to run our bot detection algorithms without using this cookie. We’ve learned that it will be possible for us to transition away from using this cookie to detect bots. We’re giving notice of deprecation now to give our customers time to transition, while our bot management team works to ensure there’s no decline in quality of our bot detection algorithms after removing this cookie. (Note that some Bot Management customers will still require the use of a different cookie after April 1.)
While this is a small change, we’re excited about any opportunity to make the web simpler, faster, and more private.
Bots — both good and bad — are everywhere on the Internet. Roughly 40% of Internet traffic is automated. Fortunately, Cloudflare offers a tool that can detect and block unwanted bots: we call it Bot Management. This is the most recent platform in our long history of detecting bots for our customers. In fact, Cloudflare has always offered some form of bot detection. Over the past two years, our team has focused on building advanced detection engines, innovating as bots become more sophisticated, and creating new features.
Today, we are releasing Bot Analytics to help you visualize your automated traffic.
Background
It’s worth including some background for those who are new to bots.
Many websites expect human behavior. When I shop online, I behave as anyone else would: I might search for a few items, read reviews when I find something interesting, and eventually complete an order. This is expected. It is a standard use of the Internet.
Unfortunately, without protection these sites can be ripe for exploitation. Those shoes I was looking at? They are limited edition sneakers that resell for five times the price. Sneaker hoarders clamor at the chance to buy a pair (or fifty). Or perhaps I just added a book to my cart: there are probably hundreds of online retailers that sell the same book, each one eager to offer the best price. These retailers desperately want to know what their competitors’ prices are.
You can see where this is going. While most humans make good use of the Internet, some use automated tools to perform abuse at scale. For example, attackers will deplete sneaker inventories by using automated bots to check out quickly. By the time humans click “add to cart,” bots have already paid for shipping. Humans hardly stand a chance. Similarly, online retailers keep track of their competitors with “price scraping” bots that collect pricing information. So when one retailer lowers a book price to $10, another retailer’s bot will respond by pricing at $9.99. This is how we end up with weird prices like $12.32 for toilet paper. Worst of all, malicious bots are incentivized to hide their identities. They’re hidden among us.
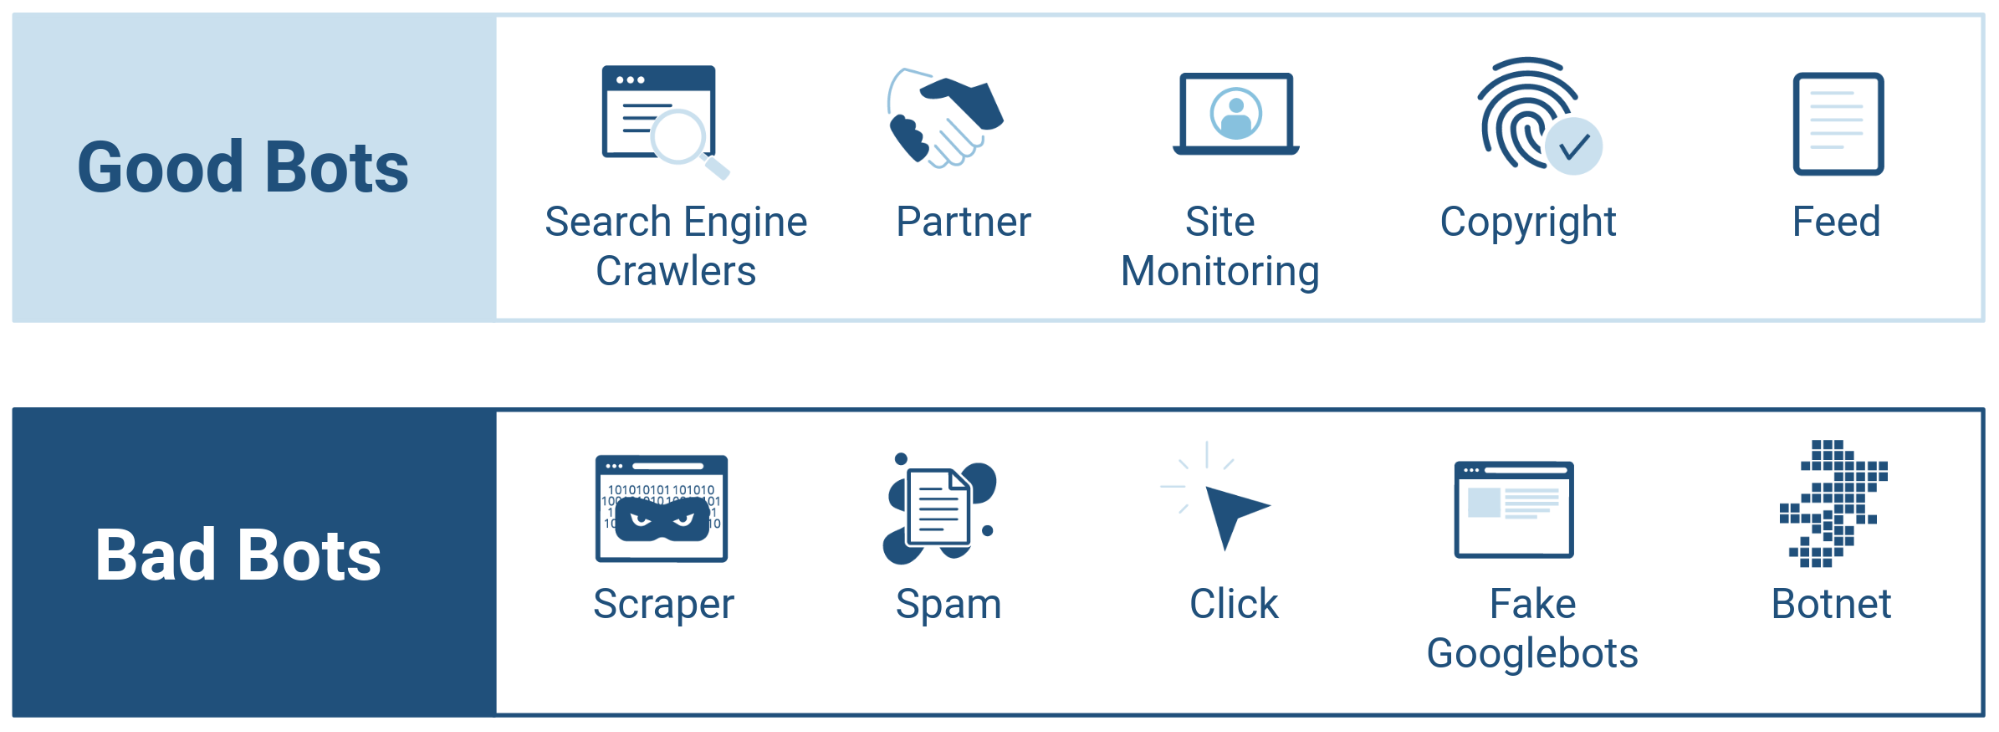
Not all bots are bad. Cloudflare maintains a list of verified good bots that we keep separated from the rest. Verified bots are usually transparent about who they are: DuckDuckGo, for example, publicly lists the IP addresses it uses for its search engine. This is a well-intentioned service that happens to be automated, so we verified it. We also verify bots for error monitoring and other tools.
Enter: Bot Analytics
As discussed earlier, we built a Bot Management platform that intelligently detects bots on the Internet, allowing our customers to block bad ones and allow good ones. If you’re curious about how our solution works, read here.
Beginning today, we are going to show you the bots that reach your website. You can see these bots with a new tool called Bot Analytics. It’s fast, accurate, and loaded with information. You can query data up to one month in the past with no noticeable lag. To accomplish this, we exposed the data with GraphQL and paired it with adaptive bitrate (ABR) technology to dynamically load content. If you already have Bot Management added to your Cloudflare account, Bot Analytics is included in your service. Open up your dashboard and let’s take a tour…
The Tour
First: where to go? Bot Analytics lives under the Firewall tab of the dashboard. Once you’re in the Firewall, go to “Overview” and click the second thumbnail on the left. Remember, Bot Management must be added to your account for full access to analytics.
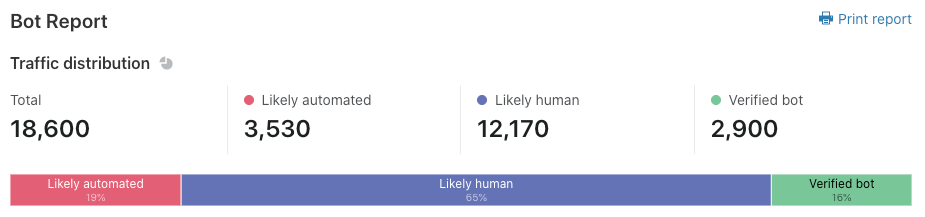
It’s worth noting that Enterprise sites without Bot Management can see a snapshot of their bot traffic. This data is updated in real time and should help you determine if you have a bot problem. Generally speaking, if you have a double-digit percentage of automated traffic, you might be spending more on origin costs than you have to. More importantly, you might be losing revenue or sensitive information to inventory hoarding and credential stuffing.
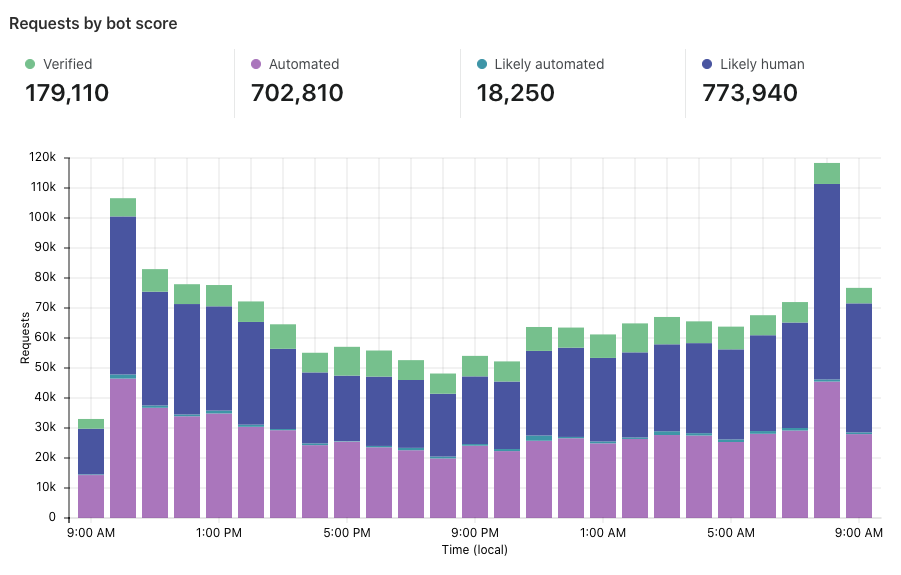
“Requests by bot score” is the first section on the page. Here, we show traffic over time, but we split it vertically by the traffic type. Green segments represent verified bots, while shades of purple and blue show varying degrees of bot/human likelihood.
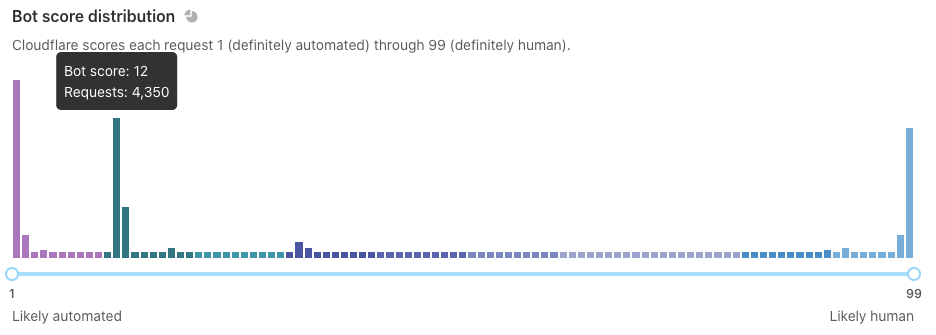
“Bot score distribution” is next. This shows similar data, but we display it horizontally without the notion of time. Use the slider below to filter on subsets of traffic and watch the rest of the page adapt.
We recommend that you use the slider to find your ideal bot threshold. In other words: what is the cutoff for suspicious traffic on your site? We generally consider traffic below 30 to be automated, but customers might choose to challenge traffic below 40 or block traffic below 10 (you can even do both!). You should set a threshold that is ambitious but not too aggressive. If your traffic looks like the example below, consider setting a threshold at a “drop off” point like 3 or 14. Why? Notice that the request density is very high near scores 1-2 and 12-13. Many of these requests will have similar characteristics, meaning that the scores immediately above them (3 and 14) offer some differentiating quality. These are the most promising places to segment your bot rules. Notably, not every graph is this pronounced.
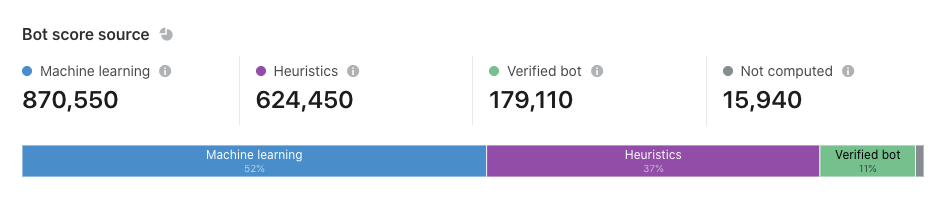
“Bot score source” sits lower on the page. Here, you can examine the detection engines that are responsible for scoring your traffic. If you can’t remember the purpose of each engine, simply hover over the tooltip to view a brief description. Customers may wonder why some requests are flagged as “not computed.” This commonly occurs when Cloudflare has issued an error page on your behalf. Perhaps a visitor’s request was met with a gateway timeout (error 504), in which case Cloudflare responded with a branded error page. The error page would not have warranted a challenge or a block, so we did not spend time calculating a bot score. We published another blog post that provides an overview of the most common sources, including machine learning and heuristics.
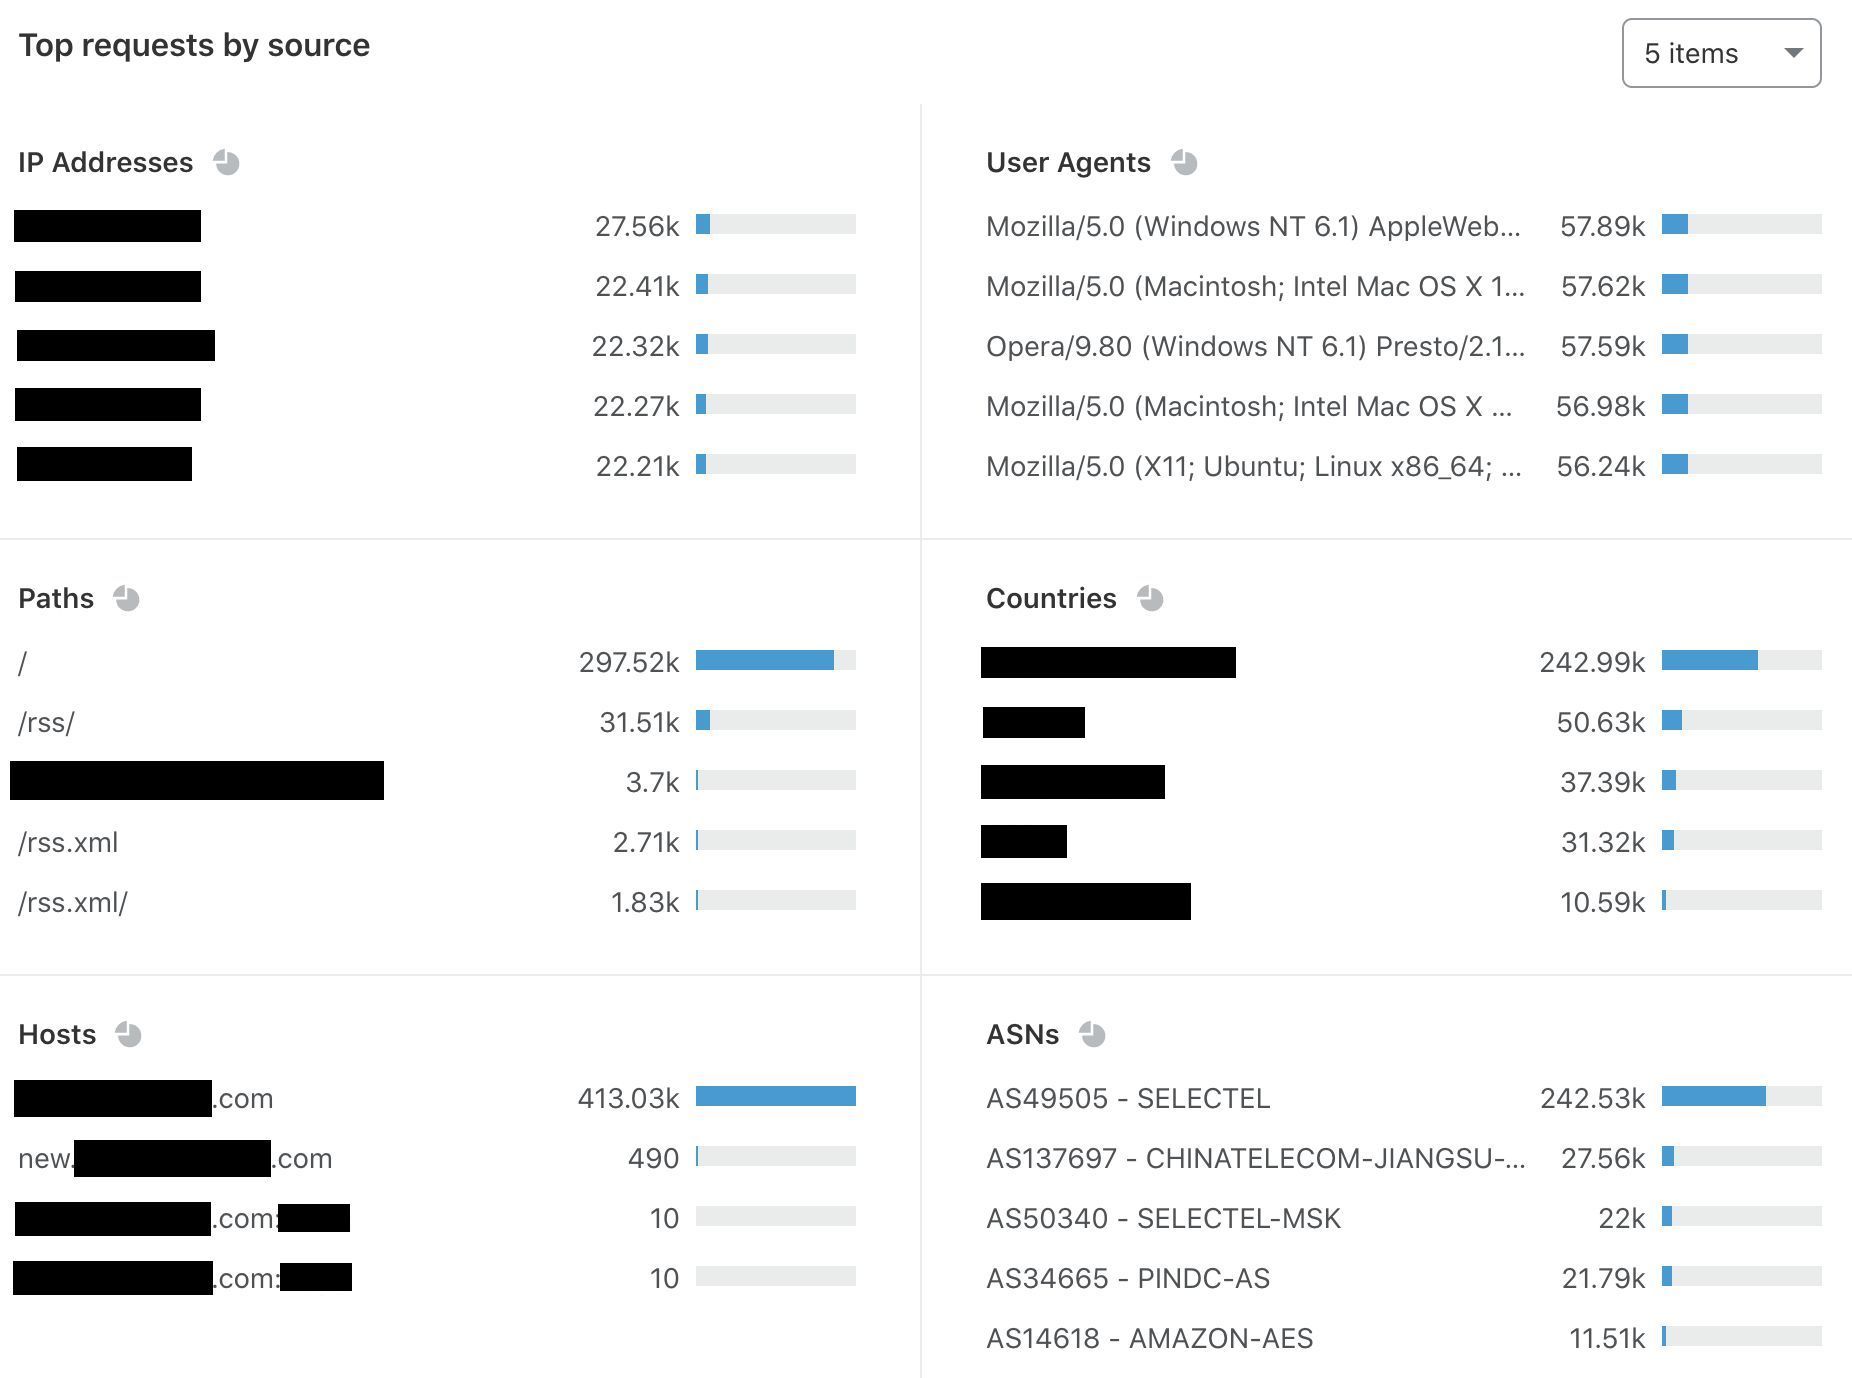
“Top requests by source” is the final section of Bot Analytics. Although it’s not quite as colorful as the sections above, this section grounds Bot Analytics in highly specific data. You can filter or exclude request attributes, including IP addresses, user agents, and ASNs. In the next section, we’ll use this to spot a bot attack.
Let’s Spot A Bot Attack!
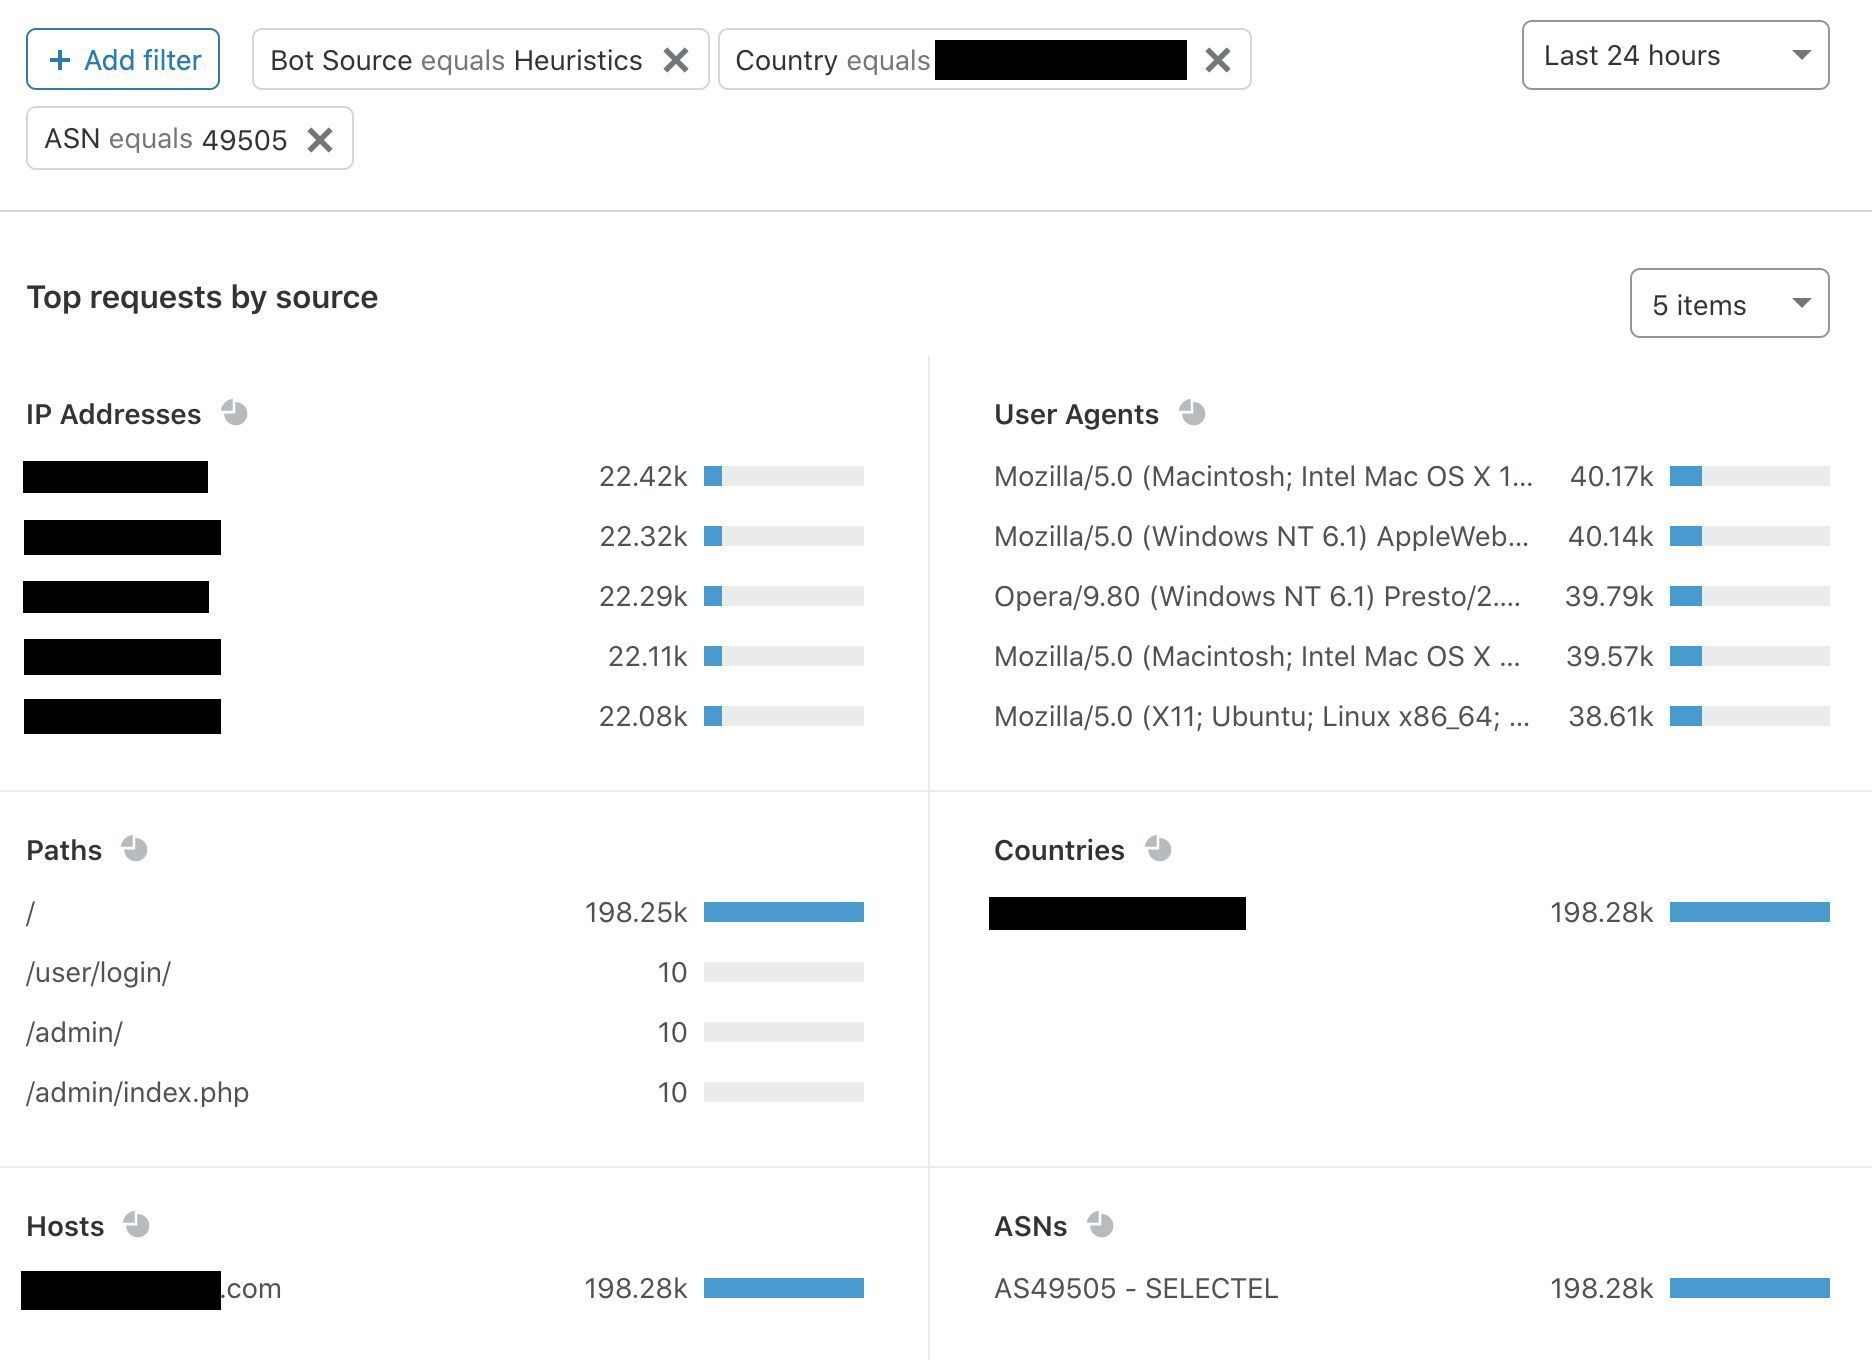
First, I’m going to use the “bot score source” tool to select the most obvious bot requests — those detected by our heuristics engine. This provides us with the following information, some of which has been redacted for privacy reasons:
I already suspect a correlation between a few of these attributes. First, the IP addresses all have very similar request counts. No human would access a site 22,000 times, and the uniformity across IPs 2-5 suggests foul play. Not surprisingly, the same pattern occurs for user agents on the right. User agents tell us about the browser and device associated with a particular request. When Bot Analytics shows this much uniformity and presents clear anomalies in country and ASN, I get suspicious (and you should too). I’m now going to filter on these anomalies to see if my instinct is right:
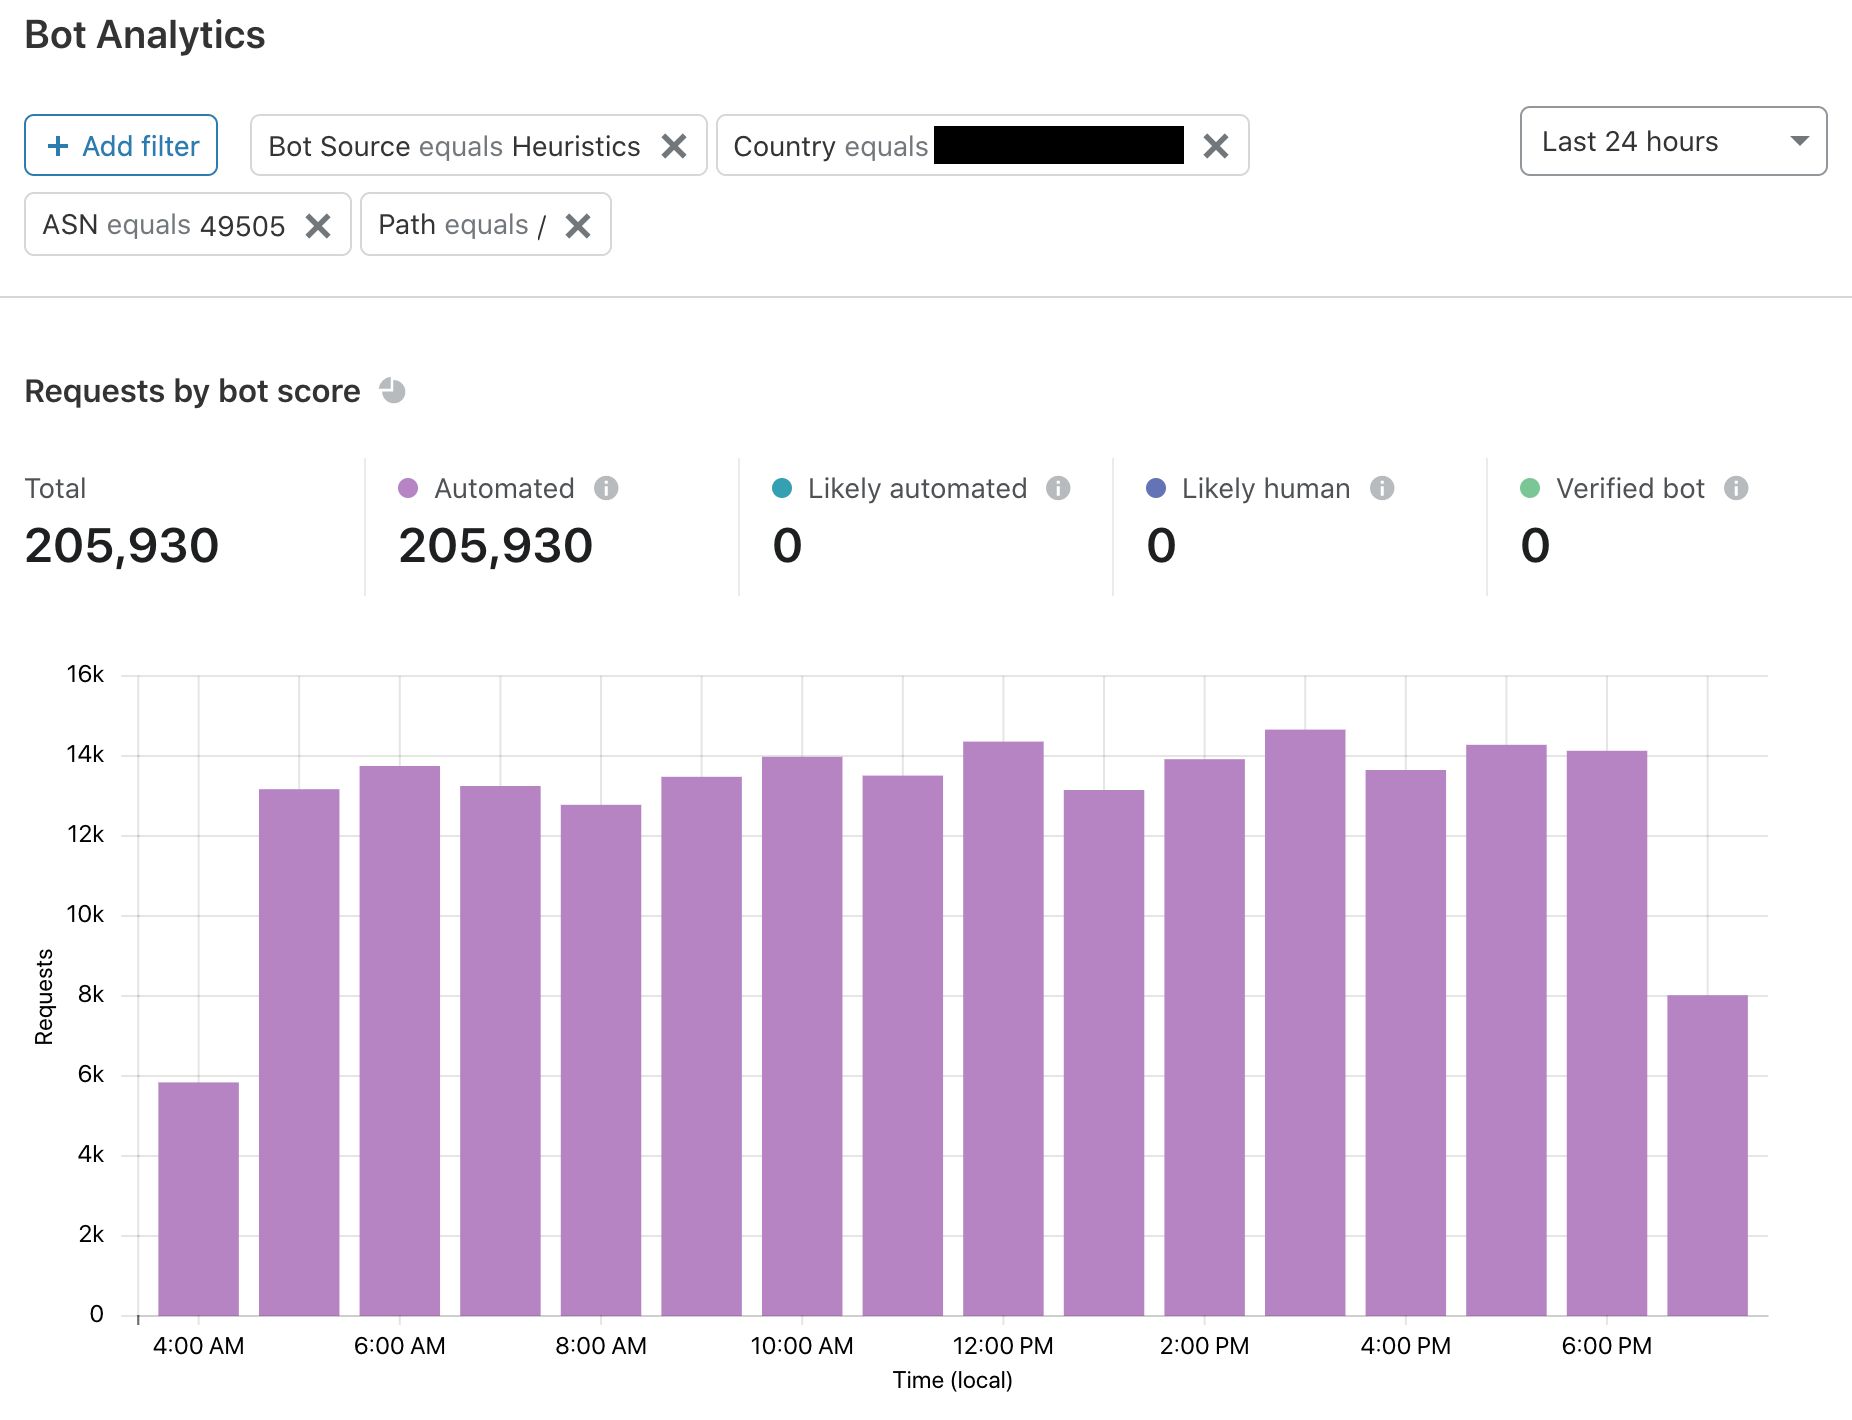
The trends hold true — to be sure, I briefly expanded the table and found nine separate IP addresses exhibiting the same behavior. This is likely an aggressive content scraper. Notably, it is not marked as a verified bot, so Bot Management issued the lowest possible score and flagged it as “automated.” At the top of Bot Analytics, I will narrow down the traffic and keep the time period at 24 hours:
The most severe attacks come and go. This traffic is clearly sustained, and my best guess is that someone is frequently scraping the homepage for content. This isn’t the most malicious of attacks, but content is still being taken. If I wanted to, I could set a firewall rule to target this bot score or any of the filters I used.
Try It Out
As a reminder, all Enterprise customers will be able to see a snapshot of their bot traffic. Even if you don’t have Bot Management for your site, visit the Firewall for some high-level insights that are updated in real time.
And for those of you with Bot Management — check out Bot Analytics! It’s live now, and we hope you’ll have fun using it. Keep your eyes open for new analytics features in the coming months.
Now that we’re a long way through 2020, let’s take a look at automated traffic, which makes up almost 40% of total Internet traffic.
This blog post is a high-level overview of bot traffic on Cloudflare’s network. Cloudflare offers a comprehensive Bot Management tool for Enterprise customers, along with an effective free tool called Bot Fight Mode. Because of the tremendous amount of traffic that flows through our network each day, Cloudflare is in a unique position to analyze global bot trends.
In this post, we will cover the basics of bot traffic and distinguish between automated requests and other human requests (What Is A Bot?). Then, we’ll move on to a global overview of bot traffic around the world (A RoboBird’s Eye View, A Bot Day and Bots All Over The World), and dive into North American traffic (A Look into North American Traffic). Lastly, we’ll finish with an overview of how the coronavirus pandemic affected global traffic, and we’ll take a deeper look at European traffic (Bots During COVID-19 In Europe).
On average, Cloudflare processes 18 million HTTP requests every second. This is a great opportunity to understand how bots shape the Internet, how much infrastructure is dedicated to these automated requests, and why our customers need a great bot management solution.
What Is A Bot?
Cloudflare groups traffic into four bot-related categories:
Our goal is to stop malicious and unwanted bots from harming our customers, while giving customers the opportunity to control how other automated traffic is managed.
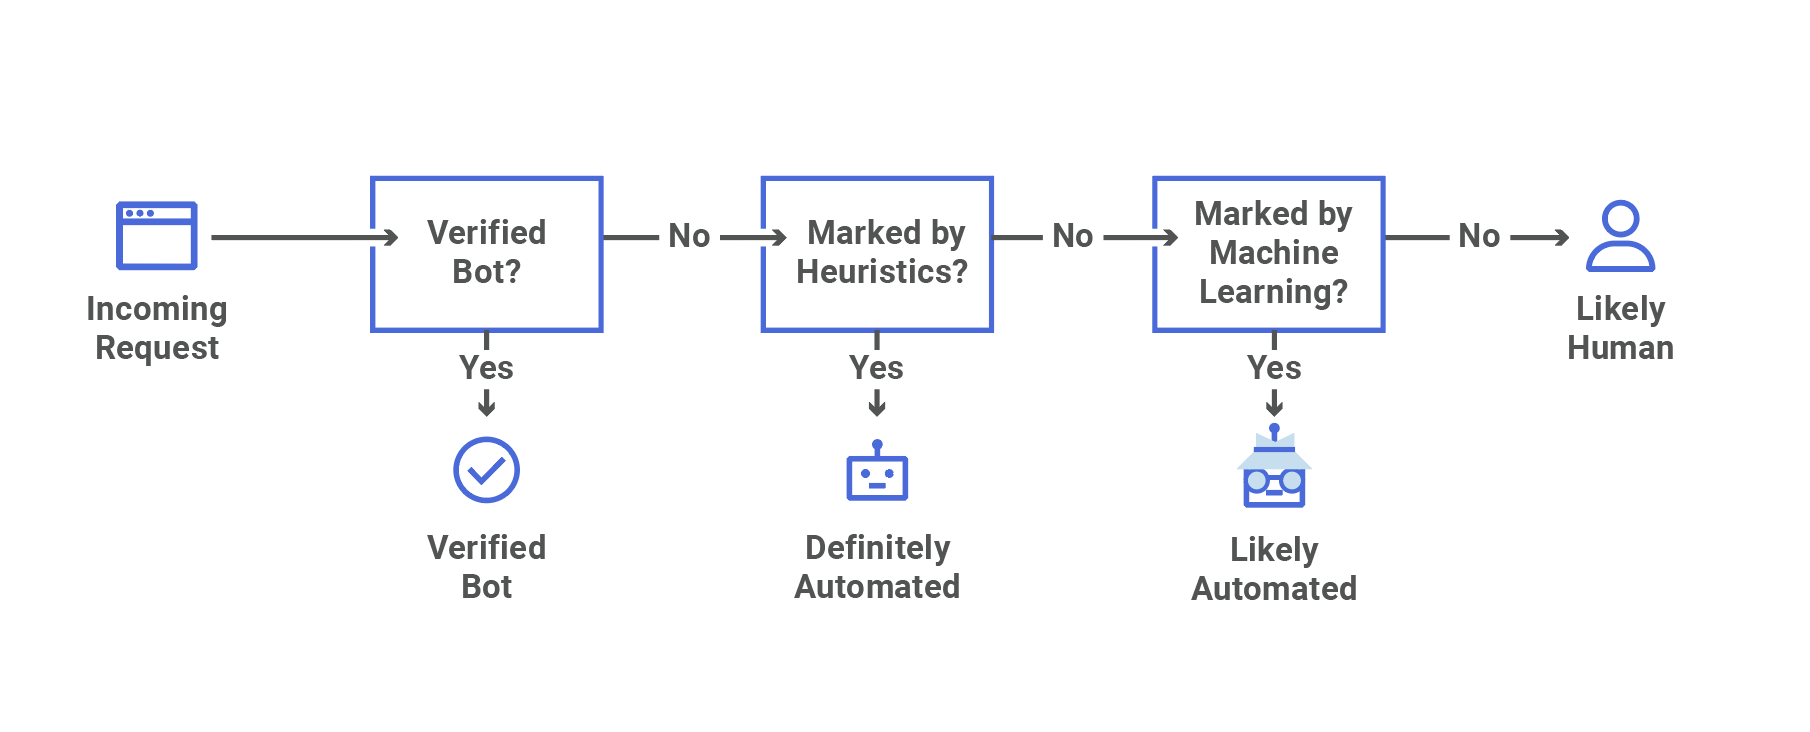
We label each request that comes into Cloudflare with a “bot score” 1 through 99, where a lower score means that a request probably came from a bot. A higher score means that a request probably came from a human. This score is available in our Firewall, logs, and Workers, giving customers the flexibility to act on any score.
Cloudflare also maintains a challenge platform that customers can choose to deploy on suspected bots. You’ll recognize these as CAPTCHA challenges or JavaScript challenges. In fact, having the score available in Firewall Rules means that customers can take any action they choose. This platform can be used for mitigation, ensuring that unwanted traffic is stopped in its tracks.
To learn more about how Bot Management interacts with our firewall, check out our support page.
We track successes and failures during these challenges, which ultimately allows us to improve our detection systems. Assuming that our challenges are solvable by humans, effective detections should have low solve rates, given that they are usually presented to bots.
Verified bots are registered in an internal verified bot directory. These good bots power search engines and monitoring tools. Good bots enable our customers’ web pages to be found by search engines, for example.
For known non-verified bots (such as a scraper using a simple curl library), we keep a similar directory that is managed by our heuristics engine. If not otherwise verified, we consider requests caught by this engine to be definitely automated.
Our machine learning engine provides another way to identify potential bots. This engine identifies requests with a high probability of automation and marks them as likely automated. This detection mechanism benefits from models built on data from our global network.
If a request is not marked as automated, we mark it as likely human and pass along the bot score from our machine learning system.
We also have a behavioral analysis engine and a JavaScript detections engine. You can learn more about these systems by checking out Alex Bocharov’s previous post on Cloudflare Bot Management.
The two bot definitions for automated traffic are somewhat complementary. Requests caught by heuristic detections will not count towards machine learning detections. Requests that are reliably caught by our machine learning detections won’t need to be registered in our known heuristics bot directory. Because of this, we combine these two together when we discuss “automated traffic” in general.
A RoboBird’s Eye View
Data from this piece comes from information about Cloudflare’s customers, analyzed between January 15, 2020 and July 31, 2020.
First, let’s get a basic understanding of the traffic on our network.
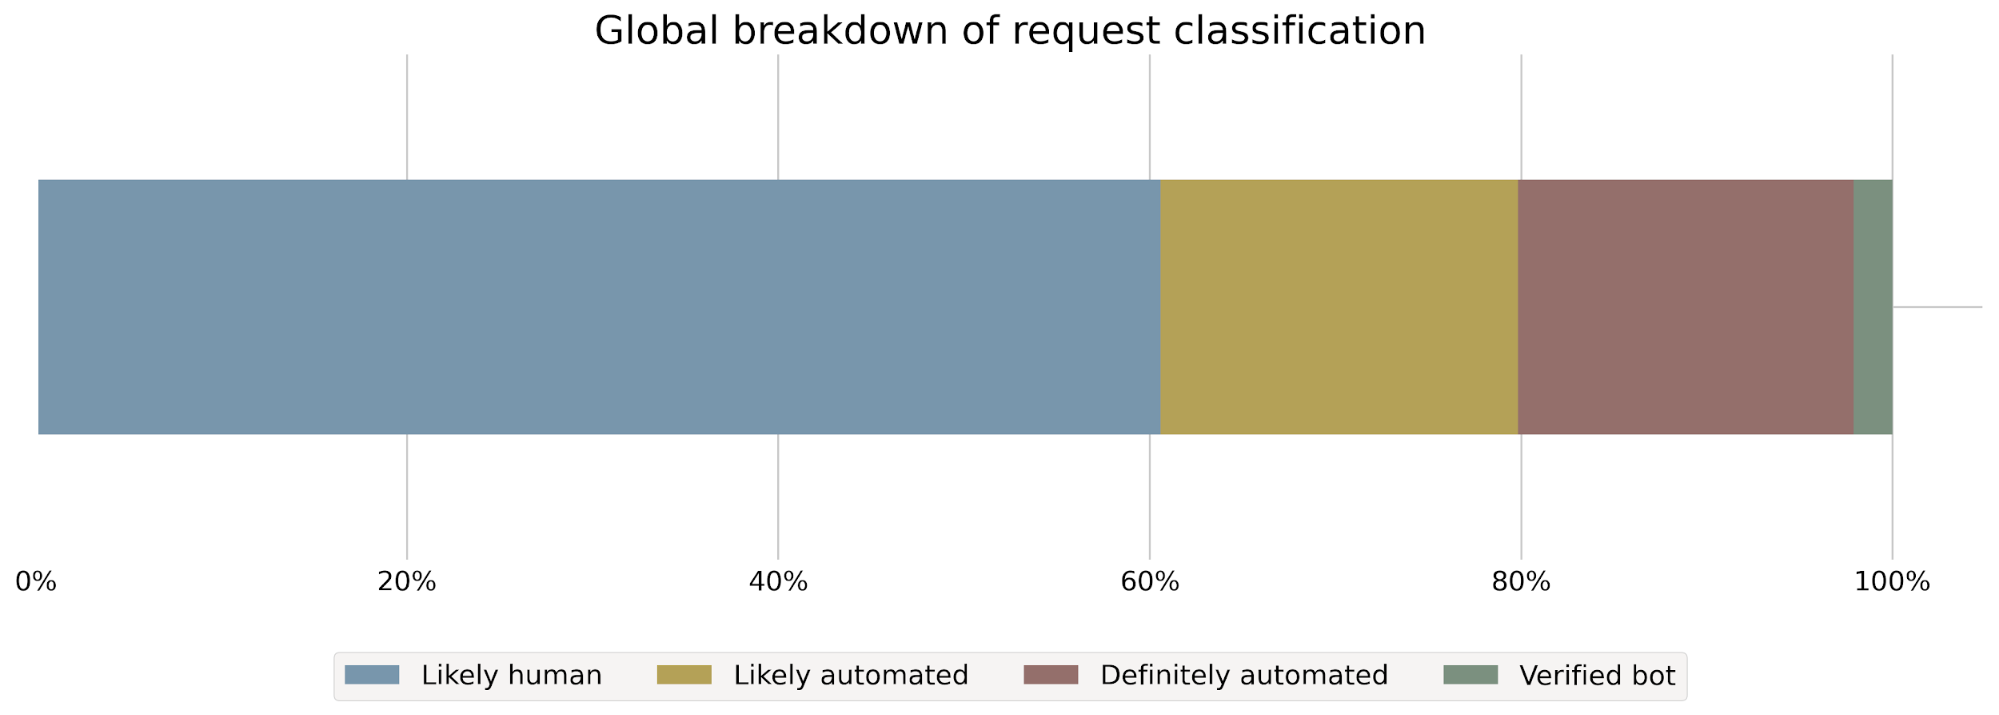
Figure 1.1 Traffic type on Cloudflare’s network.
Figure 1.1 has a global breakdown regarding classification; 60.6% of traffic is likely human, 19.3% is likely automated, 18.1% is definitely automated and only 2.1% is from verified bots. In total, 39.5% of requests we score come from some kind of bot.
A Bot Day
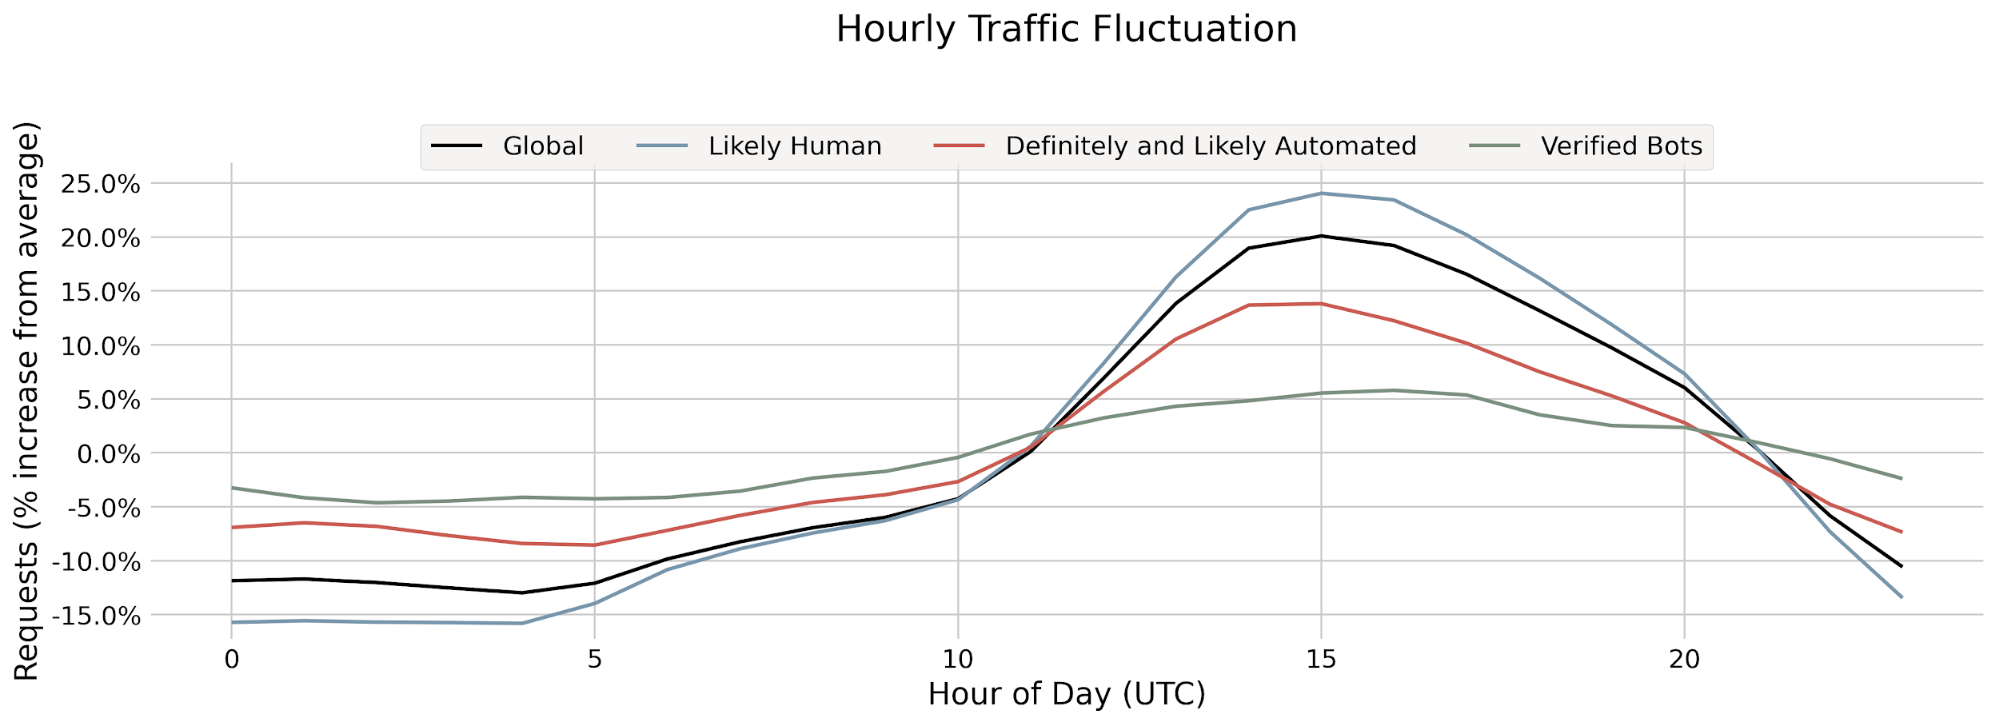
Regular traffic fluctuates throughout the day. Do bots follow suit? Let’s check. Figure 2.1 represents traffic deviation from the average hourly traffic. An increase of 10% would mean that the hour is 10% busier than the average hour (measuring requests per hour). We include the total overall traffic in this chart to serve as a comparison to other types of traffic.
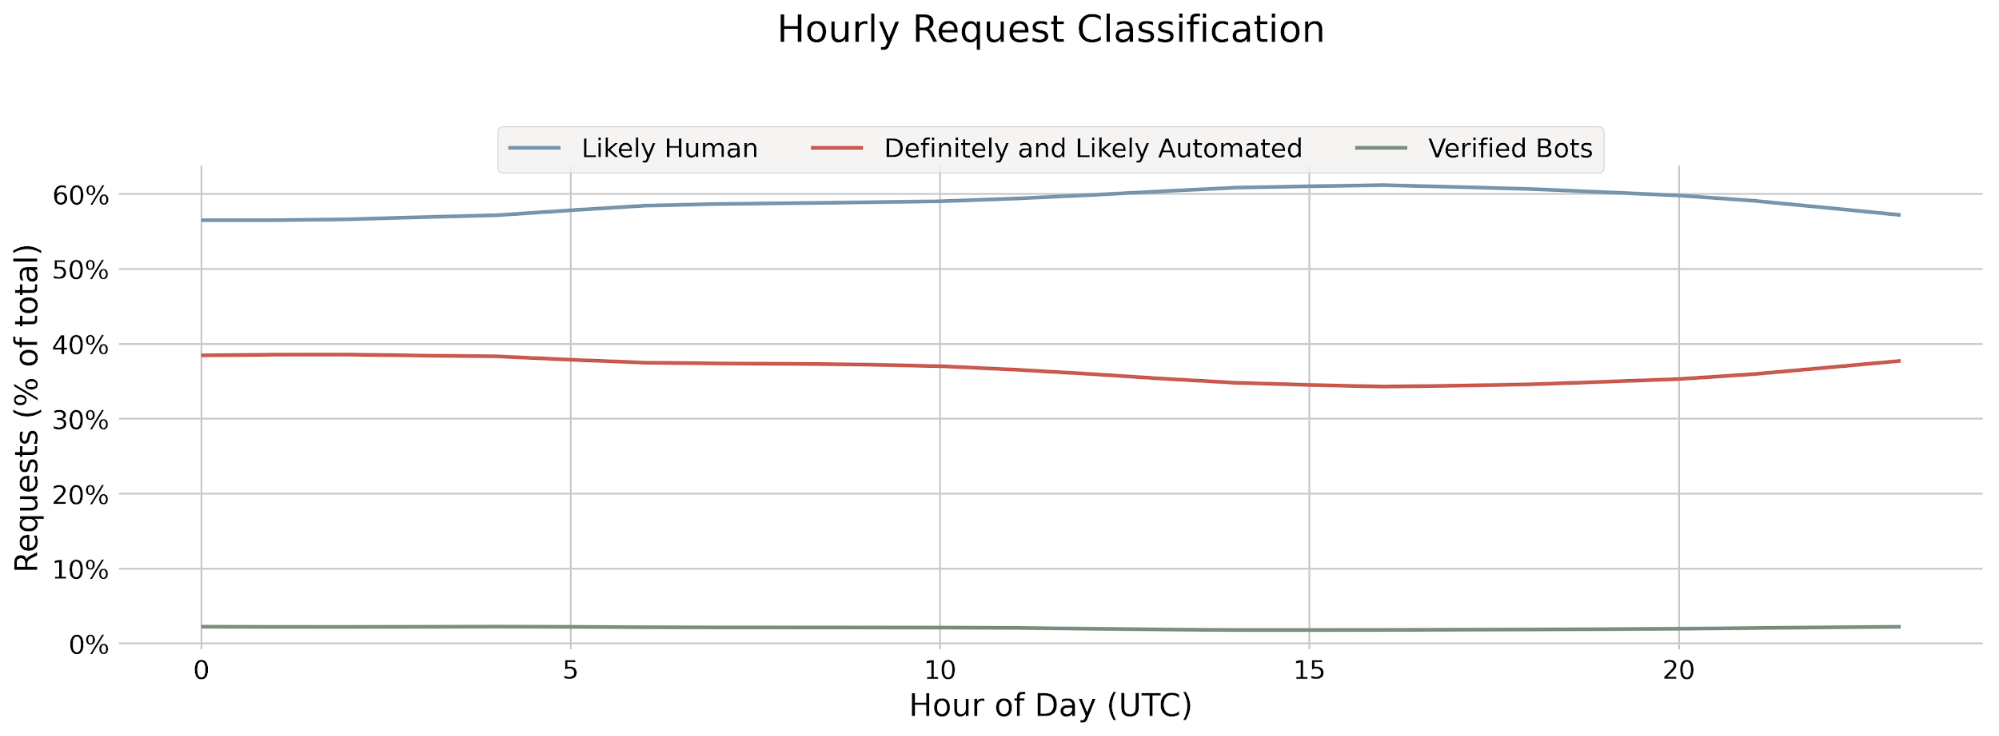
Figure 2.1 Hourly traffic as a deviation from the average hour.Figure 2.2 Bot classification over an average day.
We can clearly see a difference between human traffic and bot traffic. Human traffic varies heavily, but predictably, throughout the day. We can see a 15% decrease in human traffic early in the day, between midnight and 05:00 UTC, corresponding to the end of business hours in the Americas, and up to a 25% increase during business hours, 14:00 to 17:00 UTC, where traffic is highest. Conversely, bot traffic is more consistent. Slow hours still see a smaller drop than overall traffic, and busy hours are less busy. The difference between good and bad bots is also apparent: good bots are even more consistent, with small fluctuations in hourly traffic.
But why would this happen? A large portion of bots, good and bad, perform the same task across the Internet. Bad bots may be scraping websites or looking to infect unprotected machines, and they will do this with little intervention from human operators. Good bots could be doing some of these operations, but less frequently and in a more targeted fashion. A good bot scraping a website may be doing so to add it to a search engine, while a bad bot will do the same thing at a much higher rate, for other reasons.
A lot of bots follow business hours. For example, sneaker bots—focused on nabbing exclusive items from sneaker stores—will naturally be active when new products launch.
This difference in volume does not mean that our classifications are affected: our scores remain consistent throughout the day, as Figure 2.1 shows.
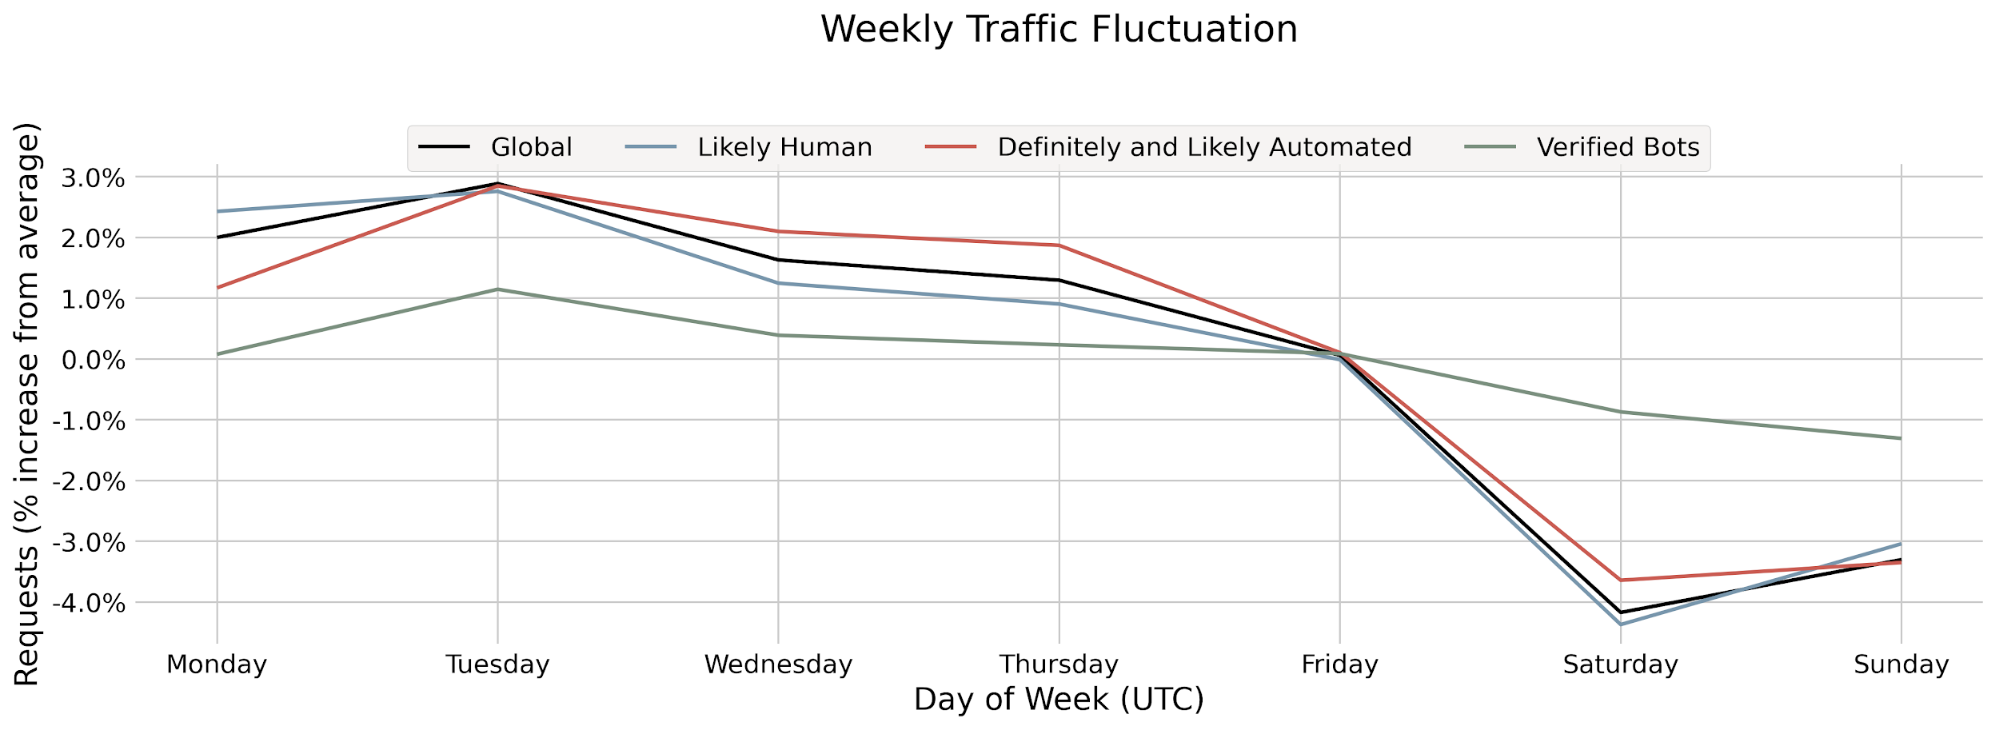
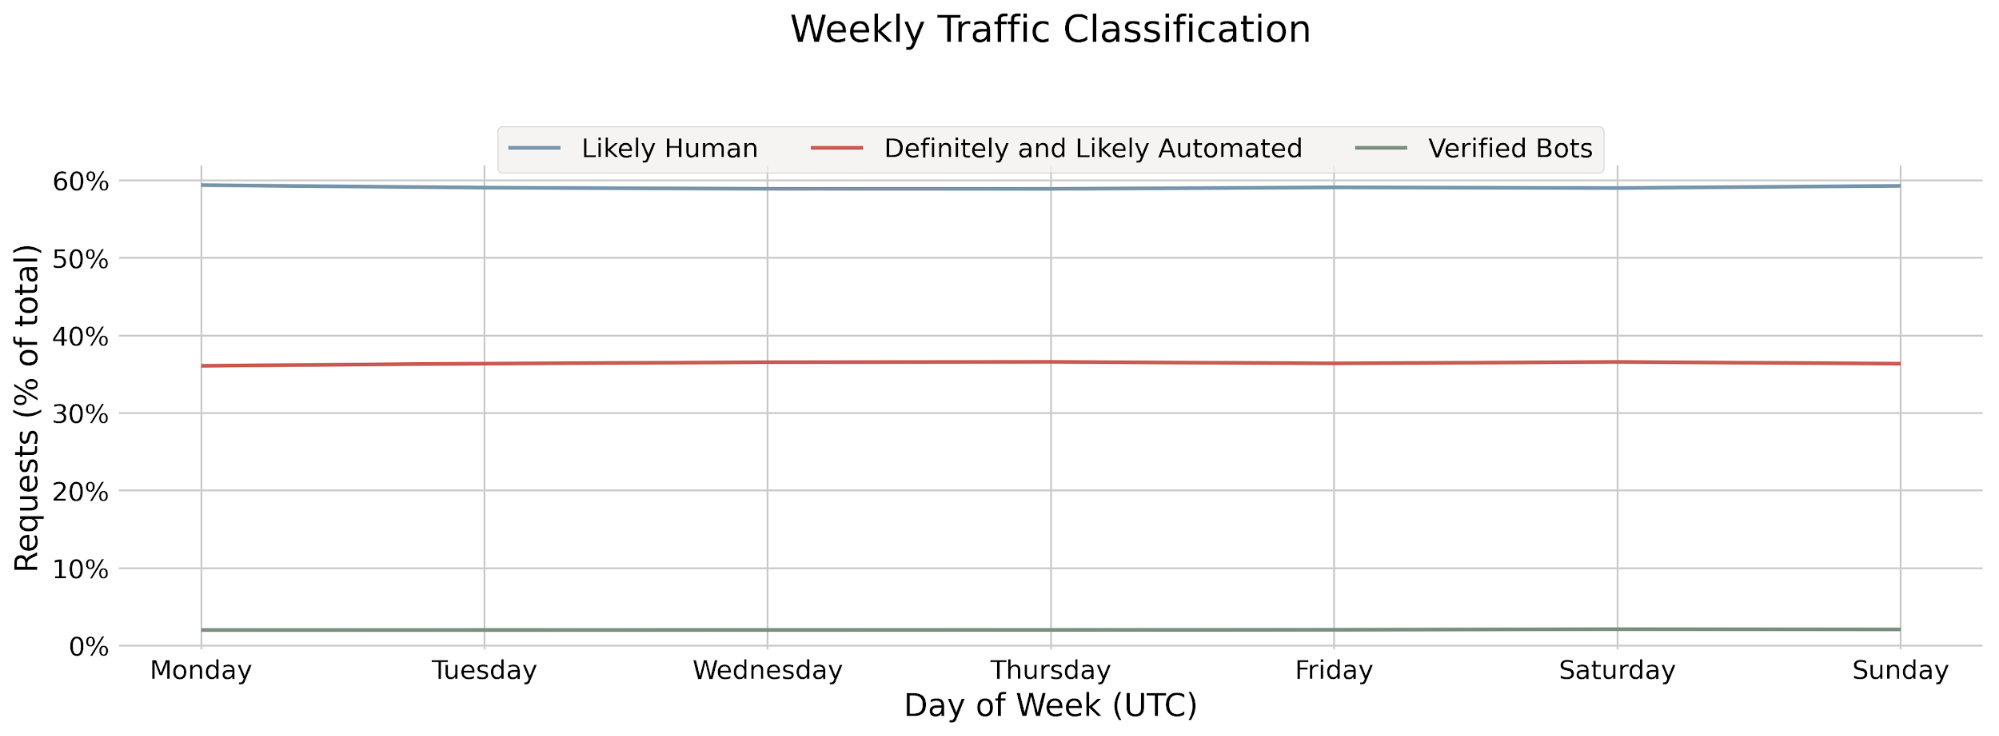
Figure 2.3 Daily traffic as a deviation from the average day. Grouped by day of week.Figure 2.4 Bot classification over an average week.
We can also see that good bots don’t take weekends off. Weekdays and weekends have fairly marked differences for most traffic, but good bots keep a consistent schedule. Whereas a typical weekday is slightly above average, we can see a drop of about 4% in overall traffic. This does not fully apply to verified bots, which only see a small 1% drop in traffic.
Bots All Over The World
Now that we’ve taken a look at global traffic, let’s dig a little deeper.
Different regions have distinct traffic landscapes regarding automated traffic.
Figure 3.1Traffic type by region.
Figure 3.1 breaks down traffic by region, letting us peek into where each type of traffic comes from. North America stands out as a major automated traffic source; over 50% of definitely automated traffic comes from there, and they also contribute almost 80% of all verified bot traffic. Europe makes up the second largest chunk of traffic, followed by Asia.
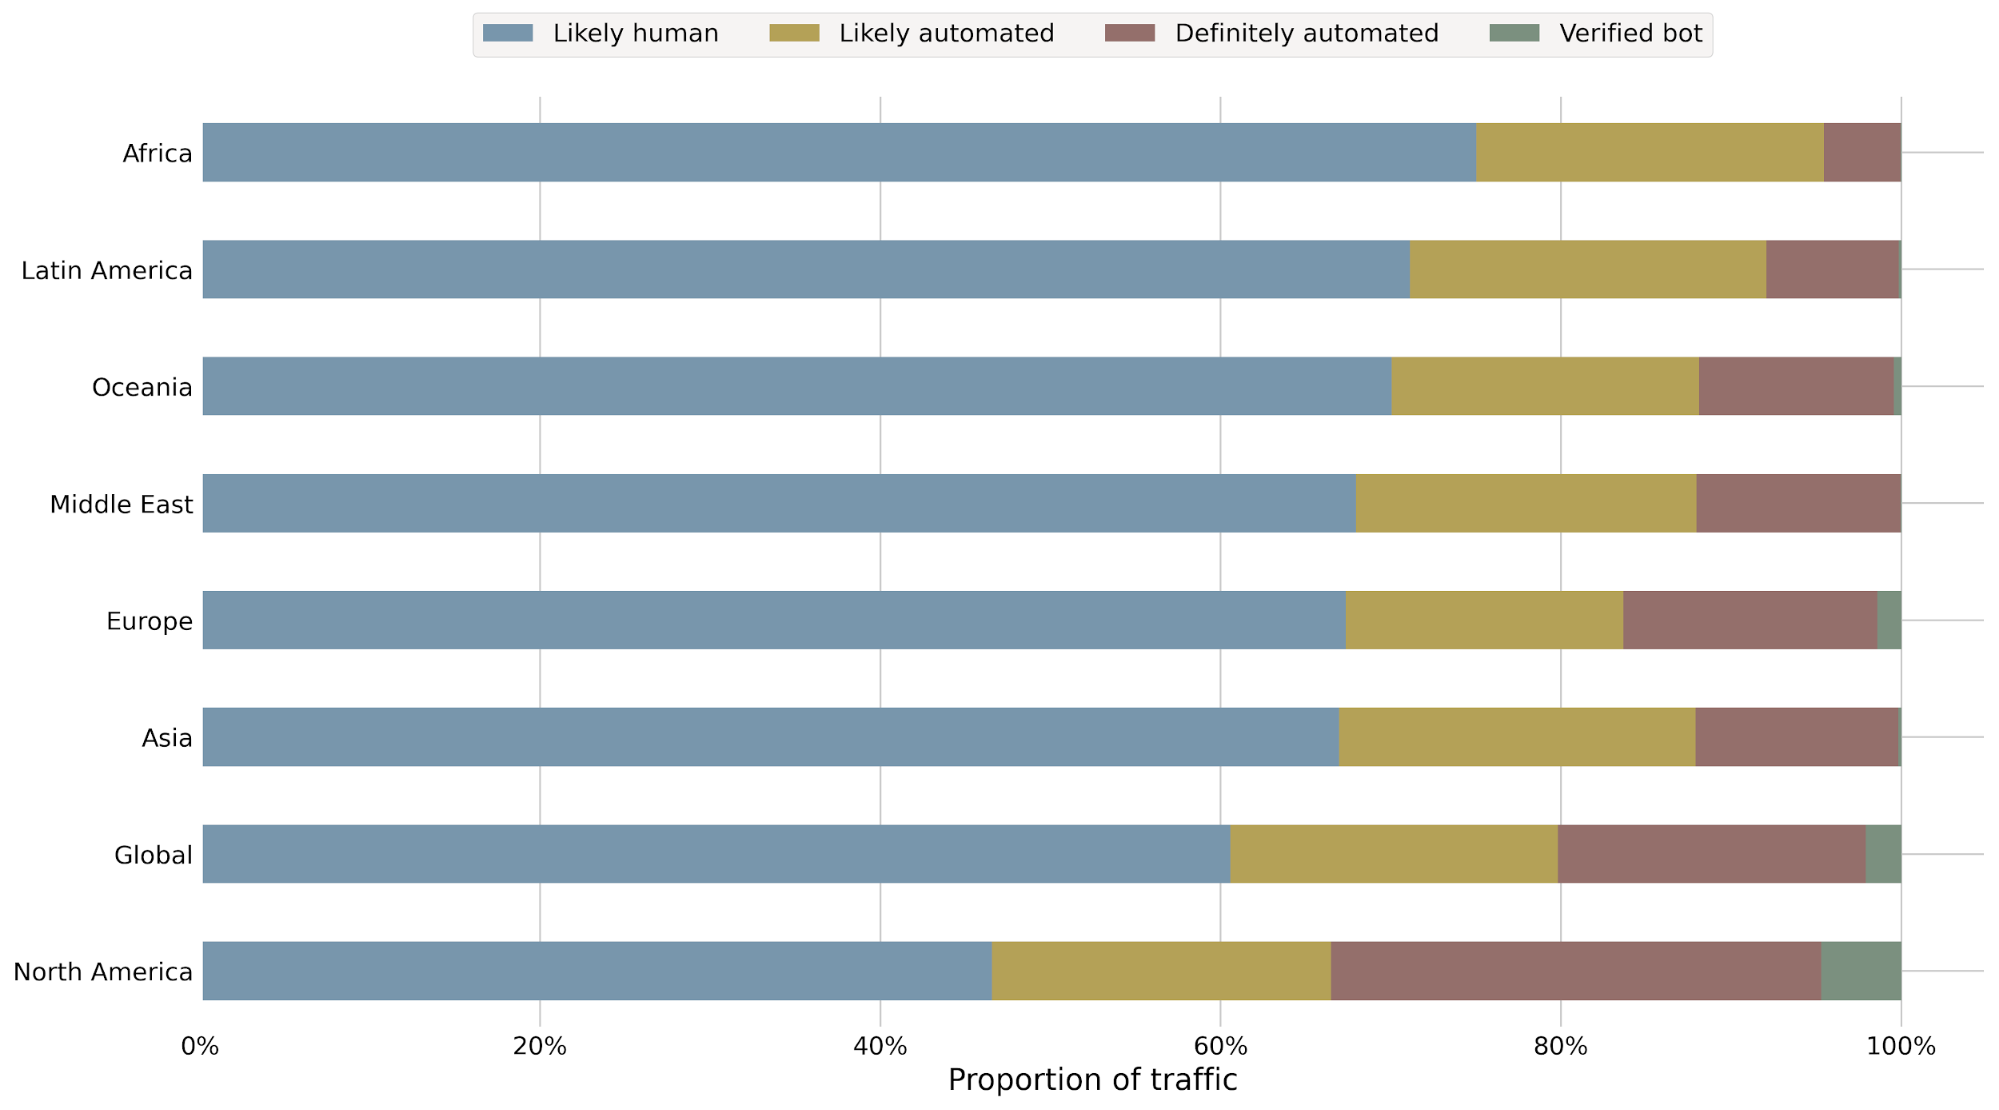
Figure 3.2 Traffic classification within each region.
Looking at regional breakdown of traffic in Figure 3.2, we can see just how much North American traffic is automated, well above the global average.
A Look into North American Traffic
As the largest source of automated traffic, North America deserves a closer look.
First, we’ll start with a breakdown of each country.
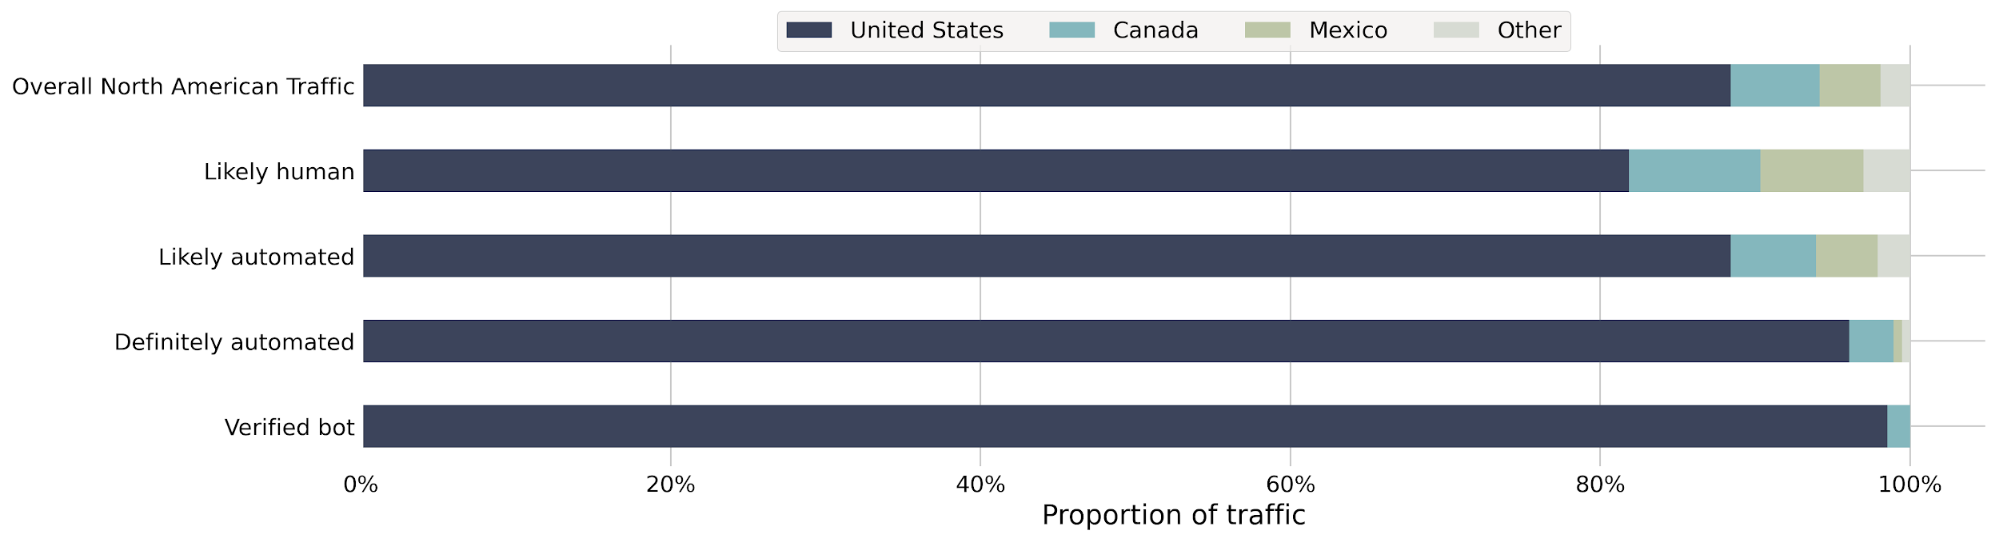
Figure 3.3 Percentage of traffic within North America.
Most of our requests in North America come from just three countries—the United States, Canada and Mexico. These account for 98% of all requests from North America, 97% of all requests from likely human sources and 100% of requests from verified bots. The United States alone accounts for 88% of total requests, 82% of requests from likely human sources, 96% of requests from definitely automated sources, 88% of requests from likely automated traffic sources and 98% of requests from verified bot.
However, this alone does not mean that the United States has an unusual amount of activity. These countries have a combined population of roughly 497 million people. The United States accounts for 66.5% of that, Mexico 25.9% and Canada 7.6%. With this context, we can see that the United States is overrepresented in terms of raw requests, but underrepresented in terms of how much of that traffic is likely to be human. Conversely, Canadian traffic is more likely to be human.
Let’s take another look at each country.
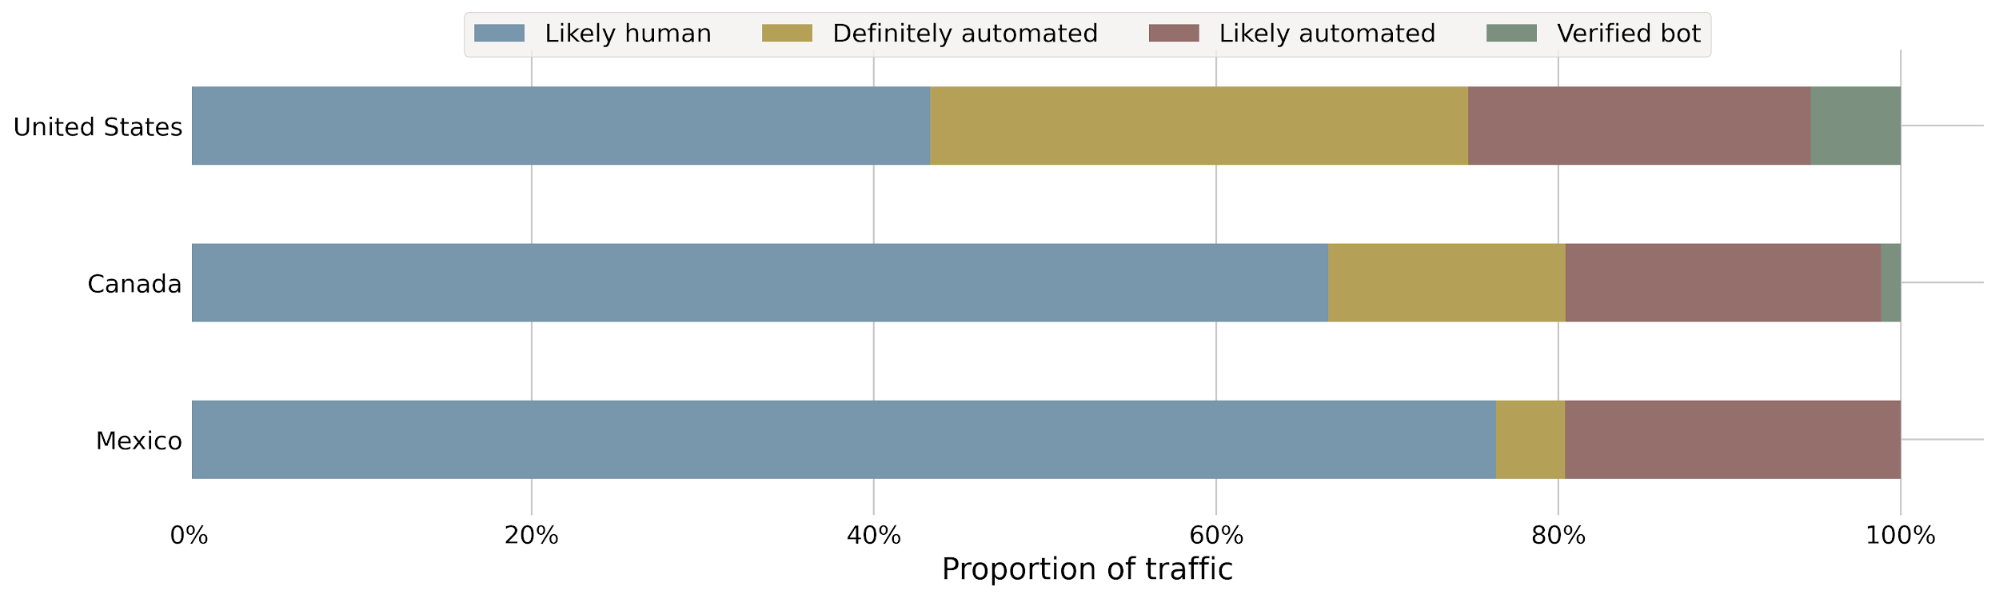
Figure 3.4 Percentage of traffic within each country.
Over half of the traffic from the United States is automated in some way, which is a clear departure from trends in Mexico and Canada.
American Bots
So far, we’ve seen how much the United States contributes to automated traffic. If we want to go deeper, a good place to start is by understanding how these bots get online. We can do this by examining the networks from which the traffic originates. Networks are identified by Autonomous System Numbers, or ASNs. These form the backbone of the Internet infrastructure.
Think of these as Internet Service Providers, but facing inward towards the network instead of outward towards end consumers. ISPs like Comcast and Verizon are examples of residential ASNs, where we expect mostly human traffic. Cloud providers such as Google and Amazon are also ASNs, but targeted towards cloud services. We expect most of these requests to be automated in some way.
Looking at traffic on the ASN level is important because we can identify cloud-based traffic, or traffic using residential proxies, among others.
Let’s take a look at which ASNs are associated with visitors in the United States. We’ll restrict ourselves to “eyeball” traffic, which is the term we use for requests coming from site visitors.
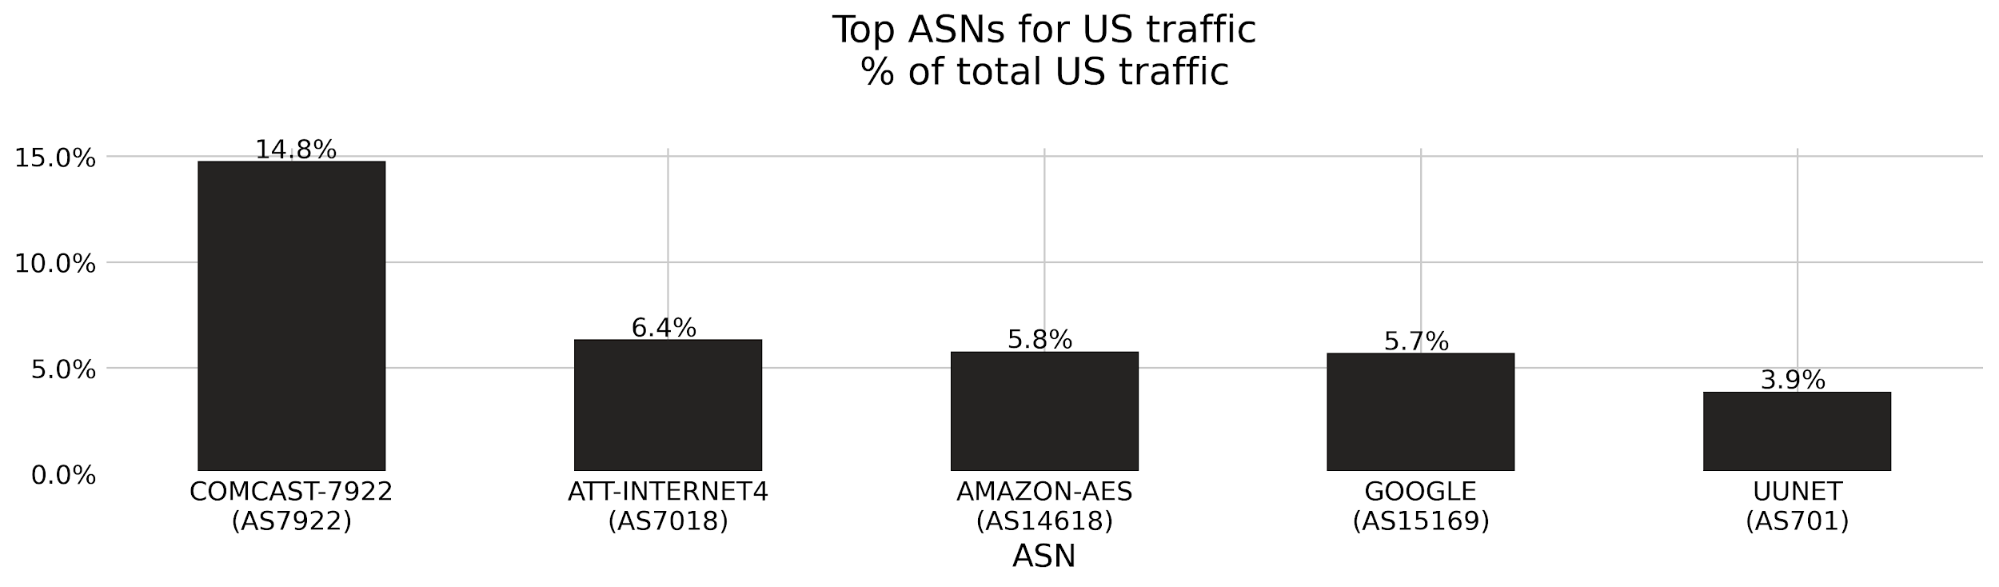
Figure 4.1 Top ASN in the United States.
From figure 4.1 we can clearly see the impact that cloud services have on traffic; 11.5% of all eyeball traffic comes from Amazon and Google.
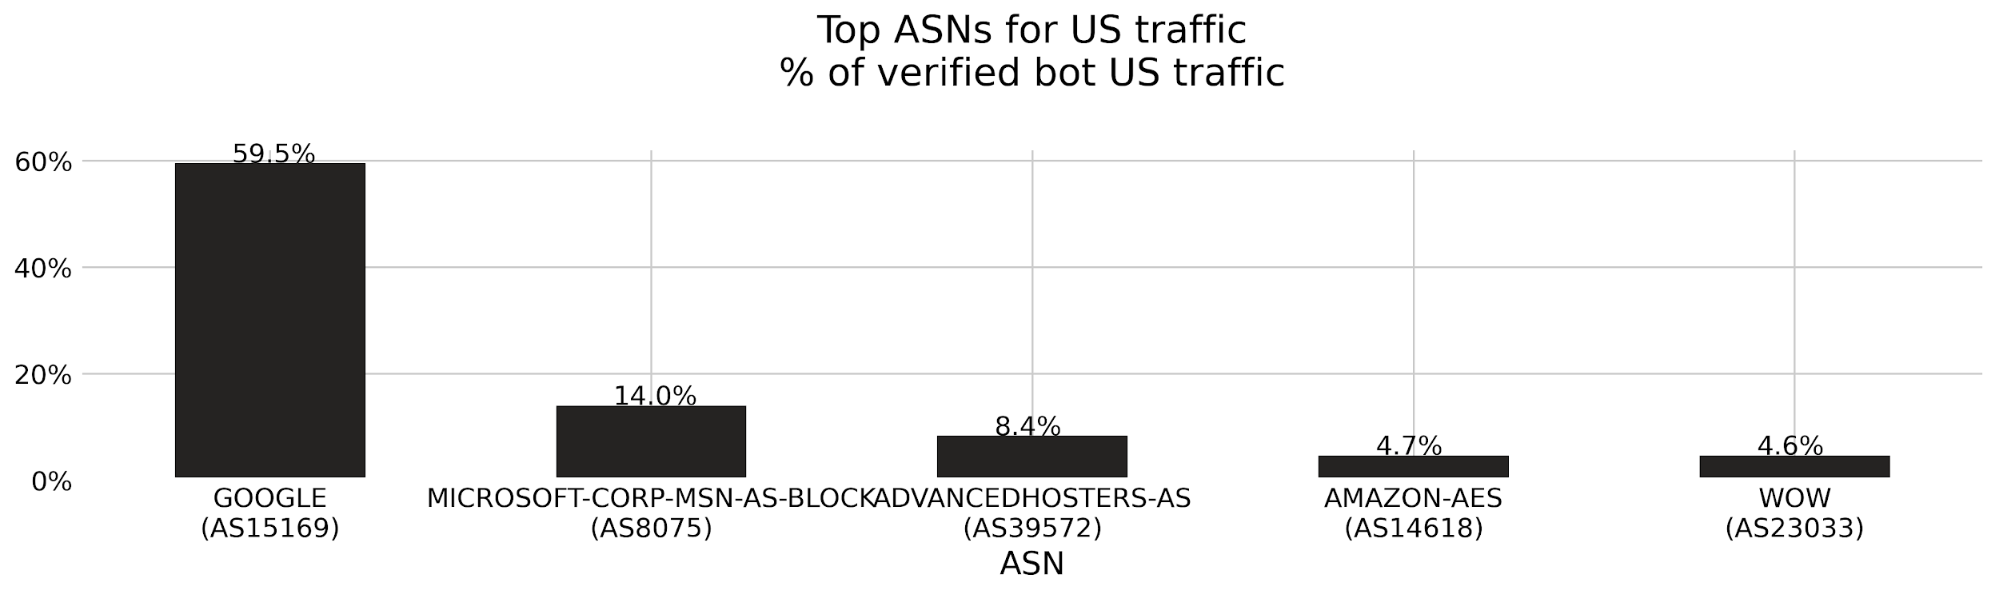
Figure 4.2 Top ASN in the United States for verified bot traffic.
Verified bots operate in a different landscape, coming from cloud providers such as Amazon, Google, Microsoft, Advanced Hosting and Wowrack.
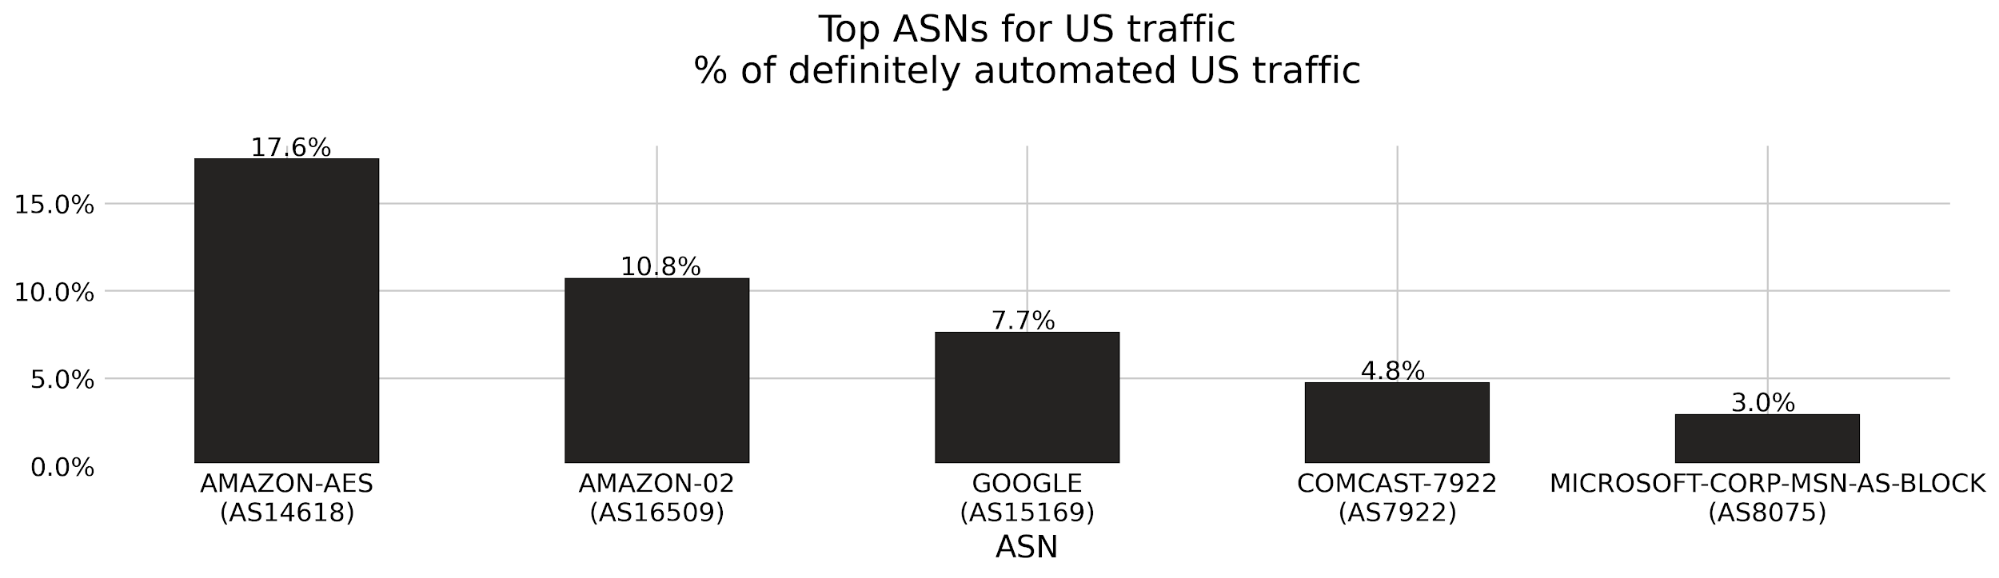
Figure 4.3 Top ASN in the United States for likely and definitely automated traffic.
Automated traffic has a variety of ASNs. Cloud providers such as Amazon, Google and Microsoft make up the 30% of automated traffic. Comcast also makes up a significant portion of traffic at 4.8%, indicating that some bots come from residential services.
Bots During COVID-19 In Europe
Lockdowns and limits on public events came as a consequence of the ongoing coronavirus pandemic. Many people have been working from home, and even those who do not have this option are using the Internet in new ways. Overall, this has meant that Cloudflare’s network has grown tremendously.
But how does this impact bot traffic? First let’s get an idea of how it impacted traffic in general. Countries were impacted by the virus at different times, so we expect to see differences, right?
Figure 5.1Total traffic across all regions.
Figure 5.1 has just the traffic increase. Globally, we are seeing an average increase of 10%, while North America saw an increase of over 40% compared to the beginning of the year. Some regions did not change much, such as Africa and Asia, while others, such as Europe saw an increased period, but has since normalized to previous levels.
Let’s look at a few countries, so we can understand what this looks like.
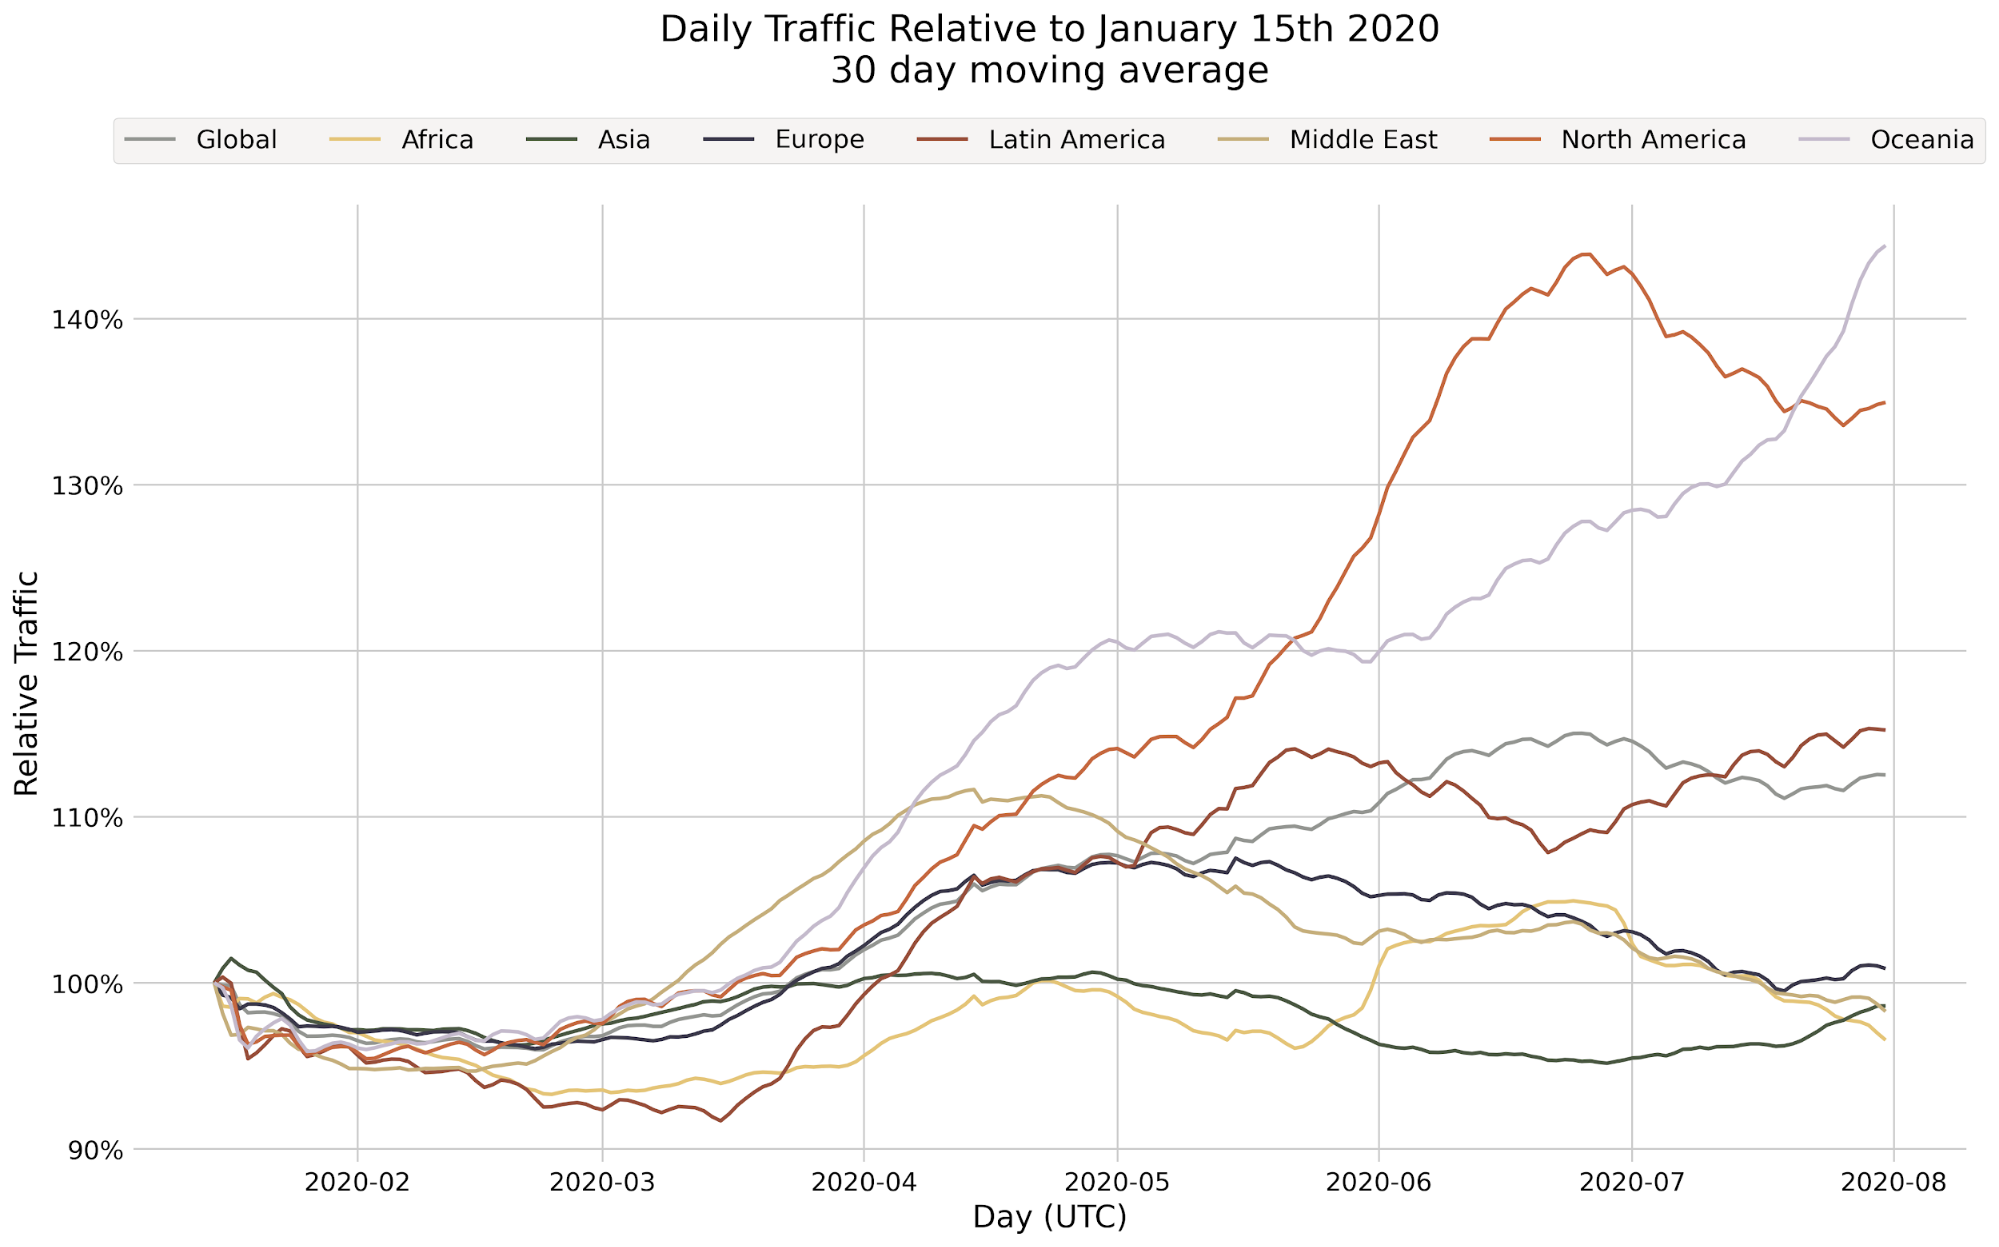
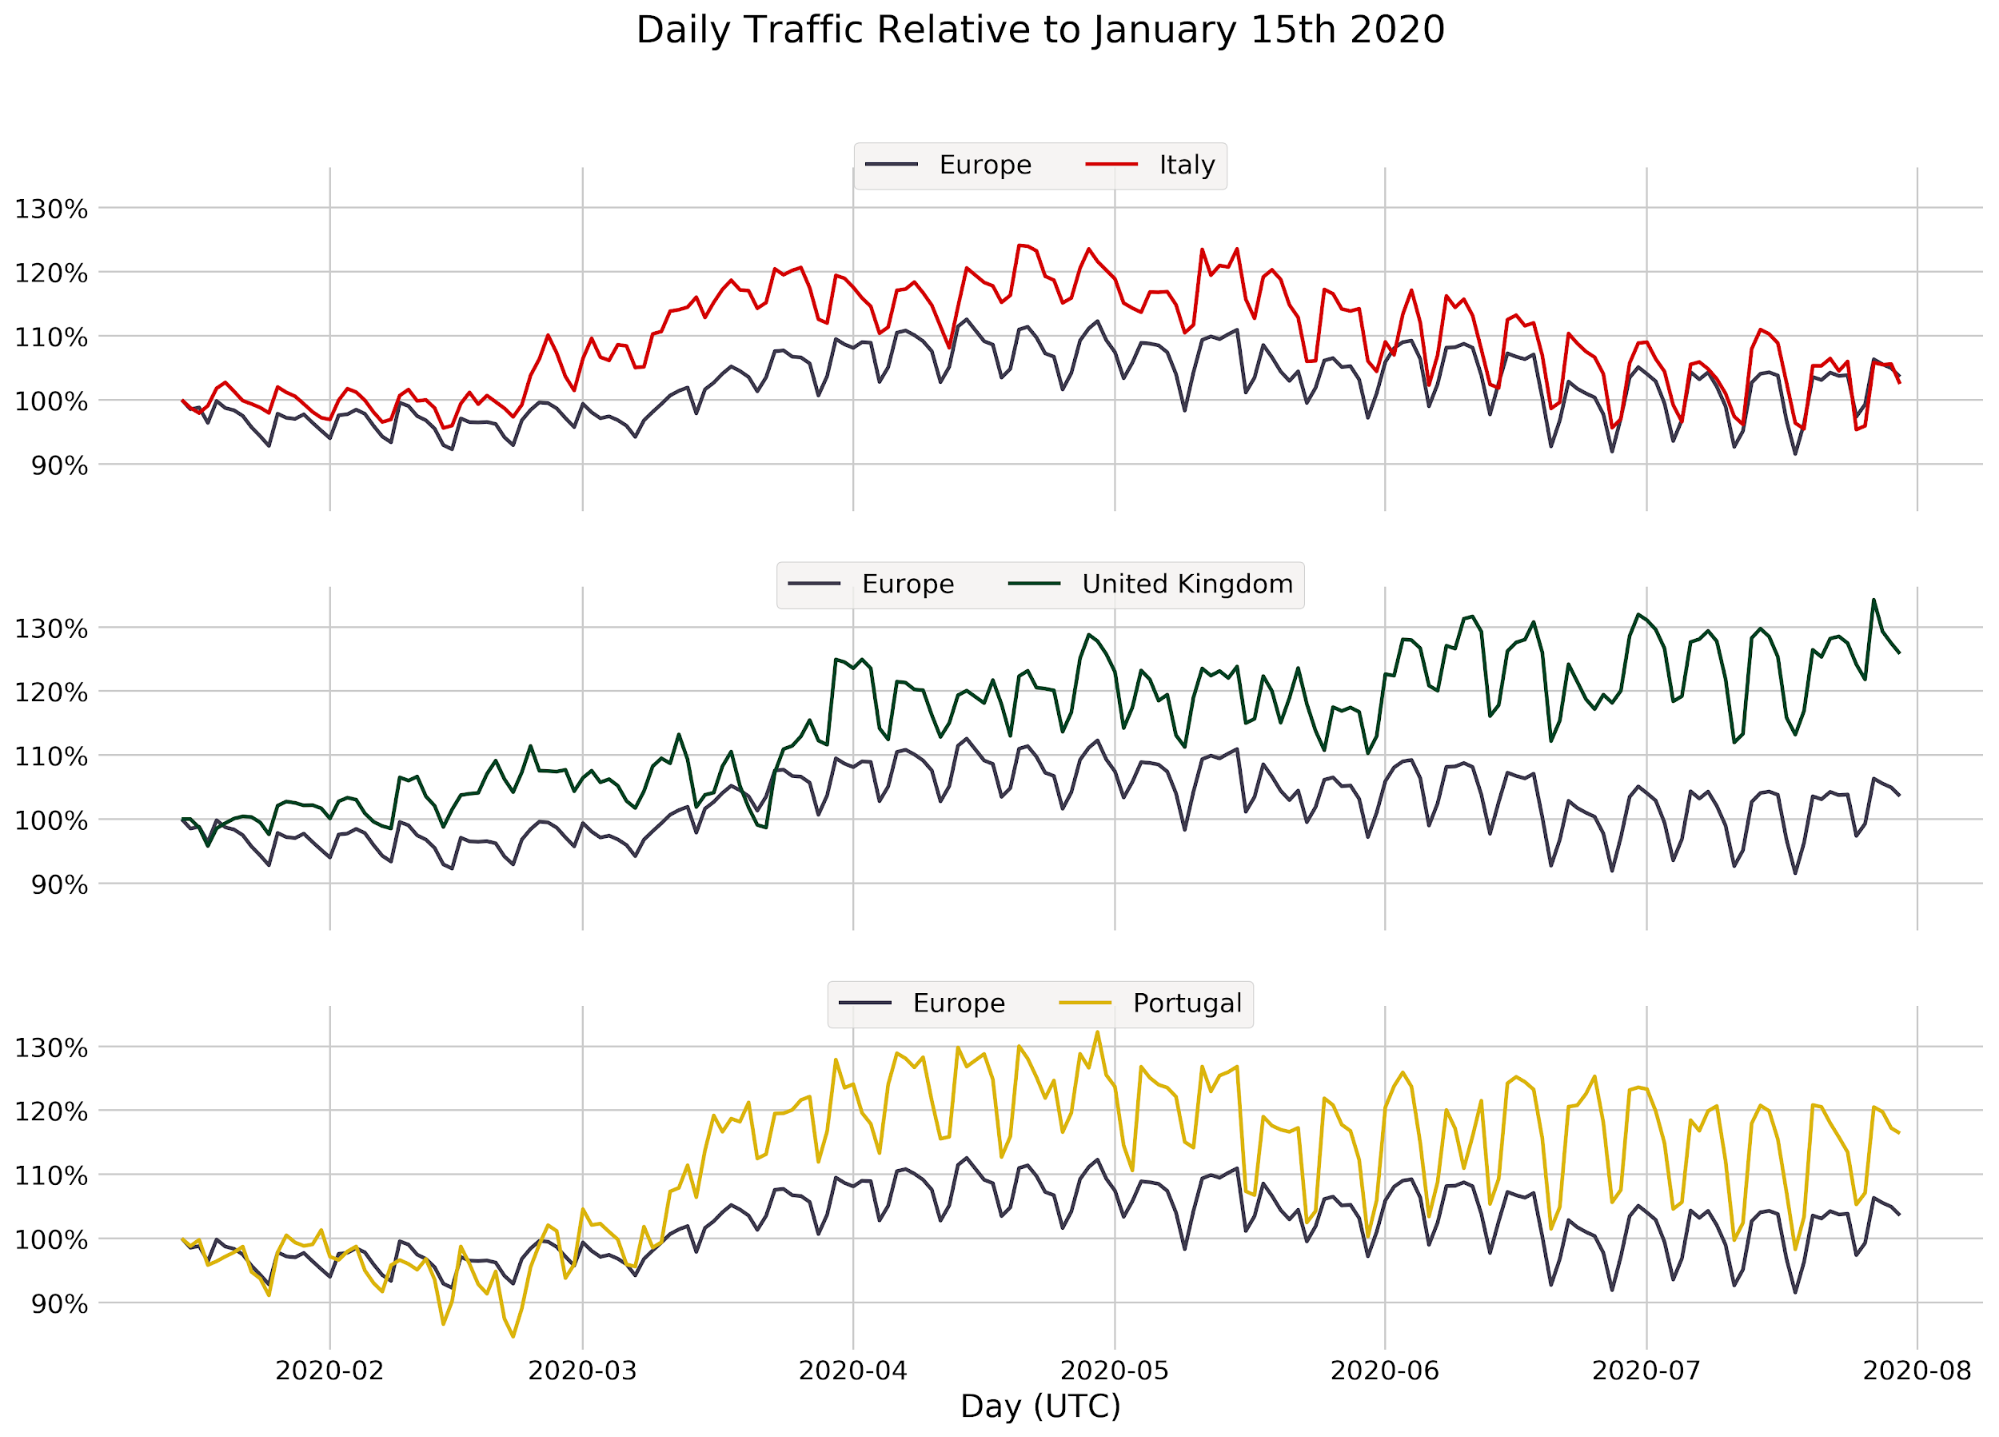
Figure 5.2 Daily traffic evolution for Italy, the United Kingdom and Portugal, overlaid with Europe.
Figure 5.2 shows daily traffic relative to January 15, when data collection started. For comparison, we have overall European traffic, and three selected countries: Italy, the United Kingdom and Portugal. Italy was picked because it was one of the first countries in Europe to face the worst of the coronavirus and enact lockdown measures. The United Kingdom took another strategy, with an initial focus on herd immunity, and enacted measures later than the others. Portugal is somewhere in between, locking down later than Italy, in slightly different circumstances.
At the beginning of the year, traffic kept stable and fluctuations kept in line with the European average. As lockdown measures began, traffic increased. Italy was first out of these countries, rising a few weeks before the others, and keeping well above average. Eventually, all countries saw a growth in traffic, followed by a stabilization. Italy seems to have adjusted to a normal, with its growth in line with the European average. Portugal has also stabilized, but with busier weekdays. Conversely, the United Kingdom showed no signs of stopping, exceeding a growth of 40% compared to the beginning of the year.
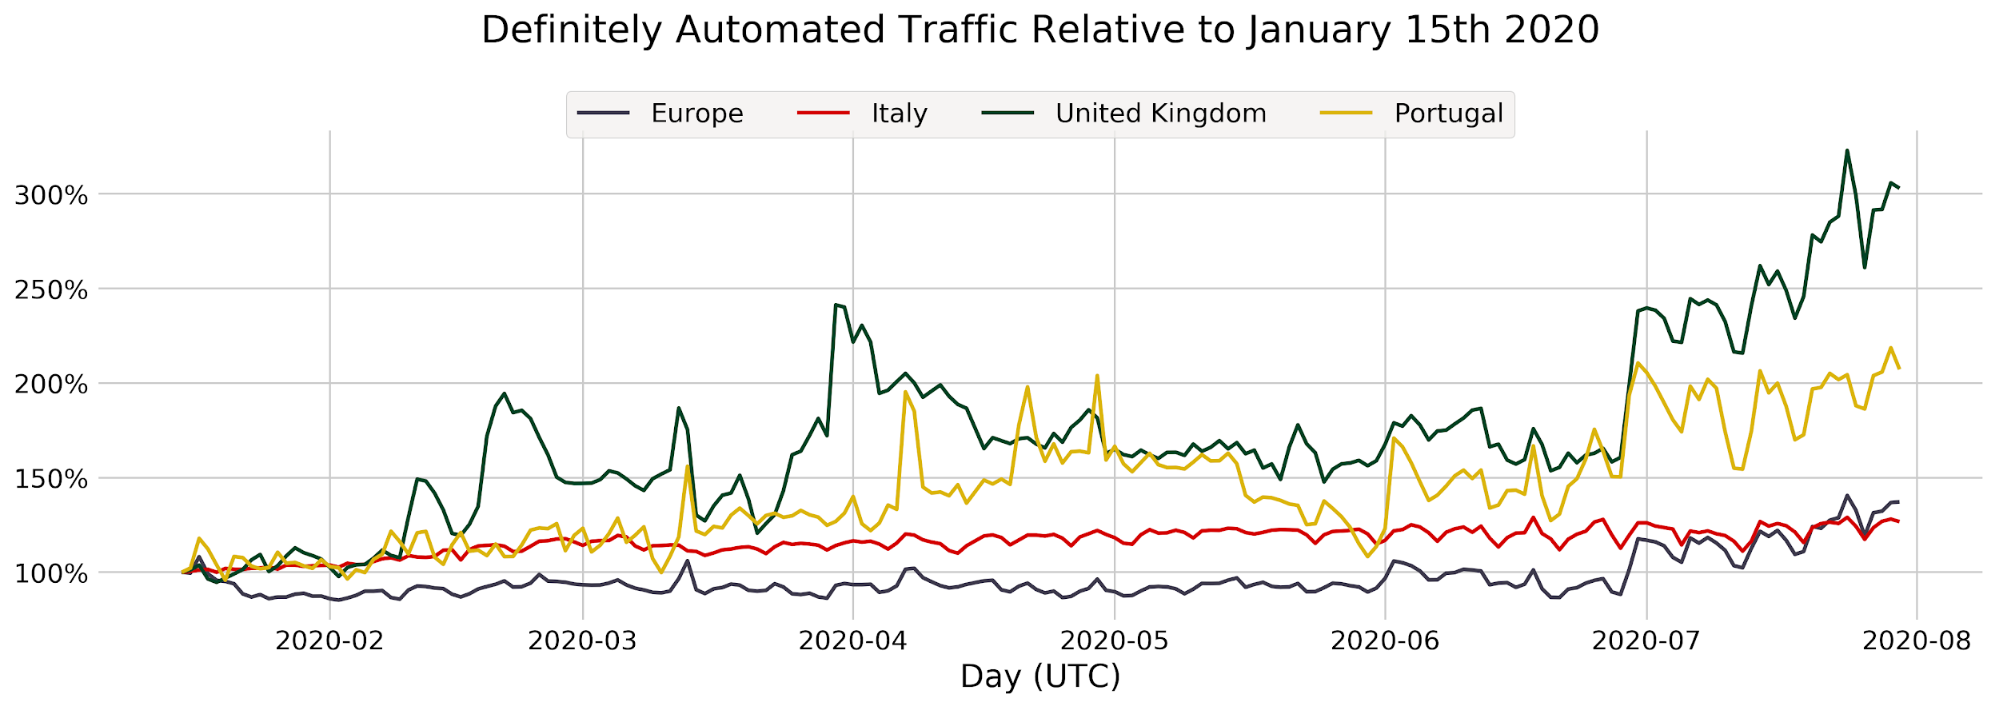
Figure 5.3 Daily definitely automated traffic evolution for Italy, the United Kingdom and Portugal, overlaid with Europe.
Definitely automated traffic did not have that much of a pronounced variation. Italian traffic kept steady throughout, and Portugal had a rather large increase. The biggest one, however, was the United Kingdom, which tripled its initial count.
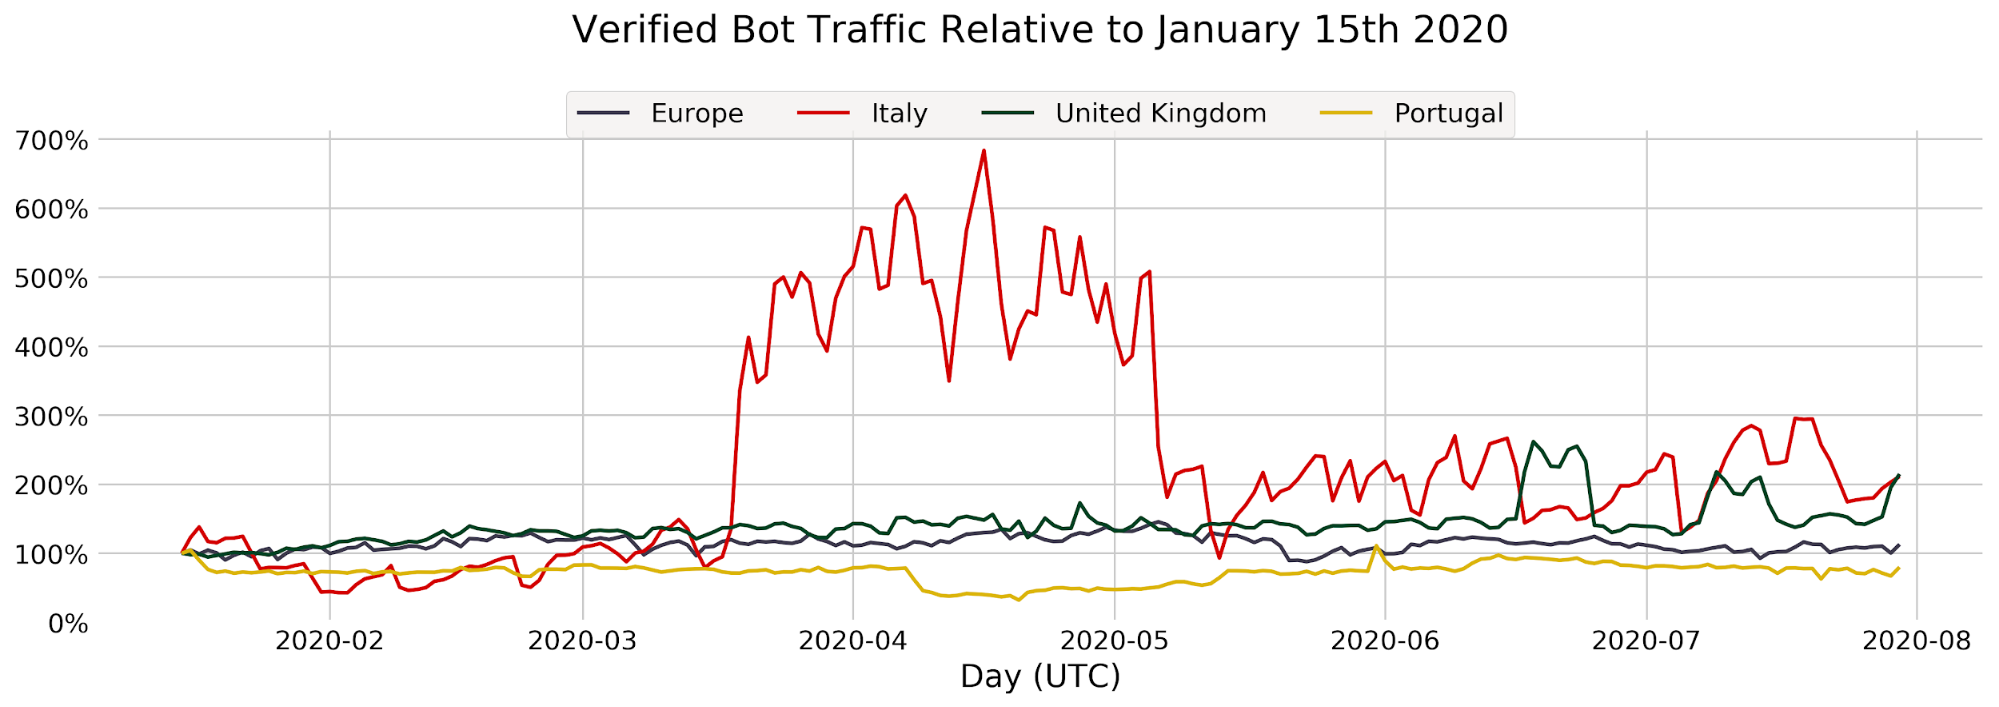
Figure 5.4 Verified bot traffic evolution for Italy, the United Kingdom and Portugal, overlaid with Europe.
Verified bot traffic is steady, except in Italy, with a massive increase between March and May. What could be the cause of this? Are these a few zones, getting a massive number of requests?
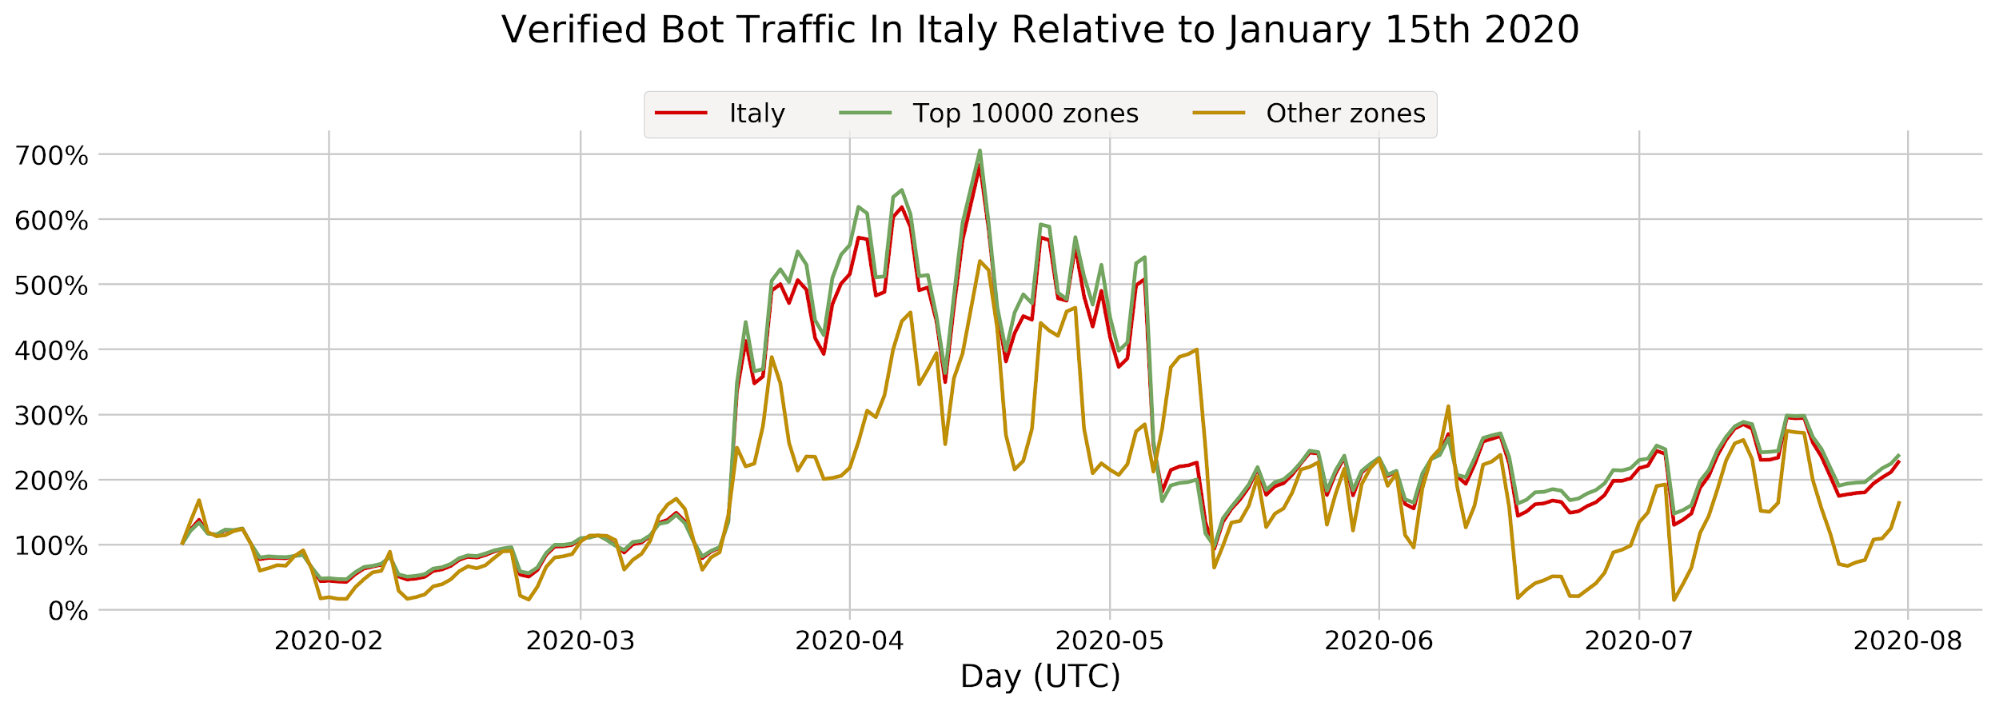
Figure 5.5 Verified bot traffic in Italy for the top 10 000 zones, relative to January 15th 2020.
Well, no. If we only examine the top 10,000 zones (by total verified bot requests), we can still see a massive increase in traffic for other zones. So, what’s happening?
Let’s look at user agents. We can separate the top 10 user agents during the bump, and see how they evolve over time.
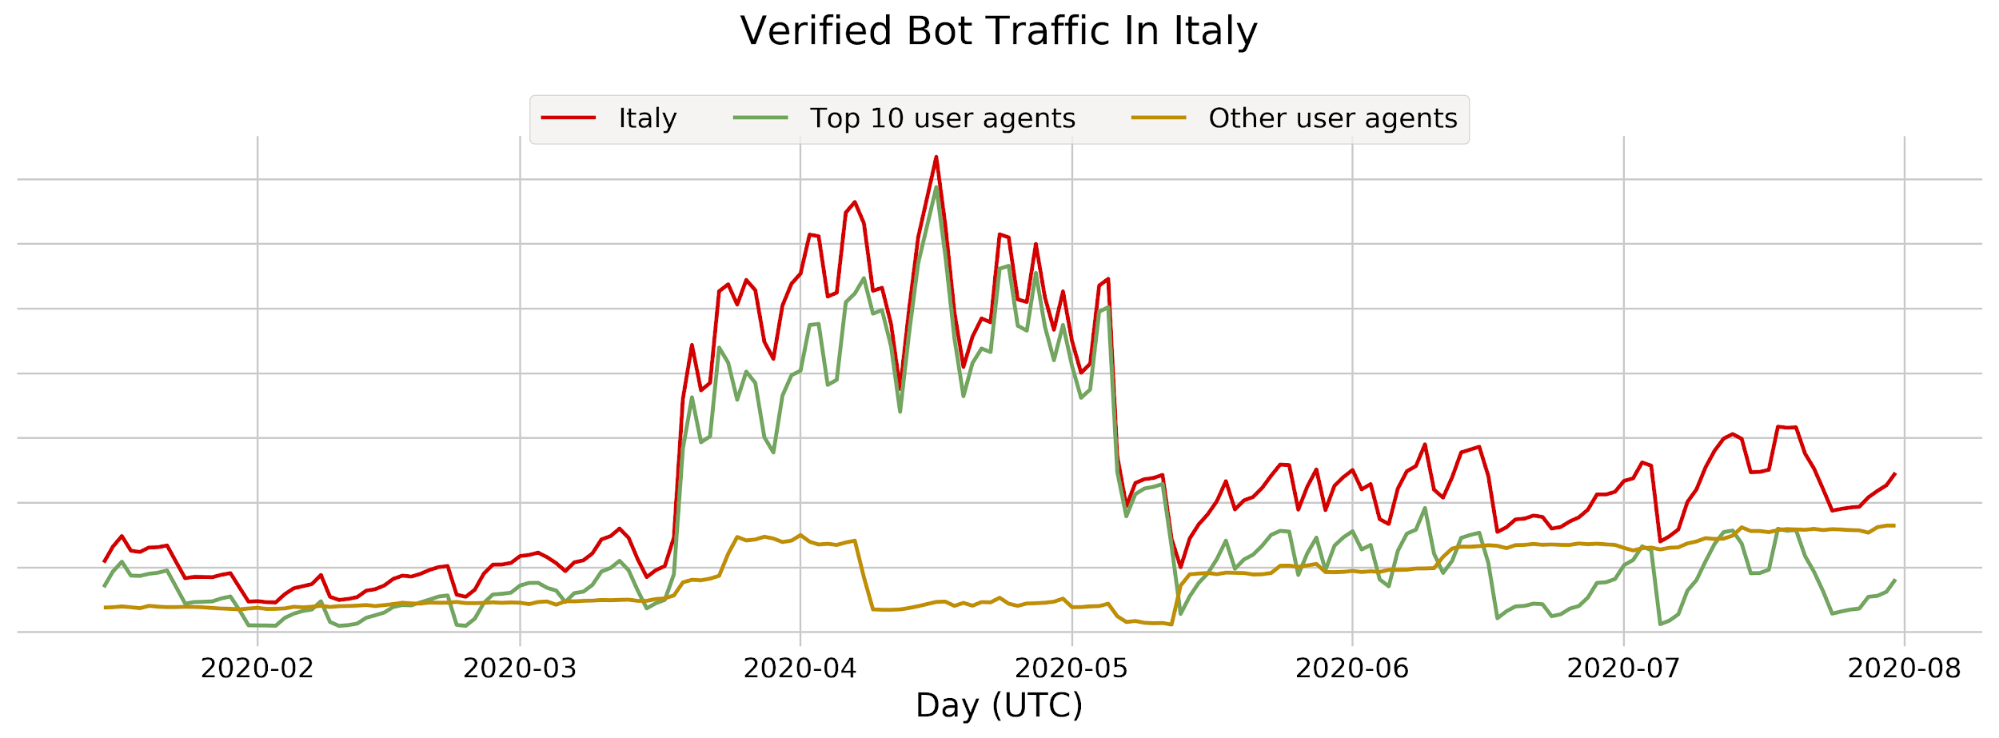
Figure 5.6 Verified bot traffic in Italy for the top 10 user agents, relative to January 15th 2020.
We can see that these 10 user agents are responsible for the majority of verified traffic coming from Italy.
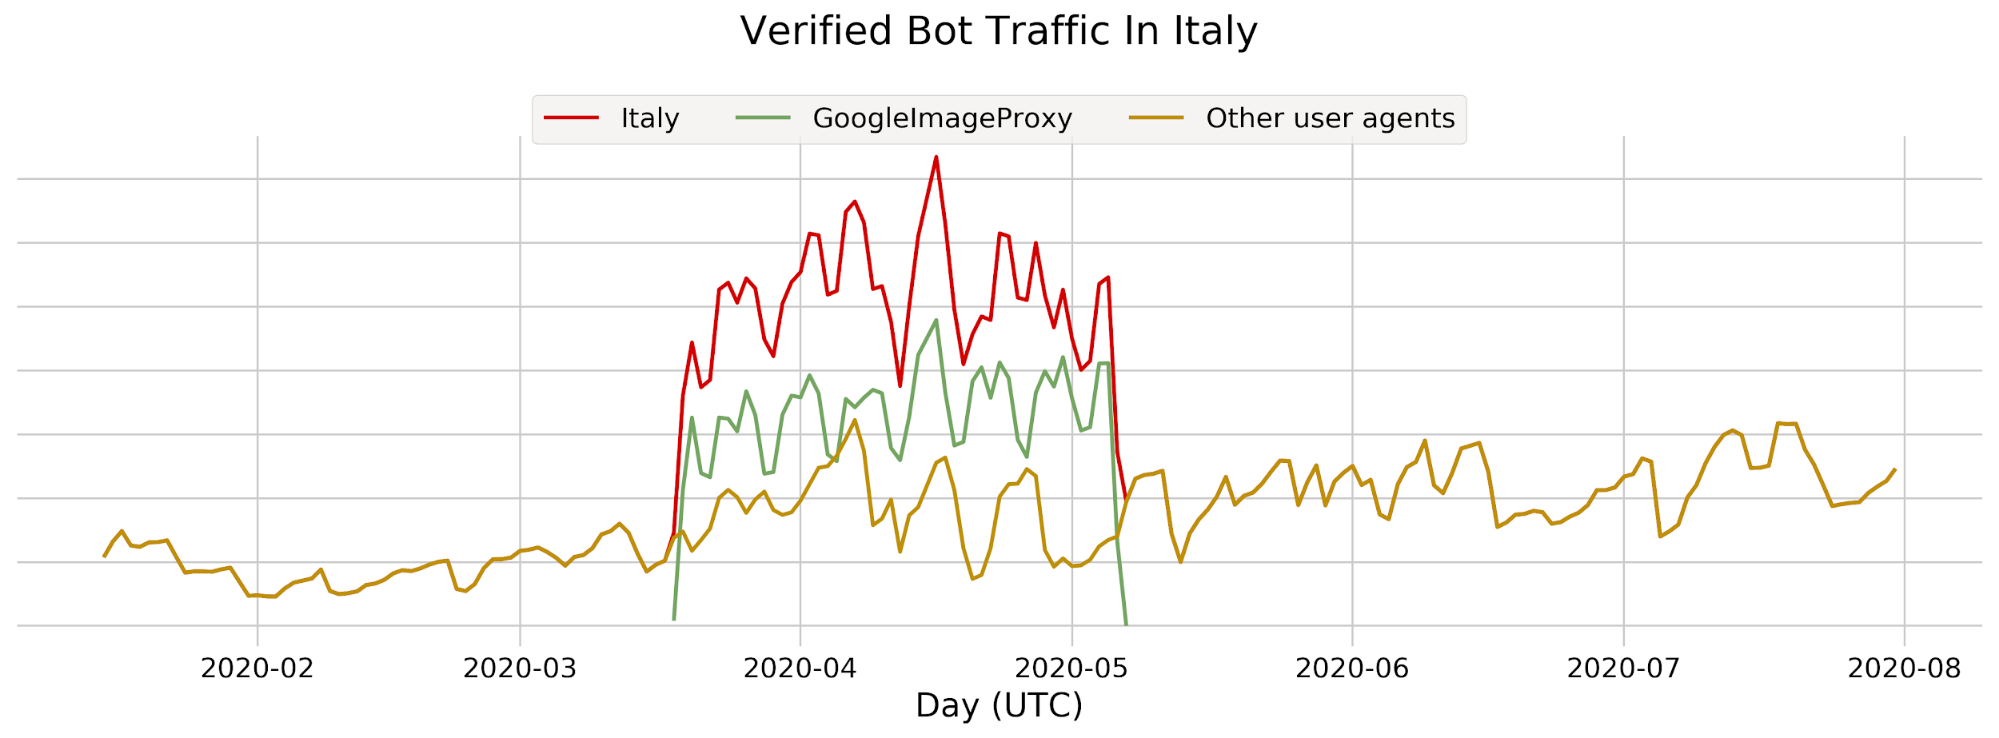
Figure 5.7 Verified bot traffic in Italy for the top user agent, relative to January 15 2020.
In fact, most of this increase is from a single user agent. This instance of Google image proxy anonymizes image requests from Gmail, which explains its popularity.
Where does this increase come from? Did this bot suddenly appear and disappear?
Not quite. One thing to keep in mind when dealing with bots is that they cross borders easily. As a proxy service, this bot is making calls on behalf of the end user – people opening emails. These requests will originate from a data center, which can be anywhere in the world. To see this in action, let’s take a look at traffic for this bot in a few select countries.
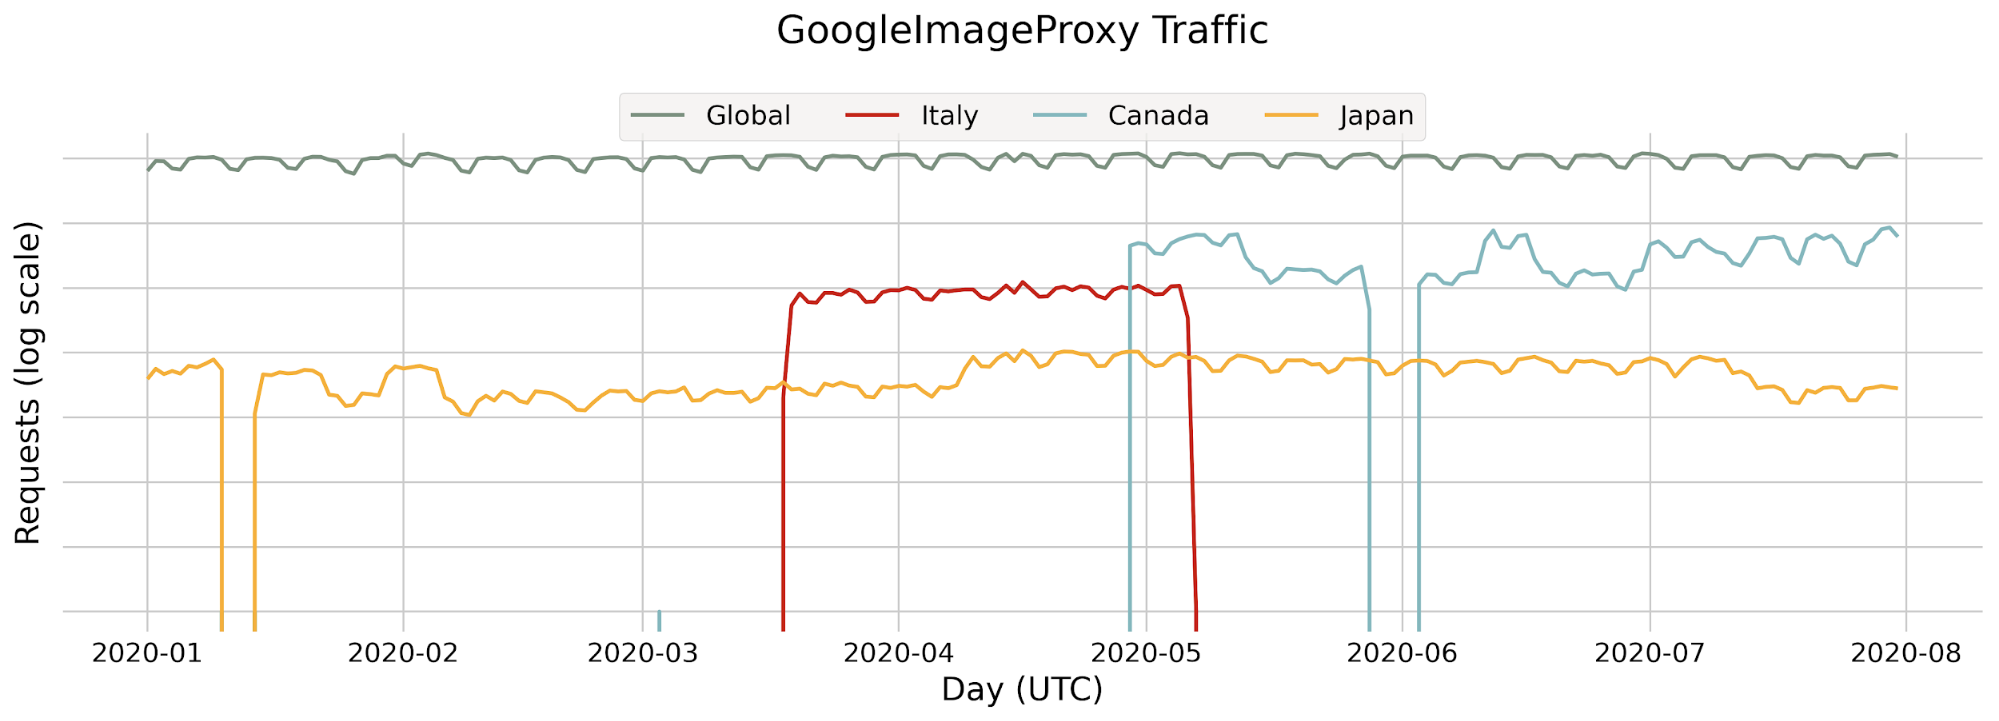
Figure 5.8. Countries of origin for GoogleImageProxy.
We can see that the global average barely budges. It appears that Google may be moving image proxy traffic between data centers and during the period we observed above that traffic was coming from Italy.
Summary
With Cloudflare’s global reach, we’re in a position to understand how bots behave.
The first half of 2020 saw a massive increase in web traffic of around 35% since the beginning of the year, driven by the ongoing coronavirus pandemic, and some bots have taken advantage of it.
We explained how bot management works for our customers, and how we distinguish between likely automated and human traffic.
We showed an overview of how much of our global traffic is automated, and how bots change their behavior throughout the day and the week. Notably, 39.4% of all traffic Cloudflare processes comes from a suspected automated source.
A regional overview of automated traffic lets us know which regions were the source of traffic from likely automated agents. North America, Europe and Asia were the primary sources of traffic, and also of automated traffic in particular.
We then focused on North America, where the majority of automated traffic originates. The United States alone accounted for the majority of requests, over half of which come from automated sources.
To explore this further, we briefly dived into ASN traffic in the United States, so we could see where these requests were coming from. ASNs like Comcast and AT&T were the top ASNs for overall traffic, but unsurprisingly, data centers like Google and Amazon AWS were the main drivers of automated traffic.
Finally, we examined how the coronavirus has impacted traffic in Europe, with a deeper dive on Italian traffic. This led to some interesting insights on verified bot traffic, which saw a massive increase in Italy for a few months.
This post is a small peek into bot management at Cloudflare. In the future, we hope to expand this series of blog posts on bot management, exposing even more insights about bots on the Internet.
Anyone with public-facing web properties is likely to have bot traffic on their website.
One type of bot that commonly targets eCommerce and online portals is a ‘scraper bot’.
Some scraper bots are good (such as those used by search engines to assess your website’s content to inform search results, or price comparison sites to help inform consumer decisions), however many are malicious, and will work to scrape not only images but also pricing data from your site for use by a competitor.
Many Bot Management providers will need to divert your traffic to a dedicated data centre to analyse your traffic and ‘scrub’ it clean from malicious bot traffic before sending it on to your site. While effective this will almost certainly add latency to the traffic’s ‘journey’ resulting in degraded user experience. Look for a technology partner with an expansive network who can scan your traffic in real time as it passes through any data centre on their network.
Good and bad scraper bots behave in largely the same way, making it difficult for bot protection systems to differentiate between the two. A common challenge with Bot Management solutions is that they can return a high number of false positives (legitimate bot or customer traffic blocked as though it were malicious). This can result in legitimate customers being challenged to various and repeated authentication challenges, or in extreme cases, blocked altogether. Look for a technology partner who can consistently return low rates of false positives on your traffic.
The Success Story
I often joke that the key to understanding what that role of Customer Success is all about is to say: repeat the sentence again slowly… it’s there, in the name. Customer Success is, at its core, about making customers successful. And this is what makes our day, and makes us happy. Allow me to share a short story on how Cloudflare made a successful customer even more so with our Bot Management solution.
Once upon a time, an online property portal, let’s call them Property Portal, came to Cloudflare for our DDoS and WAF solution. We worked well together. The customer liked our ease of use and we delivered on our promise to provide performance and security to them. As Property Portal’s brand and digital footprint grew, so did the instances of malicious bot traffic, in particular ‘scraper bots’.
They say that imitation is the sincerest form of flattery. But when that imitation turns into someone else profiting off your IP, the shine starts to wear off, and that ‘imitation’ starts to become something more akin to outright theft. This is a challenge common to market leaders in the eCommerce and online portal space, where market leading organizations who pride themselves on presenting a solid portfolio of quality product offerings often find that competing sites seem to be not only replicating their content but matching or undercutting their prices in near real time.
Cloudflare wasn’t working with Property Portal when they first started facing these challenges, and as such, Property Portal engaged another party – at that time, one of the market leaders in the space – to provide a Bot Management solution for them.
At first pass, this seemed to solve the problem, however it wasn’t long before additional challenges became apparent:
performance was impacted slightly as this solution required traffic to be re-routed to a scrubbing centre to be ‘scrubbed’ of requests from bad bots before coming to their site;
a small percentage of malicious bots were still getting through and scraping valuable content of their website, and most damagingly;
Property Portal discovered that they were seeing a significant number of ‘false positives’, resulting in rising frustration for legitimate visitors (buyers, sellers and renters) repeatedly being asked to complete challenges in order to validate that they were human and not bots as they tried to navigate through the site.
During this time, Cloudflare released and matured our own Bot Management offering. Being aware that Property Portal weren’t seeing success from their existing solution, the account team began discussing the value of consolidating their bot solution with their DDoS and WAF offering from Cloudflare. We were given very clear success criteria which in technical terms, translated to the following:
Don’t mess anything up, deprecate our user experience, or make us change our domains if we switch to you;
Stop more of the bad traffic.;
And most importantly, let more of the good users in, and stop challenging them as much as our current provider does (reduce the number of false positives).
We passed with flying colours. In addition, Property Portal was happy that they were able to consolidate additional services under one vendor.
For our side, Cloudflare now has the privilege of knowing that we are helping to improve the experience for many of Property Portal’s end customers, while at the same time working to protect their IP and hard work by keeping the ‘imitators’ and their scraper bots at a safe distance.
Does any of the above feel familiar to you? Do your competitors have the uncanny ability to present near identical inventory, images or pricing to yours just as soon as you publish changes to your site? Or, are you keen to learn more in order to stay ahead of the bot armies?
Well, you’ve come to the right place, friend:
If you’re the self-serve type then take a look at our learning centre here and here, or our product pages. (And yes, we have a (good) chat bot there waiting to help you).
If ‘tuning in and geeking out’ is your preferred method of learning, then tune into the next episode of ‘Customers + Success’ on Cloudflare TV where I’ll be interviewing some of the people involved in this case, and hearing more about the challenges that this customer faced first-hand. The segment will air at 4PM PST October 21st / 7AM SGT October 22nd / 10AM AEST October 22nd, and will be appearing on the CFTV schedule in the next week.
Alternatively, if you consume your knowledge in old-fashioned human style feel free to contact us here. Someone from our team will be in touch to get you the answers you are looking for.
The collective thoughts of the interwebz
Manage Consent
To provide the best experiences, we use technologies like cookies to store and/or access device information. Consenting to these technologies will allow us to process data such as browsing behavior or unique IDs on this site. Not consenting or withdrawing consent, may adversely affect certain features and functions.
Functional
Always active
The technical storage or access is strictly necessary for the legitimate purpose of enabling the use of a specific service explicitly requested by the subscriber or user, or for the sole purpose of carrying out the transmission of a communication over an electronic communications network.
Preferences
The technical storage or access is necessary for the legitimate purpose of storing preferences that are not requested by the subscriber or user.
Statistics
The technical storage or access that is used exclusively for statistical purposes.The technical storage or access that is used exclusively for anonymous statistical purposes. Without a subpoena, voluntary compliance on the part of your Internet Service Provider, or additional records from a third party, information stored or retrieved for this purpose alone cannot usually be used to identify you.
Marketing
The technical storage or access is required to create user profiles to send advertising, or to track the user on a website or across several websites for similar marketing purposes.