In the blog our previous introduction to the SOP-driven LLM Agent Framework, we the potential of LLM agent framework to revolutionise business operations was discussed. Now, we’re excited to explore a compelling use case: automating Account Takeover (ATO) investigations in Risk Operations (RiskOps). This framework has significantly reduced manual effort, improved efficiency, and minimised errors in the investigation process, setting a new standard for secure and streamlined operations.
The challenge in RiskOps
Traditionally, ATO investigations have been fraught with challenges due to their complexity and the manual effort required. Analysts must sift through vast amounts of data, cross-referencing multiple systems and executing numerous SQL queries to make informed decisions. This process is not only labor-intensive but also susceptible to human error, which can lead to inconsistencies and potential security breaches.
The manual approach often involves:
Time-consuming data analysis: Analysts spend significant time gathering and interpreting data from disparate sources, leading to delays and inefficiencies.
Decision fatigue: Continuous decision-making in a high-pressure environment can result in oversight or errors, especially when relying on predefined thresholds without adaptive insights.
Resource constraints: The need for specialised skills to handle SQL queries and interpret complex patterns limits the scalability of the process.
These challenges highlight the need for a more efficient, reliable, and scalable solution.
Leveraging the SOP agent framework
Our framework transforms the ATO investigation process by mirroring manual workflows while leveraging advanced automation.
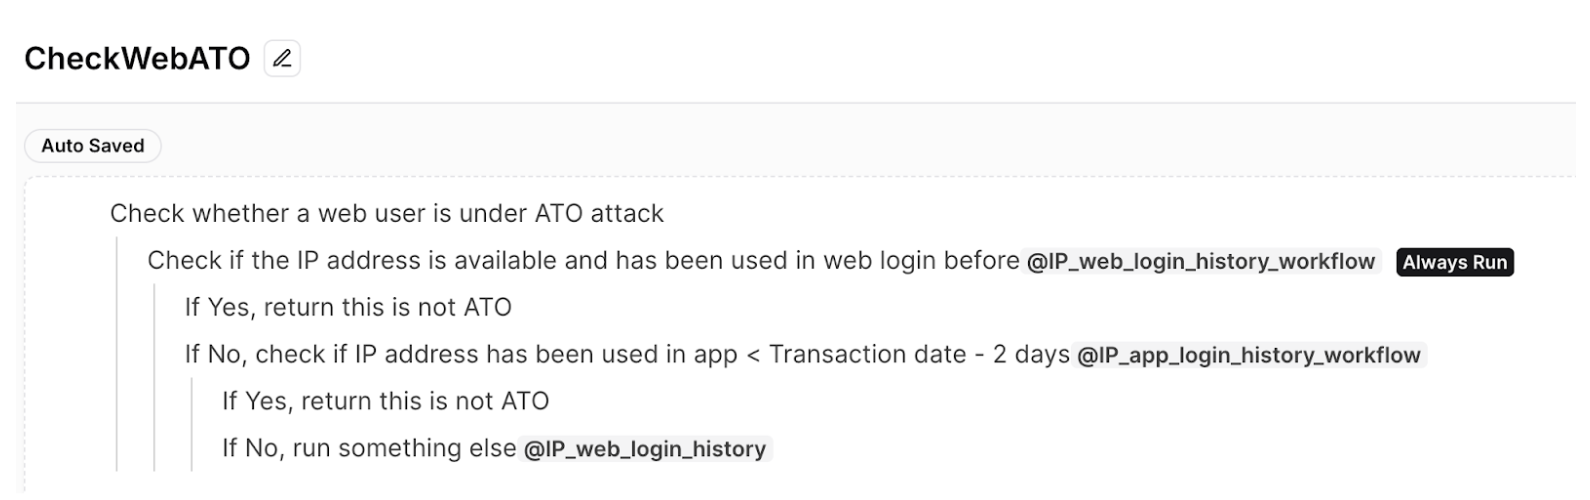
At its core, a Standard Operating Procedure (SOP) guides the investigation process. This comprehensive SOP, is designed with an intuitive tree structure. It outlines the sequence of investigative actions, required data for each step, necessary SQL queries and external function calls, as well as decision criteria guiding the investigation. Figure 1 shows the example of ATO investigation SOP.
Figure 1: Example of fictional ATO investigation SOP
The SOP is written in natural language in an indentation format. Users can easily define SOPs using an intuitive editor. This format also clearly denotes the specific functions or queries associated with each step in the SOP. The @function_name notation (eg. @IP_web_login_history) makes it easy to identify where external calls are made within the process, highlighting the integration points between the SOP-driven LLM agent framework and the existing systems or databases.
Dynamic execution
The dynamic execution engine consists of the SOP planner and the Worker Agent, working in tandem to drive efficient operations. The SOP planner serves as the navigator, guiding the investigation’s path by generating the necessary SOP steps and determining the appropriate APIs to call. It uses a structured execution approach inspired by Depth-First Search (DFS) to ensure thorough and systematic processing. Meanwhile, the Worker Agent acts as the executor, interpreting the JSON-formatted SOPs, invoking required APIs or SQL queries, and storing results. This continuous interplay between the SOP planner and the Worker Agent establishes an efficient feedback loop, propelling the investigation forward with precision and reliability.
The automated investigation process begins at the root of the SOP tree and methodically progresses through each defined step. At each juncture, the system executes specified SQL queries as needed, retrieving and analysing relevant data. Based on this analysis, the framework evaluates step specific criteria and makes informed decisions that guide subsequent steps. This iterative process allows the investigation to delve as deeply into the data as the SOP dictates, ensuring both thoroughness and efficiency.
As the investigation concludes, having completed all of the steps, the framework enters its final phase. It compiles a comprehensive summary of the entire process, synthesising all gathered information to generate a final decision. The culmination of this process is a detailed report that encapsulates the investigation’s findings and provides clear, actionable conclusions.
This automated approach combines the best of human expertise with computational efficiency. It maintains the depth and detail of a human-conducted investigation while leveraging the speed and consistency of automation. The result is a powerful tool that can handle complex investigations with precision and reliability, making it an invaluable asset in various fields requiring thorough and systematic analysis.
Figure 2: Example of dynamic execution
Efficiency, impact and future potential
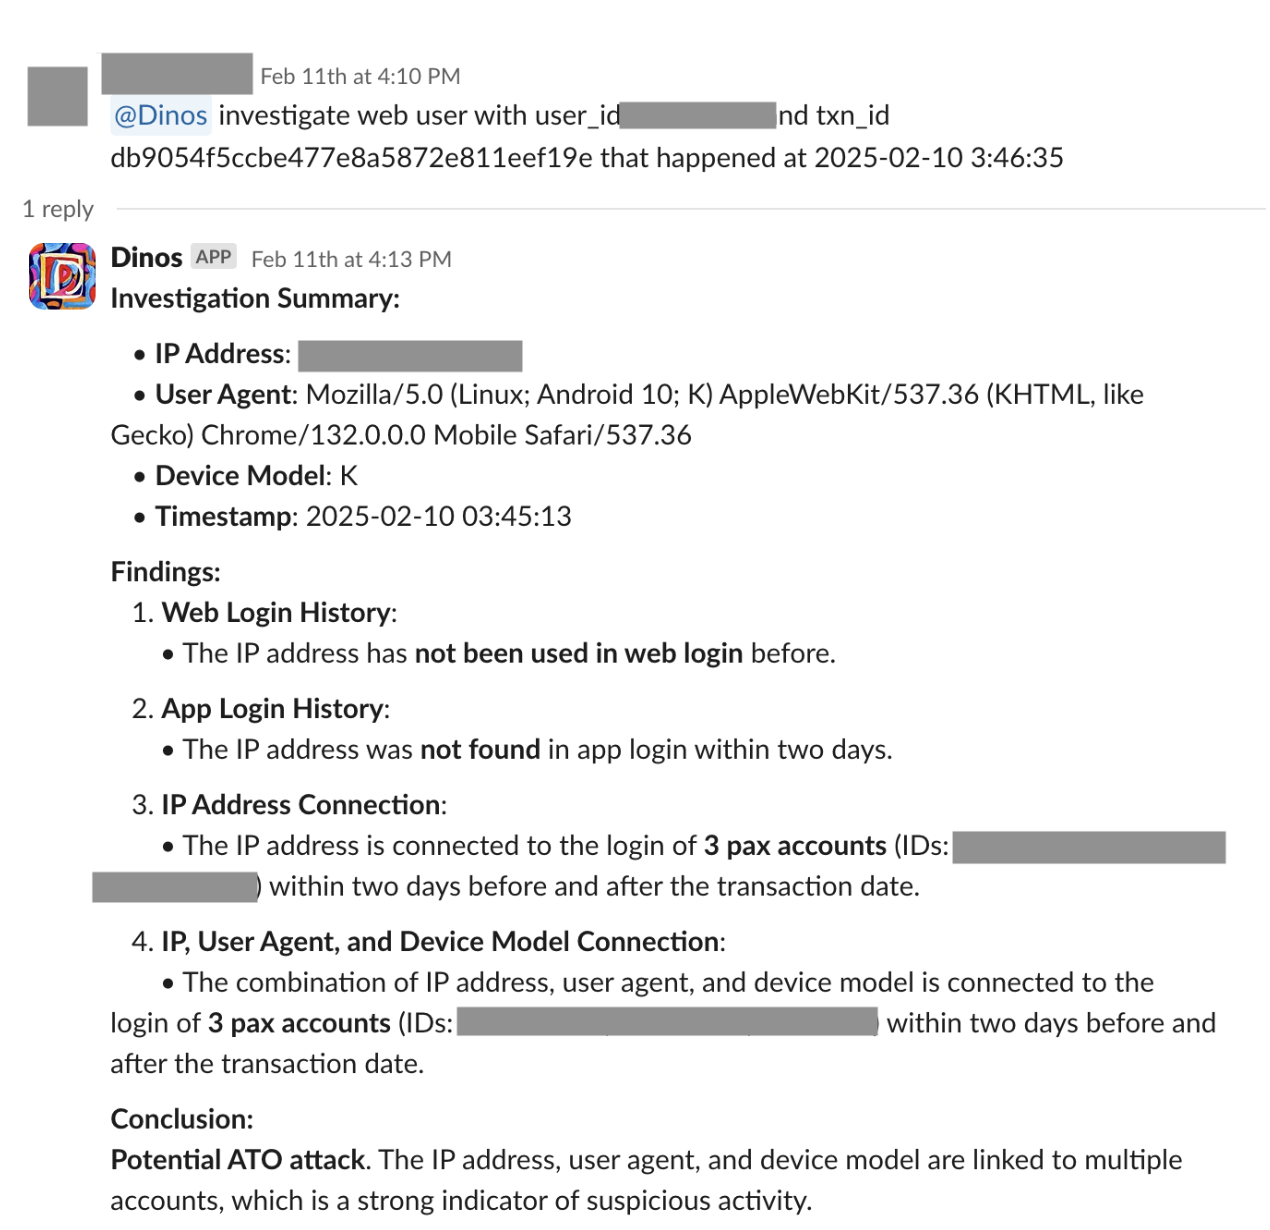
The SOP-driven LLM agent framework has demonstrated remarkable efficiency and impact in automating RiskOps processes. By automating data handling and leveraging AI to adapt to emerging patterns, the framework has significantly reduced manual tasks and streamlined operations. Figure 3 shows an example of an automated RiskOps process integrated with Slack.
Figure 3: Slack integration
Key achievements of automating RiskOps process:
Reduction in handling time from 22 to 3 minutes per ticket.
Automation of 87% of ATO cases since launch.
Achievement of a zero-error rate, enhancing both efficiency and security.
These results not only demonstrate the framework’s effectiveness in streamlining RiskOps but also provide stakeholders with increased confidence in the security and reliability of their operations.
The success of the framework in automating ATO investigations opens the door to a wider range of applications across various sectors. By adapting the framework to different processes, organisations can achieve similar improvements in efficiency and reliability, leading to a more responsive and agile business environment.
Conclusion
The SOP-driven LLM agent framework is more than an automation tool. It’s a catalyst for transforming enterprise operations. By applying it to ATO investigations, we’ve demonstrated its potential to enhance efficiency, reliability, and security. As we continue to explore its capabilities, we anticipate unlocking new levels of productivity and innovation across industries.
We look forward to sharing more as we explore how this groundbreaking framework can be applied to various challenges, helping organisations navigate the complexities of modern operations with confidence and precision.
Join us
Grab is a leading superapp in Southeast Asia, operating across the deliveries, mobility and digital financial services sectors. Serving over 800 cities in eight Southeast Asian countries, Grab enables millions of people everyday to order food or groceries, send packages, hail a ride or taxi, pay for online purchases or access services such as lending and insurance, all through a single app. Grab was founded in 2012 with the mission to drive Southeast Asia forward by creating economic empowerment for everyone. Grab strives to serve a triple bottom line – we aim to simultaneously deliver financial performance for our shareholders and have a positive social impact, which includes economic empowerment for millions of people in the region, while mitigating our environmental footprint.
Powered by technology and driven by heart, our mission is to drive Southeast Asia forward by creating economic empowerment for everyone. If this mission speaks to you, join our team today!
We’re excited to introduce an innovative Large Language Model (LLM) agent framework that reimagines how enterprises can harness the power of AI to streamline operations and boost productivity. At its core, this framework leverages Standard Operating Procedures (SOPs) to guide AI-driven execution, ensuring reliability and consistency in complex processes. Initial evaluations have shown remarkable results, with over 99.8% accuracy in real-world use cases. For example, the framework has powered solutions like the Account Takeover Investigations (ATI) bot, which achieved a 0 false rate while reducing investigation time from 23 minutes to just 3, automating 87% of cases. The fraud investigation use case also reduced the average handling time (AHT) by 45%, saving over 300 man-hours monthly with a 0 false rate, demonstrating its potential to transform even the most intricate enterprise operations with a high degree of accuracy.
The framework’s capabilities extend far beyond just accuracy, it offers a versatile suite of tools that revolutionise automation and app development, enabling AI-powered solutions up to 10 times faster than traditional methods.
The power of SOPs in AI automation
Traditional agent-based applications often use LLMs as the core controller to navigate through standard operating procedure (SOPs). However, this approach faces several challenges. LLMs may make incorrect decisions or invent non-existent steps due to hallucination. As generative models, they struggle to consistently produce results in a fixed format. Moreover, navigating complex SOPs with multiple branching pathways is particularly challenging for LLMs. These issues can lead to inefficiencies and inaccuracies in implementing business operations, especially when dealing with intricate, multi-step procedures.
Our framework addresses these challenges head-on by leveraging the structure and reliability of SOPs. We represent SOPs as a tree, with nodes encapsulating individual actions or decision points. This structure supports both sequential and conditional branching operations, mirroring the hierarchical nature of real-world business processes.
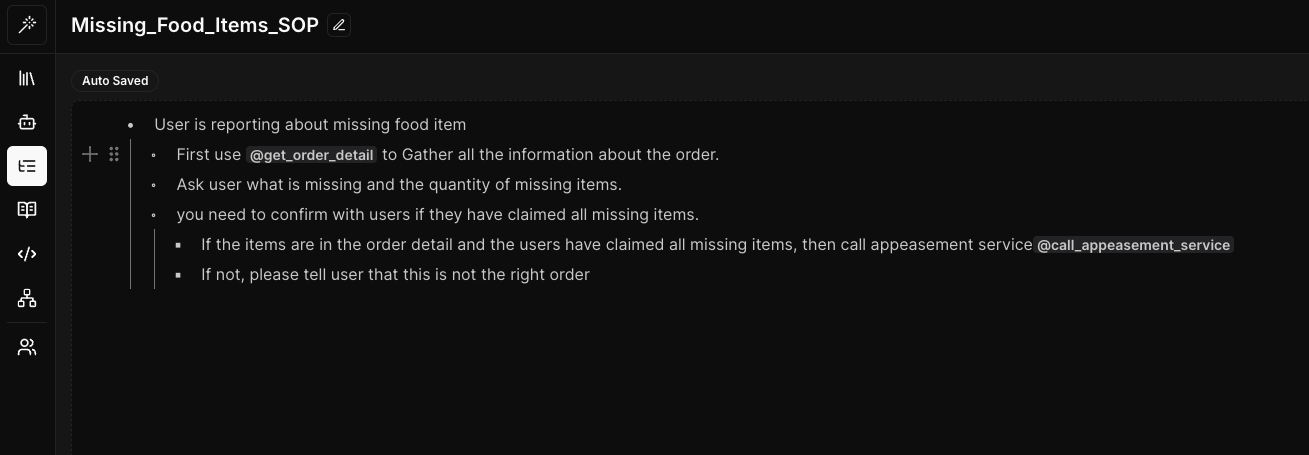
To make this powerful tool accessible to all, we’ve developed an intuitive SOP editor that allows non-technical users to easily define and visualise complex workflows. These visual representations are then converted into a structured, indented format that our system can interpret and execute efficiently.
Figure 1: SOP editor in our framework
The example above demonstrates how our framework transforms the customer support process by mirroring manual workflows while leveraging advanced automation. The SOP is written in natural language using an indentation format, making it easy for users to define and understand. The @function_name (@get_order_detail) notation clearly identifies where external calls are made within the process, highlighting the integration points between the SOP-driven LLM agent framework and existing systems or databases.
The magic behind the scenes
The framework’s strength lies in the synergy between three key components: the planner module, LLM-powered worker agent, and user agent. This intelligent trio works in harmony to deliver a seamless, efficient, and adaptable automation experience.
The planner module employs a Depth-First Search (DFS) algorithm to navigate the SOP tree, ensuring thorough execution with step-by-step prompt generation and sophisticated backtracking mechanisms. The LLM-powered worker agent dynamically updates its understanding and makes decisions based on the most current information. Our approach tackles hallucination and improves efficiency through context compression and strategic limitation of available Application Programming Interface tools (APIs). The framework’s dynamic branching capability allows for adaptive navigation based on real-time data and analysis.
Serving as the primary user interface, the user agent offers multilingual interaction, accurate intent identification, and seamless handling of out-of-order scenarios.
By combining structured SOPs with flexible LLM-powered agents and advanced algorithmic approaches, our framework adeptly handles complex, real-world scenarios while maintaining reliability and consistency. This innovative architecture effectively mitigates common LLM challenges, resulting in a robust system capable of navigating intricate business processes with high accuracy and adaptability.
Beyond SOPs: A suite of powerful features
While SOPs form the backbone of our framework, we’ve incorporated several other cutting-edge features to create a truly comprehensive solution. Our Graph Retrieval-Augmented Generation (GRAG) pipeline enhances information retrieval and content generation tasks, allowing for more accurate and context-aware responses. The workflow feature enables chaining multiple plugins together to handle complex processes effortlessly, improving efficiency across various departments.
Our plugin system seamlessly integrates with various technologies such as API, Python, and SQL, providing the flexibility to meet diverse needs. Whether you’re an engineer coding in Python, a data analyst working with SQL, or a risk operations specialist, our plugin system adapts to your preferred tools. Additionally, our playground feature allows users to develop, test, and refine LLM applications easily in an interactive environment, supporting the latest multi-modal APIs for accelerated innovation.
Figure 2: Workflow builder feature in our framework
Empowering teams through versatility and accessibility
Our framework is designed to empower teams across the organisation. The multilingual capabilities of our user agent ensure that language barriers don’t hinder adoption or efficiency. For scenarios requiring human intervention, we’ve implemented a state stack that allows for pausing and resuming execution seamlessly. This feature ensures that complex processes can be handled with the right balance of automation and human oversight.
Security and transparency at the forefront
In an era where data security and process transparency are paramount, our framework doesn’t fall short. It’s designed with a security-first approach, ensuring granular access control so that users only access information they’re authorised to see. Additionally, we provide detailed logging and visualisation of each execution, offering complete explainability of the automation process. This level of transparency not only aids in troubleshooting but also helps in building trust in the AI-driven processes across the organisation.
Looking ahead
As we continue to refine and expand this LLM agent framework, we’re excited to explore its potential across different industries. We’ll be sharing more about each of these features in the future and showcase how they can be leveraged to solve specific business challenges and explore real-world applications.
Look forward to more in-depth explorations of the framework’s capabilities, use cases, and technical innovations. With this revolutionary approach, you’re not just automating tasks – you’re transforming the way your enterprise operates, unleashing the true power of LLM in your organisation.
Join us
Grab is a leading superapp in Southeast Asia, operating across the deliveries, mobility and digital financial services sectors. Serving over 800 cities in eight Southeast Asian countries, Grab enables millions of people everyday to order food or groceries, send packages, hail a ride or taxi, pay for online purchases or access services such as lending and insurance, all through a single app. Grab was founded in 2012 with the mission to drive Southeast Asia forward by creating economic empowerment for everyone. Grab strives to serve a triple bottom line – we aim to simultaneously deliver financial performance for our shareholders and have a positive social impact, which includes economic empowerment for millions of people in the region, while mitigating our environmental footprint.
Powered by technology and driven by heart, our mission is to drive Southeast Asia forward by creating economic empowerment for everyone. If this mission speaks to you, join our team today!
As the complexity of data retrieval requirements continue to grow, traditional search methods often struggle to provide relevant and accurate results, especially for nuanced or conceptual queries. Vector similarity search has emerged as a powerful technique for finding semantically similar information. It refers to finding vectors in a large dataset that are most similar to a given query vector, typically using some distance or similarity measure. The concept originated in the 1960s with the work by Minsky and Papert on nearest neighbour search 1. Since then, the idea has evolved substantially with modern approaches often using approximate methods to enable fast search in high-dimensional spaces, such as locality-sensitive hashing 2 and graph-based indexing 3.
Recently, vector similarity search has become a crucial component in many machine learning and information retrieval applications. It is one of the key technologies that popularised the idea of Retrieval Augmented Generation (RAG) 4 which increased the applicability of Transformer 5 based Generative Large Language Models (LLMs) 6 in domain-specific tasks without requiring any further training or fine-tuning. However, the effectiveness of the vector search can be limited when dealing with intricate queries or contextual nuances. For example, from a typical vector similarity search perspective, “I like fishing” and “I do not like fishing” may be quite close to each other, while in reality, they are the exact opposite. In this blog post, we discuss an approach that we experimented with that combines vector similarity search with LLMs to enhance the relevance and accuracy of search results for such complex and nuanced queries. We leverage the strengths of both techniques: vector similarity search for efficient shortlisting of potential matches, and LLMs for their ability to understand natural language queries and rank the shortlisted results based on their contextual relevance.
Proposed solution
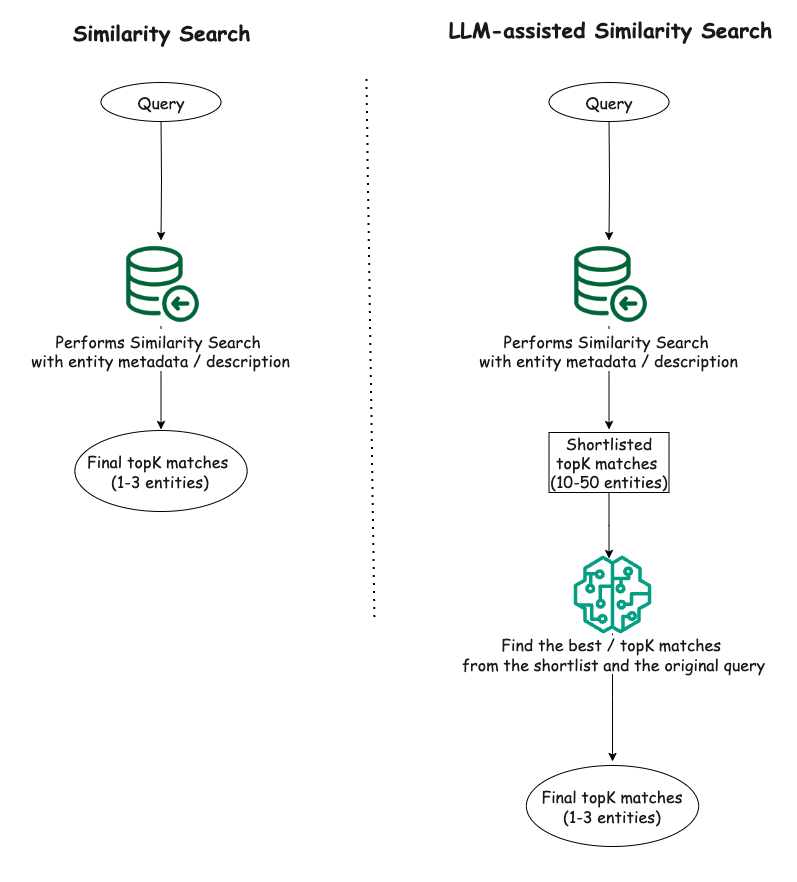
The proposed solution involves a two-step process:
Vector similarity search: We first perform a vector similarity search on the dataset to obtain a shortlist of potential matches (e.g., top 10-50 results) for the given query. This step leverages the efficiency of vector similarity search to quickly narrow down the search space.
LLM-assisted ranking: The shortlisted results from the vector similarity search are then fed into an LLM, which ranks the results based on their relevance to the original query. The LLM’s ability to understand natural language queries and contextual information helps in identifying the most relevant results from the shortlist.
By combining these two steps, we aim to achieve the best of both worlds: the efficiency of vector similarity search for initial shortlisting, and the contextual understanding and ranking capabilities of LLMs for refining the final results.
Figure 1. Similarity search and the proposed LLM-assisted similarity search.
Experiment
Datasets
To evaluate the effectiveness of our proposed solution, we conducted experiments on two small synthetic datasets in CSV format that we curated using GPT-4o 7.
Food dataset: A collection of 100 dishes with their titles and descriptions.
Tourist spots dataset: A collection of 100 tourist spots in Asia, including their names, cities, countries, and descriptions.
It is important to note that we primarily focus on performing similarity search on structured data such as description of various entities in a relational database.
Setup
Our experimental setup included a Python script for vector similarity search leveraging Facebook AI Similarity Search (FAISS) 8, a library developed by Facebook that offers efficient similarity search, and OpenAI’s embeddings (i.e., text-embedding-ada-002) 9 to generate the vector embeddings needed for facilitating the vector search. For our proposed solution, an LLM component (i.e., GPT-4o) was included in the setup in addition to the FAISS-based similarity search component.
Observations
To compare the performance of the proposed approach of LLM-assisted vector similarity search as outlined in the “Proposed solution” section with the raw vector similarity search, we conducted both techniques on our two synthetic datasets. With the raw vector search, we get the top three matches for a given query. For our proposed technique, we first get a shortlist of 15 entity matches from FAISS for the same query, and supply the shortlist and the original query to LLM with some descriptive instructions in the prompt to find the top three matches from the provided shortlist.
From the experiments, in simpler cases where the queries were straightforward and directly aligned with the textual content of the data, both the raw similarity search and the LLM-assisted similarity search demonstrated comparable performance. However, as the queries became more complex, involving additional constraints, negations, or conceptual requirements, the LLM-assisted search exhibited a clear advantage over the raw similarity search. The LLM’s ability to understand context and capture subtleties in the queries allowed it to filter out irrelevant results and rank the most appropriate ones higher, leading to improved accuracy.
Here are a few examples where the LLM-assisted similarity search performed better:
Food dataset
Query: “food with no fish or shrimp”
Raw similarity search result:
- title: Tempura, description: A Japanese dish of seafood or vegetables that have been battered and deep fried.
- title: Ceviche, description: A seafood dish popular in Latin America, made from fresh raw fish cured in citrus juices.
- title: Sushi, description: A Japanese dish consisting of vinegared rice accompanied by various ingredients such as seafood and vegetables.
LLM-assisted similarity search result:
- title: Chicken Piccata, description: Chicken breasts cooked in a sauce of lemon, butter, and capers.
- title: Chicken Alfredo, description: An Italian-American dish of pasta in a creamy sauce made from butter and Parmesan cheese.
- title: Chicken Satay, description: Grilled chicken skewers served with peanut sauce.
Observation: The LLM correctly filtered out dishes containing fish or shrimp, while the raw similarity search failed to do so, presumably due to the presence of negation in the query.
Tourist spots dataset
Query: “exposure to wildlife”
Raw similarity search result:
- name: Ocean Park, city: Hong Kong, country: Hong Kong, description: Marine mammal park and oceanarium.
- name: Merlion Park, city: Singapore, country: Singapore, description: Iconic statue with the head of a lion and body of a fish.
- name: Manila Bay, city: Manila, country: Philippines, description: A natural harbor known for its sunset views.
LLM-assisted similarity search result:
- name: Ocean Park, city: Hong Kong, country: Hong Kong, description: Marine mammal park and oceanarium.
- name: Chengdu Research Base, city: Chengdu, country: China, description: A research center for giant panda breeding.
- name: Mount Hua, city: Shaanxi, country: China, description: Mountain known for its dangerous hiking trails.
Observation: Two out of the top three matches by the LLM-assisted technique seem relevant to the query while only one result from the raw similarity search is relevant and the other two being somewhat irrelevant to the query. The LLM identified the relevance of a research base for giant panda breeding to the “exposure to wildlife”, which the raw similarity search ignored in its ranking.
These examples provide a glimpse into the utility of LLMs in finding more relevant matches in scenarios where the queries involved additional context, constraints, or conceptual requirements beyond simple keyword matching. On the other hand, when the queries were more straightforward and focused on specific keywords or phrases present in the data, both approaches demonstrated comparable performance. For instance, queries like “Japanese food” or “beautiful mountains” yielded similar results from both the raw similarity search and the proposed LLM-assisted approach.
Overall, the LLM-assisted vector search exhibited a clear advantage in handling complex queries, leveraging its ability to understand natural language and contextual information. However, for simpler queries, the raw similarity search remained a viable option, especially when computational efficiency is a concern.
Conclusion
The experiments demonstrated the potential of combining vector similarity search with LLMs to enhance the relevance and accuracy of search results, particularly for complex and nuanced queries. While vector similarity search alone can provide reasonable results for straightforward queries, the LLM-assisted approach shines when dealing with queries that require a deeper understanding of context, nuances, and conceptual relationships. By leveraging the natural language understanding capabilities of LLMs, this approach can better capture the intent behind complex queries and provide more relevant search results.
Our experiment was limited to using a small volume of structured data (100 data points in each dataset) with a limited number of queries. However, we have witnessed similar enhancement in search result relevance when we deployed this solution internally within Grab for larger datasets, for example, 4500+ rows of data stored in a relational database.
Nevertheless, it is important to note that the effectiveness of this approach may still depend on the quality and complexity of the data, as well as the specific use case and query patterns. We believe it is still worthwhile to evaluate the proposed approach for more diverse (e.g., beyond CSV) and larger datasets. An interesting future work can be varying the size of the shortlist from the similarity search and observing how it impacts the overall search relevance when using the proposed approach. In addition, for real world applications, the performance implications in terms of additional latency introduced by the additional LLM query must also be considered.
Join us
Grab is the leading superapp platform in Southeast Asia, providing everyday services that matter to consumers. More than just a ride-hailing and food delivery app, Grab offers a wide range of on-demand services in the region, including mobility, food, package and grocery delivery services, mobile payments, and financial services across 700 cities in eight countries.
Powered by technology and driven by heart, our mission is to drive Southeast Asia forward by creating economic empowerment for everyone. If this mission speaks to you, join our team today!
References
M. Minsky and S. Papert, Perceptrons: An Introduction to Computational Geometry. MIT Press, 1969. ↩
P. Indyk and R. Motwani, “Approximate nearest neighbors: Towards removing the curse of dimensionality,” in Proceedings of the Thirtieth Annual ACM Symposium on Theory of Computing, 1998. ↩
Y. Malkov and D. Yashunin, “Efficient and robust approximate nearest neighbor search using hierarchical navigable small world graphs,” IEEE Transactions on Pattern Analysis and Machine Intelligence, 2020. ↩
P. Lewis, E. Perez, A. Piktus, F. Petroni, V. Karpukhin, N. Goyal, and D. Kiela, “Retrieval-augmented generation for knowledge-intensive NLP tasks,” in Advances in Neural Information Processing Systems, 2020. ↩
A. Vaswani, “Attention is all you need,” in Advances in Neural Information Processing Systems, 2017. ↩
A. Radford, “Improving language understanding by generative pre-training,” 2018. ↩
Retrieval-Augmented Generation (RAG) is a powerful process that is designed to integrate direct function calling to answer queries more efficiently by retrieving relevant information from a broad database. In the rapidly evolving business landscape, Data Analysts (DAs) are struggling with the growing number of data queries from stakeholders. The conventional method of manually writing and running similar queries repeatedly is time-consuming and inefficient. This is where RAG-powered Large Language Models (LLMs) step in, offering a transformative solution to streamline the analytics process and empower DAs to focus on higher value tasks.
In this article, we will share how the Integrity Analytics team has built out a data solution using LLMs to help automate tedious analytical tasks like generating regular metric reports and performing fraud investigations.
While LLMs are known for their proficiency in data interpretation and insight generation, they represent just a fragment of the entire solution. For a comprehensive solution, LLMs must be integrated with other essential tools. The following is required in assembling a solution:
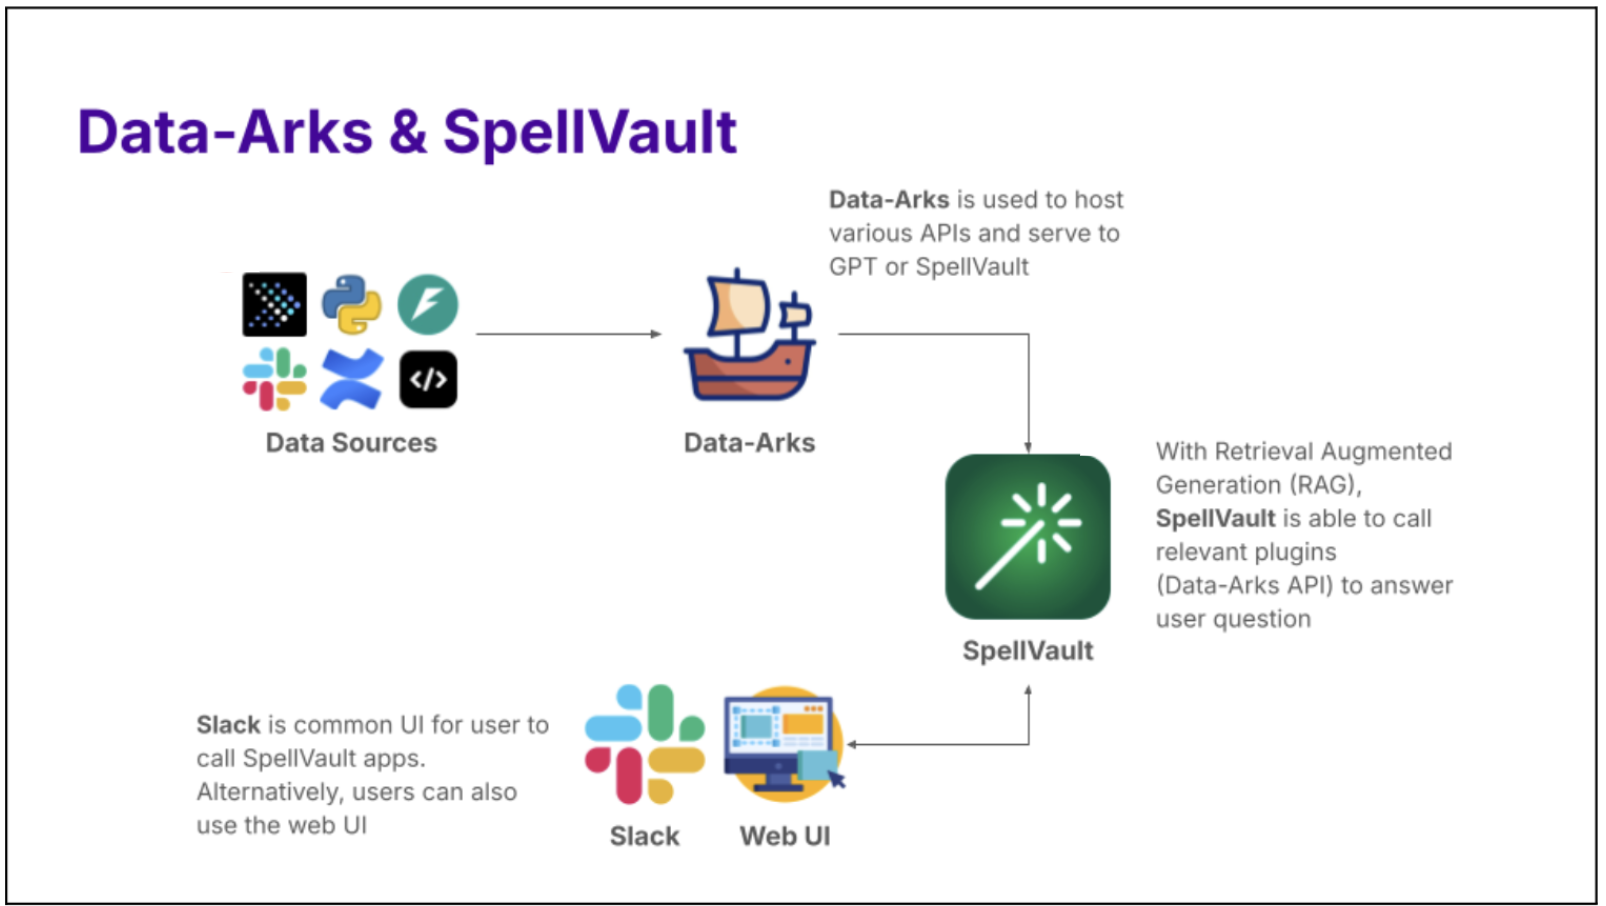
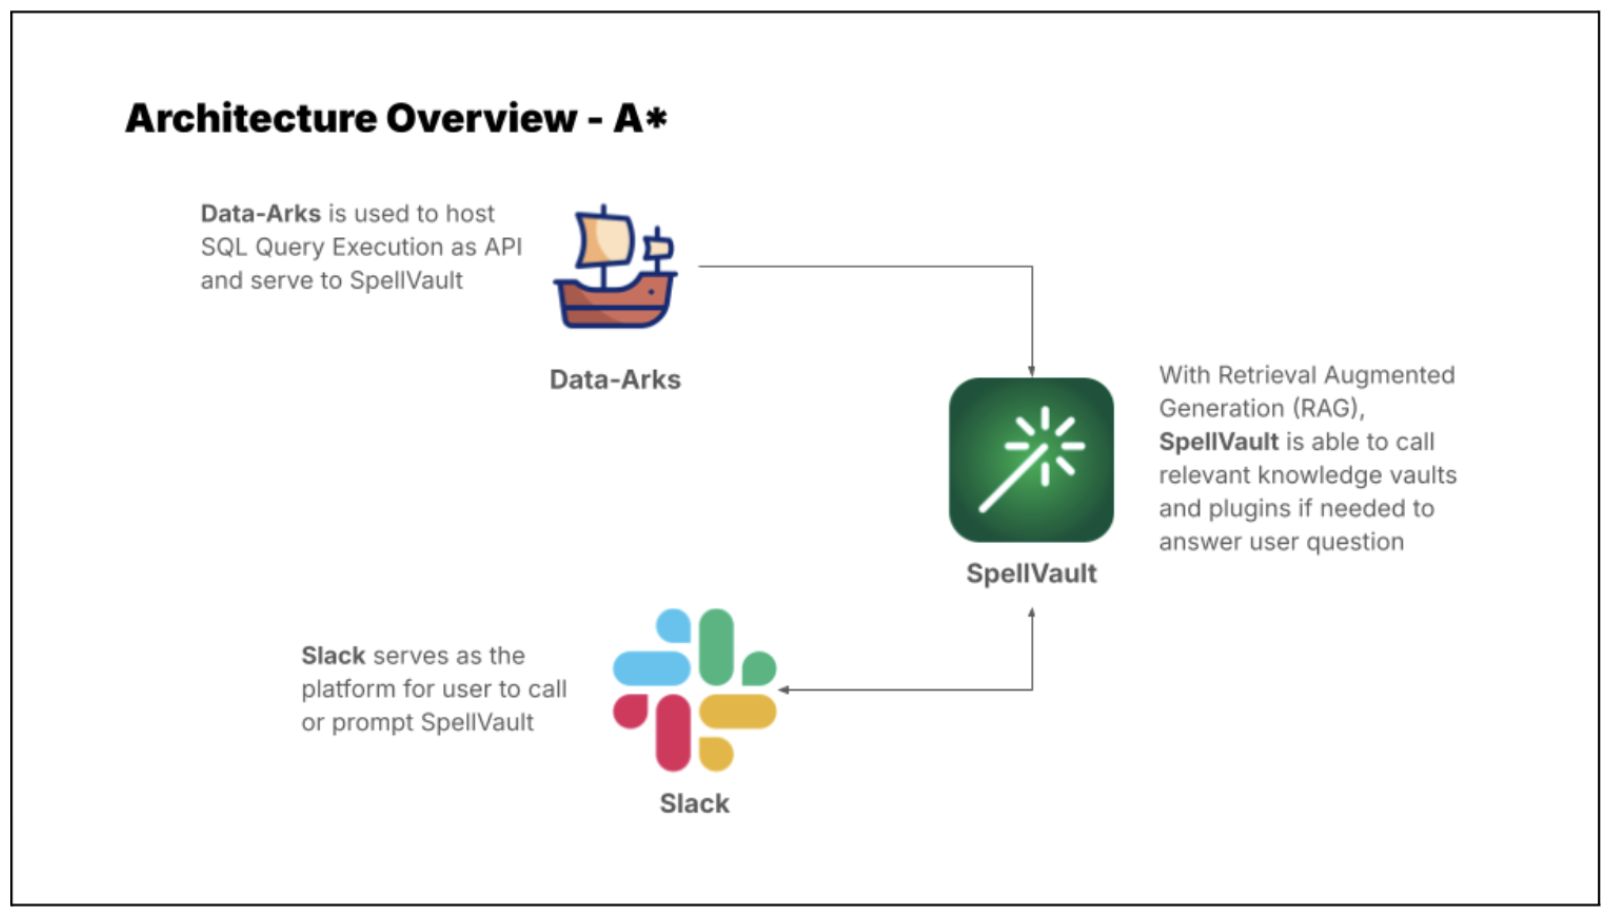
Internally facing LLM tool – Spellvault is a platform within Grab that stores, shares, and refines LLM prompts. It features low/no-code RAG capabilities that lower the barrier of entry for people to create LLM applications.
Data – with real time or close to real-time latency to ensure accuracy. It has to be in a standardised format to ensure that all LLM data inputs are accurate.
Scheduler – runs LLM applications at regular intervals. Useful for automating routine tasks.
Messaging Tool – a user interface where users can interact with LLM by entering a command to receive reports and insights.
Introducing Data-Arks, the data middleware serving up relevant data to the LLM agents
For most data use cases, DAs are usually running the same set of SQL queries with minor changes to parameters like dates, age or other filter conditions. In most instances, we already have a clear understanding of the required data and format to accomplish a task. Therefore, we need a tool that can execute the exact SQL query and channel the data output to the LLM.
Figure 1. Data-Arks hosts various APIs which can be called to serve data to applications like SpellVault.
What is Data-Arks?
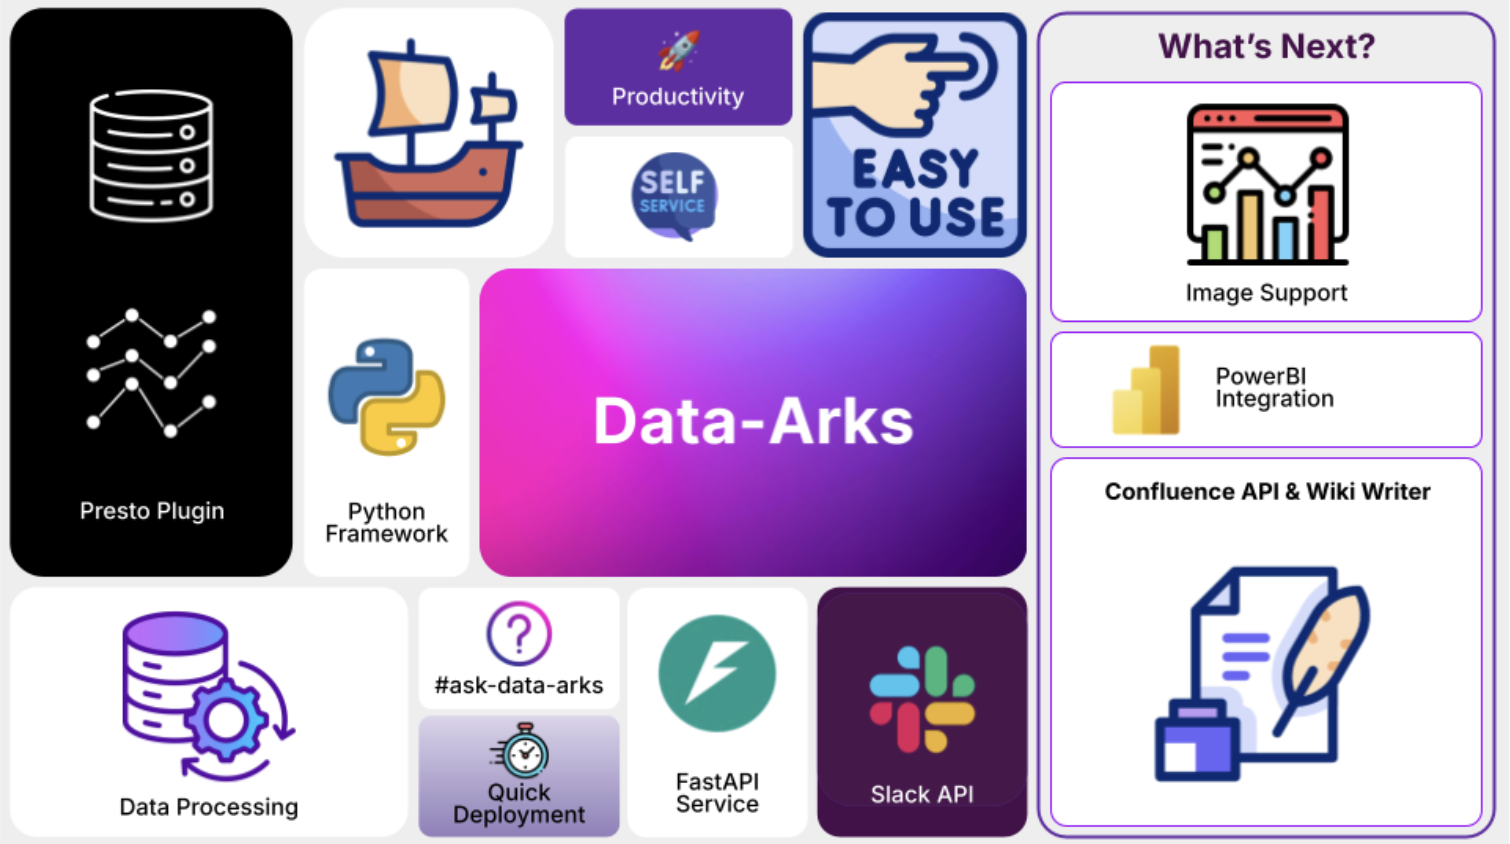
Data-Arks is an in-house Python-based API platform housing several frequently used SQL queries and python functions packaged into individual APIs. Data-Arks is also integrated with Slack, Wiki, and JIRA APIs, allowing users to parse and fetch information and data from these tools as well. The benefits of Data-Arks are summarised as follows:
Integration: Data-Arks service allows users to upload any SQL query or Python script on the platform. These queries are then surfaced as APIs, which can be called to serve data to the LLM agent.
Versatility: Data-Arks can be extended to everyone. Employees from various teams and functions at Grab can self-serve to upload any SQL query that they want onto the platform, allowing this tool to be used for different teams’ use cases.
Automating regular report generation and summarisation using Data-Arks and Spellvault
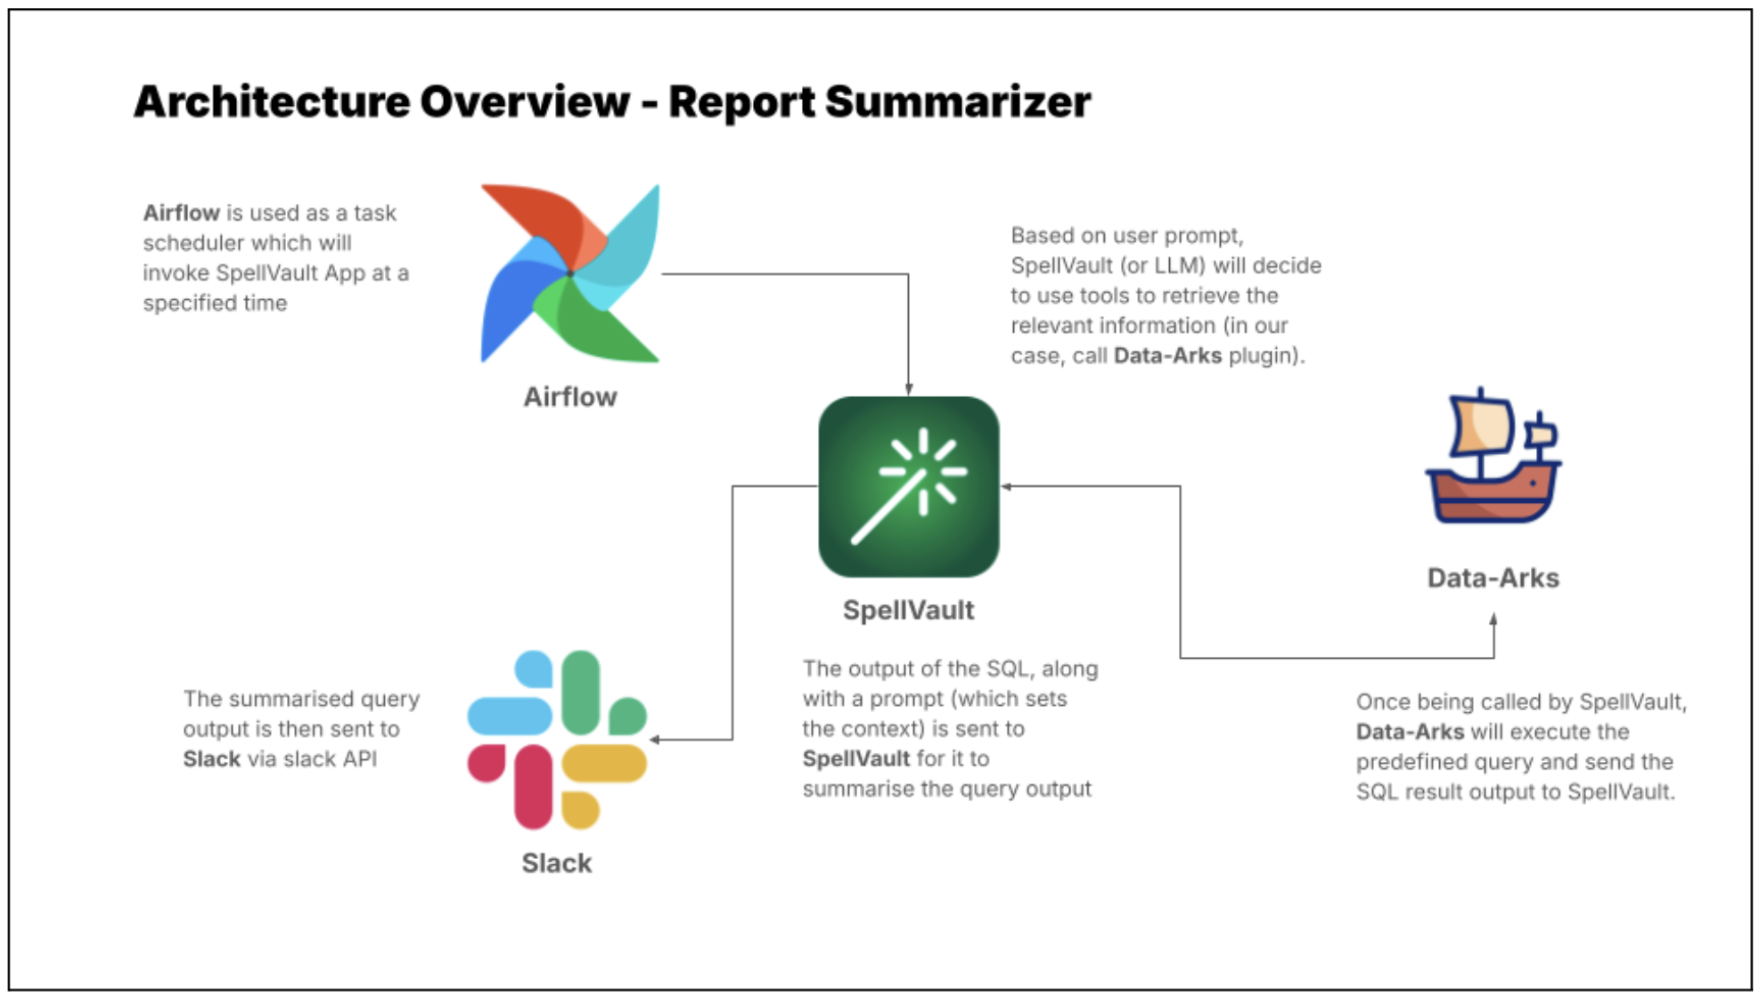
LLMs are just one piece of the puzzle, to build a comprehensive solution, they must be integrated with other tools. Figure 2 shows how different tools are used in executing report summaries in Slack.
Figure 2 shows how different tools are used in executing report summaries in Slack.
Figure 2. Report Summarizer uses various tools to summarise queries and deliver a summarised report through Slack.
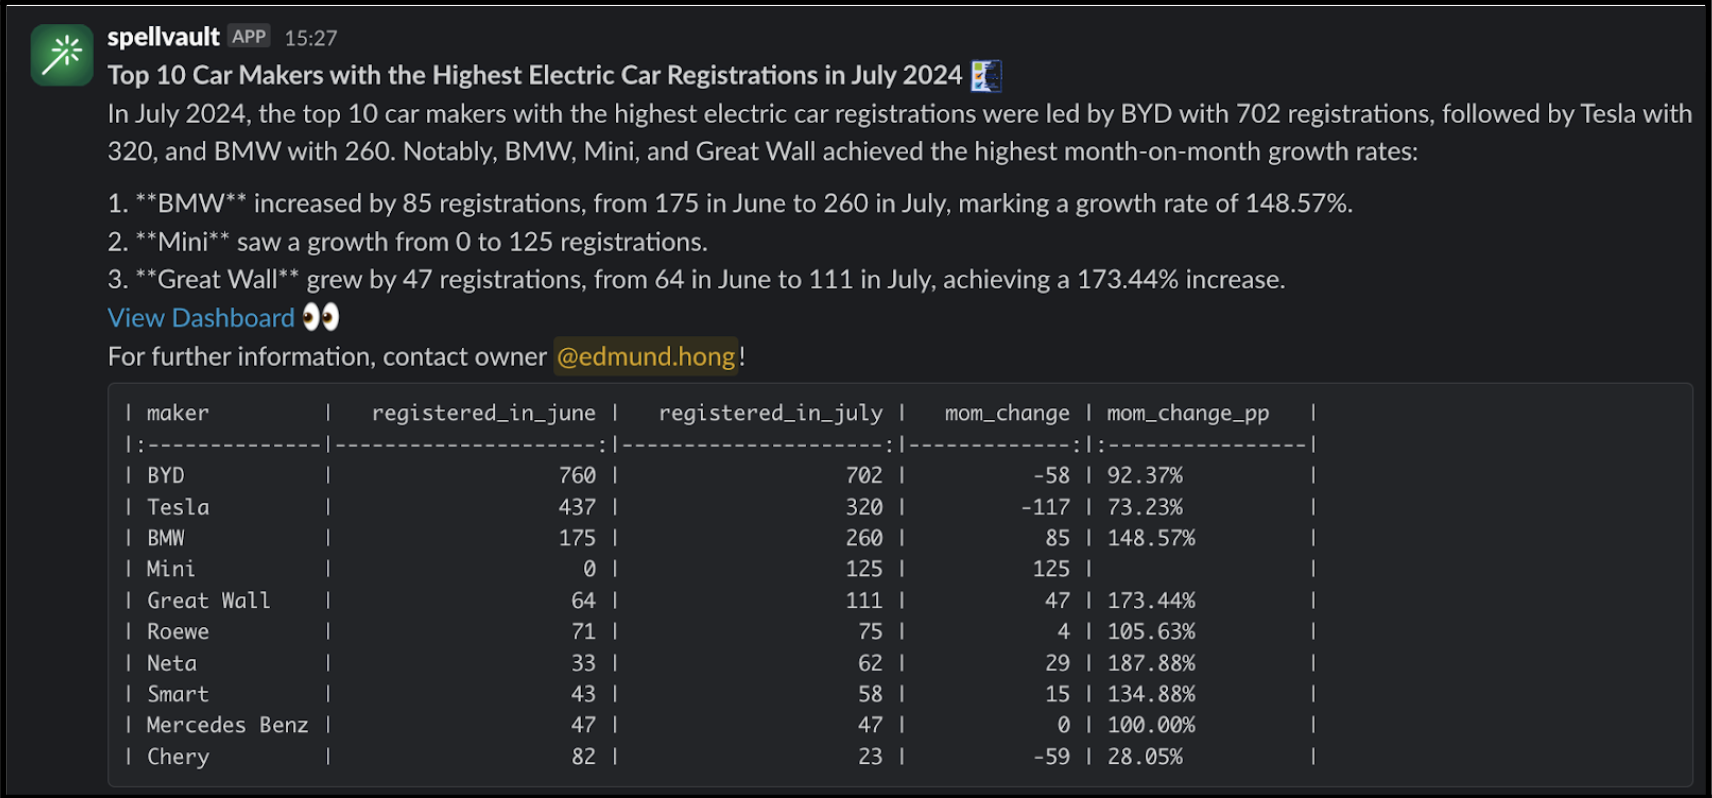
Figure 3 is an example of a summarised report generated by the Report Summarizer using dummy data. Report Summarizer calls a Data-Arks API to generate the data in a tabular format and LLM helps summarise and generate a short paragraph of key insights. This automated report generation has helped save an estimated 3-4 hours per report.
Figure 3. Sample of a report generated using dummy data extracted from [https://data.gov.my/](https://data.gov.my/).
LLM bots for fraud investigations
LLMs also excel in helping to streamline fraud investigations, as LLMs are able to contextualise several different data points and information and derive useful insights from them.
Introducing A* bot, the team’s very own LLM fraud investigation helper.
A set of frequently used queries for fraud investigation is made available as Data-Arks APIs. Upon a user prompt or query, SpellVault selects the most relevant queries using RAG, executes them and provides a summary of the results to users through Slack.
Figure 4. A* bot uses Data-Arks and Spellvault to get information for fraud investigations.
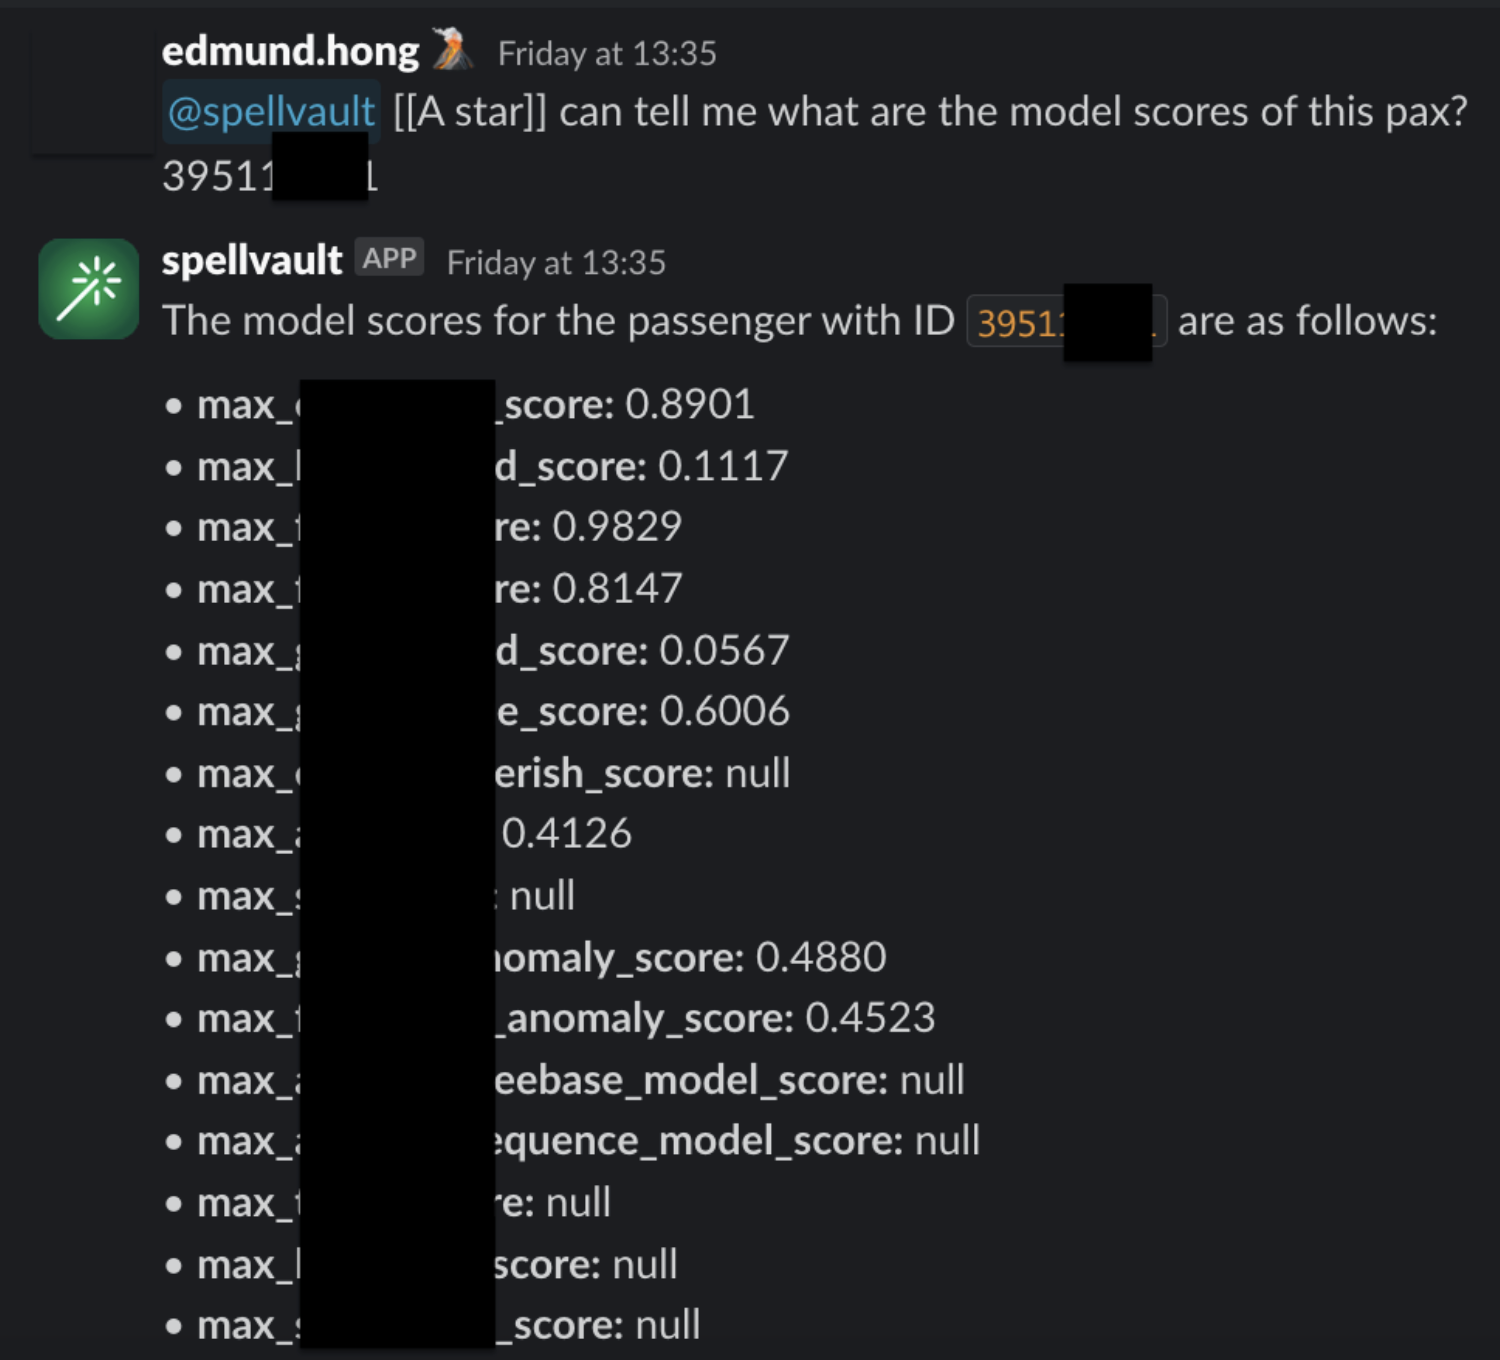
Figure 5 shows a sample of fraud investigation responses from A* bot. Scaling to multiple queries for a fraud investigation process, what was once a time-consuming fraud investigation can now be reduced to a matter of minutes, as the A* bot is capable of providing all the necessary information simultaneously.
Figure 5. Sample of fraud investigation responses.
RAG vs fine-tuning
On deciding between RAG or fine-tuning to improve LLM accuracy, three key factors tipped the scales in favour of the RAG approach:
Effort and cost considerations
Fine-tuning requires significant computational cost as it involves taking a base model and further training it with smaller, domain specific data and context. RAG is computationally less expensive as it relies on retrieving only relevant data and context to augment a model’s response. As the same base model can be used for different use cases, RAG is the preferred choice due to its flexibility and cost efficiency.
Ability to respond with the latest information
Fine-tuning requires model re-training with each new information update, whereas RAG simply retrieves required context and data from a knowledge base to enhance its response. Thus, by using RAG, LLM is able to answer questions using the most current information from our production database, eliminating the need for model re-training.
Speed and scalability
Without the burden of model re-training, the team can rapidly scale and build out new LLM applications with a well managed knowledge base.
What’s next?
The potential of using RAG-powered LLM can be limitless as the ability of GPT is correlated with the tools it equips. Hence, the process does not stop here and we will try to onboard more tools or integration to GPT. In the near future, we plan to utilise Data-Arks to provide images to GPT as GPT-4o is a multimodal model that has vision capabilities. We are committed to pushing the boundaries of what’s possible with RAG-powered LLM, and we look forward to unveiling the exciting advancements that lie ahead.
Figure 6. What’s next?
We would like to express our sincere gratitude to the following individuals and teams whose invaluable support and contributions have made this project a reality: – Meichen Lu, a senior data scientist at Grab, for her guidance and assistance in building the MVP and testing the concept. – The data engineering team, particularly Jia Long Loh and Pu Li, for setting up the necessary services and infrastructure.
Join us
Grab is the leading superapp platform in Southeast Asia, providing everyday services that matter to consumers. More than just a ride-hailing and food delivery app, Grab offers a wide range of on-demand services in the region, including mobility, food, package and grocery delivery services, mobile payments, and financial services across 700 cities in eight countries.
Powered by technology and driven by heart, our mission is to drive Southeast Asia forward by creating economic empowerment for everyone. If this mission speaks to you, join our team today!
Retrieval-Augmented Generation (RAG) is a powerful process that is designed to integrate direct function calling to answer queries more efficiently by retrieving relevant information from a broad database. In the rapidly evolving business landscape, Data Analysts (DAs) are struggling with the growing number of data queries from stakeholders. The conventional method of manually writing and running similar queries repeatedly is time-consuming and inefficient. This is where RAG-powered Large Language Models (LLMs) step in, offering a transformative solution to streamline the analytics process and empower DAs to focus on higher value tasks.
In this article, we will share how the Integrity Analytics team has built out a data solution using LLMs to help automate tedious analytical tasks like generating regular metric reports and performing fraud investigations.
While LLMs are known for their proficiency in data interpretation and insight generation, they represent just a fragment of the entire solution. For a comprehensive solution, LLMs must be integrated with other essential tools. The following is required in assembling a solution:
Internally facing LLM tool – Spellvault is a platform within Grab that stores, shares, and refines LLM prompts. It features low/no-code RAG capabilities that lower the barrier of entry for people to create LLM applications.
Data – with real time or close to real-time latency to ensure accuracy. It has to be in a standardised format to ensure that all LLM data inputs are accurate.
Scheduler – runs LLM applications at regular intervals. Useful for automating routine tasks.
Messaging Tool – a user interface where users can interact with LLM by entering a command to receive reports and insights.
Introducing Data-Arks, the data middleware serving up relevant data to the LLM agents
For most data use cases, DAs are usually running the same set of SQL queries with minor changes to parameters like dates, age or other filter conditions. In most instances, we already have a clear understanding of the required data and format to accomplish a task. Therefore, we need a tool that can execute the exact SQL query and channel the data output to the LLM.
Figure 1. Data-Arks hosts various APIs which can be called to serve data to applications like SpellVault.
What is Data-Arks?
Data-Arks is an in-house Python-based API platform housing several frequently used SQL queries and python functions packaged into individual APIs. Data-Arks is also integrated with Slack, Wiki, and JIRA APIs, allowing users to parse and fetch information and data from these tools as well. The benefits of Data-Arks are summarised as follows:
Integration: Data-Arks service allows users to upload any SQL query or Python script on the platform. These queries are then surfaced as APIs, which can be called to serve data to the LLM agent.
Versatility: Data-Arks can be extended to everyone. Employees from various teams and functions at Grab can self-serve to upload any SQL query that they want onto the platform, allowing this tool to be used for different teams’ use cases.
Automating regular report generation and summarisation using Data-Arks and Spellvault
LLMs are just one piece of the puzzle, to build a comprehensive solution, they must be integrated with other tools. Figure 2 shows how different tools are used in executing report summaries in Slack.
Figure 2 shows how different tools are used in executing report summaries in Slack.
Figure 2. Report Summarizer uses various tools to summarise queries and deliver a summarised report through Slack.
Figure 3 is an example of a summarised report generated by the Report Summarizer using dummy data. Report Summarizer calls a Data-Arks API to generate the data in a tabular format and LLM helps summarise and generate a short paragraph of key insights. This automated report generation has helped save an estimated 3-4 hours per report.
Figure 3. Sample of a report generated using dummy data extracted from [https://data.gov.my/](https://data.gov.my/).
LLM bots for fraud investigations
LLMs also excel in helping to streamline fraud investigations, as LLMs are able to contextualise several different data points and information and derive useful insights from them.
Introducing A* bot, the team’s very own LLM fraud investigation helper.
A set of frequently used queries for fraud investigation is made available as Data-Arks APIs. Upon a user prompt or query, SpellVault selects the most relevant queries using RAG, executes them and provides a summary of the results to users through Slack.
Figure 4. A* bot uses Data-Arks and Spellvault to get information for fraud investigations.
Figure 5 shows a sample of fraud investigation responses from A* bot. Scaling to multiple queries for a fraud investigation process, what was once a time-consuming fraud investigation can now be reduced to a matter of minutes, as the A* bot is capable of providing all the necessary information simultaneously.
Figure 5. Sample of fraud investigation responses.
RAG vs fine-tuning
On deciding between RAG or fine-tuning to improve LLM accuracy, three key factors tipped the scales in favour of the RAG approach:
Effort and cost considerations
Fine-tuning requires significant computational cost as it involves taking a base model and further training it with smaller, domain specific data and context. RAG is computationally less expensive as it relies on retrieving only relevant data and context to augment a model’s response. As the same base model can be used for different use cases, RAG is the preferred choice due to its flexibility and cost efficiency.
Ability to respond with the latest information
Fine-tuning requires model re-training with each new information update, whereas RAG simply retrieves required context and data from a knowledge base to enhance its response. Thus, by using RAG, LLM is able to answer questions using the most current information from our production database, eliminating the need for model re-training.
Speed and scalability
Without the burden of model re-training, the team can rapidly scale and build out new LLM applications with a well managed knowledge base.
What’s next?
The potential of using RAG-powered LLM can be limitless as the ability of GPT is correlated with the tools it equips. Hence, the process does not stop here and we will try to onboard more tools or integration to GPT. In the near future, we plan to utilise Data-Arks to provide images to GPT as GPT-4o is a multimodal model that has vision capabilities. We are committed to pushing the boundaries of what’s possible with RAG-powered LLM, and we look forward to unveiling the exciting advancements that lie ahead.
Figure 6. What’s next?
We would like to express our sincere gratitude to the following individuals and teams whose invaluable support and contributions have made this project a reality: – Meichen Lu, a senior data scientist at Grab, for her guidance and assistance in building the MVP and testing the concept. – The data engineering team, particularly Jia Long Loh and Pu Li, for setting up the necessary services and infrastructure.
Join us
Grab is the leading superapp platform in Southeast Asia, providing everyday services that matter to consumers. More than just a ride-hailing and food delivery app, Grab offers a wide range of on-demand services in the region, including mobility, food, package and grocery delivery services, mobile payments, and financial services across 700 cities in eight countries.
Powered by technology and driven by heart, our mission is to drive Southeast Asia forward by creating economic empowerment for everyone. If this mission speaks to you, join our team today!
In a previous blog, we introduced Trident, Grab’s internal marketing campaign platform. Trident empowers our marketing team to configure If This, Then That (IFTTT) logic and processes real-time events based on that.
While we mainly covered how we scaled up the system to handle large volumes of real-time events, we did not explain the implementation of the event processing mechanism. This blog will fill up this missing piece. We will walk you through the various processing mechanisms supported in Trident and how they were built.
Base building block: Treatment
In our system, we use the term “treatment” to refer to the core unit of a full IFTTT data structure. A treatment is an amalgamation of three key elements – an event, conditions (which are optional), and actions. For example, consider a promotional campaign that offers “100 GrabPoints for completing a ride paid with GrabPay Credit”. This campaign can be transformed into a treatment in which the event is “ride completion”, the condition is “payment made using GrabPay Credit”, and the action is “awarding 100 GrabPoints”.
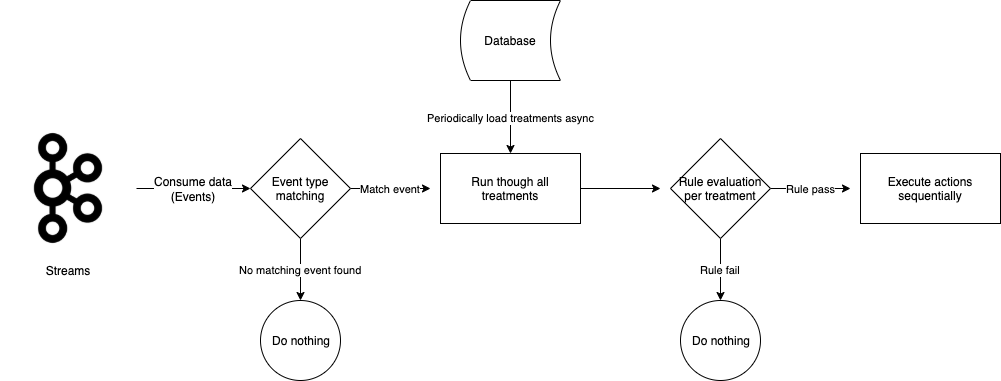
Data generated across various Kafka streams by multiple services within Grab forms the crux of events and conditions for a treatment. Trident processes these Kafka streams, treating each data object as an event for the treatments. It evaluates the set conditions against the data received from these events. If all conditions are met, Trident then executes the actions.
Figure 1. Trident processes Kafka streams as events for treatments.
When the Trident user interface (UI) was first established, campaign creators had to grasp the treatment concept and configure the treatments accordingly. As we improved the UI, it became more user-friendly.
Building on top of treatment
Campaigns can be more complex than the example we provided earlier. In such scenarios, a single campaign may need transformation into several treatments. All these individual treatments are categorised under what we refer to as a “treatment group”. In this section, we discuss features that we have developed to manage such intricate campaigns.
Counter
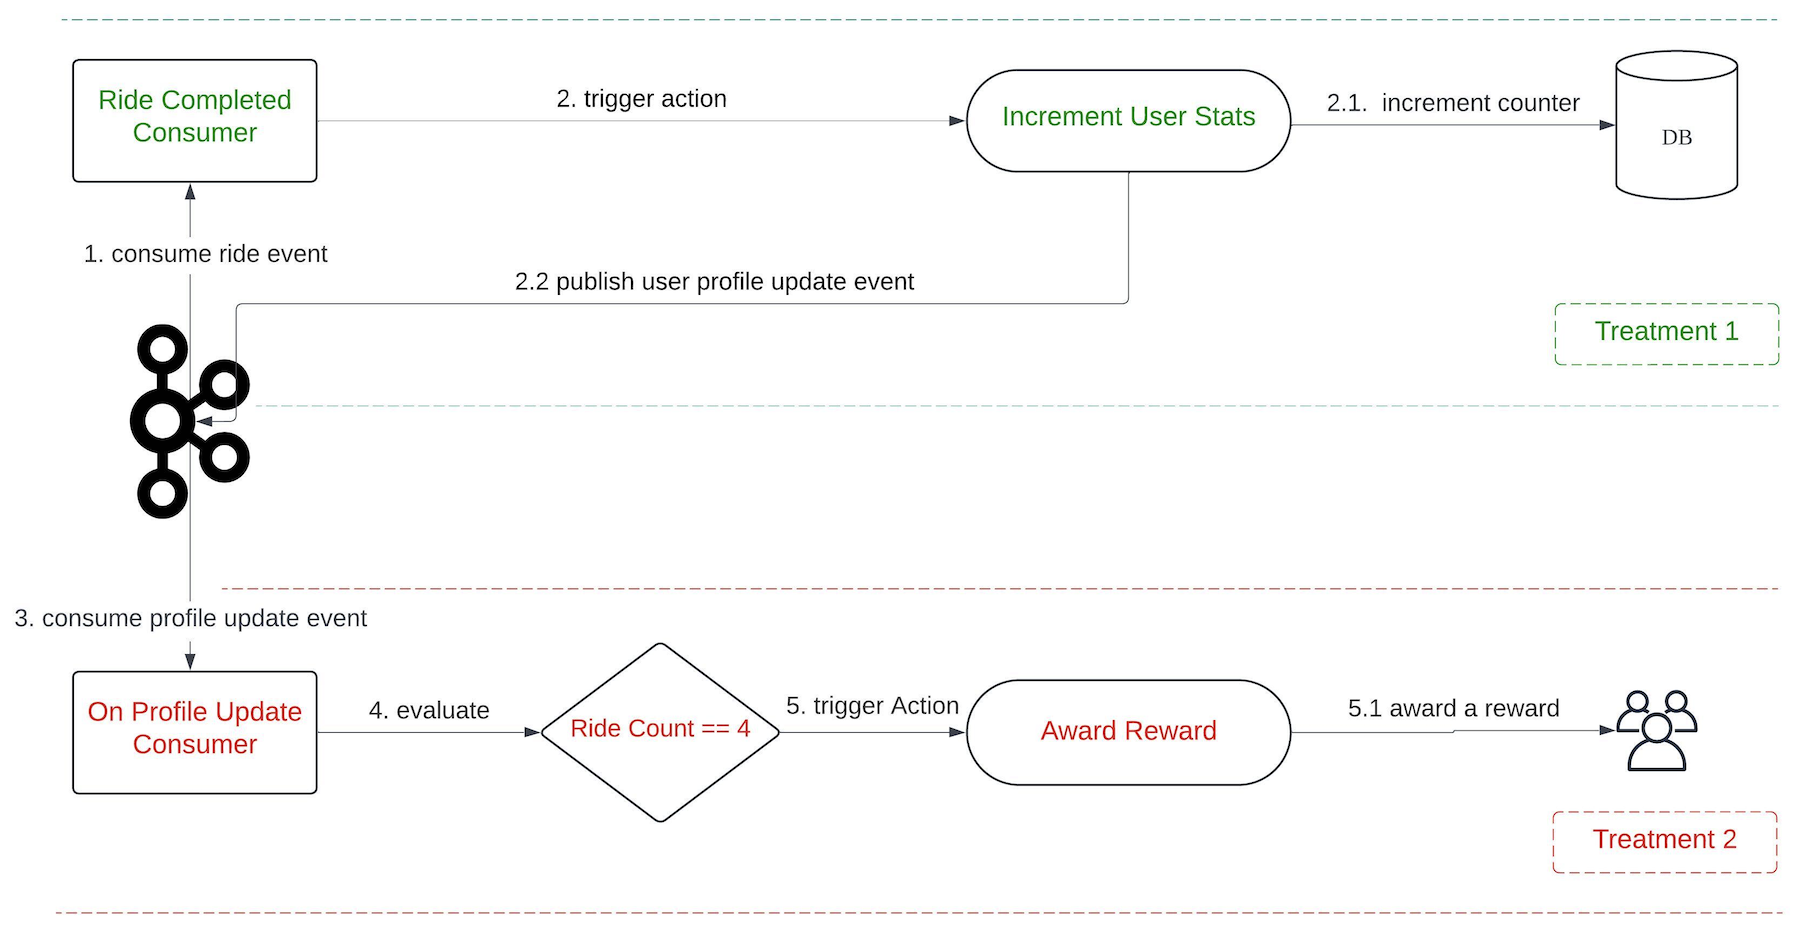
Let’s say we have a marketing campaign that “rewards users after they complete 4 rides”. For this requirement, it’s necessary for us to keep track of the number of rides each user has completed. To make this possible, we developed a capability known as counter.
On the backend, a single counter setup translates into two treatments.
Treatment 1:
Event: onRideCompleted
Condition: N/A
Action: incrementUserStats
Treatment 2:
Event: onProfileUpdate
Condition: Ride Count == 4
Action: awardReward
In this feature, we introduce a new event, onProfileUpdate. The incrementUserStats action in Treatment 1 triggers the onProfileUpdate event following the update of the user counter. This allows Treatment 2 to consume the event and perform subsequent evaluations.
Figure 2. The end-to-end evaluation process when using the Counter feature.
When the onRideCompleted event is consumed, Treatment 1 is evaluated which then executes the incrementUserStat action. This action increments the user’s ride counter in the database, gets the latest counter value, and publishes an onProfileUpdate event to Kafka.
There are also other consumers that listen to onProfileUpdate events. When this event is consumed, Treatment 2 is evaluated. This process involves verifying whether the Ride Count equals to 4. If the condition is satisfied, the awardReward action is triggered.
This feature is not limited to counting the number of event occurrences only. It’s also capable of tallying the total amount of transactions, among other things.
Delay
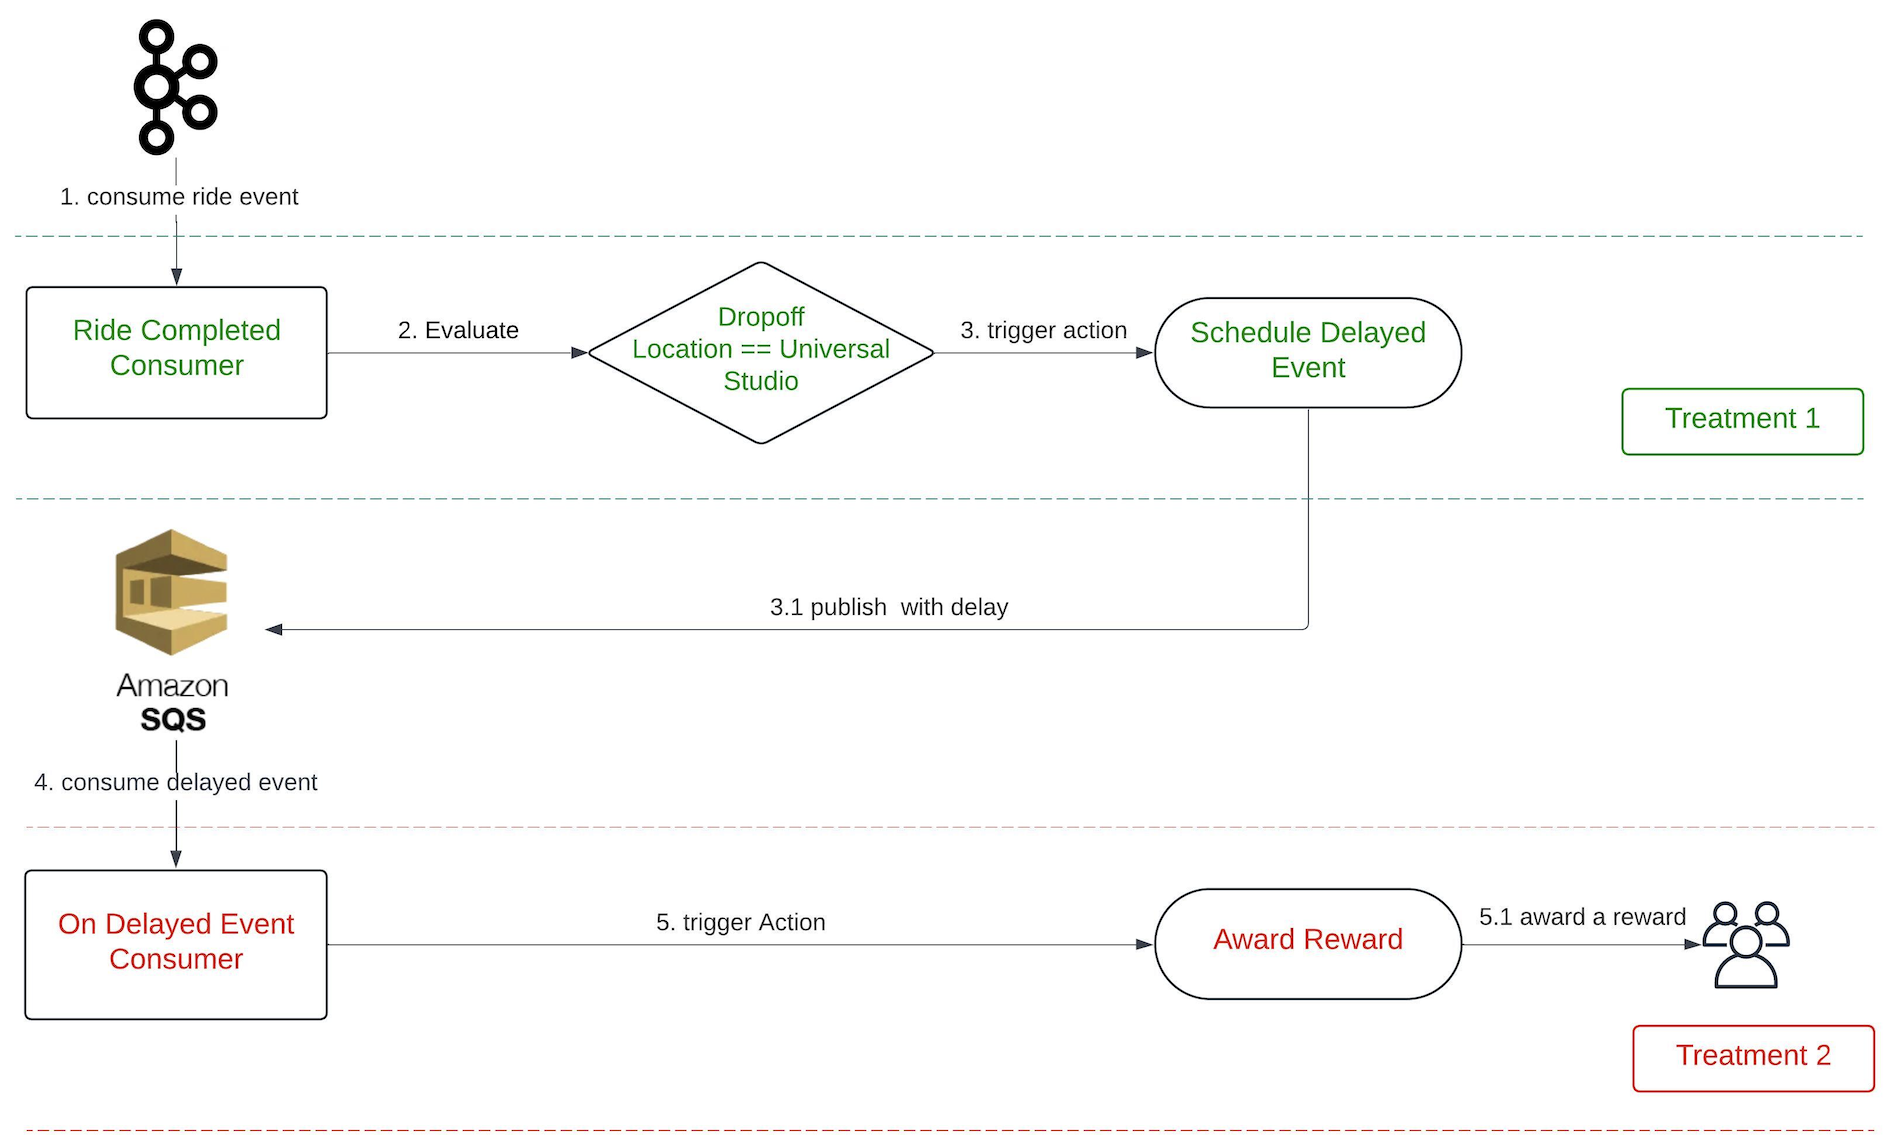
Another feature available on Trident is a delay function. This feature is particularly beneficial in situations where we want to time our actions based on user behaviour. For example, we might want to give a ride voucher to a user three hours after they’ve ordered a ride to a theme park. The intention for this is to offer them a voucher they can use for their return trip.
On the backend, a delay setup translates into two treatments. Given the above scenario, the treatments are as follows:
Treatment 1:
Event: onRideCompleted
Condition: Dropoff Location == Universal Studio
Action: scheduleDelayedEvent
Treatment 2:
Event: onDelayedEvent
Condition: N/A
Action: awardReward
We introduce a new event, onDelayedEvent, which Treatment 1 triggers during the scheduleDelayedEvent action. This is made possible by using Simple Queue Service (SQS), given its built-in capability to publish an event with a delay.
Figure 3. The end-to-end evaluation process when using the Delay feature.
The maximum delay that SQS supports is 15 minutes; meanwhile, our platform allows for a delay of up to x hours. To address this limitation, we publish the event multiple times upon receiving the message, extending the delay by another 15 minutes each time, until it reaches the desired delay of x hours.
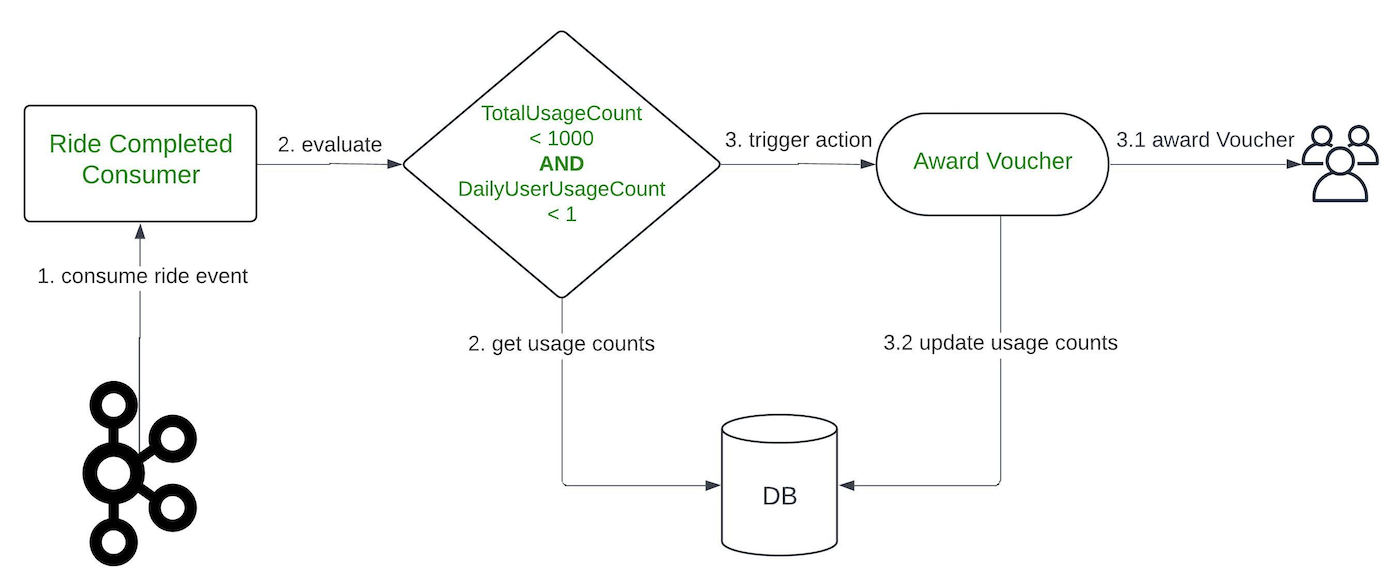
Limit
The Limit feature is used to restrict the number of actions for a specific campaign or user within that campaign. This feature can be applied on a daily basis or for the full duration of the campaign.
For instance, we can use the Limit feature to distribute 1000 vouchers to users who have completed a ride and restrict it to only one voucher for one user per day. This ensures a controlled distribution of rewards and prevents a user from excessively using the benefits of a campaign.
In the backend, a limit setup translates into conditions within a single treatment. Given the above scenario, the treatment would be as follows:
Event: onRideCompleted
Condition: TotalUsageCount <= 1000 AND DailyUserUsageCount <= 1
Action: awardReward
Similar to the Counter feature, it’s necessary for us to keep track of the number of completed rides for each user in the database.
Figure 4. The end-to-end evaluation process when using the Limit feature.
A better campaign builder
As our campaigns grew more and more complex, the treatment creation quickly became overwhelming. A complex logic flow often required the creation of many treatments, which was cumbersome and error-prone. The need for a more visual and simpler campaign builder UI became evident.
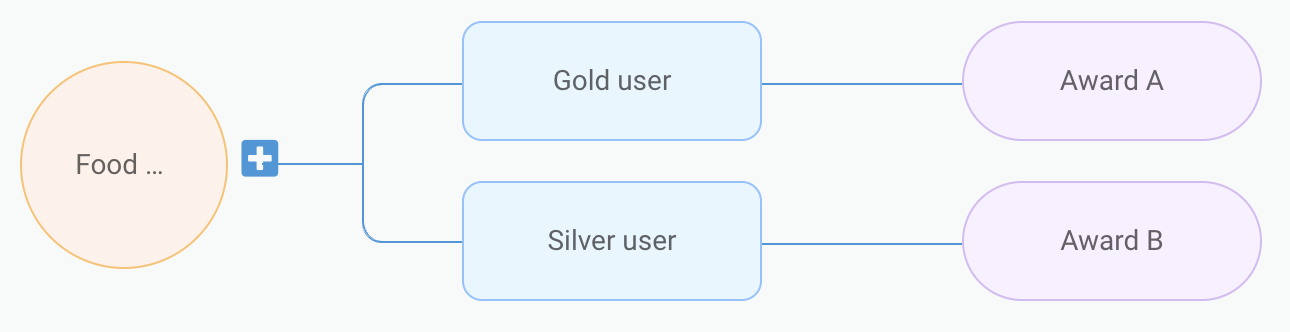
Our design team came up with a flow-chart-like UI. Figure 5, 6, and 7 show examples of how certain imaginary campaign setup would look like in the new UI.
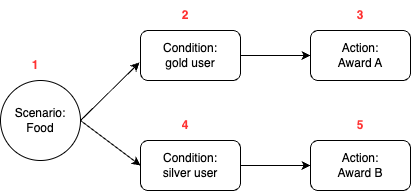
Figure 5. When users complete a food order, if they are a gold user, award them with A. However, if they are a silver user, award them with B.
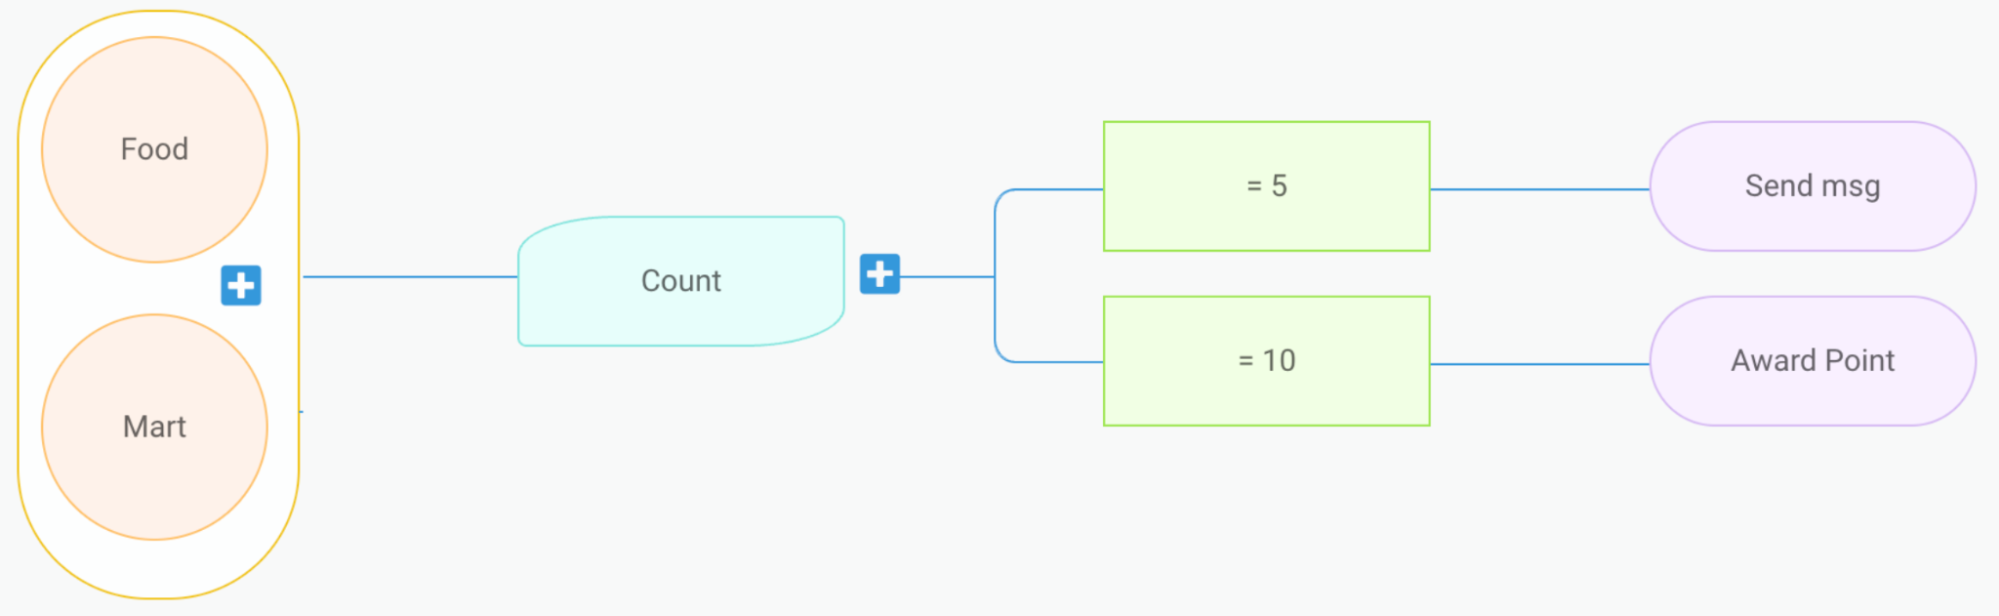
Figure 6. When users complete a food or mart order, increment a counter. When the counter reaches 5, send them a message. Once the counter reaches 10, award them with points.
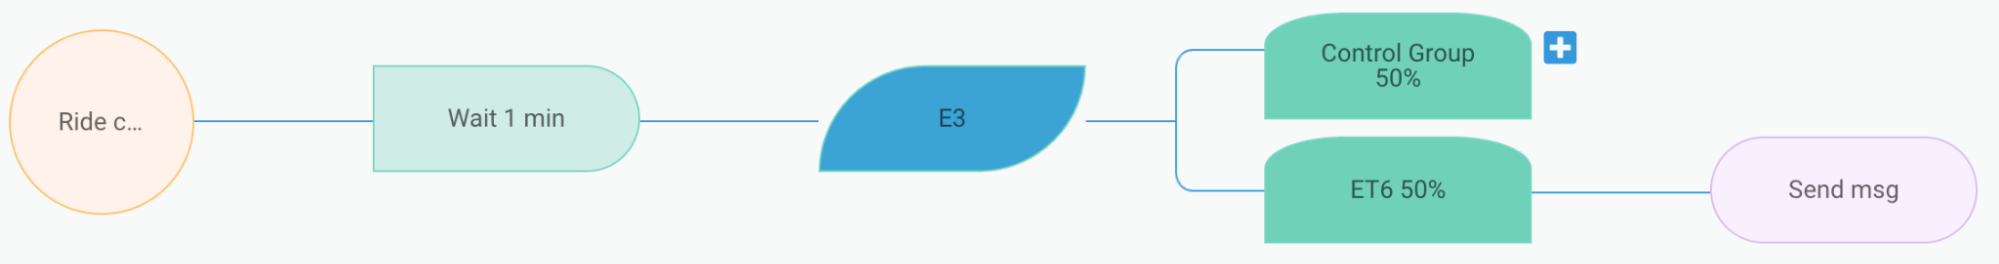
Figure 7. When a user confirms a ride booking, wait for 1 minute, and then conduct A/B testing by sending a message 50% of the time.
The campaign setup in the new UI can be naturally stored as a node tree structure. The following is how the example in figure 5 would look like in JSON format. We assign each node a unique number ID, and store a map of the ID to node content.
The question then arises, how do we execute this node tree as treatments? This requires a conversion process. We then developed the following algorithm for converting the node tree into equivalent treatments:
// convertToTreatments is the main function
func convertToTreatments(rootNode) -> []Treatment:
  output = []

  for each scenario in rootNode.scenarios:
    // traverse down each branch
    context = createConversionContext(scenario)
    for child in rootNode.children:
      treatments = convertHelper(context, child)
      output.append(treatments)

  return output

// convertHelper is a recursive helper function
func convertHelper(context, node) -> []Treatment:
  output = []
  f = getNodeConverterFunc(node.type)
  treatments, updatedContext = f(context, node)

  output.append(treatments)

  for child in rootNode.children:
    treatments = convertHelper(updatedContext, child)
    output.append(treatments)

  return output
The getNodeConverterFunc will return different handler functions according to the node type. Each handler function will either update the conversion context, create treatments, or both.
Table 1. The handler logic mapping for each node type.
Node type
Logic
condition
Add conditions into the context and return the updated context.
action
Return a treatment with the event type, condition from the context, and the action itself.
delay
Return a treatment with the event type, condition from the context, and a scheduleDelayedEvent action.
count
Return a treatment with the event type, condition from the context, and an incrementUserStats action.
count condition
Form a condition with the count key from the context, and return an updated context with the condition.
It is important to note that treatments cannot always be reverted to their original node tree structure. This is because different node trees might be converted into the same set of treatments.
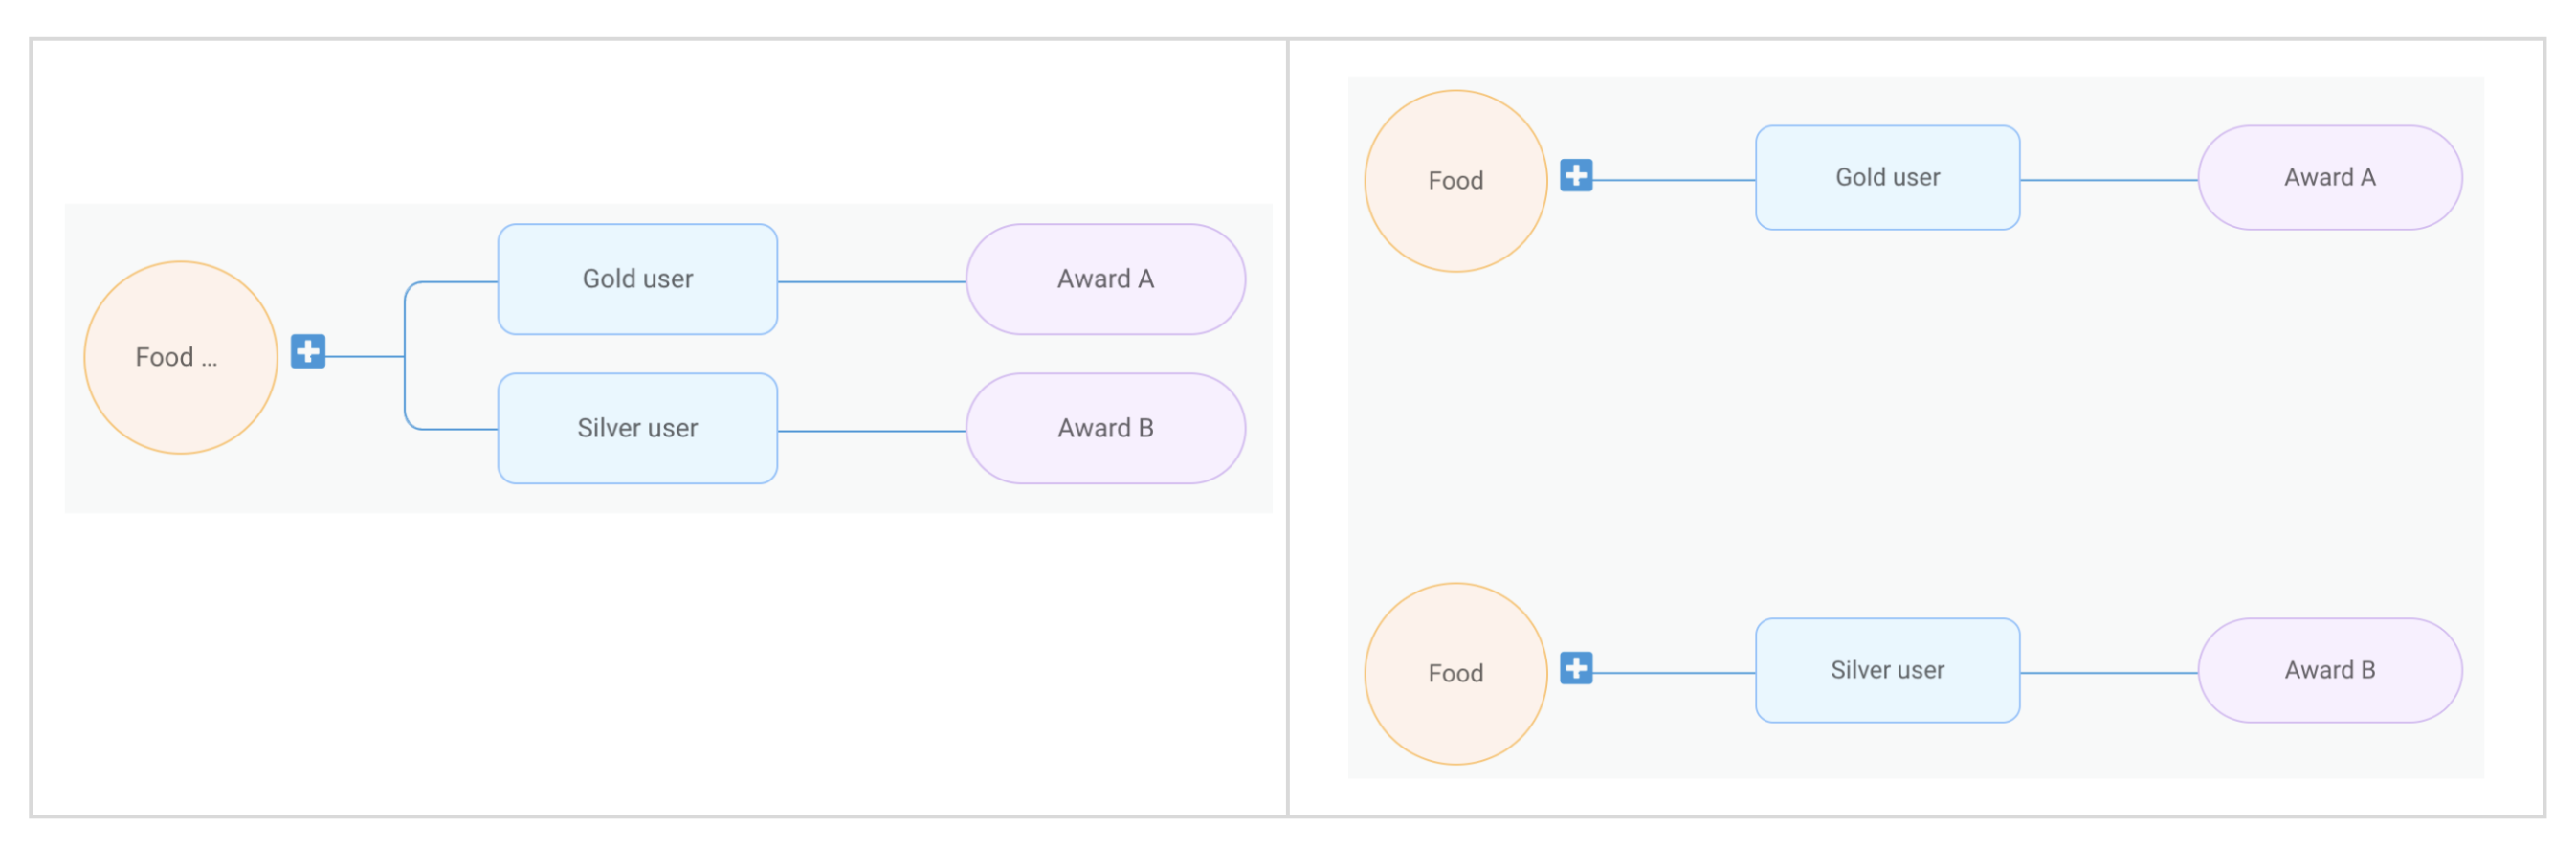
The following is an example where two different node trees setups correspond to the same set of treatments:
Food order complete -> if gold user -> then award A
Food order complete -> if silver user -> then award B
Figure 8. An example of two node tree setups corresponding to the the same set of treatments.
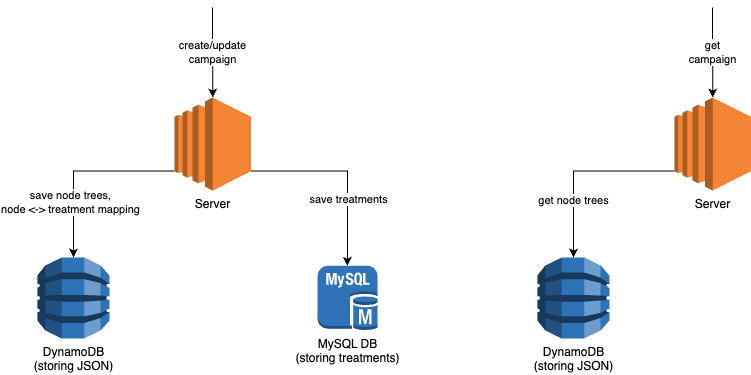
Therefore, we need to store both the campaign node tree JSON and treatments, along with the mapping between the nodes and the treatments. Campaigns are executed using treatments, but displayed using the node tree JSON.
Figure 9. For each campaign, we store both the node tree JSON and treatments, along with their mapping.
How we handle campaign updates
There are instances where a marketing user updates a campaign after its creation. For such cases we need to identify:
Which existing treatments should be removed.
Which existing treatments should be updated.
What new treatments should be added.
We can do this by using the node-treatment mapping information we stored. The following is the pseudocode for this process:
func howToUpdateTreatments(oldTreatments []Treatment, newTreatments []Treatment):
  treatmentsUpdate = map[int]Treatment // treatment ID -> updated treatment
  treatmentsRemove = []int // list of treatment IDs
  treatmentsAdd = []Treatment // list of new treatments to be created

  matchedOldTreamentIDs = set()

  for newTreatment in newTreatments:
    matched = false

    // see whether the nodes match any old treatment
    for oldTreatment in oldTreatments:
      // two treatments are considered matched if their linked node IDs are identical
      if isSame(oldTreatment.nodeIDs, newTreatment.nodeIDs):
        matched = true
        treatmentsUpdate[oldTreament.ID] = newTreatment
        matchedOldTreamentIDs.Add(oldTreatment.ID)
        break

    // if no match, that means it is a new treatment we need to create
    if not matched:
      treatmentsAdd.Append(newTreatment)

  // all the non-matched old treatments should be deleted
  for oldTreatment in oldTreatments:
    if not matchedOldTreamentIDs.contains(oldTreatment.ID):
      treatmentsRemove.Append(oldTreatment.ID)

  return treatmentsAdd, treatmentsUpdate, treatmentsRemove
For a visual illustration, let’s consider a campaign that initially resembles the one shown in figure 10. The node IDs are highlighted in red.
Figure 10. A campaign in node tree structure.
This campaign will generate two treatments.
Table 2. The campaign shown in the figure 10 will generated two treatments.
ID
Treatment
Linked node IDs
1
Event: food order complete Condition: gold user Action: award A
1, 2, 3
2
Event: food order complete Condition: silver user Action: award B
1, 4, 5
After creation, the campaign creator updates the upper condition branch, deletes the lower branch, and creates a new branch. Note that after node deletion, the deleted node ID will not be reused.
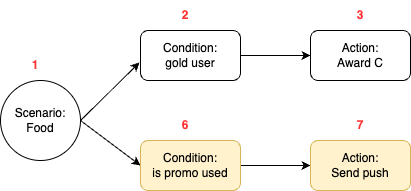
Figure 11. An updated campaign in node tree structure.
According to our logic in figure 11, the following update will be performed:
Update action for treatment 1 to “award C”.
Delete treatment 2
Create a new treatment: food -> is promo used -> send push
Conclusion
This article reveals the workings of Trident, our bespoke marketing campaign platform. By exploring the core concept of a “treatment” and additional features like Counter, Delay and Limit, we illustrated the flexibility and sophistication of our system.
We’ve explained changes to the Trident UI that have made campaign creation more intuitive. Transforming campaign setups into executable treatments while preserving the visual representation ensures seamless campaign execution and adaptation.
Our devotion to improving Trident aims to empower our marketing team to design engaging and dynamic campaigns, ultimately providing excellent experiences to our users.
Join us
Grab is the leading superapp platform in Southeast Asia, providing everyday services that matter to consumers. More than just a ride-hailing and food delivery app, Grab offers a wide range of on-demand services in the region, including mobility, food, package and grocery delivery services, mobile payments, and financial services across 700 cities in eight countries.
Powered by technology and driven by heart, our mission is to drive Southeast Asia forward by creating economic empowerment for everyone. If this mission speaks to you, join our team today!
Key to innovation and improvement in machine learning (ML) models is the ability for rapid iteration. Our team, Chimera, part of the Artificial Intelligence (AI) Platform team, provides the essential compute infrastructure, ML pipeline components, and backend services. This support enables our ML engineers, data scientists, and data analysts to efficiently experiment and develop ML solutions at scale.
With a commitment to leveraging the latest Generative AI (GenAI) technologies, Grab is enhancing productivity tools for all Grabbers. Our Chimera Sandbox, a scalable Notebook platform, facilitates swift experimentation and development of ML solutions, offering deep integration with our AI Gateway. This enables easy access to various Large Language Models (LLMs) (both proprietary and open source), ensuring scalability, compliance, and access control are managed seamlessly.
What is Chimera Sandbox?
Chimera Sandbox is a Notebook service platform. It allows users to launch multiple notebook and visualisation services for experimentation and development. The platform offers an extremely quick onboarding process enabling any Grabber to start learning, exploring and experimenting in just a few minutes. This inclusivity and ease of use have been key in driving the adoption of the platform across different teams within Grab and empowering all Grabbers to be GenAI-ready.
One significant challenge in harnessing ML for innovation, whether for technical experts or non-technical enthusiasts, has been the accessibility of resources. This includes GPU instances and specialised services for developing LLM-powered applications. Chimera Sandbox addresses this head-on by offering an extensive array of compute instances, both with and without GPU support, thus removing barriers to experimentation. Its deep integration with Grab’s suite of internal ML tools transforms the way users approach ML projects. Users benefit from features like hyperparameter tuning, tracking ML training metadata, accessing diverse LLMs through Grab’s AI Gateway, and experimenting with rich datasets from Grab’s data lake. Chimera Sandbox ensures that users have everything they need at their fingertips. This ecosystem not only accelerates the development process but also encourages innovative approaches to solving complex problems.
The underlying compute infrastructure of the Chimera Sandbox platform is Grab’s very own battle-tested, highly scalable ML compute infrastructure running on multiple Kubernetes clusters. Each cluster can scale up to thousands of nodes at peak times gracefully. This scalability ensures that the platform can handle the high computational demands of ML tasks. The robustness of Kubernetes ensures that the platform remains stable, reliable, and highly available even under heavy load. At any point in time, there can be hundreds of data scientists, ML engineers and developers experimenting and developing on the Chimera Sandbox platform.
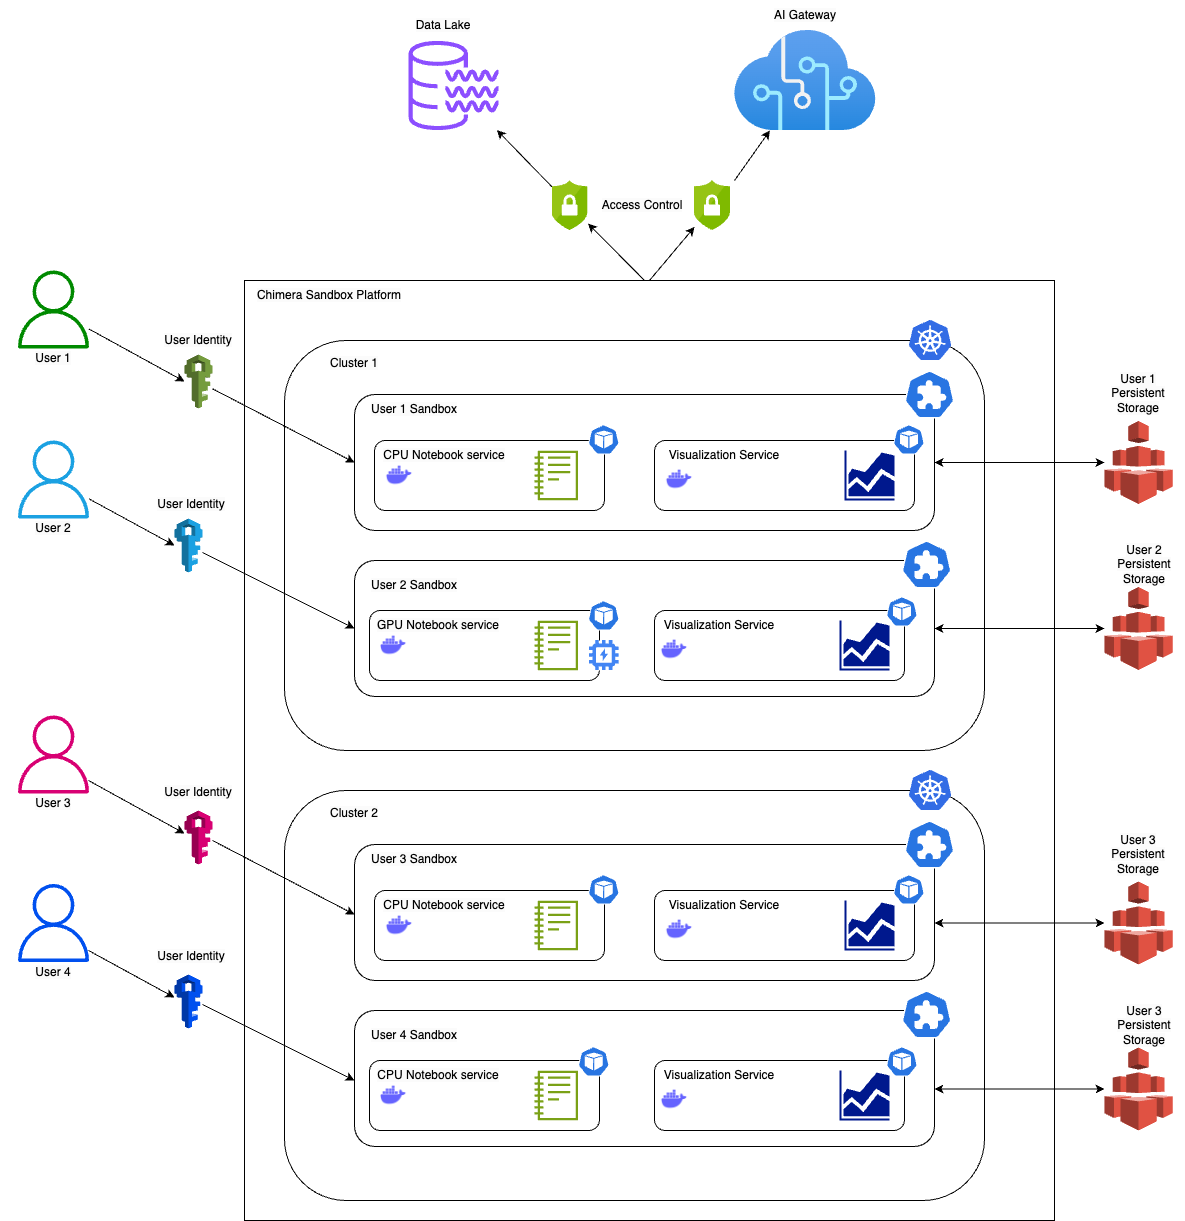
Figure 1. Chimera Sandbox Platform.
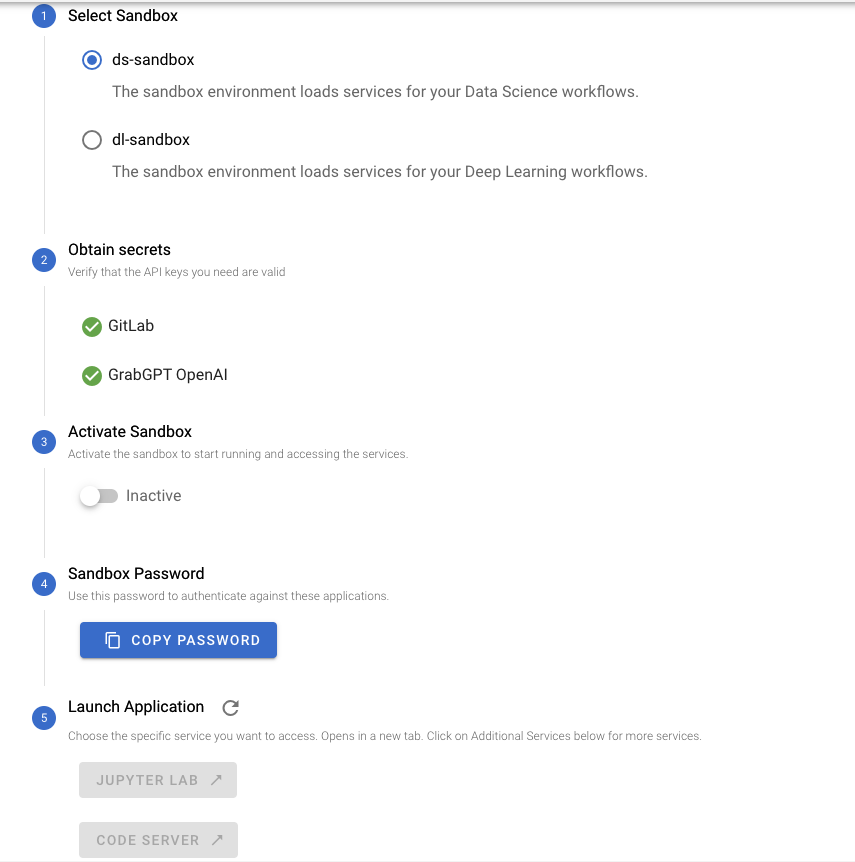
Figure 2. UI for Starting Chimera Sandbox.
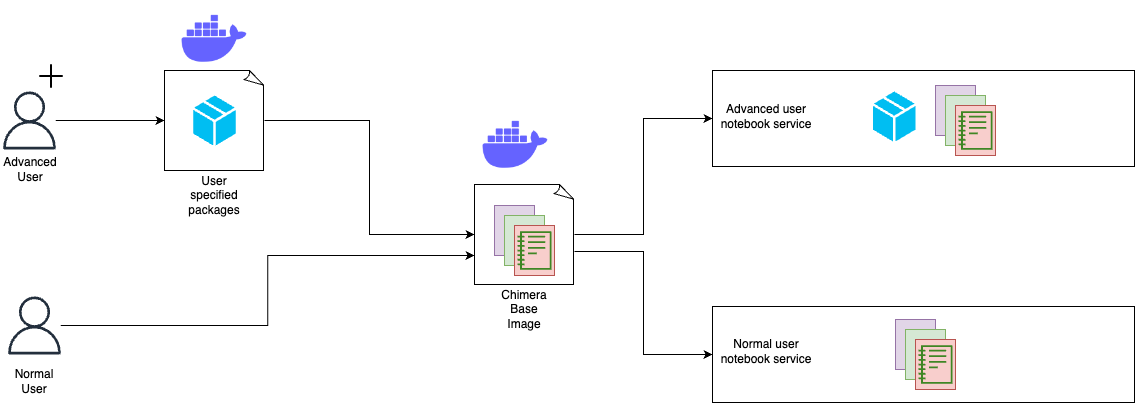
Best of both worlds
Chimera Sandbox is suitable for both new users who want to explore and experiment ML solutions and advanced users who want to have full control over the Notebook services they run. Users can launch Notebook services using default Docker images provided by the Chimera Sandbox platform. These images come pre-loaded with popular data science and ML libraries and various Grab internal systems integrations. Chimera also provides basic Docker images from which the users can use as base images to build their own customised Notebook service Docker images. Once the images are built, the users can configure their Notebook services to use their custom Docker images. This ensures their Notebook environment can be exactly the way they want them to be.
Figure 3. Users are able to customise their Notebook service with additional packages.
Real-time collaboration
The Chimera Sandbox platform also features a real-time collaboration feature. This feature fosters a collaborative environment where users can exchange ideas and work together on projects.
CPU and GPU choices
Chimera Sandbox offers a wide variety of CPU and GPU choices to cater to specific needs, whether it is a CPU, memory, or GPU intensive experimentation. This flexibility allows users to choose the most suitable computational resources for their tasks, ensuring optimal performance and efficiency.
Deep integration with Spark
The platform is deeply integrated with internal Spark engines, enabling users to experiment building extract, transform, and load (ETL) jobs with data from Grab’s data lake. Integrated helpers such as SparkConnect Kernel and %%spark_sql magic cell, provide a faster developer experience, which can execute Spark SQL queries without needing to write additional code to start a Spark session and query.
Figure 4. %%spark_sql magic cell enables users to quickly explore data with Spark.
In addition to Magic Cell, the Chimera Sandbox offers advanced Spark functionalities. Users can write PySpark code using pre-configured and configurable Spark clients in the runtime environment. The underlying computation engine leverages Grab’s custom Spark-on-Kubernetes operator, enabling support for large-scale Spark workloads. This high-code capability complements the low-code Magic Cell feature, providing users with a versatile data processing environment.
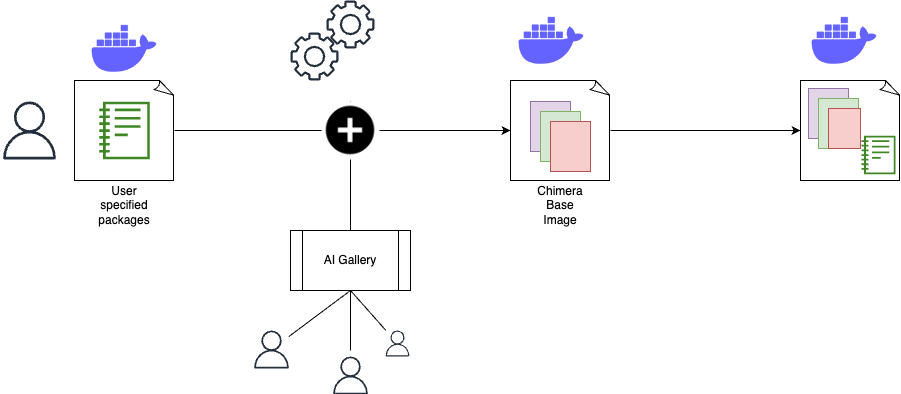
AI Gallery
Chimera Sandbox features an AI Gallery to guide and accelerate users to start experimenting with ML solutions or building GenAI-powered applications. This is especially useful for new or novice users who are keen to explore what they can do on the Chimera Sandbox platform. With Chimera Sandbox, users are not just presented with a bare bones compute solution but rather are provided with ways to do ML tasks right from Chimera Sandbox Notebooks. This approach saves users from the hassle of having to piece together the examples from the public internet, which may not work on the platform. These ready-to-run and comprehensive notebooks in the AI Gallery assure users that they can run end-to-end examples without a hitch. Based on these examples, the users can only extend their experimentations and development for their specific needs. Not only that, these tutorials and notebooks exhibit the platform capabilities and integrations available on the platform in an interactive manner rather than having the users refer to a separate documentation.
Lastly, the AI Gallery encourages contributions from other Grabbers, fostering a collaborative environment. Users who are enthusiastic about creating educational contents on Chimera Sandbox can effectively share their work with other Grabbers.
Figure 5. Including AI Gallery in user specified sandbox images.
Integration with various LLM services
Notebook users on Chimera Sandbox can easily tap into a plethora of LLMs, both open source and proprietary models, without any additional setup via our AI Gateway. The platform takes care of access mechanisms and endpoints for various LLM services so that the users can easily use their favourite libraries to create LLM-powered applications and conduct experimentations. This seamless integration with LLMs enables users to focus on their GAI-powered ideas rather than having to worry about underlying logistics and technicalities of using different LLMs.
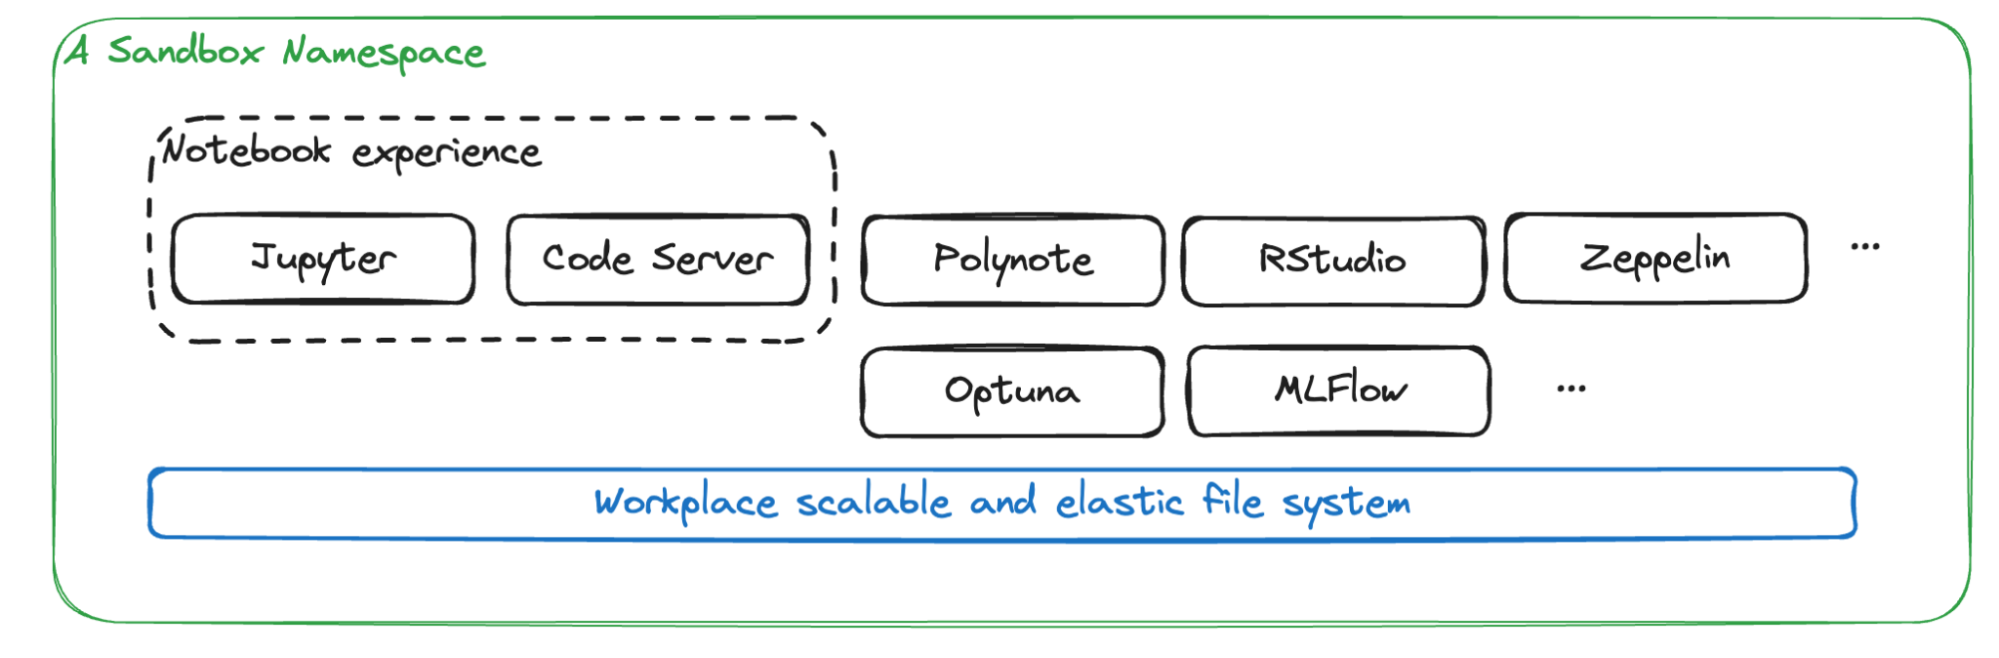
More than a notebook service
While Notebook is the most popular service on the platform, Chimera Sandbox offers much more than just notebook capabilities. It serves as a comprehensive namespace workspace equipped with a suite of ML/AI tools. Alongside notebooks, users can access essential ML tools such as Optuna for hyperparameter tuning, MLflow for experiment tracking, and other tools including Zeppelin, RStudio, Spark history, Polynote, and LabelStudio. All these services use a shared storage system, creating a tailored workspace for ML and AI tasks.
Figure 6. A Sandbox namespace with its out-of-the-box services.
Additionally, the Sandbox framework allows for the seamless integration of more services into personal workspaces. This high level of flexibility significantly enhances the capabilities of the Sandbox platform, making it an ideal environment for diverse ML and AI applications.
Cost attribution
For a multi-tenanted platform such as Chimera Sandbox, it is crucial to provide users information on how much they have spent with their experimentations. Cost showback and chargeback capabilities are of utmost importance for a platform on which users can launch Notebook services that use accelerated instances with GPUs. The platform provides cost attribution to individual users, so each user knows exactly how much they are spending on their experimentations and can make budget-conscious decisions. This transparency in cost attribution encourages responsible usage of resources and helps users manage their budgets effectively.
Growth and future plans
In essence, Chimera Sandbox is more than just a tool; it’s a catalyst for innovation and growth, empowering Grabbers to explore the frontiers of ML and AI. By providing an inclusive, flexible, and powerful platform, Chimera Sandbox is helping shape the future of Grab, making every Grabber not just ready but excited to contribute to the AI-driven transformation of our products and services.
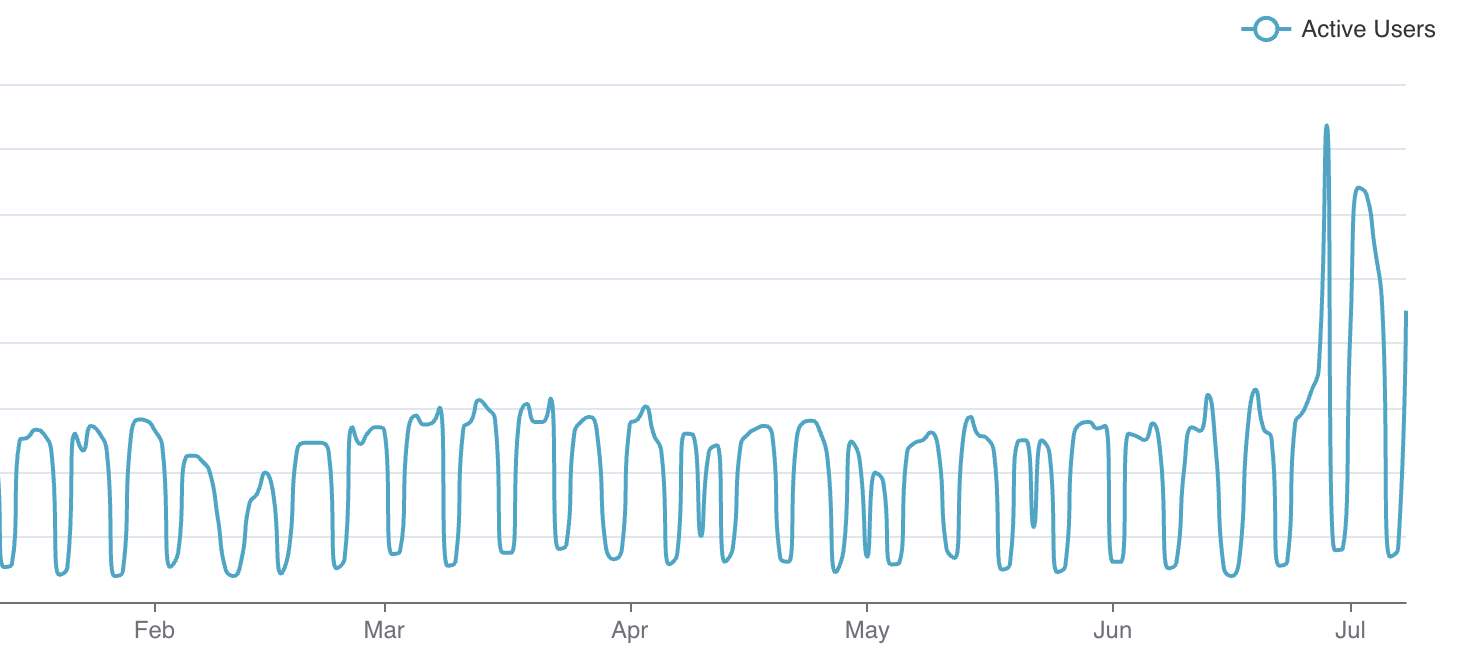
In July and August of this year, teams were given the opportunity to intensively learn and experiment with AI. Since then, we have observed hockey stick growth on the Chimera Sandbox platform. We are enabling massive experimentation across different teams at Grab to experiment and work on different GAI-powered applications.
Figure 7. Chimera Sandbox daily active users.
Our future plans include mechanisms for better notebook discovery, collaboration and usability, and the ability to enable users to schedule their notebooks right from Chimera Sandbox. These enhancements aim to improve the user experience and make the platform even more versatile and powerful.
Join us
Grab is the leading superapp platform in Southeast Asia, providing everyday services that matter to consumers. More than just a ride-hailing and food delivery app, Grab offers a wide range of on-demand services in the region, including mobility, food, package and grocery delivery services, mobile payments, and financial services across 700 cities in eight countries.
Powered by technology and driven by heart, our mission is to drive Southeast Asia forward by creating economic empowerment for everyone. If this mission speaks to you, join our team today!
This article introduces the GrabX Decision Engine, an internal open-source package that offers a comprehensive framework for designing and analysing experiments conducted on online experiment platforms. The package encompasses a wide range of functionalities, including a pre-experiment advisor, a post-experiment analysis toolbox, and other advanced tools. In this article, we explore the motivation behind the development of these functionalities, their integration into the unique ecosystem of Grab’s multi-sided marketplace, and how these solutions strengthen the culture and calibre of experimentation at Grab.
Background
Today, Grab’s Experimentation (GrabX) platform orchestrates the testing of thousands of experimental variants each week. As the platform continues to expand and manage a growing volume of experiments, the need for dependable, scalable, and trustworthy experimentation tools becomes increasingly critical for data-driven and evidence-based
decision-making.
In our previous article, we presented the Automated Experiment Analysis application, a tool designed to automate data pipelines for analyses. However, during the development of this application for Grab’s experimenter community, we noticed a prevailing trend: experiments were predominantly analysed on a one-by-one, manual basis. While such a federated approach may be needed in a few cases, it presents numerous challenges at
the organisational level:
Lack of a contextual toolkit: GrabX facilitates executing a diverse range of experimentation designs, catering to the varied needs and contexts of different tech teams across the organisation. However, experimenters may often rely on generic online tools for experiment configurations (e.g. sample size calculations), which were not specifically designed to cater to the nuances of GrabX experiments or the recommended evaluation method, given the design. This is exacerbated by the fact
that most online tutorials or courses on experimental design do not typically address the nuances of multi-sided marketplaces, and cannot consider the nature or constraints of specific experiments.
Lack of standards: In this federated model, the absence of standardised and vetted practices can lead to reliability issues. In some cases, these can include poorly designed experiments, inappropriate evaluation methods, suboptimal testing choices, and unreliable inferences, all of which are difficult to monitor and rectify.
Lack of scalability and efficiency: Experimenters, coming from varied backgrounds and possessing distinct skill sets, may adopt significantly different approaches to experimentation and inference. This diversity, while valuable, often impedes the transferability and sharing of methods, hindering a cohesive and scalable experimentation framework. Additionally, this variance in methods can extend the lifecycle of experiment analysis, as disagreements over approaches may give rise to
repeated requests for review or modification.
Solution
To address these challenges, we developed the GrabX Decision Engine, a Python package open-sourced internally across all of Grab’s development platforms. Its central objective is to institutionalise best practices in experiment efficiency and analytics, thereby ensuring the derivation of precise and reliable conclusions from each experiment.
In particular, this unified toolkit significantly enhances our end-to-end experimentation processes by:
Ensuring compatibility with GrabX and Automated Experiment Analysis: The package is fully integrated with the Automated Experiment Analysis app, and provides analytics and test results tailored to the designs supported by GrabX. The outcomes can be further used for other downstream jobs, e.g. market modelling, simulation-based calibrations, or auto-adaptive configuration tuning.
Standardising experiment analytics: By providing a unified framework, the package ensures that the rationale behind experiment design and the interpretation of analysis results adhere to a company-wide standard, promoting consistency and ease of review across different teams.
Enhancing collaboration and quality: As an open-source package, it not only fosters a collaborative culture but also upholds quality through peer reviews. It invites users to tap into a rich pool of features while encouraging contributions that refine and expand the toolkit’s capabilities.
The package is designed for everyone involved in the experimentation process, with data scientists and product analysts being the primary users. Referred to as experimenters in this article, these key stakeholders can not only leverage the existing capabilities of the package to support their projects, but can also contribute their own innovations. Eventually, the experiment results and insights generated from the package via the Automated Experiment Analysis app have an even wider reach to stakeholders across all functions.
In the following section, we go deeper into the key functionalities of the package.
Feature details
The package comprises three key components:
An experimentation trusted advisor
A comprehensive post-experiment analysis toolbox
Advanced tools
These have been built taking into account the type of experiments we typically run at Grab. To understand their functionality, it’s useful to first discuss the key experimental designs supported by GrabX.
A note on experimental designs
While there is a wide variety of specific experimental designs implemented, they can be bucketed into two main categories: a between-subject design and a within-subject design.
In a between-subject design, participants — like our app users, driver-partners, and merchant-partners — are split into experimental groups, and each group gets exposed to a distinct condition throughout the experiment. One challenge in this design is that each participant may provide multiple observations to our experimental analysis sample, causing a high within-subject correlation among observations and deviations between the randomisation and session unit. This can affect the accuracy of
pre-experiment power analysis, and post-experiment inference, since it necessitates adjustments, e.g. clustering of standard errors when conducting hypothesis testing.
Conversely, a within-subject design involves every participant experiencing all conditions. Marketplace-level switchback experiments are a common GrabX use case, where a timeslice becomes the experimental unit. This design not only faces the aforementioned challenges, but also creates other complications that need to be accounted for, such as spillover effects across timeslices.
Designing and analysing the results of both experimental approaches requires careful nuanced statistical tools. Ensuring proper duration, sample size, controlling for confounders, and addressing potential biases are important considerations to enhance the validity of the results.
Trusted Advisor
The first key component of the Decision Engine is the Trusted Advisor, which provides a recommendation to the experimenter on key experiment attributes to be considered when preparing the experiment. This is dependent on the design; at a minimum, the experimenter needs to define whether the experiment design is between- or within-subject.
The between-subject design: We strongly recommend that experimenters utilise the “Trusted Advisor” feature in the Decision Engine for estimating their required sample size. This is designed to account for the multiple observations per user the experiment is expected to generate and adjusts for the presence of clustered errors (Moffatt, 2020; List, Sadoff, & Wagner, 2011). This feature allows users to input their data, either as a PySpark or Pandas dataframe. Alternatively, a function is
provided to extract summary statistics from their data, which can then be inputted into the Trusted Advisor. Obtaining the data beforehand is actually not mandatory; users have the option to directly query the recommended sample size based on common metrics derived from a regular data pipeline job. These functionalities are illustrated in the flowchart below.
Trusted Advisor functionalities
Furthermore, the Trusted Advisor feature can identify the underlying characteristics of the data, whether it’s passed directly, or queried from our common metrics database. This enables it to determine the appropriate power analysis for the experiment, without further guidance. For instance, it can detect if the target metric is a binary decision variable, and will adapt the power analysis to the correct context.
The within-subject design: In this case, we instead provide a best practices guideline to follow. Through our experience supporting various Tech Families running switchback experiments, we have observed various challenges highly dependent on the use case. This makes it difficult to create a one-size-fits-all solution.
For instance, an important factor affecting the final sample size requirement is how frequently treatments switch, which is also tied to what data granularity is appropriate to use in the post-experiment analysis. These considerations are dependent on, among other factors, how quickly a given treatment is expected to cause an effect. Some treatments may take effect relatively quickly (near-instantly, e.g. if applied to price checks), while others may take significantly longer (e.g. 15-30 minutes because they may require a trip to be completed). This has further consequences, e.g. autocorrelation between observations within a treatment window, spillover effects between different treatment windows, requirements for cool-down windows when treatments switch, etc.
Another issue we have identified from analysing the history of experiments on our platform is that a significant portion is prone to issues related to sample ratio mismatch (SRM). We therefore also heavily emphasise the post-experiment analysis corrections and robustness checks that are needed in switchback experiments, and do not simply rely on pre-experiment guidance such as power analysis.
Post-experiment analysis
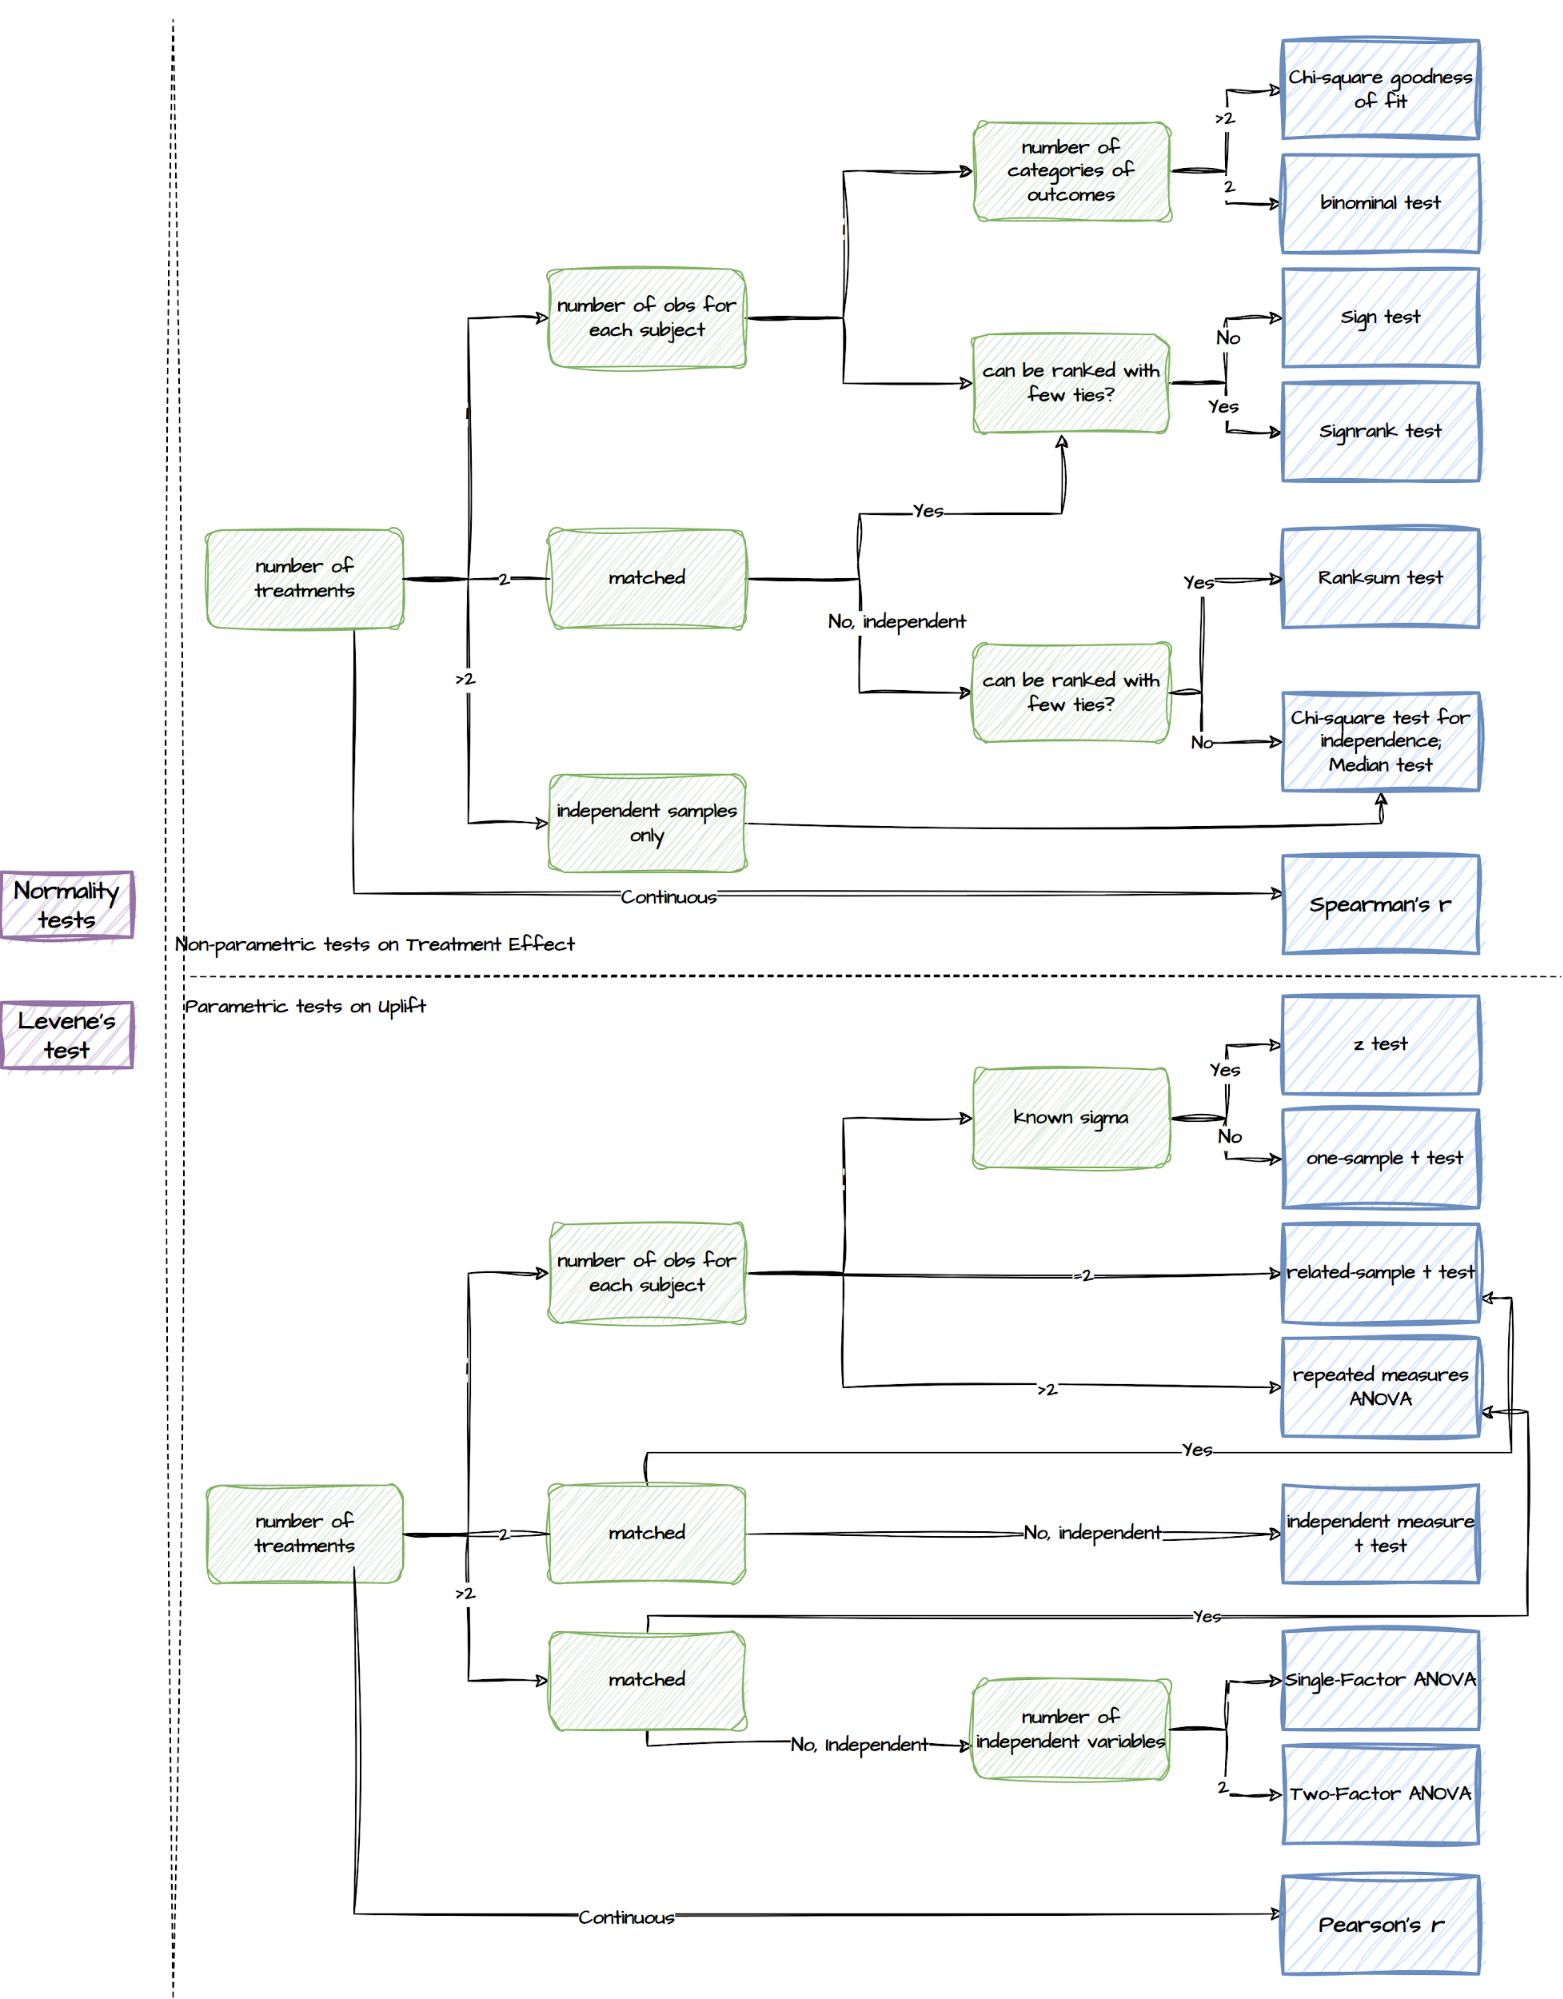
Upon completion of the experiment, a comprehensive toolbox for post-experiment analysis is available. This toolbox consists of a wide range of statistical tests, ranging from normality tests to non-parametric and parametric tests. Here is an overview of the different types of tests included in the toolbox for different experiment setups:
Tests supported by the post-experiment analysis component
Though we make all the relevant tests available, the package sets a default list of output. With just two lines of code specifying the desired experiment design, experimenters can easily retrieve the recommended results, as summarised in the following table.
Types
Details
Basic statistics
The mean, variance, and sample size of Treatment and Control
Uplift tests
Welch’s t-test; Non-parametric tests, such as Wilcoxon signed-rank test and Mann-Whitney U Test
Misc tests
Normality tests such as the Shapiro-Wilk test, Anderson-Darling test, and Kolmogorov-Smirnov test; Levene test which assesses the equality of variances between groups
Regression models
A standard OLS/Logit model to estimate the treatment uplift; Recommended regression models
Warning
Provides a warning or notification related to the statistical analysis or results, for example: – Lack of variation in the variables – Sample size is too small – Too few randomisation units which will lead to under-estimated standard errors
Recommended regression models
Besides reporting relevant statistical test results, we adopt regression models to leverage their flexibility in controlling for confounders, fixed effects and heteroskedasticity, as is commonly observed in our experiments. As mentioned in the section “A note on experimental design”, each approach has different implications on the achieved randomisation, and hence requires its own customised regression models.
Between-subject design: the observations are not independent and identically distributed (i.i.d) but clustered due to repeated observations of the same experimental units. Therefore, we set the default clustering level at the participant level in our regression models, considering that most of our between-subject experiments only take a small portion of the population (Abadie et al., 2022).
Within-subject design: this has further challenges, including spillover effects and randomisation imbalances. As a result, they often require better control of confounding factors. We adopt panel data methods and impose time fixed effects, with no option to remove them. Though users have the flexibility to define these themselves, we use hourly fixed effects as our default as we have found that these match the typical seasonality we observe in marketplace metrics. Similar to between-subject
designs, we use standard error corrections for clustered errors, and small number of clusters, as the default. Our API is flexible for users to include further controls, as well as further fixed effects to adapt the estimator to geo-timeslice designs.
Advanced tools
Apart from the pre-experiment Trusted Advisor and the post-experiment Analysis Toolbox, we have enriched this package by providing more advanced tools. Some of them are set as a default feature in the previous two components, while others are ad-hoc capabilities which the users can utilise via calling the functions directly.
Variance reduction
We bring in multiple methods to reduce variance and improve the power and sensitivity of experiments:
Stratified sampling: recognised for reducing variance during assignment
Post stratification: a post-assignment variance reduction technique
MLRATE: an extension of CUPED that allows for the use of non-linear / machine learning models
These approaches offer valuable ways to mitigate variance and improve the overall effectiveness of experiments. The experimenters can directly access these ad hoc capabilities via the package.
Multiple comparisons problem
A multiple comparisons problem occurs when multiple hypotheses are simultaneously tested, leading to a higher likelihood of false positives. To address this, we implement various statistical correction techniques in this package, as illustrated below.
Statistical correction techniques
Experimenters can specify if they have concerns about the dependency of the tests and whether the test results are expected to be negatively related. This capability will adopt the following procedures and choose the relevant tests to mitigate the risk of false positives accordingly:
False Discovery Rate (FDR) procedures, which control the expected rate of false discoveries.
Family-wise Error Rate (FWER) procedures, which control the probability of making at least one false discovery within a set of related tests referred to as a family.
Multiple treatments and unequal treatment sizes
We developed a capability to deal with experiments where there are multiple treatments. This capability employs a conservative approach to ensure that the size reaches a minimum level where any pairwise comparison between the control and treatment groups has a sufficient sample size.
Heterogeneous treatment effects
Heterogeneous treatment effects refer to a situation where the treatment effect varies across different groups or subpopulations within a larger population. For instance, it may be of interest to examine treatment effects specifically on rainy days compared to non-rainy days. We have incorporated this functionality into the tests for both experiment designs. By enabling this feature, we facilitate a more nuanced analysis that accounts for potential variations in treatment effects based on different factors or contexts.
Maintenance and support
The package is available across all internal DS/Machine Learning platforms and individual local development environments within Grab. Its source code is openly accessible to all developers within Grab and its release adheres to a semantic release standard.
In addition to the technical maintenance efforts, we have introduced a dedicated committee and a workspace to address issues that may extend beyond the scope of the package’s current capabilities.
Experiment Council
Within Grab, there is a dedicated committee known as the ‘Experiment Council’. This committee includes data scientists, analysts, and economists from various functions. One of their responsibilities is to collaborate to enhance and maintain the package, as well as guide users in effectively utilising its functionalities. The Experiment Council plays a crucial role in enhancing the overall operational excellence of conducting experiments and deriving meaningful insights from them.
GrabCausal Methodology Bank
Experimenters frequently encounter challenges regarding the feasibility of conducting experiments for causal problems. To address this concern, we have introduced an alternative workspace called GrabCausal Methodology Bank. Similar to the internal open-source nature of this project, the GrabCausal Methodology bank is open to contributions from all users within Grab. It provides a collaborative space where users can readily share their code, case studies, guidelines, and suggestions related to
causal methodologies. By fostering an open and inclusive environment, this workspace encourages knowledge sharing and promotes the advancement of causal research methods.
The workspace functions as a platform, which now exhibits a wide range of commonly used methods, including Diff-in-Diff, Event studies, Regression Discontinuity Designs (RDD), Instrumental Variables (IV), Bayesian structural time series, and Bunching. Additionally, we are dedicated to incorporating more, such as Synthetic control, Double ML (Chernozhukov et al. 2018), DAG discovery/validation, etc., to further enhance our offerings in this space.
Learnings
Over the past few years, we have invested in developing and expanding this package. Our initial motivation was humble yet motivating – to contribute to improving the quality of experimentation at Grab, helping it develop from its initial start-up modus operandi to a more consolidated, rigorous, and guided approach.
Throughout this journey, we have learned that prioritisation holds the utmost significance in open-source projects of this nature; the majority of user demands can be met through relatively small yet pivotal efforts. By focusing on these core capabilities, we avoid spreading resources too thinly across all areas at the initial stage of planning and development.
Meanwhile, we acknowledge that there is still a significant journey ahead. While the package now focuses solely on individual experiments, an inherent challenge in online-controlled experimentation platforms is the interference between experiments (Gupta, et al, 2019). A recent development in the field is to embrace simultaneous tests (Microsoft, Google, Spotify and booking.com and Optimizely), and to carefully consider the tradeoff between accuracy and velocity.
The key to overcoming this challenge will be a close collaboration between the community of experimenters, the teams developing this unified toolkit, and the GrabX platform engineers. In particular, the platform developers will continue to enrich the experimentation SDK by providing diverse assignment strategies, sampling mechanisms, and user interfaces to manage potential inference risks better. Simultaneously, the community of experimenters can coordinate among themselves effectively to
avoid severe interference, which will also be monitored by GrabX. Last but not least, the development of this unified toolkit will also focus on monitoring, evaluating, and managing inter-experiment interference.
In addition, we are committed to keeping this package in sync with industry advancements. Many existing tools in this package, despite being labelled as “advanced” in the earlier discussions, are still relatively simplified. For instance,
Incorporating standard errors clustering based on the diverse assignment and sampling strategies requires attention (Abadie, et al, 2023).
Sequential testing will play a vital role in detecting uplifts earlier and safely, avoiding p-hacking. One recent innovation is the “always valid inference” (Johari, et al., 2022)
The advancements in investigating heterogeneous effects, such as Causal Forest (Athey and Wager, 2019), have extended beyond linear approaches, now incorporating nonlinear and more granular analyses.
Estimating the long-term treatment effects observed from short-term follow-ups is also a long-term objective, and one approach is using a Surrogate Index (Athey, et al 2019).
Continuous effort is required to stay updated and informed about the latest advancements in statistical testing methodologies, to ensure accuracy and effectiveness.
This article marks the beginning of our journey towards automating the experimentation and product decision-making process among the data scientist community. We are excited about the prospect of expanding the toolkit further in these directions. Stay tuned for more updates and posts.
References
Abadie, Alberto, et al. “When should you adjust standard errors for clustering?.” The Quarterly Journal of Economics 138.1 (2023): 1-35.
Athey, Susan, et al. “The surrogate index: Combining short-term proxies to estimate long-term treatment effects more rapidly and precisely.” No. w26463. National Bureau of Economic Research, 2019.
Athey, Susan, and Stefan Wager. “Estimating treatment effects with causal forests: An application.” Observational studies 5.2 (2019): 37-51.
Chernozhukov, Victor, et al. “Double/debiased machine learning for treatment and structural parameters.” (2018): C1-C68.
Facure, Matheus. Causal Inference in Python. O’Reilly Media, Inc., 2023.
Gupta, Somit, et al. “Top challenges from the first practical online controlled experiments summit.” ACM SIGKDD Explorations Newsletter 21.1 (2019): 20-35.
Huntington-Klein, Nick. The Effect: An Introduction to Research Design and Causality. CRC Press, 2021.
Imbens, Guido W. and Donald B. Rubin. Causal Inference for Statistics, Social, and Biomedical Sciences: An Introduction. Cambridge University Press, 2015.
Johari, Ramesh, et al. “Always valid inference: Continuous monitoring of a/b tests.” Operations Research 70.3 (2022): 1806-1821.
List, John A., Sally Sadoff, and Mathis Wagner. “So you want to run an experiment, now what? Some simple rules of thumb for optimal experimental design.” Experimental Economics 14 (2011): 439-457.
Moffatt, Peter. Experimetrics: Econometrics for Experimental Economics. Bloomsbury Publishing, 2020.
Join us
Grab is the leading superapp platform in Southeast Asia, providing everyday services that matter to consumers. More than just a ride-hailing and food delivery app, Grab offers a wide range of on-demand services in the region, including mobility, food, package and grocery delivery services, mobile payments, and financial services across 428 cities in eight countries.
Powered by technology and driven by heart, our mission is to drive Southeast Asia forward by creating economic empowerment for everyone. If this mission speaks to you, join our team today!
Trustworthy experiments are key to making sound decisions, so analysts and data scientists put a lot of effort into analysing them and making business impacts. An extension of Grab’s Experimentation (GrabX) platform, Automated Experiment Analysis is one of Grab’s data products that helps automate statistical analyses of experiments. It also provides automatic experimental data pipelines and customised tests for different types of experiments.
Designed to help Grab in its journey of innovation and data-driven decision making, the data product helps to:
Standardise and automate the basic experiment analysis process on Grab experiments.
Ensure post-experiment results are reproducible under a company-wide standard, and easily reviewed by each other.
Democratise the institutional knowledge of experimentation across functions.
Background
Today, the GrabX platform provides the ability to define, configure, and execute online controlled experiments (OCEs), often called A/B tests, to gather trustworthy data and make data-driven decisions about how to improve our products.
Before the automated analysis, each experiment was analysed manually on an ad-hoc basis. This manual and federated model brings in several challenges at the company level:
Inefficiency: Repetitive nature of data pipeline building and basic post-experiment analyses incur large costs and deplete the analysts’ bandwidth from running deeper analyses.
Lack of quality control: Risk of unstandardised, inaccurate or late results as the platform cannot exercise data-governance/control or extend offerings to Grab’s other entities.
Lack of scalability and availability: GrabX users have varied backgrounds and skills, making their approaches to experiments different and not easily transferable/shared. E.g. Some teams may use more advanced techniques to speed up their experiments without using too much resources but these techniques are not transferable without considerable training.
Solution
Architecture details
Architecture diagram
When users set up experiments on GrabX, they can configure the success metrics they are interested in. These metrics configurations are then stored in the metadata as “bronze”, “silver”, and “gold” datasets depending on the corresponding step in the automated data pipeline process.
Metrics configuration and “bronze” datasets
In this project, we have developed a metrics glossary that stores information about what the metrics are and how they are computed. The metrics glossary is stored in CosmoDB and serves as an API Endpoint for GrabX so users can pick from the list of available metrics. If a metric is not available, users can input their custom metrics definition.
This metrics selection, as an analysis configuration, is then stored as a “bronze” dataset in Azure Data Lake as metadata, together with the experiment configurations. Once the experiment starts, the data pipeline gathers all experiment subjects and their assigned experiment groups from our clickstream tracking system.
In this case, the experiment subject refers to the facets of the experiment. For example, if the experiment subject is a user, then the user will go through the same experience throughout the entire experimentation period.
Metrics computation and “silver” datasets
In this step, the metrics engine gathers all metrics data based on the metrics configuration and computes the metrics for each experiment subject. This computed data is then stored as a “silver” dataset and is the foundation dataset for all statistical analyses.
“Silver” datasets are then passed through the “Decision Engine” to get the final “gold” datasets, which contain the experiment results.
Results visualisation and ”gold” datasets
In “gold” datasets, we have the result of the experiment, along with some custom messages we want to show our users. These are saved in sets of fact and dim tables (typically used in star schemas).
For users to visualise the result on GrabX, we leverage the embedded Power BI visualisation. We build the visualisation using a “gold” dataset and embed it to each experiment page with a fixed filter. By doing so, users can experience the end-to-end flow directly from GrabX.
Implementation
The implementation consists of four key engineering components:
Analysis configuration setup
A data pipeline
Automatic analysis
Results visualisation
Analysis configuration is part of the experiment setup process where users select success metrics they are interested in. This is an essential configuration for post-experiment analysis, in addition to the usual experiment configurations (e.g. sampling strategies).
It ensures that the reported experiment results will align with the hypothesis setup, which helps avoid one of the common pitfalls in OCEs 1.
There are three types of metrics available:
Pre-defined metrics: These metrics are already defined in the Scribe datamart, e.g. Gross Merchandise Value (GMV) per pax.
Event-based metrics: Users can specify an ad-hoc metric in the form of a funnel with event names for funnel start and end.
Build your own metrics: Users have the flexibility to define a metric in the form of a SQL query.
A data pipeline here mainly consists of data sourcing and data processing. We use Azure Data Factory to schedule ETL pipelines so we can calculate the metrics and statistical analysis. ETL jobs are written in spark and run using Databricks.
Data pipelines are streamlined to the following:
Load experiments and metrics metadata, defined at the experiment creation stage.
Load experiment and clickstream events.
Load experiment assignments. An experiment assignment maps a randomisation unit ID to the corresponding experiment or variant IDs.
Merge the data mentioned above for each experiment variant, and obtain sufficient data to do a deeper results analysis.
Automatic analysis uses an internal python package “Decision Engine”, which decouples the dataset and statistical tests, so that we can incrementally improve applications of advanced techniques. It provides a comprehensive set of test results at the variant level, which include statistics, p-values, confidence intervals, and the test choices that correspond to the experiment configurations. It’s a crowdsourced project which allows all to contribute what they believe should be included in fundamental post-experiment analysis.
Results visualisation leverages PowerBI, which is embedded in the GrabX UI, so users can run the experiments and review the results on a single platform.
Impact
At the individual user level, Automated Experiment Analysis is designed to enable analysts and data scientists to associate metrics with experiments, and present the experiment results in a standardised and comprehensive manner. It speeds up the decision-making process and frees up the bandwidths of analysts and data scientists to conduct deeper analyses.
At the user community level, it improves the efficiency of running experimental analysis by capturing all experiments, their results, and the launch decision within a single platform.
Learnings/Conclusion
Automated Experiment Analysis is the first building block to boost the trustworthiness of OCEs in Grab. Not all types of experiments are fully onboard, and they might not need to be. Through this journey, we believe these key learnings would be useful for experimenters and platform teams:
To standardise and simplify several experimental analysis steps, there needs to be automation data pipelines, analytics tools, and a metrics store in the infrastructure.
The “Decision Engine” analytics tool should be decoupled from the other engineering components, so that it can be incrementally improved in future.
To democratise knowledge and ensure service coverage, many components need to have a crowdsourcing feature, e.g. the metrics store has a BYOM function, and “Decision Engine” is an open-sourced internal python package.
Tracking implementation is important. To standardise data pipelines and achieve scalability, we need to standardise the way we implement tracking.
What’s next?
A centralised metric store – We built a metric calculation dictionary, which currently contains around 30-40 basic business metrics, but its functionality is limited to GrabX Experimentation use case.
If the metric store is expected to serve more general uses, it needs to be further enriched by allowing some “smarts”, e.g. fabric-agnostic metrics computations 2, other types of data slicing, and some considerations with real-time metrics or signals.
An end-to-end experiment guide rail – Currently, we provide automatic data analysis after an experiment is done, but no guardrail features at multiple experiment stages, e.g. sampling strategy choices, sample size recommendation from the planning stage, and data quality check during/after the experiment windows. Without the end-to-end guardrails, running experiments will be very prone to pitfalls. We therefore plan to add some degree of automation to ensure experiments adhere to the standards used by the post-experimental analysis.
A more comprehensive analysis toolbox – The current state of the project mainly focuses on infrastructure development, so it starts with basic frequentist’s A/B testing approaches. In future versions, it can be extended to include sequential testing, CUPED 3, attribution analysis, Causal Forest, heterogeneous treatment effects, etc.
Join us
Grab is the leading superapp platform in Southeast Asia, providing everyday services that matter to consumers. More than just a ride-hailing and food delivery app, Grab offers a wide range of on-demand services in the region, including mobility, food, package and grocery delivery services, mobile payments, and financial services across 428 cities in eight countries.
Powered by technology and driven by heart, our mission is to drive Southeast Asia forward by creating economic empowerment for everyone. If this mission speaks to you, join our team today!
References
Dmitriev, P., Gupta, S., Kim, D. W., & Vaz, G. (2017, August). A dirty dozen: twelve common metric interpretation pitfalls in online controlled experiments. In Proceedings of the 23rd ACM SIGKDD international conference on knowledge discovery and data mining (pp. 1427-1436). ↩
Deng, A., Xu, Y., Kohavi, R., & Walker, T. (2013, February). Improving the sensitivity of online controlled experiments by utilising pre-experiment data. In Proceedings of the sixth ACM international conference on Web search and data mining (pp. 123-132). ↩
The collective thoughts of the interwebz
Manage Consent
To provide the best experiences, we use technologies like cookies to store and/or access device information. Consenting to these technologies will allow us to process data such as browsing behavior or unique IDs on this site. Not consenting or withdrawing consent, may adversely affect certain features and functions.
Functional
Always active
The technical storage or access is strictly necessary for the legitimate purpose of enabling the use of a specific service explicitly requested by the subscriber or user, or for the sole purpose of carrying out the transmission of a communication over an electronic communications network.
Preferences
The technical storage or access is necessary for the legitimate purpose of storing preferences that are not requested by the subscriber or user.
Statistics
The technical storage or access that is used exclusively for statistical purposes.The technical storage or access that is used exclusively for anonymous statistical purposes. Without a subpoena, voluntary compliance on the part of your Internet Service Provider, or additional records from a third party, information stored or retrieved for this purpose alone cannot usually be used to identify you.
Marketing
The technical storage or access is required to create user profiles to send advertising, or to track the user on a website or across several websites for similar marketing purposes.