Tag Archives: Generative BI

Announcing Amazon Quick Suite: your agentic teammate for answering questions and taking action

Post Syndicated from Esra Kayabali original https://aws.amazon.com/blogs/aws/reimagine-the-way-you-work-with-ai-agents-in-amazon-quick-suite/

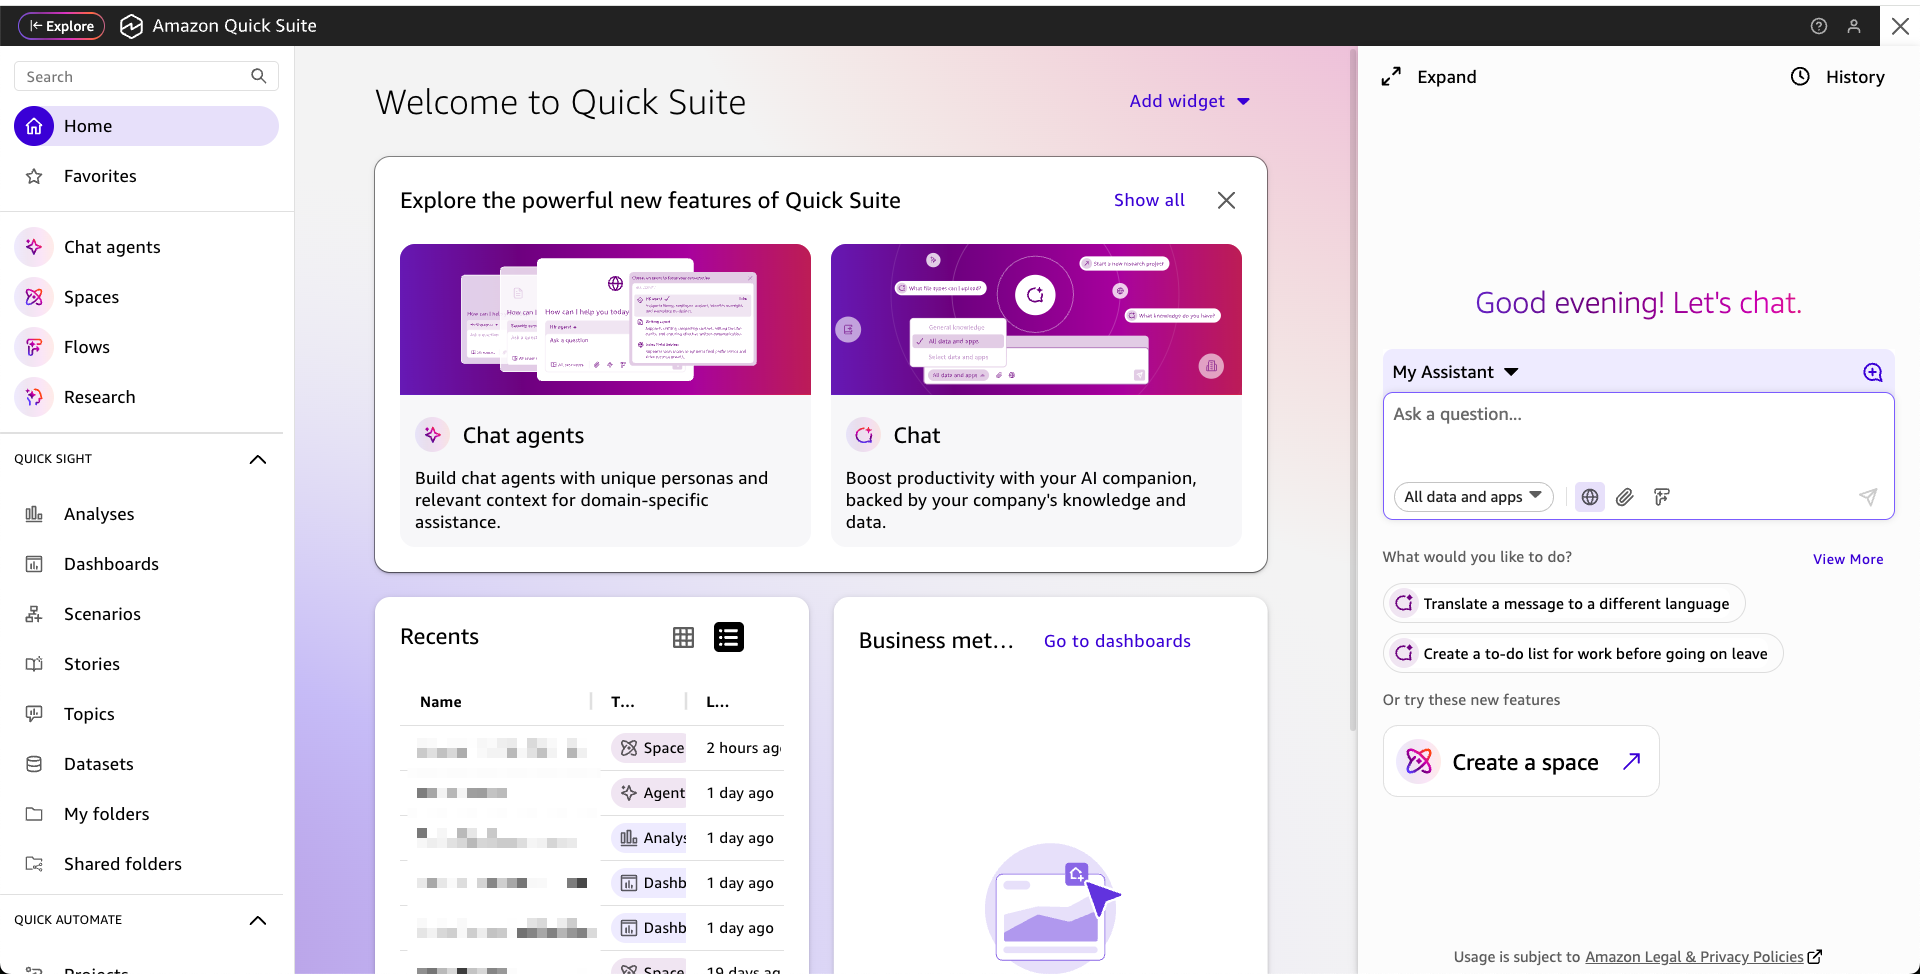
Today, we’re announcing Amazon Quick Suite, a new agentic teammate that quickly answers your questions at work and turns those insights into actions for you. Instead of switching between multiple applications to gather data, find important signals and trends, and complete manual tasks, Quick Suite brings AI-powered research, business intelligence, and automation capabilities into a single workspace. You can now analyze data through natural language queries, find critical information across enterprise and external sources in minutes, and automate processes from simple tasks to complex multi-department workflows.

Here’s a look into Quick Suite.

Business users often need to gather data across multiple applications—pulling customer details, checking performance metrics, reviewing internal product information, and performing competitive intelligence. This fragmented process often requires consultation with specialized teams to analyze advanced datasets, and in some cases, must be repeated regularly, reducing efficiency and leading to incomplete insights for decision-making.

Quick Suite helps you overcome these challenges by combining agentic teammates for research, business intelligence, and automation into a unified digital workspace for your day-to-day work.

Integrated capabilities that power productivity 
Quick Suite includes the following integrated capabilities:

  • Research – Quick Research accelerates complex research by combining enterprise knowledge, premium third-party data, and data from the internet for more comprehensive insights.
  • Business intelligence – Quick Sight provides AI-powered business intelligence capabilities that transform data into actionable insights through natural language queries and interactive visualizations, helping everyone make faster decisions and achieve better business outcomes.
  • Automation – Quick Flows and Quick Automate help users and technical teams to automate any business process from simple, routine tasks to complex multi-department workflows, enabling faster execution and reducing manual work across the organization.

Let’s dive into some of these key capabilities.

Quick Index: Your unified knowledge foundation
Quick Index creates a secure, searchable repository that consolidates documents, files, and application data to power AI-driven insights and responses across your organization.

As a foundational component of Quick Suite, Quick Index operates in the background to bring together all your data—from databases and data warehouses to documents and email. This creates a single, intelligent knowledge base that makes AI responses more accurate and reduces time spent searching for information.

Quick Index automatically indexes and prepares any uploaded files or unstructured data you add to your Quick Suite, enabling efficient searching, sorting, and data access. For example, when you search for a specific project update, Quick Index instantly returns results from uploaded documents, meeting notes, project files, and reference materials—all from one unified search instead of checking different repositories and file systems.

To learn more, visit the Quick Index overview page.

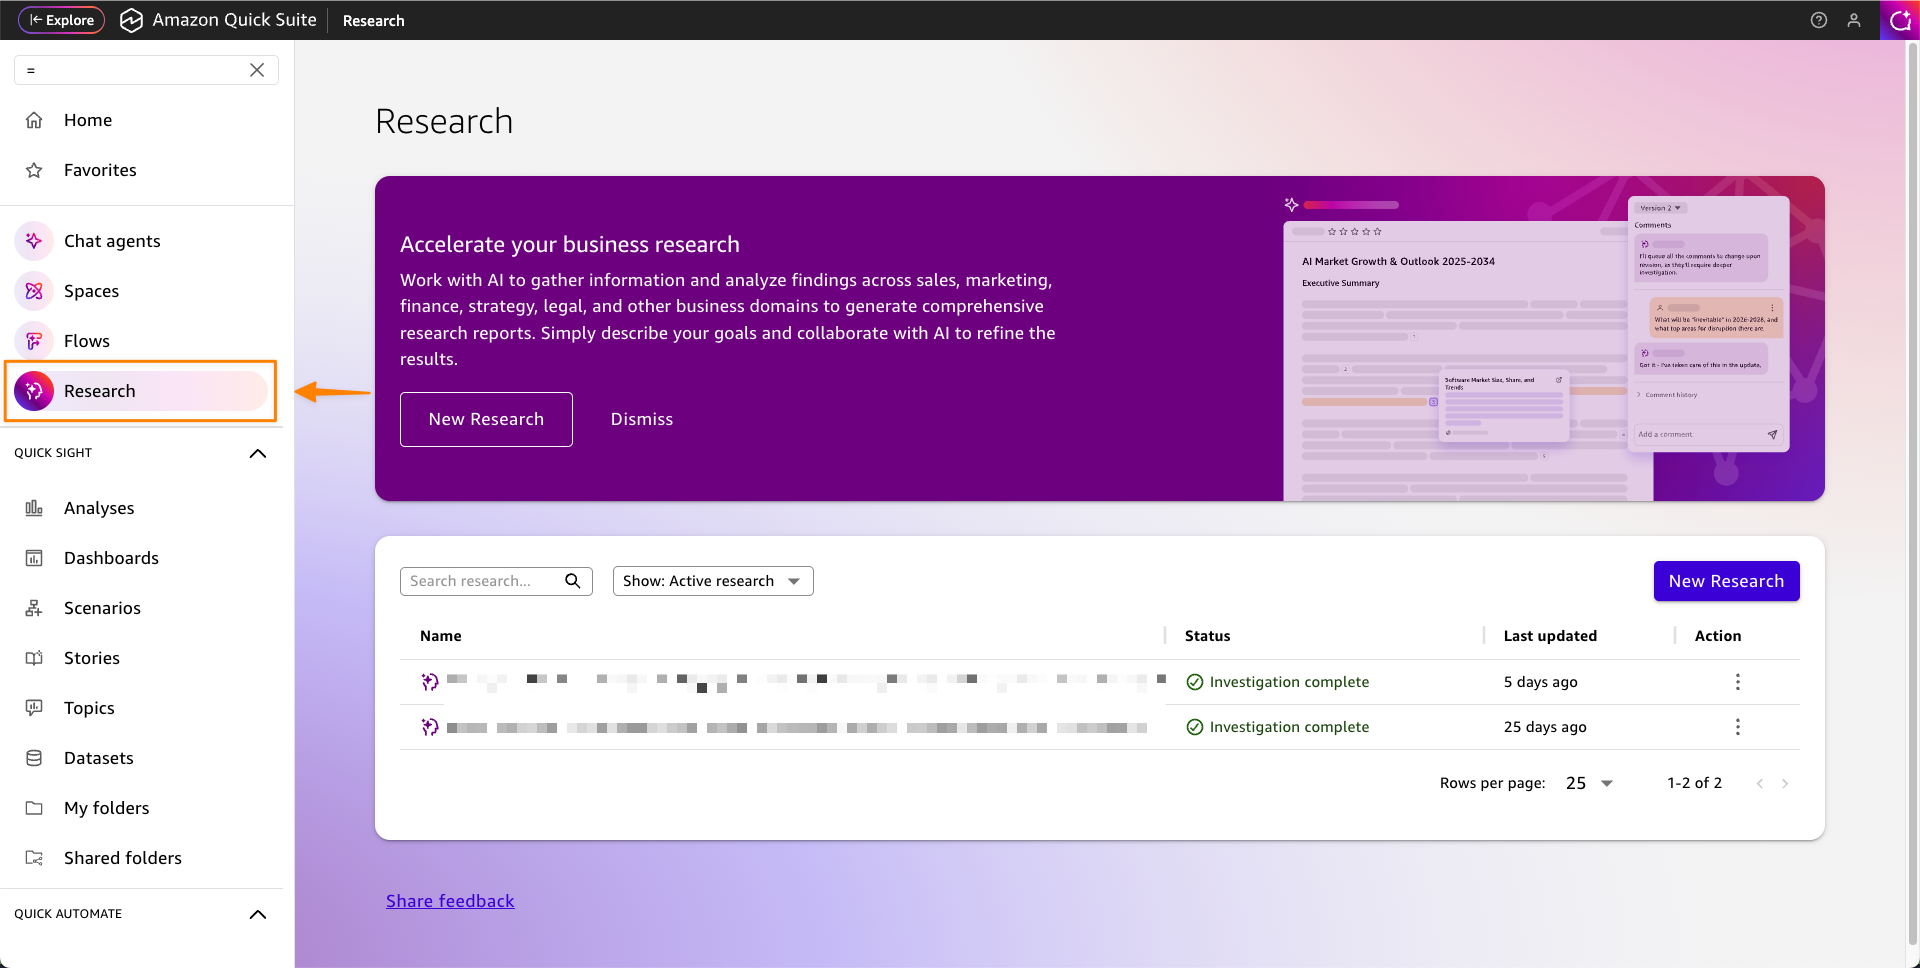
Quick Research: From complex business challenges to expert-level insights
Quick Research is a powerful agent that conducts comprehensive research across your enterprise data and external sources to deliver contextualized, actionable insights in minutes or hours — work that previously could take longer.

Quick Research systematically breaks down complex questions into organized research plans. Starting with a simple prompt, it automatically creates detailed research frameworks that outline the approach and data sources needed for comprehensive analysis.

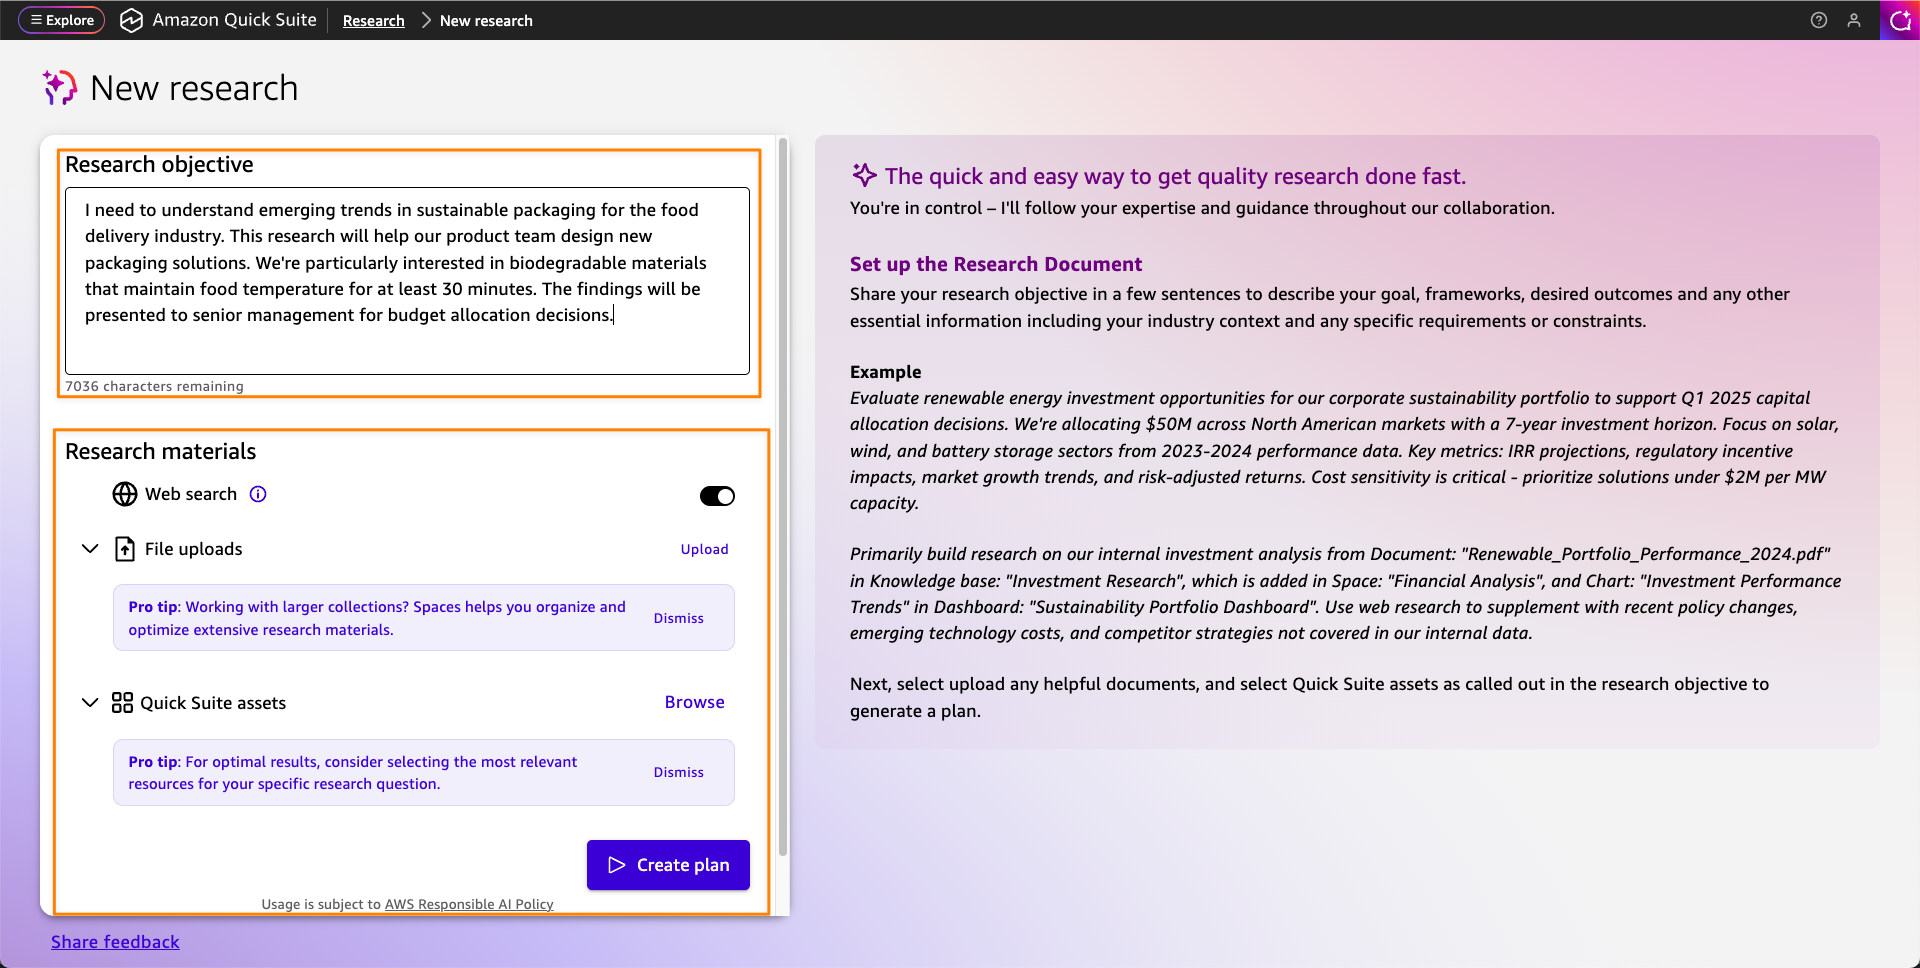
After Quick Research creates the plan, you can easily refine it through natural language conversations. When you are happy with the plan, it works in the background to gather information from multiple sources, using advanced reasoning to validate findings and provide thorough analysis with citations.

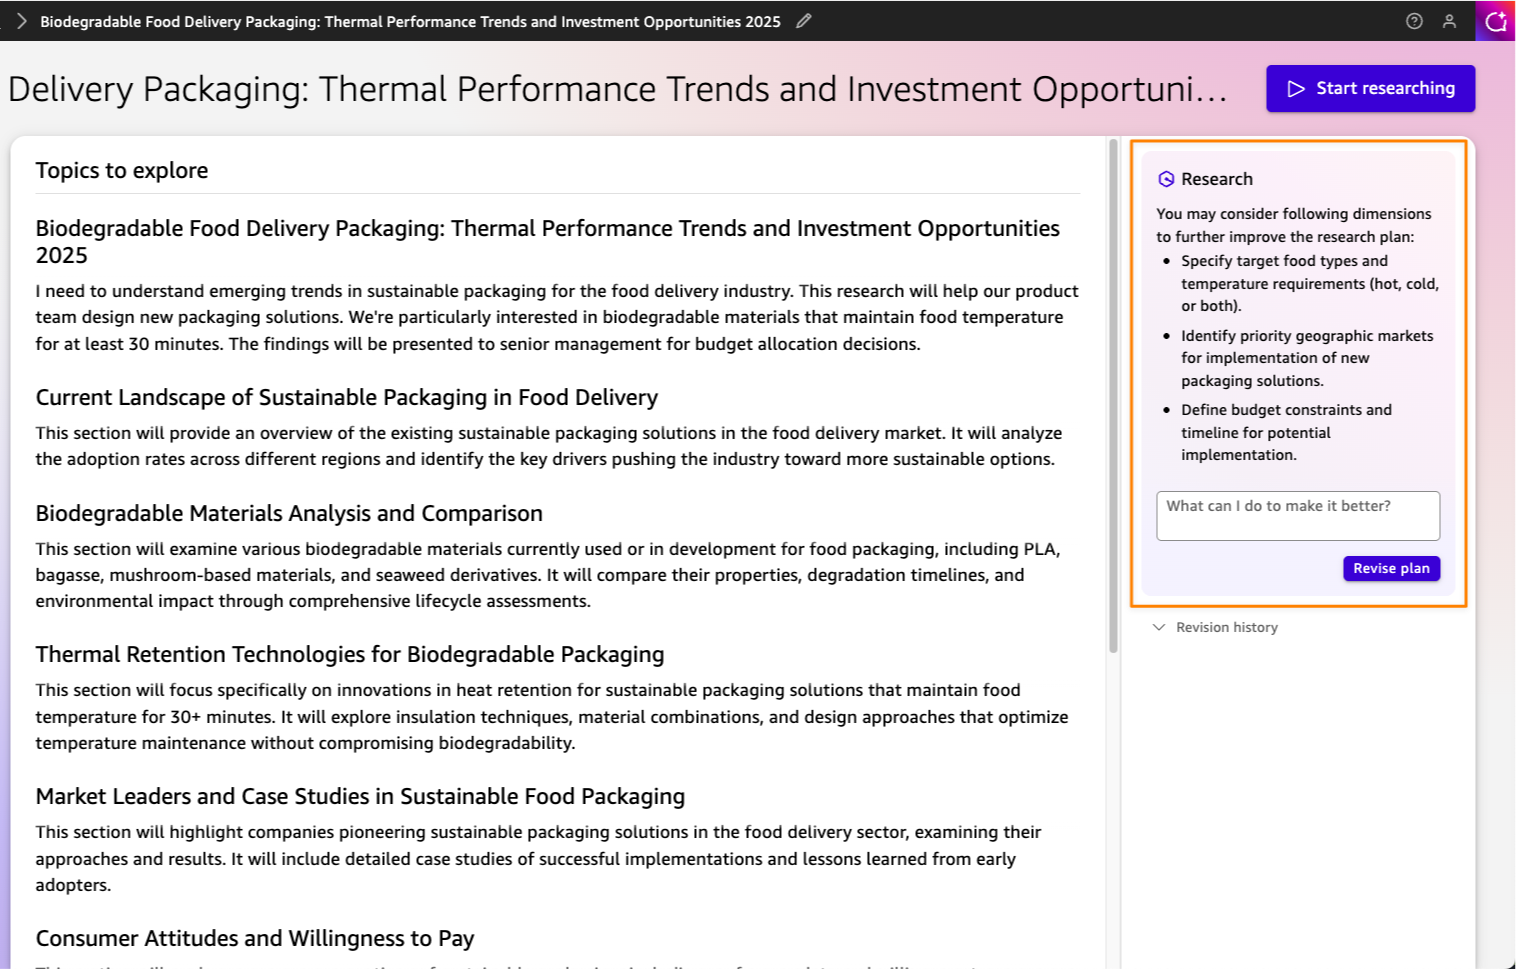
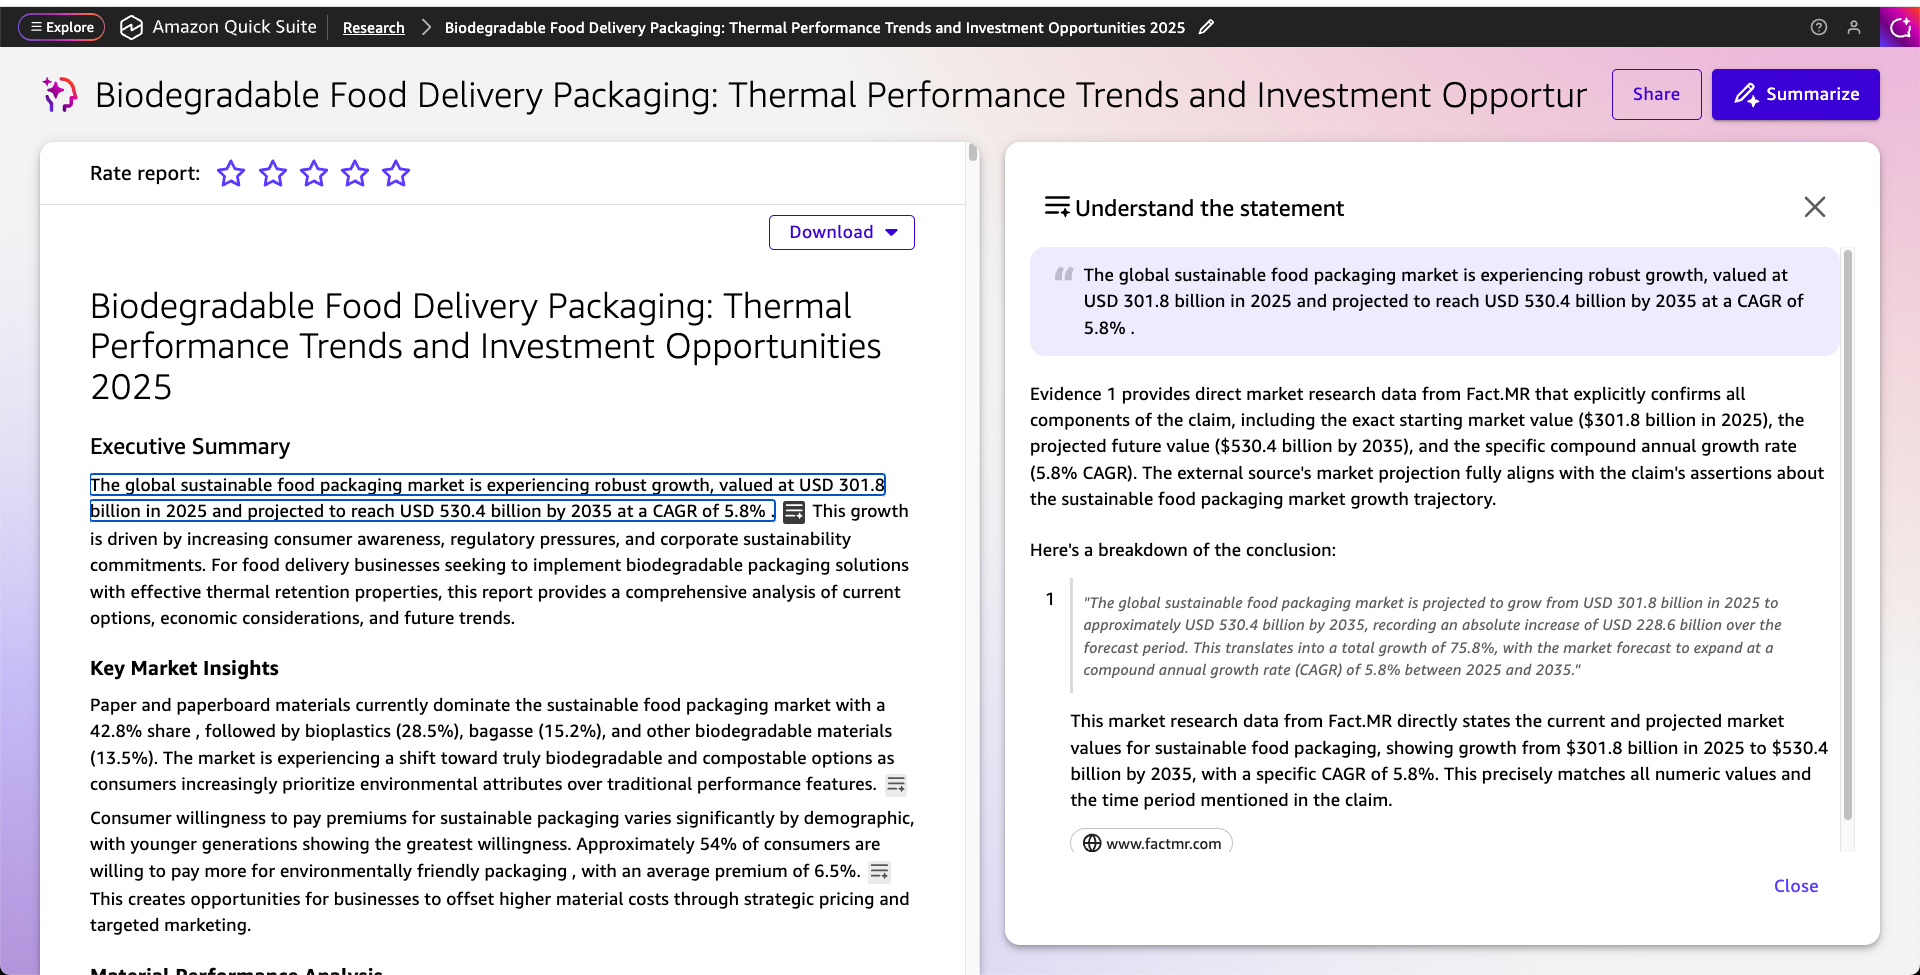
Quick Research integrates with your enterprise data connected to Quick Suite, the unified knowledge foundation that connects to your dashboards, documents, databases, and external sources, including Amazon S3, Snowflake, Google Drive, and Microsoft SharePoint. Quick Research grounds key insights to original sources and reveals clear reasoning paths, helping you verify accuracy, understand the logic behind recommendations, and present findings with confidence. You can trace findings back to their original sources and validate conclusions through source citations. This makes it ideal for complex topics requiring in-depth analysis.

To learn more, visit the Quick Research overview page.

Quick Sight: AI-powered business intelligence
Quick Sight provides AI-powered business intelligence capabilities that transform data into actionable insights through natural language queries and interactive visualizations.

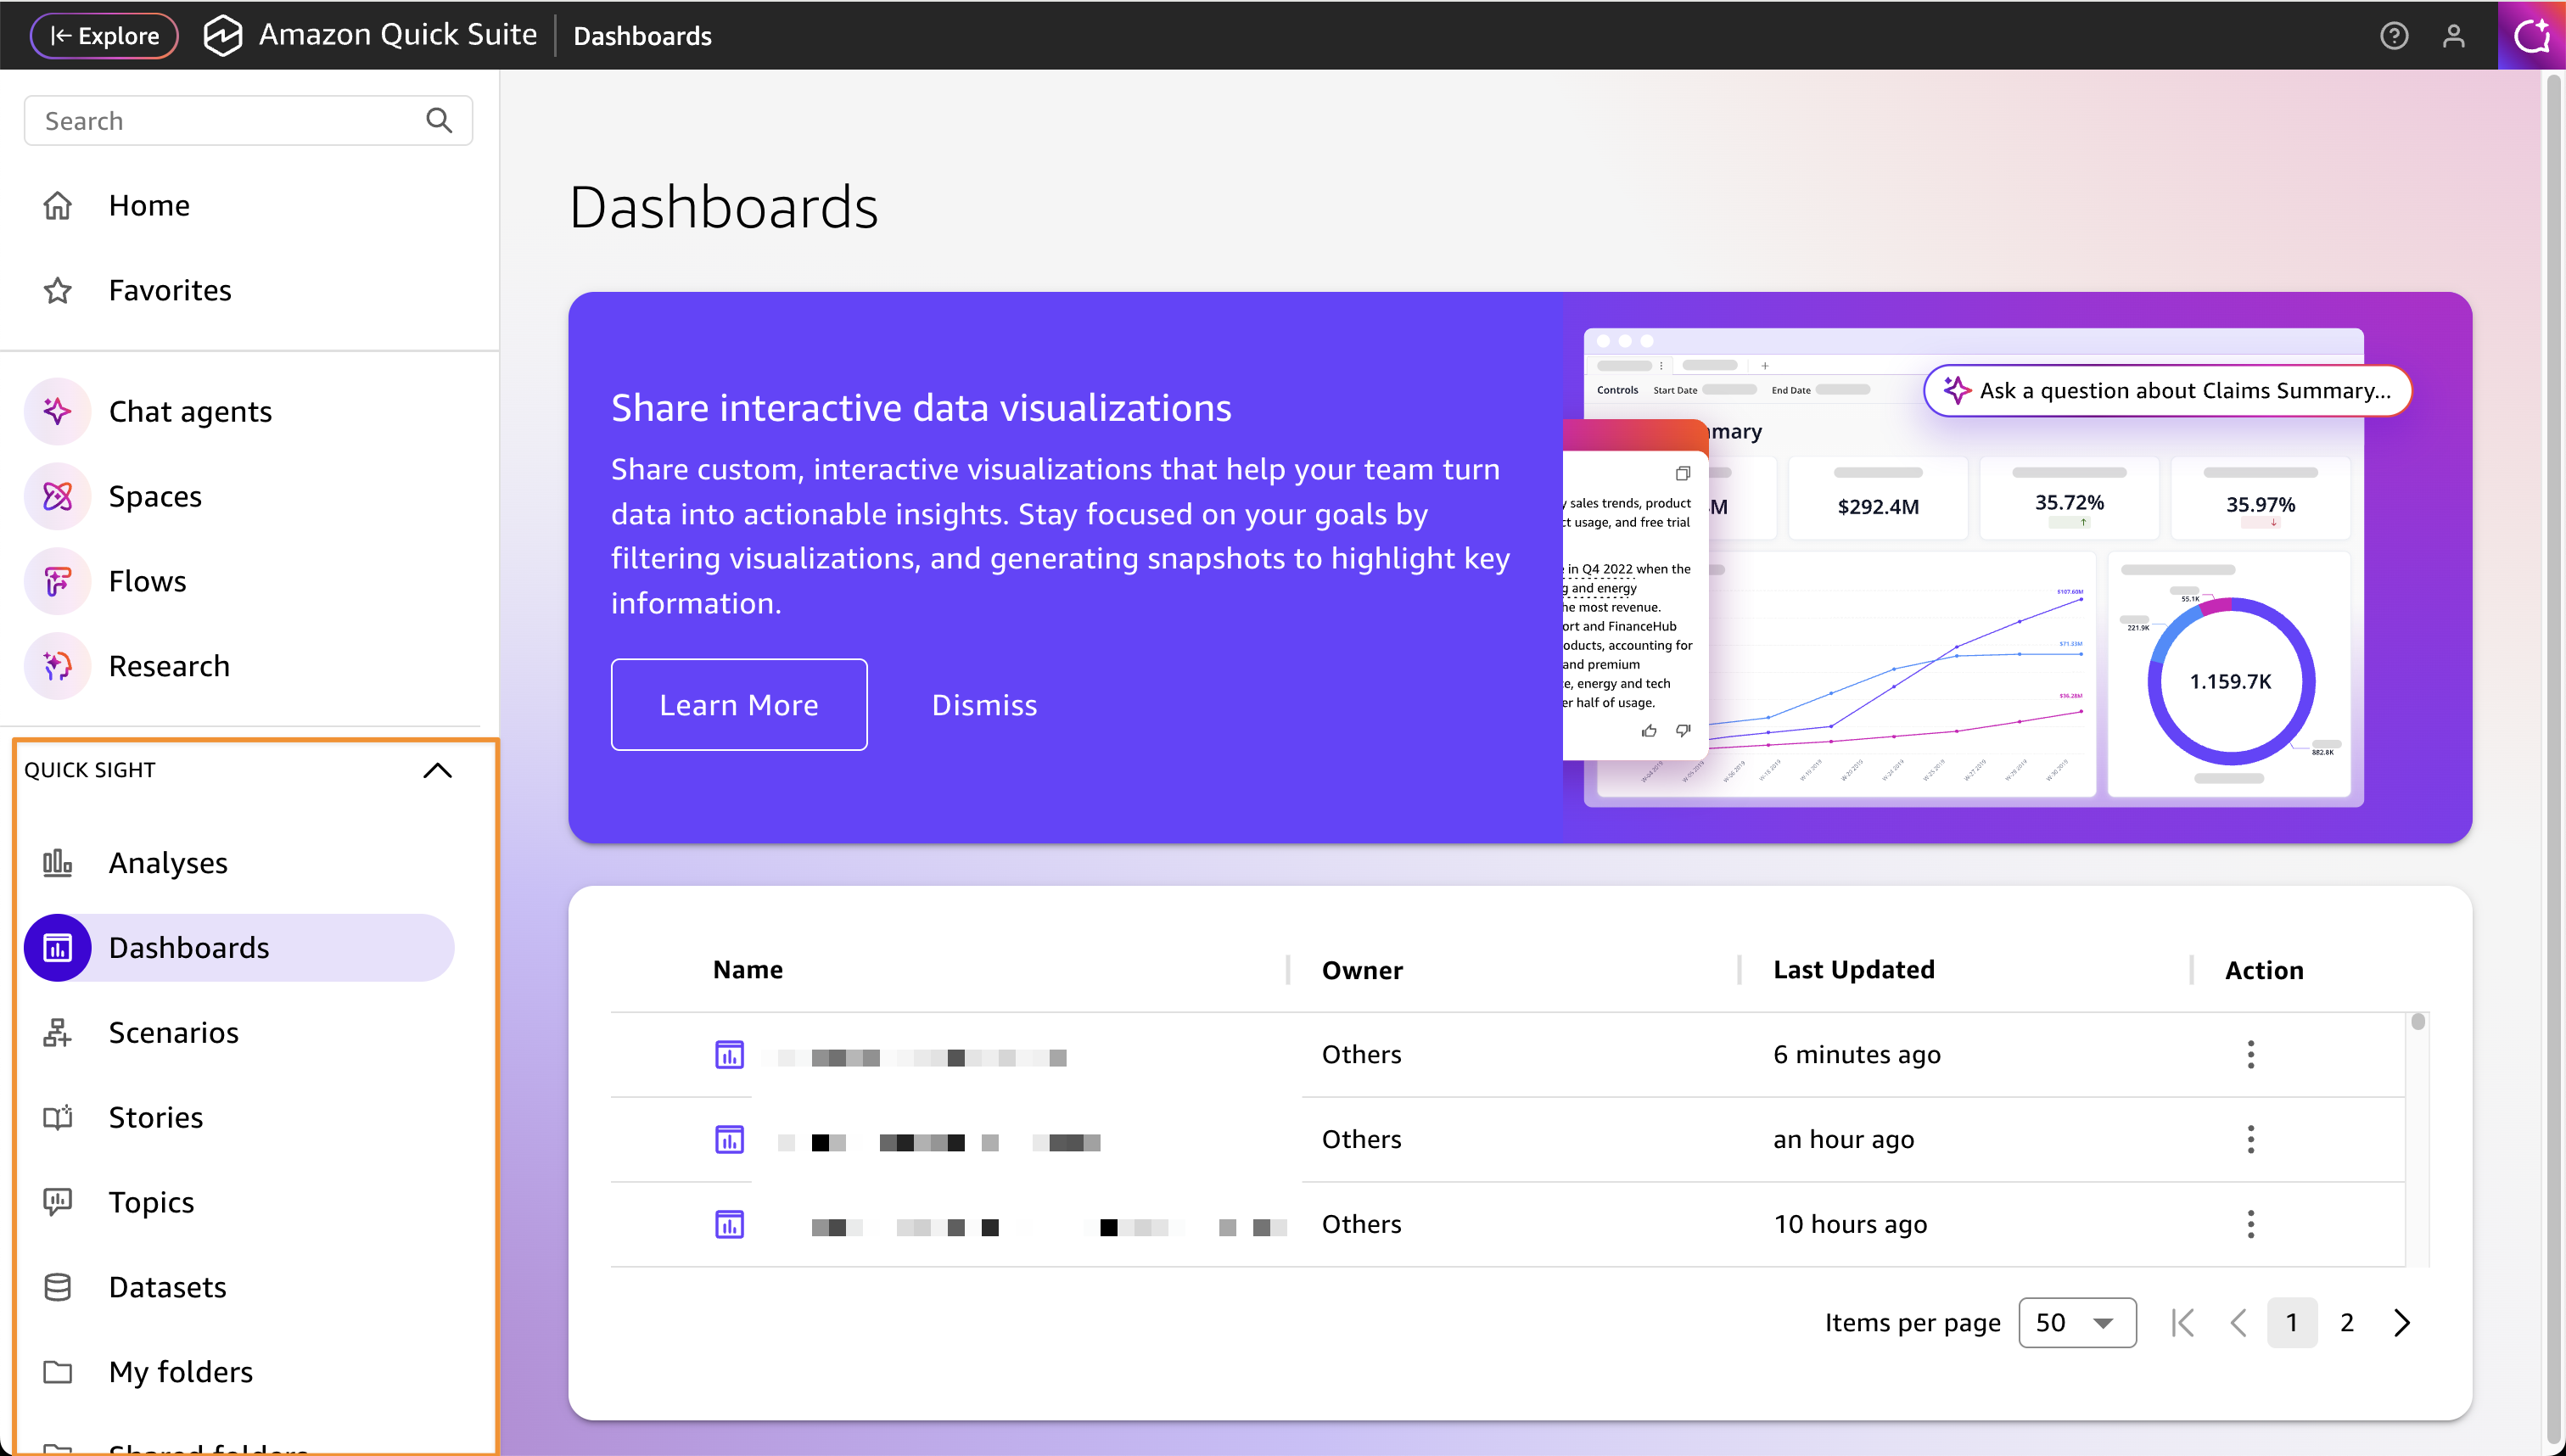
You can create dashboards and executive summaries using conversational prompts, reducing dashboard development time while making advanced analytics accessible without specialized skills.

Quick Sight helps you ask questions about your data in natural language and receive instant visualizations, executive summaries, and insights. This generative AI integration provides you with answers from your dashboards and datasets without requiring technical expertise.

Using the scenarios capability, you can perform what-if analysis in natural language with step-by-step guidance, exploring complex business scenarios and finding answers faster than before.

Additionally, you can respond to insights with one-click actions by creating tickets, sending alerts, updating records, or triggering automated workflows directly from your dashboards without switching applications.

To learn more, visit Quick Sight overview page.

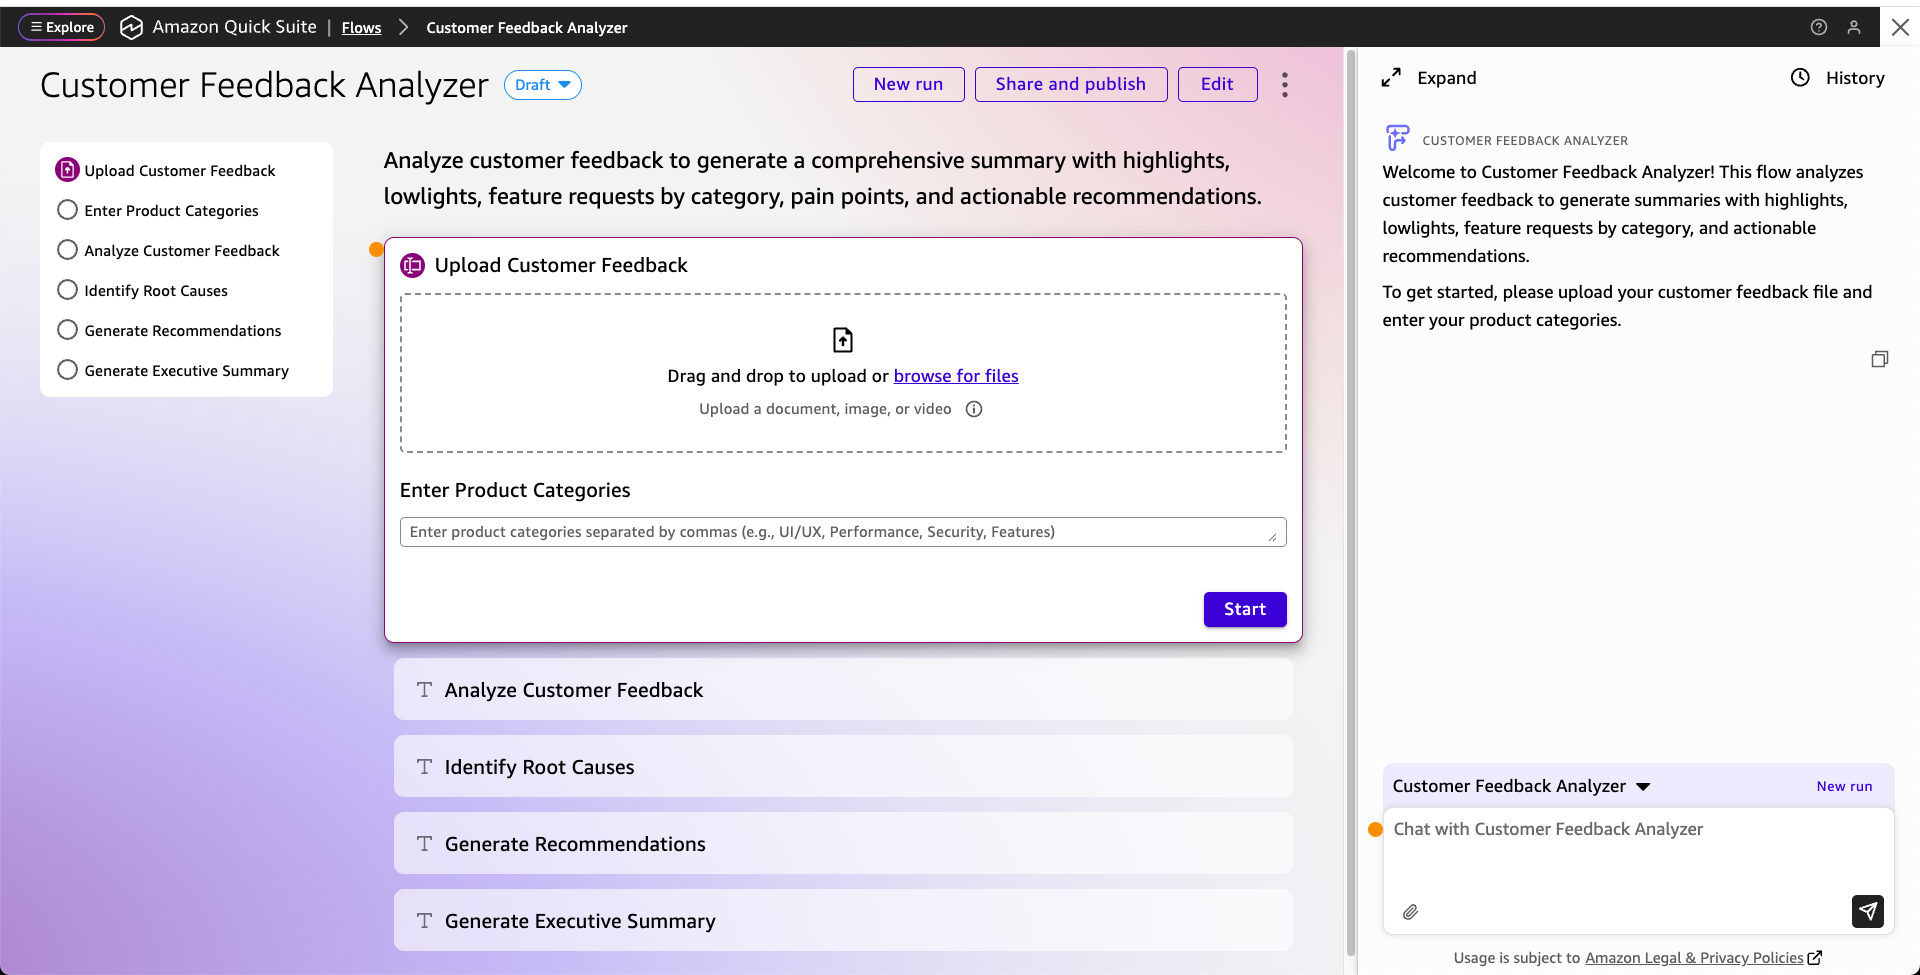
Quick Flows: Automation for everyone
With Quick Flows, any user can automate repetitive tasks by describing their workflow using natural language without requiring any technical knowledge. Quick Flows fetches information from internal and external sources, takes action in business applications, generates content, and handles process-specific requirements.

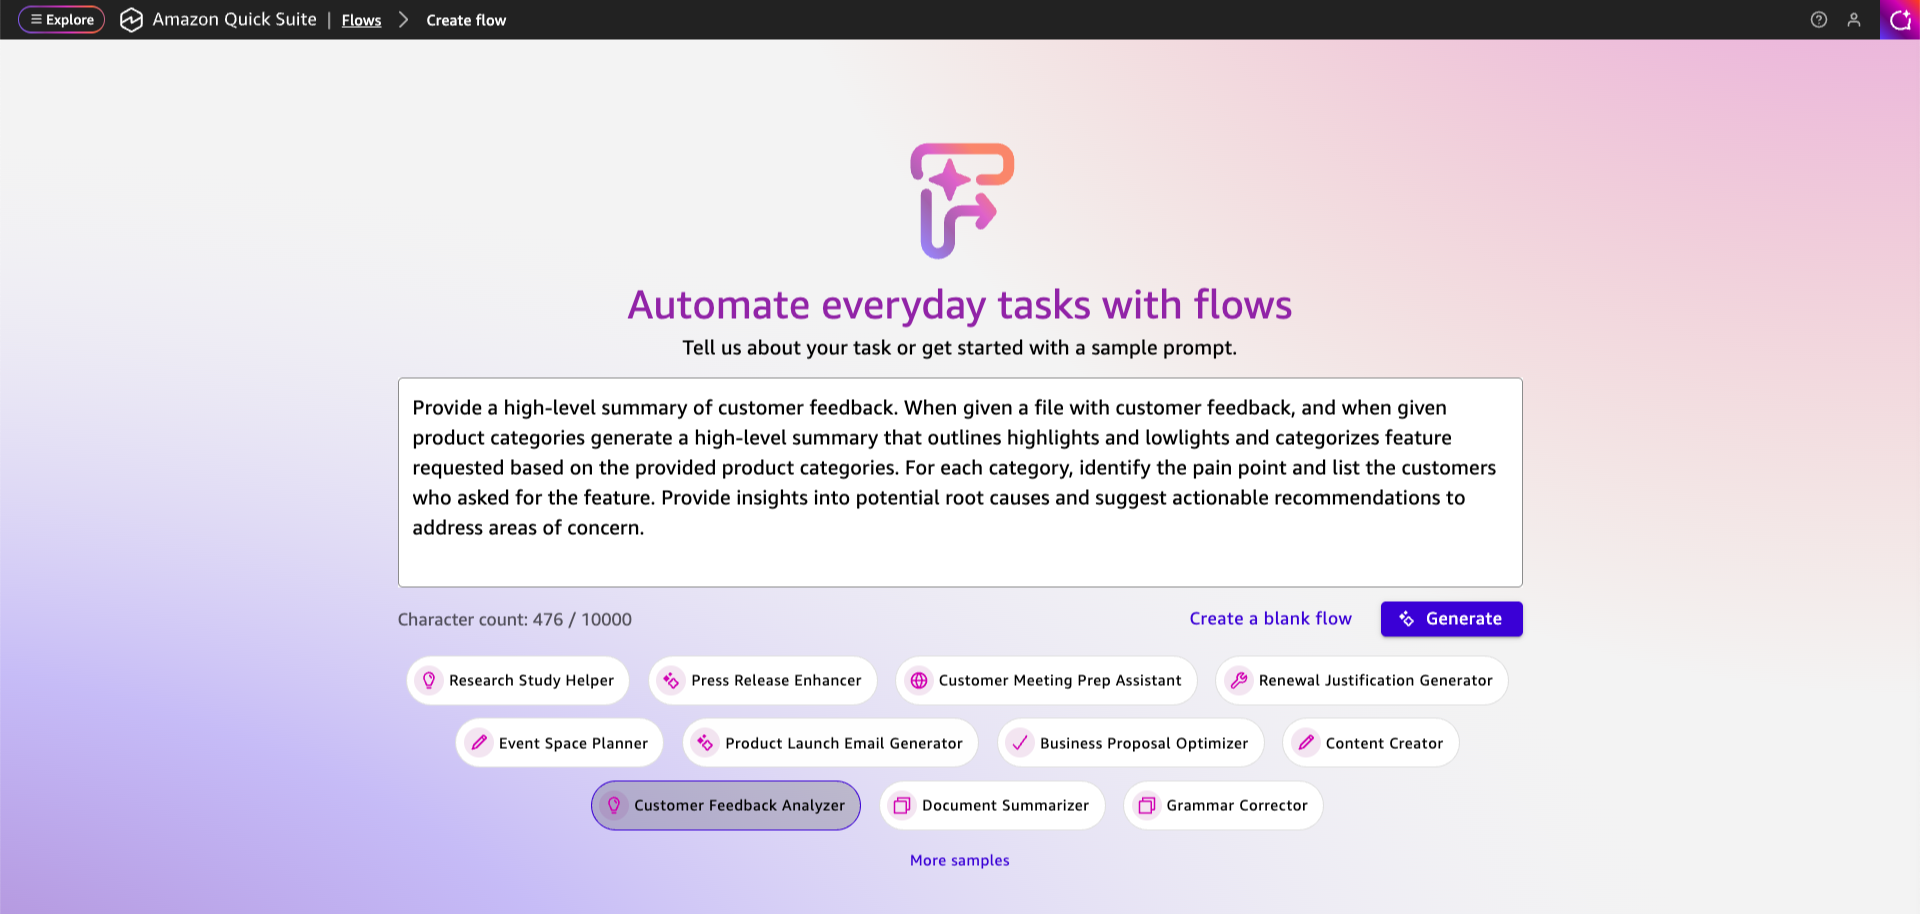
Starting with straightforward business requirements, it creates a multi-step flow including input steps for gathering information, reasoning groups for AI-powered processing, and output steps for generating and presenting results.

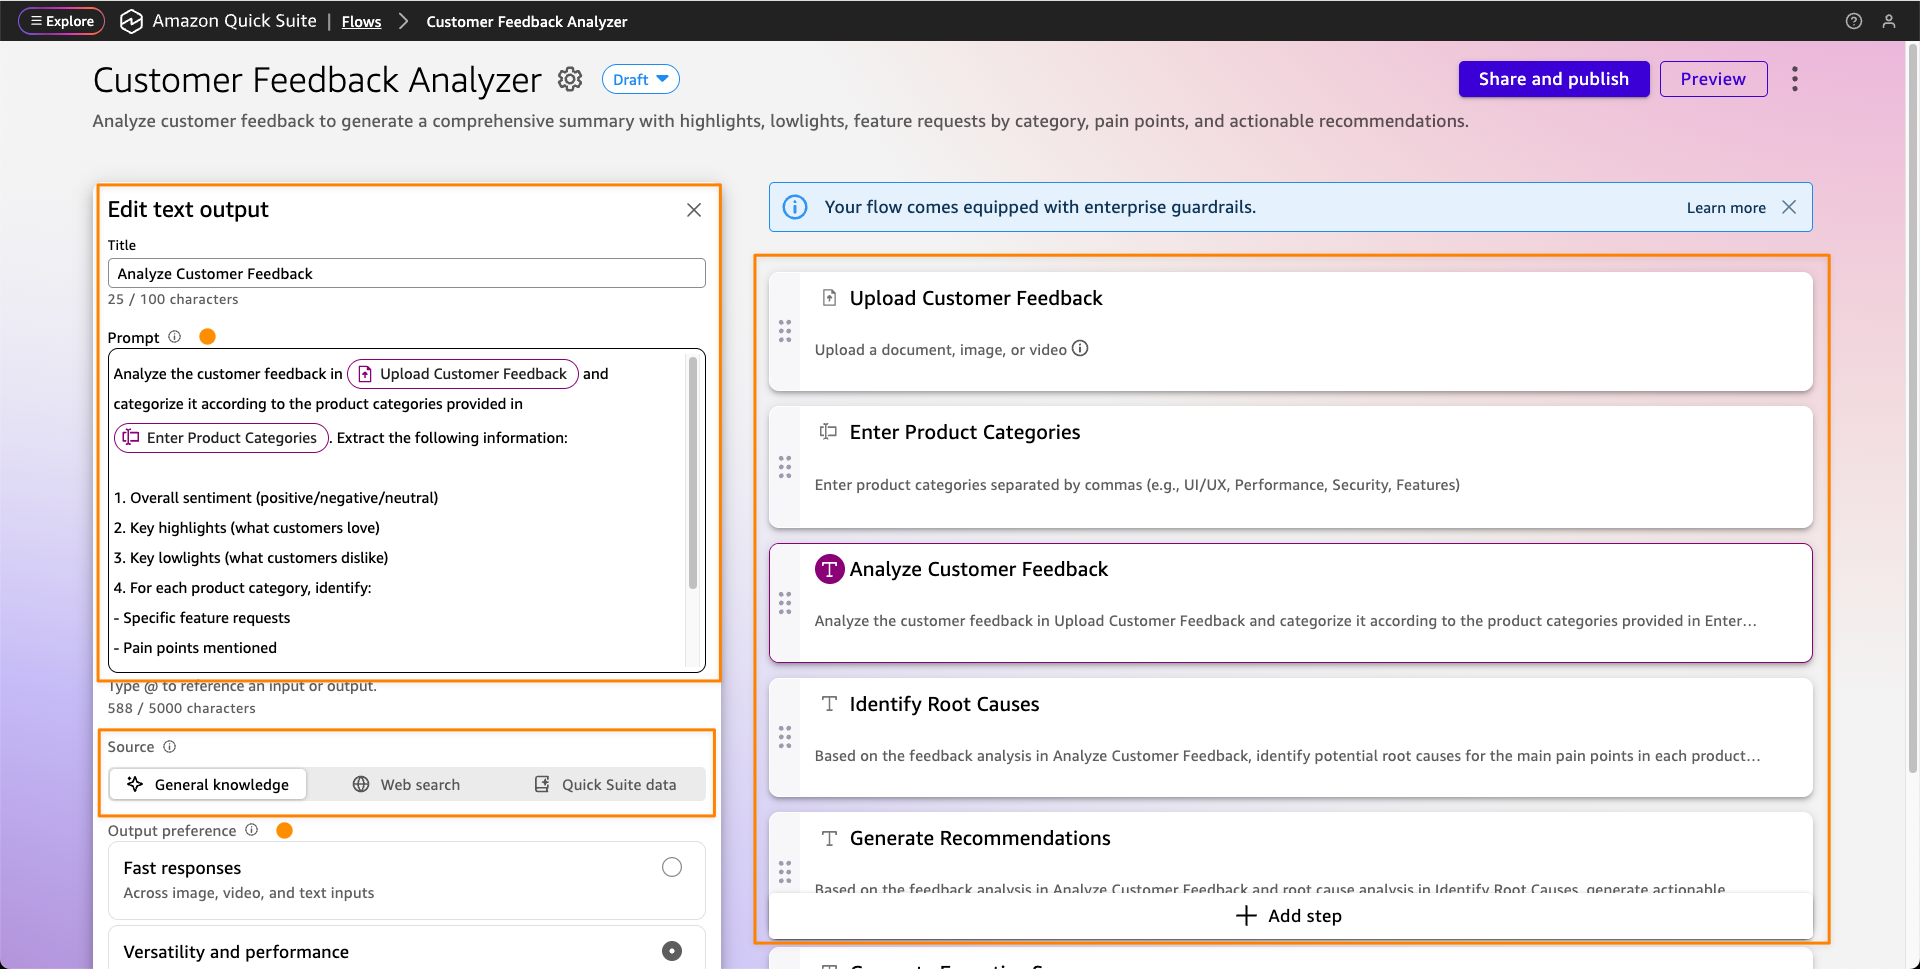
After the flow is configured, you can share it with a single click to your coworkers and other teams. To execute the flow, users can open it from the library or invoke it from chat, provide the necessary inputs, and then chat with the agent to refine the outputs and further customize the results.

To learn more, visit the Quick Flows overview page.

Quick Automate: Enterprise-scale process automation
Quick Automate helps technical teams build and deploy sophisticated automation for complex, multistep processes that span departments, systems, and third-party integrations. Using AI-powered natural language processing, Quick Automate transforms complex business processes into multi-agent workflows that can be created merely by describing what you want to automate or uploading process documentation.

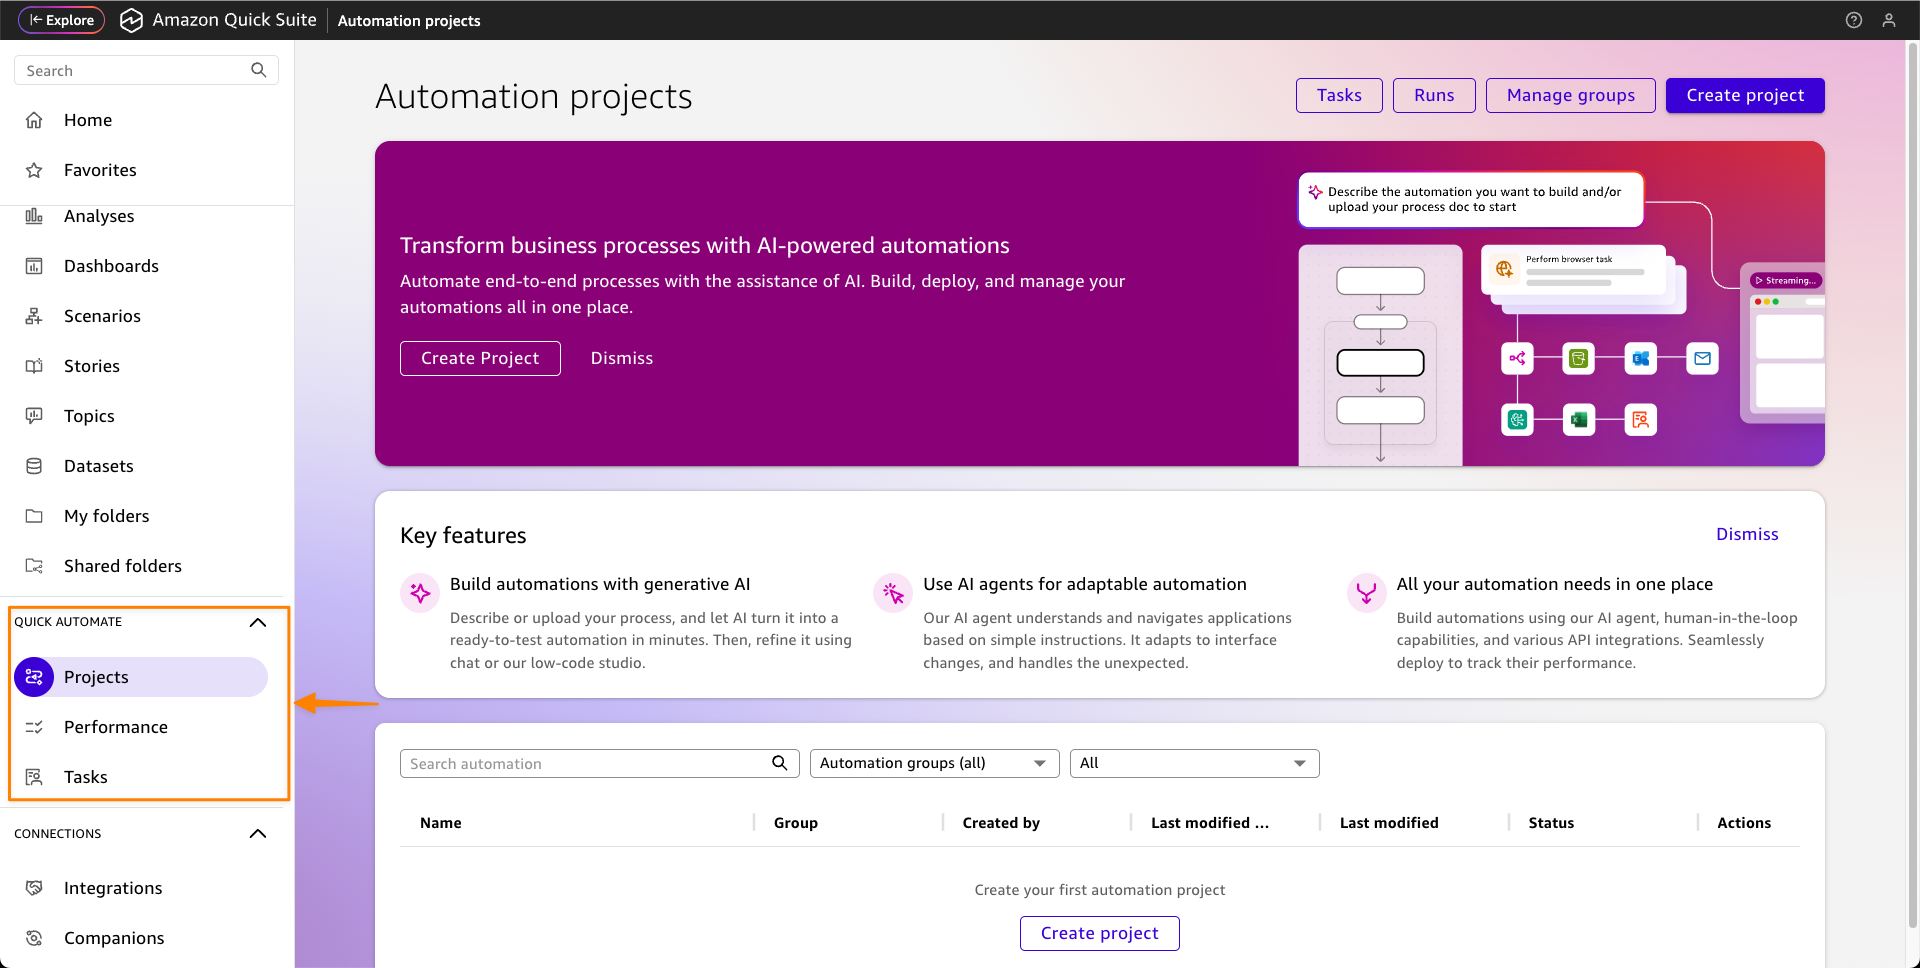
While Quick Flows handles straightforward workflows, Quick Automate is designed for comprehensive and complex business processes like customer onboarding, procurement automations, or compliance procedures that involve multiple approval steps, system integrations, and cross-departmental coordination. Quick Automate offers advanced orchestration capabilities with extensive monitoring, debugging, versioning, and deployment features.

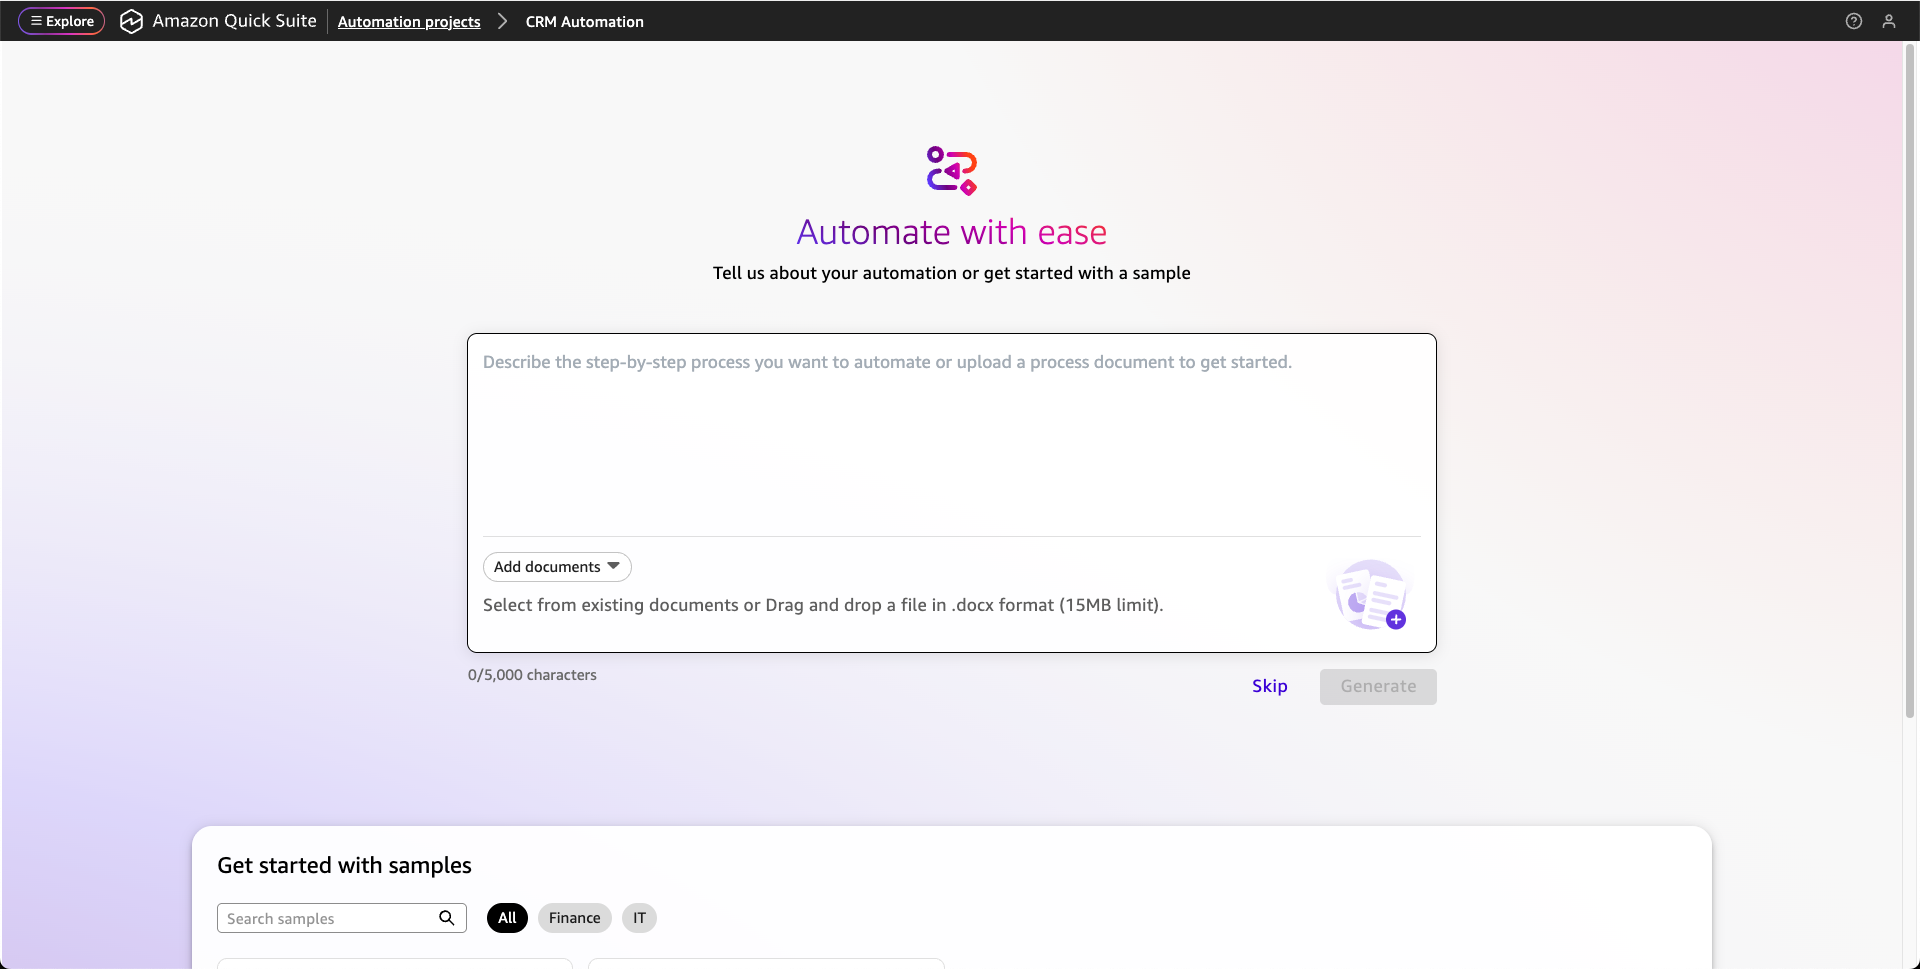
Quick Automate then generates a comprehensive automation plan with detailed steps and actions. You will find a UI agent that understands natural language instructions to autonomously navigate websites, complete form inputs, extract data, and produces structured outputs for downstream automation steps.

Additionally, you can define a custom agent, complete with instructions, knowledge, and tools, to complete process-specific tasks using the visual building experience – no code required.

Quick Automate includes enterprise-grade features such as user role management and human-in-the-loop capabilities that route specific tasks to users or groups for review and approval before continuing workflows. The service provides comprehensive observability with real-time monitoring, success rate tracking, and audit trails for compliance and governance.

To learn more, visit the Quick Automate overview page.

Additional foundational capabilities
Quick Suite includes other foundational capabilities that deliver seamless data organization and contextual AI interactions across your enterprise.

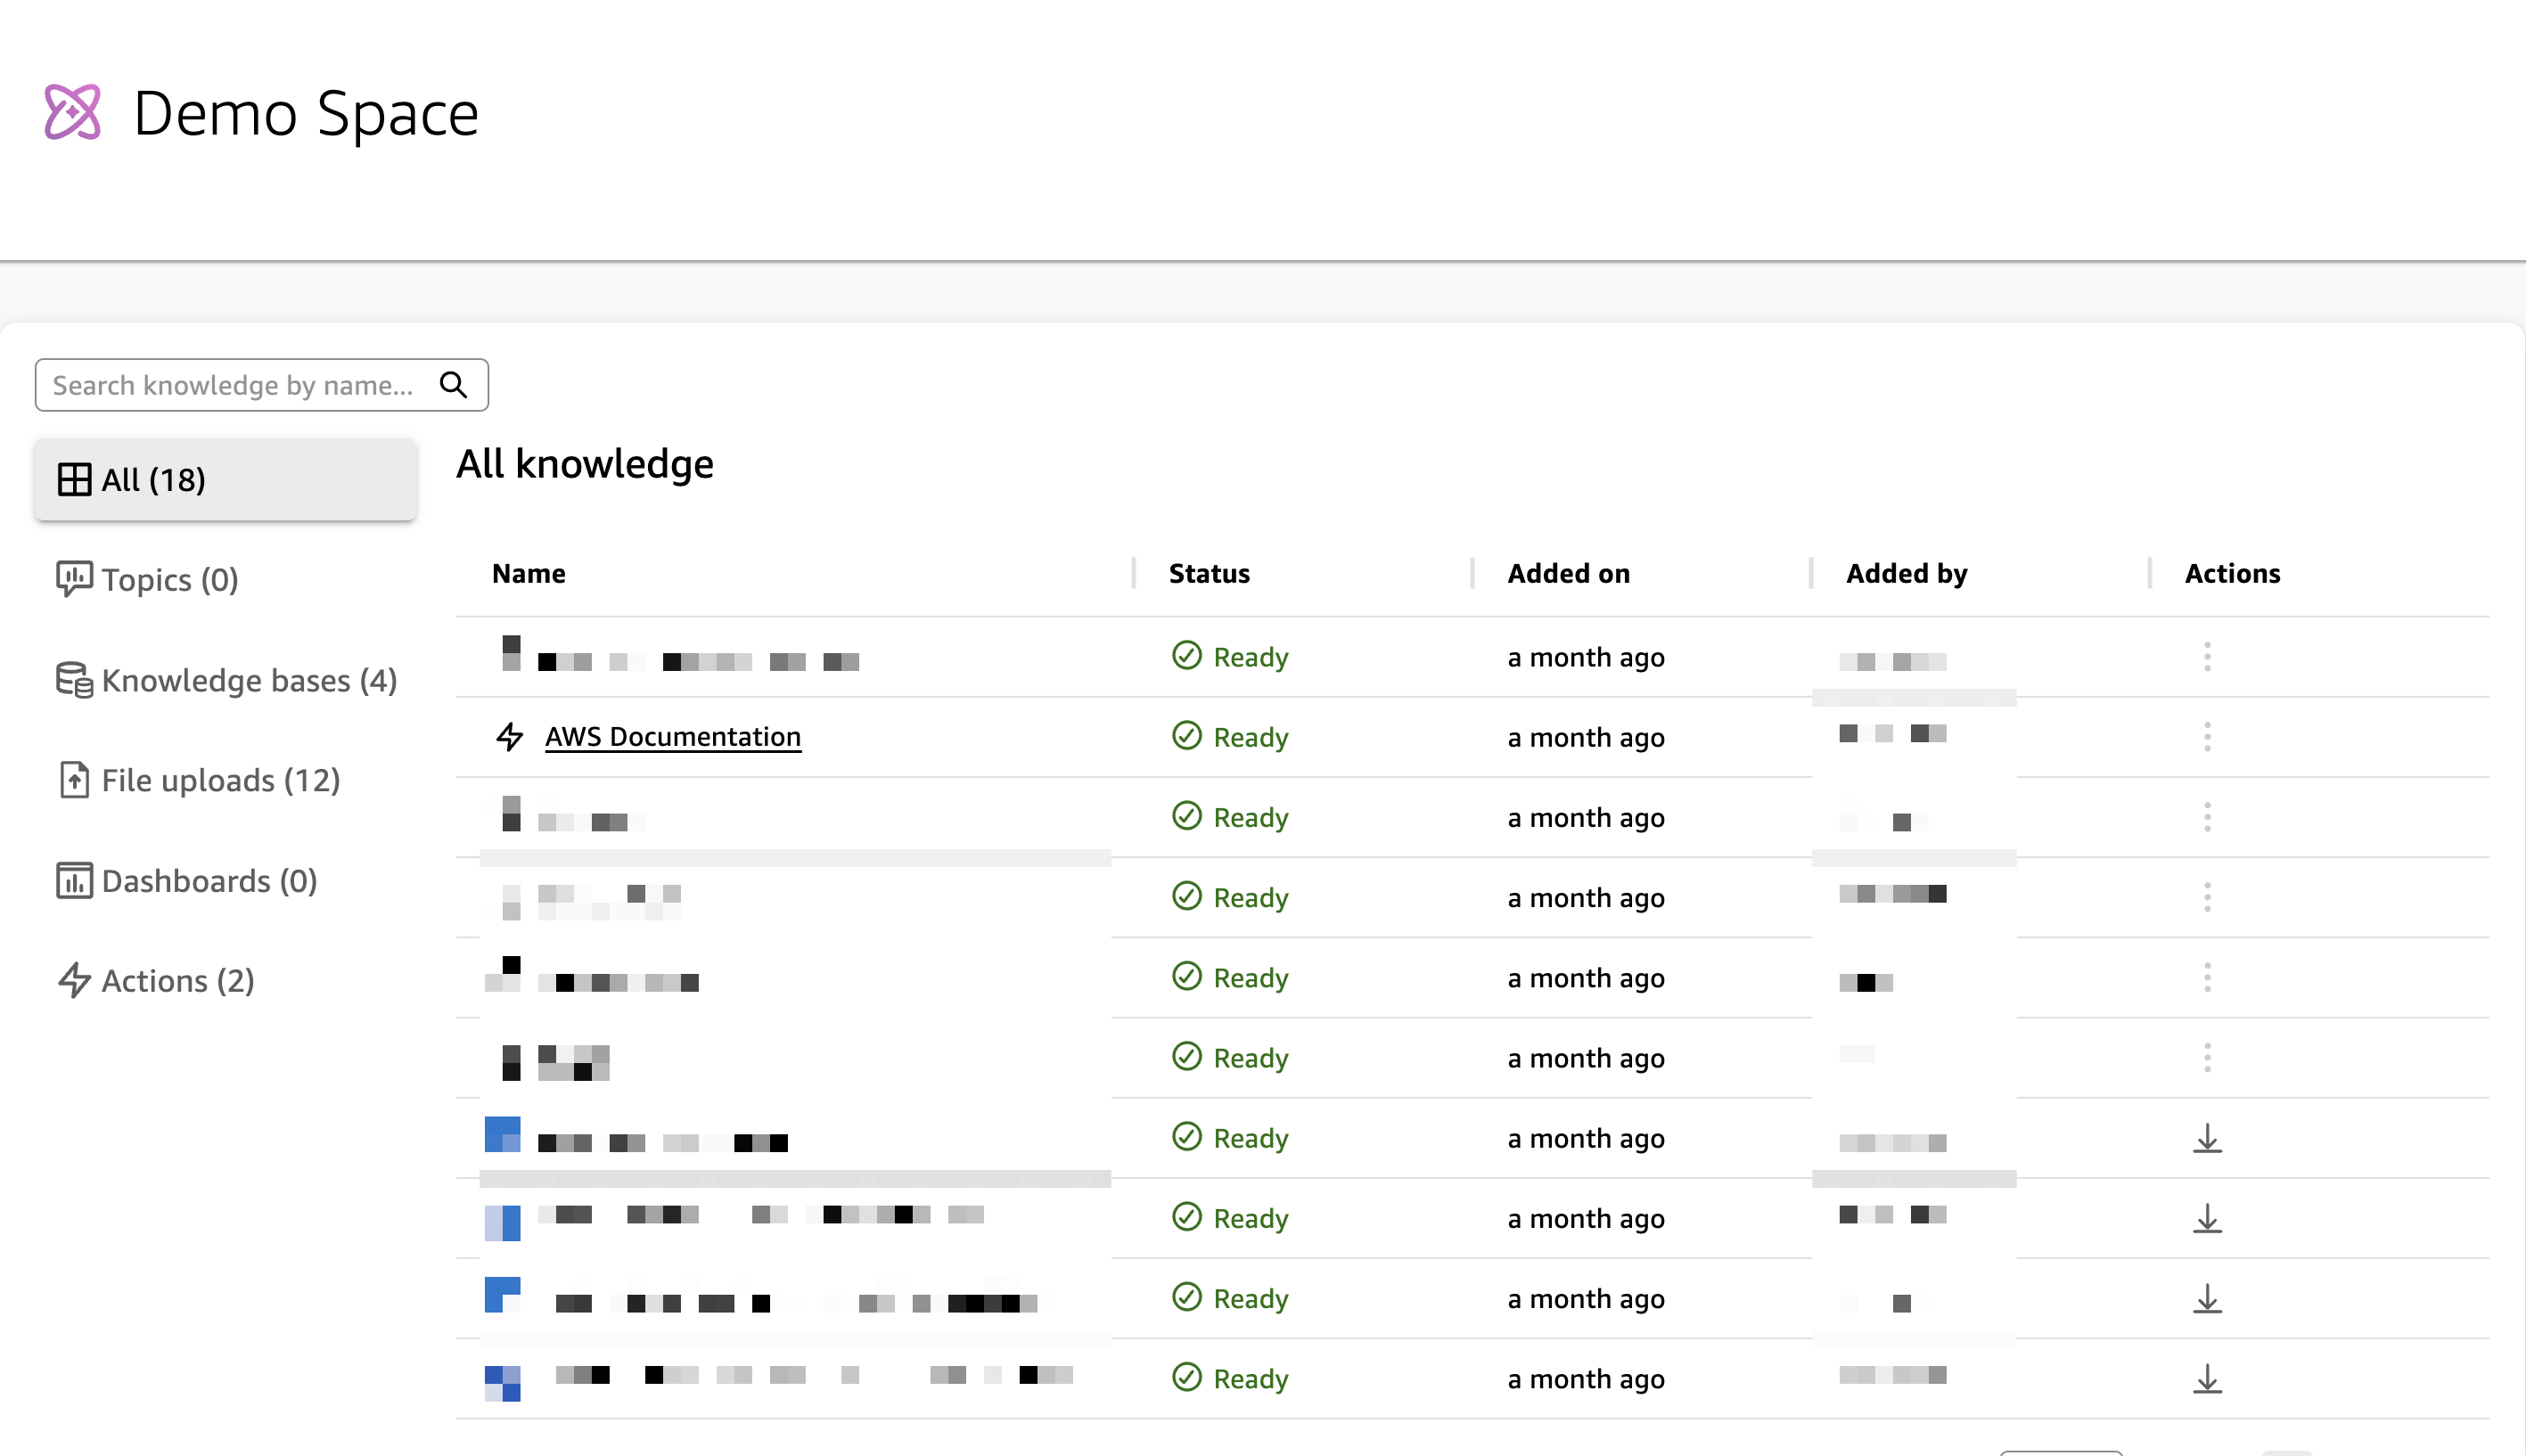
Spaces – Spaces provide a straightforward way for every business user to add their own context by uploading files or connecting to specific datasets and repositories specific to their work or to a particular function. For example, you might create a space for quarterly planning that includes budget spreadsheets, market research reports, and strategic planning documents. Or you could set up a product launch space that connects to your project management system and customer feedback databases. Spaces can scale from personal use to enterprise-wide deployment while maintaining access permissions and seamless integration with Quick Suite capabilities.

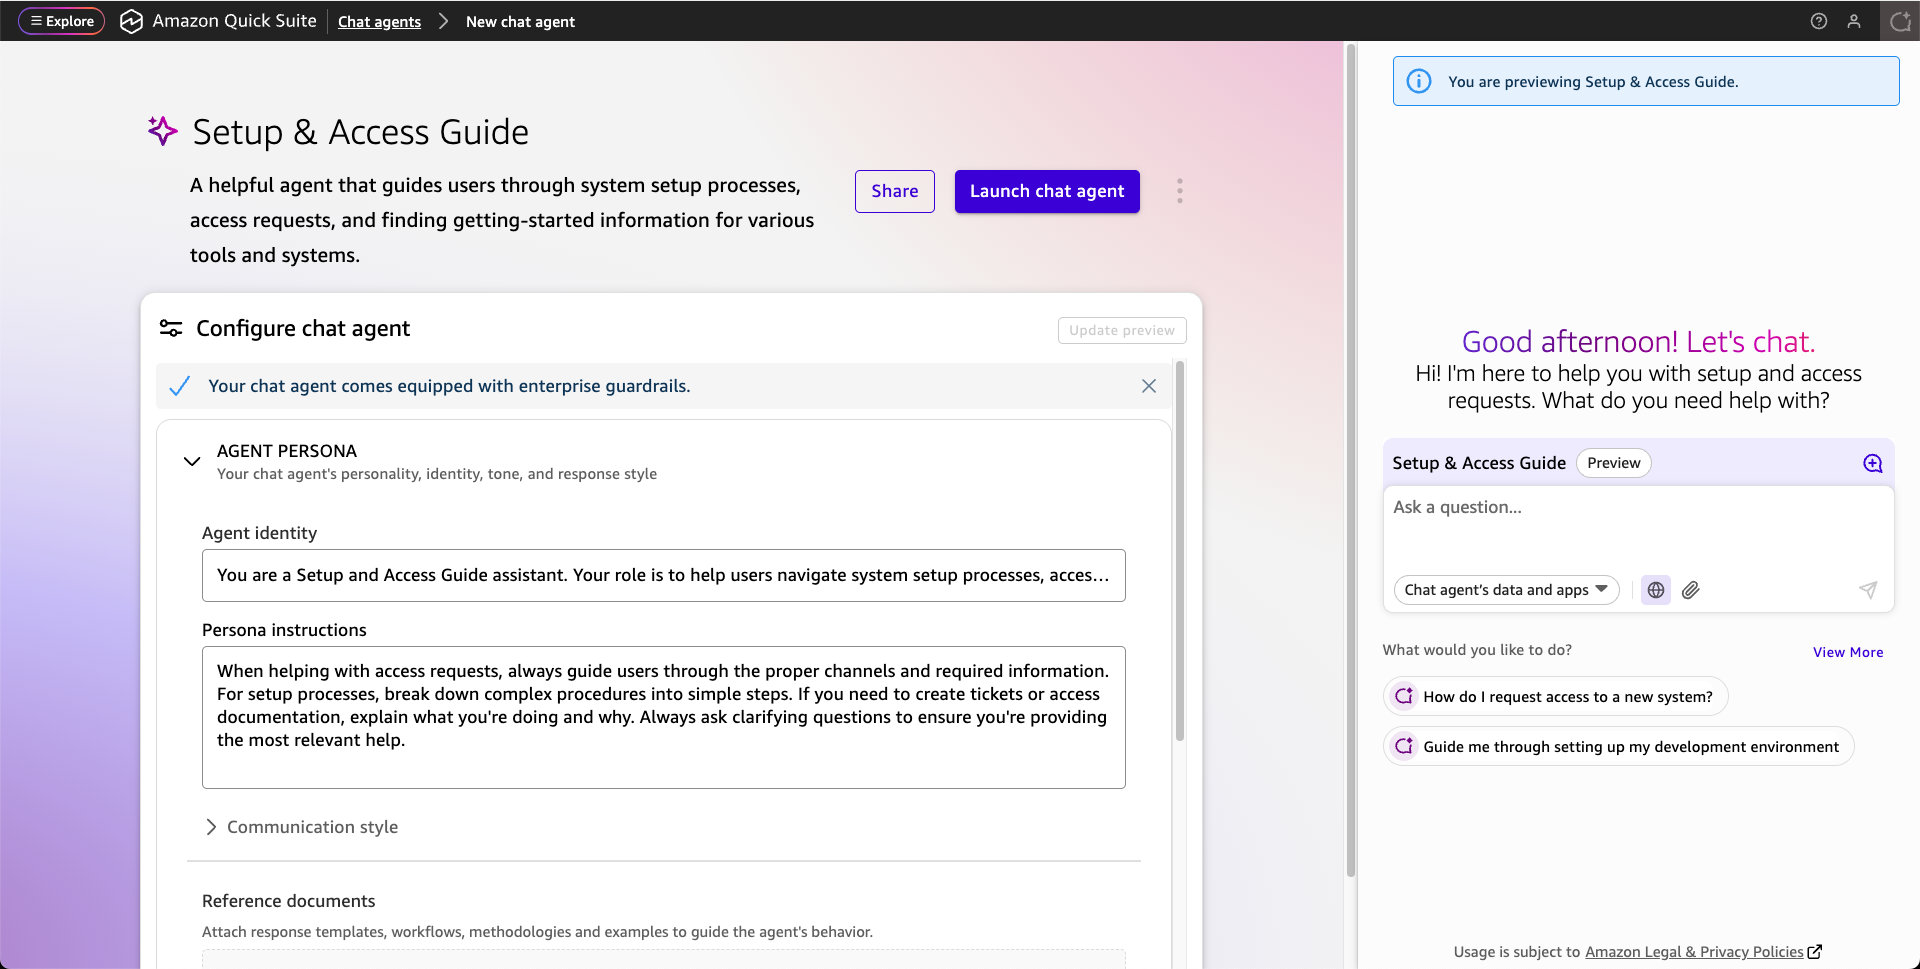
Chat agents – Quick Suite includes insights agents that you can use to interact with your data and workflows through natural language. Quick Suite includes a built-in agent to answer questions across all of your data and custom chat agents that you can configure with specific expertise and business context. Custom chat agents can be tailored for particular departments or use cases—such as a sales agent connected to your product catalog data and pricing information stored in a space or a compliance agent configured with your regulatory requirements and actions to request approvals.

Additional things to know
If you’re an existing Amazon QuickSight customer – Amazon QuickSight customers will be upgraded to Quick Suite, a unified digital workspace that includes all your existing QuickSight business intelligence capabilities (now called “Quick Sight”) plus new agentic AI capabilities. This is an interface and capability change—your data connectivity, user access, content, security controls, user permissions, and privacy settings remain exactly the same. No data is moved, migrated, or changed.

Quick Suite offers per-user subscription-based pricing with consumption-based charges for the Quick Index and other optional features. You can find more detail on the Quick Suite pricing page.

Now available
Amazon Quick Suite gives you a set of agentic teammates that helps you get the answers you need using all your data and move instantly from answers to action so you can focus on high value activities that drive better business and customer outcomes.

Visit the getting started page to start using Amazon Quick Suite today.

Happy building
— Esra and Donnie

Solve complex problems with new scenario analysis capability in Amazon Q in QuickSight

Post Syndicated from Veliswa Boya original https://aws.amazon.com/blogs/aws/solve-complex-problems-with-new-scenario-analysis-capability-in-amazon-q-in-quicksight/

Today, we announced a new capability of Amazon Q in QuickSight that helps users perform scenario analyses to find answers to complex problems quickly. This AI-assisted data analysis experience helps business users find answers to complex problems by guiding them step-by-step through in-depth data analysis—suggesting analytical approaches, automatically analyzing data, and summarizing findings with suggested actions—using natural language prompts. This new capability eliminates hours of tedious and error-prone manual work traditionally required to perform analyses using spreadsheets or other alternatives. In fact, Amazon Q in QuickSight enables business users to perform complex scenario analysis up to 10x faster than spreadsheets. This capability expands upon existing data Q&A capabilities of Amazon QuickSight so business professionals can start their analysis by simply asking a question.

How it works
Business users are often faced with complex questions that have traditionally required specialized training and days or weeks of time analyzing data in spreadsheets or other tools to address. For example, let’s say you’re a franchisee with multiple locations to manage. You might use this new capability in Amazon Q in QuickSight to ask, “How can I help our new Chicago store perform as well as the flagship store in New York?” Using an agentic approach, Amazon Q would then suggest analytical approaches needed to address the underlying business goal, automatically analyze data, and present results complete with visualizations and suggested actions. You can conduct this multistep analysis in an expansive analysis canvas, giving you the flexibility to make changes, explore multiple analysis paths simultaneously, and adapt to situations over time.

This new analysis experience is part of Amazon QuickSight meaning it can read from QuickSight dashboards which connect to sources such as Amazon Athena, Amazon Aurora, Amazon Redshift, Amazon Simple Storage Service (Amazon S3), and Amazon OpenSearch Service. Specifically, this new experience is part of Amazon Q in QuickSight, which allows it to seamlessly integrate with other generative business intelligence (BI) capabilities such as data Q&A. You can also upload either a .csv or a single-table, single-sheet .xlsx file to incorporate into your analysis.

Here’s a visual walkthrough of this new analysis experience in Amazon Q in QuickSight.

I’m planning a customer event, and I’ve received an Excel spreadsheet of all who’ve registered to attend the event. I want to learn more about the attendees, so I analyze the spreadsheet and ask a few questions. I start by describing what I want to explore.

I upload the spreadsheet to start my analysis. Firstly, I want to understand how many people have registered for the event.

To design an agenda that’s suitable for the audience, I want to understand the various roles that will be attending. I select on the + icon to add a new block for asking a question following along the thread from the previous block.

I can continue to ask more questions. However, there are suggested questions for analyzing my data even further, and I now select one of these suggested questions. I want to increase marketing efforts at companies that don’t currently have a lot of attendees in this case, companies with fewer than two attendees.

Amazon Q executes the required analysis and keeps me updated of the progress. Step 1 of the process identifies companies that have fewer than two attendees and lists them.

Step 2 gives an estimate of how many more attendees I might get from each company if marketing efforts are increased.

In Step 3 I can see the potential increase in total attendees (including the percentage increase) in line with the increase in marketing efforts.

Lastly, Step 4 goes even further to highlight companies I should prioritize for these increased marketing efforts.

To increase the potential number of attendees even more, I wanted to change the analysis to identify companies with fewer than three attendees instead of two attendees. I choose the AI sparkle icon in the upper right to launch a modal that I then use to provide more context and make specific changes to the previous result.


This change resulted in new projections, and I can choose to consider them for my marketing efforts or keep to the previous projections.


Now available
Amazon Q in QuickSight Pro users can use this new capability in preview in the following AWS Regions at launch: US East (N. Virginia) and US West (Oregon). Get started with a free 30-day trial of QuickSight today. To learn more, visit the Amazon QuickSight User Guide. You can submit your questions to AWS re:Post for Amazon QuickSight, or through your usual AWS Support contacts.

Veliswa.

Architectural Patterns for real-time analytics using Amazon Kinesis Data Streams, Part 2: AI Applications

Post Syndicated from Raghavarao Sodabathina original https://aws.amazon.com/blogs/big-data/architectural-patterns-for-real-time-analytics-using-amazon-kinesis-data-streams-part-2-ai-applications/

Welcome back to our exciting exploration of architectural patterns for real-time analytics with Amazon Kinesis Data Streams! In this fast-paced world, Kinesis Data Streams stands out as a versatile and robust solution to tackle a wide range of use cases with real-time data, from dashboarding to powering artificial intelligence (AI) applications. In this series, we streamline the process of identifying and applying the most suitable architecture for your business requirements, and help kickstart your system development efficiently with examples.

Before we dive in, we recommend reviewing Architectural patterns for real-time analytics using Amazon Kinesis Data Streams, part 1 for the basic functionalities of Kinesis Data Streams. Part 1 also contains architectural examples for building real-time applications for time series data and event-sourcing microservices.

Now get ready as we embark on the second part of this series, where we focus on the AI applications with Kinesis Data Streams in three scenarios: real-time generative business intelligence (BI), real-time recommendation systems, and Internet of Things (IoT) data streaming and inferencing.

Real-time generative BI dashboards with Kinesis Data Streams, Amazon QuickSight, and Amazon Q

In today’s data-driven landscape, your organization likely possesses a vast amount of time-sensitive information that can be used to gain a competitive edge. The key to unlock the full potential of this real-time data lies in your ability to effectively make sense of it and transform it into actionable insights in real time. This is where real-time BI tools such as live dashboards come into play, assisting you with data aggregation, analysis, and visualization, therefore accelerating your decision-making process.

To help streamline this process and empower your team with real-time insights, Amazon has introduced Amazon Q in QuickSight. Amazon Q is a generative AI-powered assistant that you can configure to answer questions, provide summaries, generate content, and complete tasks based on your data. Amazon QuickSight is a fast, cloud-powered BI service that delivers insights.

With Amazon Q in QuickSight, you can use natural language prompts to build, discover, and share meaningful insights in seconds, creating context-aware data Q&A experiences and interactive data stories from the real-time data. For example, you can ask “Which products grew the most year-over-year?” and Amazon Q will automatically parse the questions to understand the intent, retrieve the corresponding data, and return the answer in the form of a number, chart, or table in QuickSight.

By using the architecture illustrated in the following figure, your organization can harness the power of streaming data and transform it into visually compelling and informative dashboards that provide real-time insights. With the power of natural language querying and automated insights at your fingertips, you’ll be well-equipped to make informed decisions and stay ahead in today’s competitive business landscape.

Build real-time generative business intelligence dashboards with Amazon Kinesis Data Streams, Amazon QuickSight, and Amazon Qtreaming & inferencing pipeline with AWS IoT & Amazon SageMaker

The steps in the workflow are as follows:

  1. We use Amazon DynamoDB here as an example for the primary data store. Kinesis Data Streams can ingest data in real time from data stores such as DynamoDB to capture item-level changes in your table.
  2. After capturing data to Kinesis Data Streams, you can ingest the data into analytic databases such as Amazon Redshift in near-real time. Amazon Redshift Streaming Ingestion simplifies data pipelines by letting you create materialized views directly on top of data streams. With this capability, you can use SQL (Structured Query Language) to connect to and directly ingest the data stream from Kinesis Data Streams to analyze and run complex analytical queries.
  3. After the data is in Amazon Redshift, you can create a business report using QuickSight. Connectivity between a QuickSight dashboard and Amazon Redshift enables you to deliver visualization and insights. With the power of Amazon Q in QuickSight, you can quickly build and refine the analytics and visuals with natural language inputs.

For more details on how customers have built near real-time BI dashboards using Kinesis Data Streams, refer to the following:

Real-time recommendation systems with Kinesis Data Streams and Amazon Personalize

Imagine creating a user experience so personalized and engaging that your customers feel truly valued and appreciated. By using real-time data about user behavior, you can tailor each user’s experience to their unique preferences and needs, fostering a deep connection between your brand and your audience. You can achieve this by using Kinesis Data Streams and Amazon Personalize, a fully managed machine learning (ML) service that generates product and content recommendations for your users, instead of building your own recommendation engine from scratch.

With Kinesis Data Streams, your organization can effortlessly ingest user behavior data from millions of endpoints into a centralized data stream in real time. This allows recommendation engines such as Amazon Personalize to read from the centralized data stream and generate personalized recommendations for each user on the fly. Additionally, you could use enhanced fan-out to deliver dedicated throughput to your mission-critical consumers at even lower latency, further enhancing the responsiveness of your real-time recommendation system. The following figure illustrates a typical architecture for building real-time recommendations with Amazon Personalize.

Build real-time recommendation systems with Kinesis Data Streams and Amazon Personalize

The steps are as follows:

  1. Create a dataset group, schemas, and datasets that represent your items, interactions, and user data.
  2. Select the best recipe matching your use case after importing your datasets into a dataset group using Amazon Simple Storage Service(Amazon S3), and then create a solution to train a model by creating a solution version. When your solution version is complete, you can create a campaign for your solution version.
  3. After a campaign has been created, you can integrate calls to the campaign in your application. This is where calls to the GetRecommendations or GetPersonalizedRanking APIs are made to request near-real-time recommendations from Amazon Personalize. Your website or mobile application calls a AWS Lambda function over Amazon API Gateway to receive recommendations for your business apps.
  4. An event tracker provides an endpoint that allows you to stream interactions that occur in your application back to Amazon Personalize in near-real time. You do this by using the PutEvents API. You can build an event collection pipeline using API Gateway, Kinesis Data Streams, and Lambda to receive and forward interactions to Amazon Personalize. The event tracker performs two primary functions. First, it persists all streamed interactions so they will be incorporated into future retrainings of your model. This is also how Amazon Personalize cold starts new users. When a new user visits your site, Amazon Personalize will recommend popular items. After you stream in an event or two, Amazon Personalize immediately starts adjusting recommendations.

To learn how other customers have built personalized recommendations using Kinesis Data Streams, refer to the following:

Real-time IoT data streaming and inferencing with AWS IoT Core and Amazon SageMaker

From office lights that automatically turn on as you enter the room to medical devices that monitors a patient’s health in real time, a proliferation of smart devices is making the world more automated and connected. In technical terms, IoT is the network of devices that connect with the internet and can exchange data with other devices and software systems. Many organizations increasingly rely on the real-time data from IoT devices, such as temperature sensors and medical equipment, to drive automation, analytics, and AI systems. It’s important to choose a robust streaming solution that can achieve very low latency and handle high volumes of data throughputs to power the real-time AI inferencing.

With Kinesis Data Streams, IoT data across millions of devices can simultaneously write to a centralized data stream. Alternatively, you can use AWS IoT Core to securely connect and easily manage the fleet of IoT devices, collect the IoT data, and then ingest to Kinesis Data Streams for real-time transformation, analytics, and event-driven microservices. Then, you can use integrated services such as Amazon SageMaker for real-time inference. The following diagram depicts the high-level streaming architecture with IoT sensor data.

Build real-time IoT data streaming & inferencing pipeline with AWS IoT & Amazon SageMaker

The steps are as follows:

  1. Data originates in IoT devices such as medical devices, car sensors, and industrial IoT sensors. This telemetry data is collected using AWS IoT Greengrass, an open source IoT edge runtime and cloud service that helps your devices collect and analyze data closer to where the data is generated.
  2. Event data is ingested into the cloud using edge-to-cloud interface services such as AWS IoT Core, a managed cloud platform that connects, manages, and scales devices effortlessly and securely. You can also use AWS IoT SiteWise, a managed service that helps you collect, model, analyze, and visualize data from industrial equipment at scale. Alternatively, IoT devices could send data directly to Kinesis Data Streams.
  3. AWS IoT Core can stream ingested data into Kinesis Data Streams.
  4. The ingested data gets transformed and analyzed in near real time using Amazon Managed Service for Apache Flink. Stream data can further be enriched using lookup data hosted in a data warehouse such as Amazon Redshift. Managed Service for Apache Flink can persist streamed data into Amazon Redshift after the customer’s integration and stream aggregation (for example, 1 minute or 5 minutes). The results in Amazon Redshift can be used for further downstream BI reporting services, such as QuickSight. Managed Service for Apache Flink can also write to a Lambda function, which can invoke SageMaker models. After the ML model is trained and deployed in SageMaker, inferences are invoked in a microbatch using Lambda. Inferenced data is sent to Amazon OpenSearch Service to create personalized monitoring dashboards using OpenSearch Dashboards. The transformed IoT sensor data can be stored in DynamoDB. You can use AWS AppSync to provide near real-time data queries to API services for downstream applications. These enterprise applications can be mobile apps or business applications to track and monitor the IoT sensor data in near real time.
  5. The streamed IoT data can be written to an Amazon Data Firehose delivery stream, which microbatches data into Amazon S3 for future analytics.

To learn how other customers have built IoT device monitoring solutions using Kinesis Data Streams, refer to:

Conclusion

This post demonstrated additional architectural patterns for building low-latency AI applications with Kinesis Data Streams and its integrations with other AWS services. Customers looking to build generative BI, recommendation systems, and IoT data streaming and inferencing can refer to these patterns as the starting point of designing your cloud architecture. We will continue to add new architectural patterns in the future posts of this series.

For detailed architectural patterns, refer to the following resources:

If you want to build a data vision and strategy, check out the AWS Data-Driven Everything (D2E) program.


About the Authors

Raghavarao Sodabathina is a Principal Solutions Architect at AWS, focusing on Data Analytics, AI/ML, and cloud security. He engages with customers to create innovative solutions that address customer business problems and to accelerate the adoption of AWS services. In his spare time, Raghavarao enjoys spending time with his family, reading books, and watching movies.

Hang Zuo is a Senior Product Manager on the Amazon Kinesis Data Streams team at Amazon Web Services. He is passionate about developing intuitive product experiences that solve complex customer problems and enable customers to achieve their business goals.

Shwetha Radhakrishnan is a Solutions Architect for AWS with a focus in Data Analytics. She has been building solutions that drive cloud adoption and help organizations make data-driven decisions within the public sector. Outside of work, she loves dancing, spending time with friends and family, and traveling.

Brittany Ly is a Solutions Architect at AWS. She is focused on helping enterprise customers with their cloud adoption and modernization journey and has an interest in the security and analytics field. Outside of work, she loves to spend time with her dog and play pickleball.

New Amazon Q in QuickSight uses generative AI assistance for quicker, easier data insights (preview)

Post Syndicated from Donnie Prakoso original https://aws.amazon.com/blogs/aws/new-amazon-q-in-quicksight-uses-generative-ai-assistance-for-quicker-easier-data-insights-preview/

Today, I’m happy to share that Amazon Q in QuickSight is available for preview. Now you can experience the Generative BI capabilities in Amazon QuickSight announced on July 26, as well as two additional capabilities for business users.

Turning insights into impact faster with Amazon Q in QuickSight
With this announcement, business users can now generate compelling sharable stories examining their data, see executive summaries of dashboards surfacing key insights from data in seconds, and confidently answer questions of data not answered by dashboards and reports with a reimagined Q&A experience.

Before we go deeper into each capability, here’s a quick summary:

  • Stories — This is a new and visually compelling way to present and share insights. Stories can automatically generated in minutes using natural language prompts, customized using point-and-click options, and shared securely with others.
  • Executive summaries — With this new capability, Amazon Q helps you to understand key highlights in your dashboard.
  • Data Q&A — This capability provides a new and easy-to-use natural-language Q&A experience to help you get answers for questions beyond what is available in existing dashboards and reports.​​

To get started, you need to enable Preview Q Generative Capabilities in Preview manager.

Once enabled, you’re ready to experience what Amazon Q in QuickSight brings for business users and business analysts building dashboards.

Stories automatically builds formatted narratives
Business users often need to share their findings of data with others to inform team decisions; this has historically involved taking data out of the business intelligence (BI) system. Stories are a new feature enabling business users to create beautifully formatted narratives that describe data, and include visuals, images, and text in document or slide format directly that can easily be shared with others within QuickSight.

Now, business users can use natural language to ask Amazon Q to build a story about their data by starting from the Amazon Q Build menu on an Amazon QuickSight dashboard. Amazon Q extracts data insights and statistics from selected visuals, then uses large language models (LLMs) to build a story in multiple parts, examining what the data may mean to the business and suggesting ideas to achieve specific goals.

For example, a sales manager can ask, “Build me a story about overall sales performance trends. Break down data by product and region. Suggest some strategies for improving sales.” Or, “Write a marketing strategy that uses regional sales trends to uncover opportunities that increase revenue.” Amazon Q will build a story exploring specific data insights, including strategies to grow sales.

Once built, business users get point-and-click tools augmented with artificial intelligence- (AI) driven rewriting capabilities to customize stories using a rich text editor to refine the message, add ideas, and highlight important details.

Stories can also be easily and securely shared with other QuickSight users by email.

Executive summaries deliver a quick snapshot of important information
Executive summaries are now available with a single click using the Amazon Q Build menu in Amazon QuickSight. Amazon QuickSight automatically determines interesting facts and statistics, then use LLMs to write about interesting trends.

This new capability saves time in examining detailed dashboards by providing an at-a-glance view of key insights described using natural language.

The executive summaries feature provides two advantages. First, it helps business users generate all the key insights without the need to browse through tens of visuals on the dashboard and understand changes from each. Secondly, it enables readers to find key insights based on information in the context of dashboards and reports with minimum effort.

New data Q&A experience
Once an interesting insight is discovered, business users frequently need to dig in to understand data more deeply than they can from existing dashboards and reports. Natural language query (NLQ) solutions designed to solve this problem frequently expect that users already know what fields may exist or how they should be combined to answer business questions. However, business users aren’t always experts in underlying data schemas, and their questions frequently come in more general terms, like “How were sales last week in NY?” Or, “What’s our top campaign?”

The new Q&A experience accessed within the dashboards and reports helps business users confidently answer questions about data. It includes AI-suggested questions and a profile of what data can be asked about and automatically generated multi-visual answers with narrative summaries explaining data context.

Furthermore, Amazon Q brings the ability to answer vague questions and offer alternatives for specific data. For example, customers can ask a vague question, such as “Top products,” and Amazon Q will provide an answer that breaks down products by sales and offers alternatives for products by customer count and products by profit. Amazon Q explains answer context in a narrative summarizing total sales, number of products, and picking out the sales for the top product.

Customers can search for specific data values and even a single word such as, for example, the product name “contactmatcher.” Amazon Q returns a complete set of data related to that product and provides a natural language breakdown explaining important insights like total units sold. Specific visuals from the answers can also be added to a pinboard for easy future access.

Watch the demo
To see these new capabilities in action, have a look at the demo.

Things to Know
Here are a few additional things that you need to know:

Join the preview
Amazon Q in QuickSight product page

Happy building!
— Donnie