Post Syndicated from Aparajithan Vaidyanathan original https://aws.amazon.com/blogs/big-data/derive-operational-insights-from-application-logs-using-automated-data-analytics-on-aws/
Automated Data Analytics (ADA) on AWS is an AWS solution that enables you to derive meaningful insights from data in a matter of minutes through a simple and intuitive user interface. ADA offers an AWS-native data analytics platform that is ready to use out of the box by data analysts for a variety of use cases. With ADA, teams can ingest, transform, govern, and query diverse datasets from a range of data sources without requiring specialist technical skills. ADA provides a set of pre-built connectors to ingest data from a wide range of sources including Amazon Simple Storage Service (Amazon S3), Amazon Kinesis Data Streams, Amazon CloudWatch, Amazon CloudTrail, and Amazon DynamoDB as well as many others.
ADA provides a foundational platform that can be used by data analysts in a diverse set of use cases including IT, finance, marketing, sales, and security. ADA’s out-of-the-box CloudWatch data connector allows data ingestion from CloudWatch logs in the same AWS account in which ADA has been deployed, or from a different AWS account.
In this post, we demonstrate how an application developer or application tester is able to use ADA to derive operational insights of applications running in AWS. We also demonstrate how you can use the ADA solution to connect to different data sources in AWS. We first deploy the ADA solution into an AWS account and set up the ADA solution by creating data products using data connectors. We then use the ADA Query Workbench to join the separate datasets and query the correlated data, using familiar Structured Query Language (SQL), to gain insights. We also demonstrate how ADA can be integrated with business intelligence (BI) tools such as Tableau to visualize the data and to build reports.
Solution overview
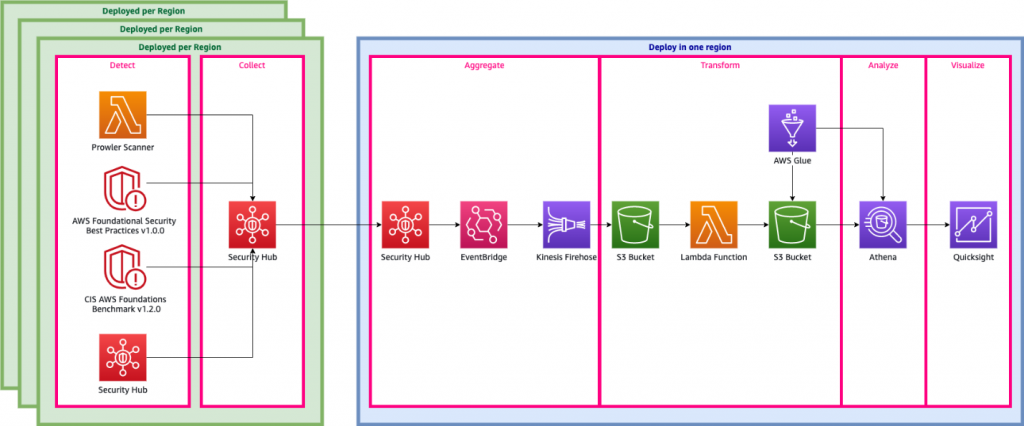
In this section, we present the solution architecture for the demo and explain the workflow. For the purposes of demonstration, the bespoke application is simulated using an AWS Lambda function that emits logs in Apache Log Format at a preset interval using Amazon EventBridge. This standard format can be produced by many different web servers and be read by many log analysis programs. The application (Lambda function) logs are sent to a CloudWatch log group. The historical application logs are stored in an S3 bucket for reference and for querying purposes. A lookup table with a list of HTTP status codes along with the descriptions is stored in a DynamoDB table. These three serve as sources from which data is ingested into ADA for correlation, query, and analysis. We deploy the ADA solution into an AWS account and set up ADA. We then create the data products within ADA for the CloudWatch log group, S3 bucket, and DynamoDB. As the data products are configured, ADA provisions data pipelines to ingest the data from the sources. With the ADA Query Workbench, you can query the ingested data using plain SQL for application troubleshooting or issue diagnosis.
The following diagram provides an overview of the architecture and workflow of using ADA to gain insights into application logs.

The workflow includes the following steps:
- A Lambda function is scheduled to be triggered at 2-minute intervals using EventBridge.
- The Lambda function emits logs that are stored at a specified CloudWatch log group under
/aws/lambda/CdkStack-AdaLogGenLambdaFunction. The application logs are generated using the Apache Log Format schema but stored in the CloudWatch log group in JSON format.
- The data products for CloudWatch, Amazon S3, and DynamoDB are created in ADA. The CloudWatch data product connects to the CloudWatch log group where the application (Lambda function) logs are stored. The Amazon S3 connector connects to an S3 bucket folder where the historical logs are stored. The DynamoDB connector connects to a DynamoDB table where the status codes that are referred by the application and historical logs are stored.
- For each of the data products, ADA deploys the data pipeline infrastructure to ingest data from the sources. When the data ingestion is complete, you can write queries using SQL via the ADA Query Workbench.
- You can log in to the ADA portal and compose SQL queries from the Query Workbench to gain insights in to the application logs. You can optionally save the query and share the query with other ADA users in the same domain. The ADA query feature is powered by Amazon Athena, which is a serverless, interactive analytics service that provides a simplified, flexible way to analyze petabytes of data.
- Tableau is configured to access the ADA data products via ADA egress endpoints. You then create a dashboard with two charts. The first chart is a heat map that shows the prevalence of HTTP error codes correlated with the application API endpoints. The second chart is a bar chart that shows the top 10 application APIs with a total count of HTTP error codes from the historical data.
Prerequisites
For this post, you need to complete the following prerequisites:
- Install the AWS Command Line Interface (AWS CLI), AWS Cloud Development Kit (AWS CDK) prerequisites, TypeScript-specific prerequisites, and git.
- Deploy the ADA solution in your AWS account in the
us-east-1 Region.
- Provide an admin email while launching the ADA AWS CloudFormation stack. This is needed for ADA to send the root user password. An admin phone number is required to receive a one-time password message if multi-factor authentication (MFA) is enabled. For this demo, MFA is not enabled.
- Build and deploy the sample application (available on the GitHub repo) solution so that the following resources can be provisioned in your account in the
us-east-1 Region:
- A Lambda function that simulates the logging application and an EventBridge rule that invokes the application function at 2-minute intervals.
- An S3 bucket with the relevant bucket policies and a CSV file that contains the historical application logs.
- A DynamoDB table with the lookup data.
- Relevant AWS Identity and Access Management (IAM) roles and permissions required for the services.
- Optionally, install Tableau Desktop, a third-party BI provider. For this post, we use Tableau Desktop version 2021.2. There is a cost involved in using a licensed version of the Tableau Desktop application. For additional details, refer to the Tableau licensing information.
Deploy and set up ADA
After ADA is deployed successfully, you can log in using the admin email provided during the installation. You then create a domain named CW_Domain. A domain is a user-defined collection of data products. For example, a domain might be a team or a project. Domains provide a structured way for users to organize their data products and manage access permissions.
- On the ADA console, choose Domains in the navigation pane.
- Choose Create domain.
- Enter a name (
CW_Domain) and description, then choose Submit.

Set up the sample application infrastructure using AWS CDK
The AWS CDK solution that deploys the demo application is hosted on GitHub. The steps to clone the repo and to set up the AWS CDK project are detailed in this section. Before you run these commands, be sure to configure your AWS credentials. Create a folder, open the terminal, and navigate to the folder where the AWS CDK solution needs to be installed. Run the following code:
gh repo clone aws-samples/operational-insights-with-automated-data-analytics-on-aws
cd operational-insights-with-automated-data-analytics-on-aws
npm install
npm run build
cdk synth
cdk deploy
These steps perform the following actions:
- Install the library dependencies
- Build the project
- Generate a valid CloudFormation template
- Deploy the stack using AWS CloudFormation in your AWS account
The deployment takes about 1–2 minutes and creates the DynamoDB lookup table, Lambda function, and S3 bucket containing the historical log files as outputs. Copy these values to a text editing application, such as Notepad.

Create ADA data products
We create three different data products for this demo, one for each data source that you’ll be querying to gain operational insights. A data product is a dataset (a collection of data such as a table or a CSV file) that has been successfully imported into ADA and that can be queried.
Create a CloudWatch data product
First, we create a data product for the application logs by setting up ADA to ingest the CloudWatch log group for the sample application (Lambda function). Use the CdkStack.LambdaFunction output to get the Lambda function ARN and locate the corresponding CloudWatch log group ARN on the CloudWatch console.

Then complete the following steps:
- On the ADA console, navigate to the ADA domain and create a CloudWatch data product.
- For Name¸ enter a name.
- For Source type, choose Amazon CloudWatch.
- Disable Automatic PII.
ADA has a feature that automatically detects personally identifiable information (PII) data during import that is enabled by default. For this demo, we disable this option for the data product because the discovery of PII data is not in the scope of this demo.
- Choose Next.

- Search for and choose the CloudWatch log group ARN copied from the previous step.

- Copy the log group ARN.

- On the data product page, enter the log group ARN.
- For CloudWatch Query, enter a query that you want ADA to get from the log group.
In this demo, we query the @message field because we’re interested in getting the application logs from the log group.

- Select how the data updates are triggered after initial import.
ADA can be configured to ingest the data from the source at flexible intervals (up to 15 minutes or later) or on demand. For the demo, we set the data updates to run hourly.
- Choose Next.

Next, ADA will connect to the log group and query the schema. Because the logs are in Apache Log Format, we transform the logs into separate fields so that we can run queries on the specific log fields. ADA provides four default transformations and supports custom transformation through a Python script. In this demo, we run a custom Python script to transform the JSON message field into Apache Log Format fields.
- Choose Transform schema.

- Choose Create new transform.

- Upload the
apache-log-extractor-transform.py script from the /asset/transform_logs/ folder.
- Choose Submit.

ADA will transform the CloudWatch logs using the script and present the processed schema.
- Choose Next.

- In the last step, review the steps and choose Submit.
ADA will start the data processing, create the data pipelines, and prepare the CloudWatch log groups to be queried from the Query Workbench. This process will take a few minutes to complete and will be shown on the ADA console under Data Products.

Create an Amazon S3 data product
We repeat the steps to add the historical logs from the Amazon S3 data source and look up reference data from the DynamoDB table. For these two data sources, we don’t create custom transforms because the data formats are in CSV (for historical logs) and key attributes (for reference lookup data).
- On the ADA console, create a new data product.
- Enter a name (
hist_logs) and choose Amazon S3.

- Copy the Amazon S3 URI (the text after
arn:aws:s3:::) from the CdkStack.S3 output variable and navigate to the Amazon S3 console.
- In the search box, enter the copied text, open the S3 bucket, select the
/logs folder, and choose Copy S3 URI.
The historical logs are stored in this path.

- Navigate back to the ADA console and enter the copied S3 URI for S3 location.
- For Update Trigger, select On Demand because the historical logs are updated at an unspecified frequency.
- For Update Policy, select Append to append newly imported data to the existing data.
- Choose Next.

ADA processes the schema for the files in the selected folder path. Because the logs are in CSV format, ADA is able to read the column names without requiring additional transformations. However, the columns status_code and request_size are inferred as long type by ADA. We want to keep the column data types consistent among the data products so that we can join the data tables and query the data. The column status_code will be used to create joins across the data tables.
- Choose Transform schema to change the data types of the two columns to string data type.

Note the highlighted column names in the Schema preview pane prior to applying the data type transformations.
- In the Transform plan pane, under Built-in transforms, choose Apply Mapping.
This option allows you to change the data type from one type to another.

- In the Apply Mapping section, deselect Drop other fields.
If this option is not disabled, only the transformed columns will be preserved and all other columns will be dropped. Because we want to retain all the columns, we disable this option.
- Under Field Mappings¸ for Old name and New name, enter
status_code and for New type, enter string.

- Choose Add Item.

- For Old name and New name¸ enter request_size and for New data type, enter string.
- Choose Submit.

ADA will apply the mapping transformation on the Amazon S3 data source. Note the column types in the Schema preview pane.
- Choose View sample to preview the data with the transformation applied.

ADA will display the PII data acknowledgement to ensure that either only authorized users can view the data or that the dataset doesn’t contain any PII data.
- Choose Agree to continue to view the sample data.

Note that the schema is identical to the CloudWatch log group schema because both the current application and historical application logs are in Apache Log Format.

- In the final step, review the configuration and choose Submit.

ADA starts processing the data from the Amazon S3 source, creates the backend infrastructure, and prepares the data product. This process takes a few minutes depending upon the size of the data.

Create a DynamoDB data product
Lastly, we create a DynamoDB data product. Complete the following steps:
- On the ADA console, create a new data product.
- Enter a name (
lookup) and choose Amazon DynamoDB.

- Enter the
Cdk.DynamoDBTable output variable for DynamoDB Table ARN.
This table contains key attributes that will be used as a lookup table in this demo. For the lookup data, we are using the HTTP codes and long and short descriptions of the codes. You can also use PostgreSQL, MySQL, or a CSV file source as an alternative.
- For Update Trigger, select On-Demand.
The updates will be on demand because the lookup is mostly for reference purpose while querying and any updates to the lookup data can be updated in ADA using on-demand triggers.
- Choose Next.
ADA reads the schema from the underlying DynamoDB schema and presents the column name and type for optional transformation. We will proceed with the default schema selection because the column types are consistent with the types from the CloudWatch log group and Amazon S3 CSV data source. Having data types that are consistent across the data sources allows us to write queries to fetch records by joining the tables using the column fields. For example, the column key in the DynamoDB schema corresponds to the status_code in the Amazon S3 and CloudWatch data products. We can write queries that can join the three tables using the column name key. An example is shown in the next section.
- Choose Continue with current schema.

- Review the configuration and choose Submit.
ADA will process the data from the DynamoDB table data source and prepare the data product. Depending upon the size of the data, this process takes a few minutes.

Now we have all the three data products processed by ADA and available for you to run queries.

Use the Query Workbench to query the data
ADA allows you to run queries against the data products while abstracting the data source and making it accessible using SQL (Structured Query Language). You can write queries and join the tables just as you would query against tables in a relational database. We demonstrate ADA’s querying capability via two user scenarios. In both the scenarios, we join an application log dataset to the error codes lookup table. In the first use case, we query the current application logs to identify the top 10 most accessed application endpoints along with the corresponding HTTP status codes:
--Query the top 10 Application endpoints along with the corresponding HTTP request type and HTTP status code.

SELECT logs.endpoint AS Application_EndPoint, logs.http_request AS REQUEST, count(logs.endpoint) as Endpoint_Count, ref.key as HTTP_Status_Code, ref.short as Description
FROM cw_domain.cloud_watch_application_logs logs
INNER JOIN cw_domain.lookup ref ON logs.status_code = ref.key
where logs.status_code LIKE '4%%' OR logs.status_code LIKE '5%%' -- = '/v1/server'
GROUP BY logs.endpoint, logs.http_request, ref.key, ref.short
ORDER BY Endpoint_Count DESC
LIMIT 10

In the second example, we query the historical logs table to get the top 10 application endpoints with the most errors to understand the endpoint call pattern:
-- Query Historical Logs to get the top 10 Application Endpoints with most number of errors along with an explanation of the error code.

SELECT endpoint as Application_EndPoint, count(status_code) as Error_Count, ref.long as Description FROM cw_domain.hist_logs hist
INNER JOIN cw_domain.lookup ref ON hist.status_code = ref.key
WHERE hist.status_code LIKE '4%%' OR hist.status_code LIKE '5%%'
GROUP BY endpoint, status_code, ref.long
ORDER BY Error_Count desc
LIMIT 10

In addition to querying, you can optionally save the query and share the saved query with other users in the same domain. The shared queries are accessible directly from the Query Workbench. The query results can also be exported to CSV format.

Visualize ADA data products in Tableau
ADA offers the ability to connect to third-party BI tools to visualize data and create reports from the ADA data products. In this demo, we use ADA’s native integration with Tableau to visualize the data from the three data products we configured earlier. Using Tableau’s Athena connector and following the steps in Tableau configuration, you can configure ADA as a data source in Tableau. After a successful connection has been established between Tableau and ADA, Tableau will populate the three data products under the Tableau catalog cw_domain.

We then establish a relationship across the three databases using the HTTP status code as the joining column, as shown in the following screenshot. Tableau allows us to work in online and offline mode with the data sources. In online mode, Tableau will connect to ADA and query the data products live. In offline mode, we can use the Extract option to extract the data from ADA and import the data in to Tableau. In this demo, we import the data in to Tableau to make the querying more responsive. We then save the Tableau workbook. We can inspect the data from the data sources by choosing the database and Update Now.

With the data source configurations in place in Tableau, we can create custom reports, charts, and visualizations on the ADA data products. Let’s consider two use cases for visualizations.
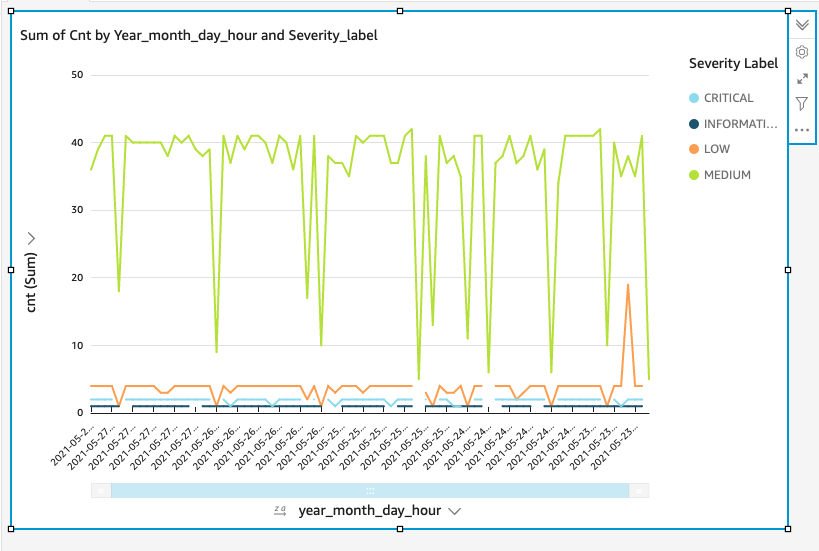
As shown in the following figure, we visualized the frequency of the HTTP errors by application endpoints using Tableau’s built-in heat map chart. We filtered out the HTTP status codes to only include error codes in the 4xx and 5xx range.

We also created a bar chart to depict the application endpoints from the historical logs ordered by the count of HTTP error codes. In this chart, we can see that the /v1/server/admin endpoint has generated the most HTTP error status codes.

Clean up
Cleaning up the sample application infrastructure is a two-step process. First, to remove the infrastructure provisioned for the purposes of this demo, run the following command in the terminal:
For the following question, enter y and AWS CDK will delete the resources deployed for the demo:
Are you sure you want to delete: CdkStack (y/n)? y
Alternatively, you can remove the resources via the AWS CloudFormation console by navigating to the CdkStack stack and choosing Delete.

The second step is to uninstall ADA. For instructions, refer to Uninstall the solution.
Conclusion
In this post, we demonstrated how to use the ADA solution to derive insights from application logs stored across two different data sources. We demonstrated how to install ADA on an AWS account and deploy the demo components using AWS CDK. We created data products in ADA and configured the data products with the respective data sources using the ADA’s built-in data connectors. We demonstrated how to query the data products using standard SQL queries and generate insights on the log data. We also connected the Tableau Desktop client, a third-party BI product, to ADA and demonstrated how to build visualizations against the data products.
ADA automates the process of ingesting, transforming, governing, and querying diverse datasets and simplifying the lifecycle management of data. ADA’s pre-built connectors allow you to ingest data from diverse data sources. Software teams with basic knowledge of AWS products and services will be able to set up an operational data analytics platform in a few hours and provide secure access to the data. The data can then be easily and quickly queried using an intuitive and standalone web user interface.
Try out ADA today to easily manage and gain insights from data.
About the authors
 Aparajithan Vaidyanathan is a Principal Enterprise Solutions Architect at AWS. He supports enterprise customers migrate and modernize their workloads on AWS cloud. He is a Cloud Architect with 23+ years of experience designing and developing enterprise, large-scale and distributed software systems. He specializes in Machine Learning & Data Analytics with focus on Data and Feature Engineering domain. He is an aspiring marathon runner and his hobbies include hiking, bike riding and spending time with his wife and two boys.
Rashim Rahman is a Software Developer based out of Sydney, Australia with 10+ years of experience in software development and architecture. He works primarily on building large scale open-source AWS solutions for common customer use cases and business problems. In his spare time, he enjoys sports and spending time with friends and family.
Hafiz Saadullah is a Principal Technical Product Manager at Amazon Web Services. Hafiz focuses on AWS Solutions, designed to help customers by addressing common business problems and use cases.


 Raghavarao Sodabathina is a Principal Solutions Architect at AWS, focusing on Data Analytics, AI/ML, and cloud security. He engages with customers to create innovative solutions that address customer business problems and to accelerate the adoption of AWS services. In his spare time, Raghavarao enjoys spending time with his family, reading books, and watching movies.
 Hang Zuo is a Senior Product Manager on the Amazon Kinesis Data Streams team at Amazon Web Services. He is passionate about developing intuitive product experiences that solve complex customer problems and enable customers to achieve their business goals.
 Shwetha Radhakrishnan is a Solutions Architect for AWS with a focus in Data Analytics. She has been building solutions that drive cloud adoption and help organizations make data-driven decisions within the public sector. Outside of work, she loves dancing, spending time with friends and family, and traveling.
 Brittany Ly is a Solutions Architect at AWS. She is focused on helping enterprise customers with their cloud adoption and modernization journey and has an interest in the security and analytics field. Outside of work, she loves to spend time with her dog and play pickleball.


 Aparajithan Vaidyanathan is a Principal Enterprise Solutions Architect at AWS. He supports enterprise customers migrate and modernize their workloads on AWS cloud. He is a Cloud Architect with 23+ years of experience designing and developing enterprise, large-scale and distributed software systems. He specializes in Machine Learning & Data Analytics with focus on Data and Feature Engineering domain. He is an aspiring marathon runner and his hobbies include hiking, bike riding and spending time with his wife and two boys.
 Hafiz Saadullah is a Principal Technical Product Manager at Amazon Web Services. Hafiz focuses on AWS Solutions, designed to help customers by addressing common business problems and use cases.