As the surface area for attacks on the web increases, Cloudflare’s Web Application Firewall (WAF) provides a myriad of solutions to mitigate these attacks. This is great for our customers, but the cardinality in the workloads of the millions of requests we service means that generating false positives is inevitable. This means that the default configuration we have for our customers has to be fine-tuned.
Fine-tuning isn’t an opaque process: customers have to get some data points and then decide what works for them. This post explains the technologies we offer to enable customers to see why the WAF takes certain actions — and the improvements that have been made to reduce noise and increase signal.
The Log action is great — can we do more?
Cloudflare’s WAF protects origin servers from different kinds of layer 7 attacks, which are attacks that target the application layer. Protection is provided with various tools like:
The Log action is used to simulate the behaviour of rules. This action proves that a rule expression is matched by the engine and emits a log event which can be accessed via Security Analytics, Security Events, Logpush or Edge Log Delivery.
Logs are great at validating a rule works as expected on the traffic it was expected to match, but showing that the rule matches isn’t sufficient, especially when a rule expression can take many code paths.
In pseudocode, an expression can look like:
If any of the http request headers contains an “authorization” key OR the lowercased representation of the http host header starts with “cloudflare” THEN log
The rules language syntax will be:
any(http.request.headers[*] contains "authorization") or starts_with(lower(http.host), "cloudflare")
Debugging this expression poses a couple of problems. Is it the left-hand side (LHS) or right-hand side (RHS) of the OR expression above that matches? Functions such as Base64 decoding, URL decoding, and in this case lowercasing can apply transformations to the original representation of these fields, which leads to further ambiguity as to which characteristics of the request led to a match.
To further complicate this, many rules in a ruleset can register matches. Rulesets like Cloudflare OWASP use a cumulative score of different rules to trigger an action when the score crosses a set threshold.
Additionally, the expressions of the Cloudflare Managed and OWASP rules are private. This increases our security posture – but it also means that customers can only guess what these rules do from their titles, tags and descriptions. For instance, one might be labeled “SonicWall SMA – Remote Code Execution – CVE:CVE-2025-32819.”
Which raises questions: What part of my request led to a match in the Rulesets engine? Are these false positives?
This is where payload logging shines. It can help us drill down to the specific fields and their respective values, post-transformation, in the rule that led to a match.
Payload logging
Payload logging is a feature that logs which fields in the request are associated with a rule that led to the WAF taking an action. This reduces ambiguity and provides useful information that can help spot check false positives, guarantee correctness, and aid in fine-tuning of these rules for better performance.
From the example above, a payload log entry will contain either the LHS or RHS of the expression, but not both.
How does payload logging work ?
The payload logging and Rulesets engines are built on Wirefilter, which has been explained extensively.
Fundamentally, these engines are objects written in Rust which implement a compiler trait. This trait drives the compilation of the abstract syntax trees (ASTs) derived from these expressions.
struct PayloadLoggingCompiler {
     regex_cache HashMap<String, Arc<Regex>>
}

impl wirefilter::Compiler for PayloadLoggingCompiler {
	type U = PayloadLoggingUserData

	fn compile_logical_expr(&mut self, node: LogicalExpr) -> CompiledExpr<Self::U> {
		// ...
		let regex = self.regex_cache.entry(regex_pattern)
		.or_insert_with(|| Arc::new(regex))
		// ...
	}

}
The Rulesets Engine executes an expression and if it evaluates to true, the expression and its execution context are sent to the payload logging compiler for re-evaluation. The execution context provides all the runtime values needed to evaluate the expression.
After re-evaluation is done, the fields involved in branches of the expression that evaluate to true are logged.
The structure of the log is a map of wirefilter fields and their values Map<Field, Value>
These logs go through our logging pipeline and can be read in different ways. Customers can configure a Logpush job to write to a custom Worker we built that uses the customer’s private key to automatically decrypt these logs. The Payload logging CLI tool, Worker, or the Cloudflare dashboard can also be used for decryption.
What improvements have been shipped?
In wirefilter, some fields are array types. The field http.request.headers.names is an array of all the header names in a request. For example:
An expression that reads any(http.request.headers.names[*] contains “c”) will evaluate to true because at least one of the headers contains the letter “c”. With the previous version of the payload logging compiler, all the headers in the “http.request.headers.names” field will be logged since it’s a part of the expression that evaluates to true.
Now, we partially evaluate the array fields and log the indexes that match the expressions constraint. In this case, it’ll be just the headers that contain a “c”!
This brings us to operators in wirefilter. Some operators like “eq” result in exact matches, e.g. http.host eq “a.com”. There are other operators that result in “partial” matches – like “in”, “contains”, “matches” – that work alongside regexes.
The expression in this example: `any(http.request.headers[*] contains “c”)` uses a “contains” operator which produces a partial match. It also uses the “any” function which we can say produces a partial match, because if at least one of the headers contains a “c”, then we should log that header – not all the headers as we did in the previous version.
With the improvements to the payload logging compiler, when these expressions are evaluated, we log just the partial matches. In this case, the new payload logging compiler handles the “contains” operator similarly to the “find” method for bytes in the Rust standard library. This improves our payload log to:
http.request.headers.names[0,1] = [“c”, “c”]
This makes things a lot clearer. It also saves our logging pipeline from processing millions of bytes. For example, a field that is analyzed a lot is the request body — http.request.body.raw — which can be tens of kilobytes in size. Sometimes the expressions are checking for a regex pattern that should match three characters. In this case we’ll be logging 3 bytes instead of kilobytes!
Context
I know, I know, [“c”, “c”] doesn’t really mean much. Even if we’ve provided the exact reason for the match and are significantly saving on the volume of bytes written to our customers storage destinations, the key goal is to provide useful debugging information to the customer. As part of the payload logging improvements, the compiler now also logs a “before” and “after” (if applicable) for partial matches. The size for these buffers are currently 15 bytes each. This means our payload log now looks like:
http.request.headers[0,1] = [
    {
        before: null, // isnt included in the final log
        content: “c”,
        after: “ontent-length”
    },
    {
        before: null, // isnt included in the final log
        content: “c”,
        after:”ontent-type”
    }
]
Example of payload log (previous)
Example of payload log (new)
In the previous log, we have all the header values. In the new log, we have the 8th index which is a malicious script in a HTTP header. The match is on the “<script>” tag and the rest is the context which is the text in gray.
Optimizations
Managed rules rely heavily on regular expressions to fingerprint malicious requests. Parsing and compiling these expressions are CPU-intensive tasks. As managed rules are written once and deployed across millions of zones, we benefit from compiling these regexes and caching them in memory. This saves us CPU cycles as we don’t have to re-compile these until the process restarts.
The Payload logging compiler uses a lot of dynamically sized arrays or vectors to store the intermediate state for these logs. Crates like smallvec are also used to reduce heap allocations.
The infamous “TRUNCATED” value
Sometimes, customers see “truncated” in their payload logs. This is because every firewall event has a size limit in bytes. When this limit is exceeded, the payload log is truncated.
Payload log (previous)
Payload log (new)
We have seen the p50 byte size of the payload logs shrink from 1.5 Kilobytes to 500 bytes – a 67% reduction! That means way fewer truncated payload logs.
What’s next?
We’re currently using a lossy representation of utf-8 strings to represent values. This means that non-valid utf-8 strings like multimedia are represented as U+FFFD unicode replacement characters. For rules that will work on binary data, the integrity of these values should be preserved with byte arrays or with a different serialization format.
The storage format for payload logging is JSON. We’ll be benchmarking this alongside other binary formats like CBOR, Cap’n Proto, Protobuf, etc., to see how much processing time this saves our pipeline. This will help us deliver logs to our customers faster, with the added advantage that binary formats can also help with maintaining a defined schema that will be backward compatible.
Finally, payload logging only works with Managed rules. It will be rolled out to other Cloudflare WAF products like custom rules, WAF attack score, content scanning, Firewall for AI, and more.
An example of payload logging showing prompts containing PII, detected by Firewall for AI:
Why should I be excited?
Visibility into the actions taken by the WAF will give customers assurance that their rules or configurations are doing exactly what they expect. Improvements to the specificity of payload logging is a step in this direction — and in the pipeline are further improvements to reliability, latency, and expansion to more WAF products.
As this was a breaking change to the JSON schema, we’ve rolled this out slowly to customers with adequate documentation.
You can use Amazon Security Lake to simplify log data collection and retention for Amazon Web Services (AWS) and non-AWS data sources. To make sure that you get the most out of your implementation requires proper planning.
In this post, we will show you how to plan and implement a proof of concept (POC) for Security Lake to help you determine the functionality and value of Security Lake in your environment, so that your team can confidently design and implement in production. We will walk you through the following steps:
Understand the functionality and value of Security Lake
Determine success criteria for the POC
Define your Security Lake configuration
Prepare for deployment
Enable Security Lake
Validate deployment
Understand the functionality of Security Lake
Figure 1 summarizes the main features of Security Lake and the context of how to use it:
Figure 1: Overview of Security Lake functionality
As shown in the figure, Security Lake ingests and normalizes logs from data sources such as AWS services, AWS Partner sources, and custom sources. Security Lake also manages the lifecycle, orchestration, and subscribers. Subscribers can be AWS services, such as Amazon Athena, or AWS Partner subscribers.
There are four primary functions that Security Lake provides:
Centralize visibility to your data from AWS environments, SaaS providers, on-premises, and other cloud data sources — You can collect log sources from AWS services such as AWS CloudTrail management events, Amazon Simple Storage Service (Amazon S3) data events, AWS Lambda data events, Amazon Route 53 Resolver logs, VPC Flow Logs, and AWS Security Hub findings, in addition to log sources from on-premises, other cloud services, SaaS applications, and custom sources. Security Lake automatically aggregates the security data across AWS Regions and accounts.
Normalize your security data to an open standard — Security Lake normalizes log sources in a common schema, the Open Security Schema Framework (OCSF), and stores them in compressed parquet files.
Use your preferred analytics tools to analyze your security data — You can use AWS tools, such as Athena and Amazon OpenSearch Service, or you can utilize external security tools to analyze the data in Security Lake.
Optimize and manage your security data for more efficient storage and query — Security Lake manages the lifecycle of your data with customizable retention settings with automated storage tiering to help provide more cost-effective storage.
Determine success criteria
By establishing success criteria, you can assess whether Security Lake has helped address the challenges that you are facing. Some example success criteria include:
I need to centrally set up and store AWS logs across my organization in AWS Organizations for multiple log sources.
I need to more efficiently collect VPC Flow Logs in my organization and analyze them in my security information and event management (SIEM) solution.
I want to use OpenSearch Service to replace my on-premises SIEM.
I want to collect AWS log sources and custom sources for machine learning with Amazon Sagemaker.
I need to establish a dashboard in Amazon QuickSight to visualize my Security Hub findings and a custom log source data.
Review your success criteria to make sure that your goals are realistic given your timeframe and potential constraints that are specific to your organization. For example, do you have full control over the creation of AWS services that are deployed in an organization? Do you have resources that can dedicate time to implement and test? Is this time convenient for relevant stakeholders to evaluate the service?
The timeframe of your POC will depend on your answers to these questions.
Important: Security Lake has a 15-day free trial per account that you use from the time that you enable Security Lake. This is the best way to estimate the costs for each Region throughout the trial, which is an important consideration when you configure your POC.
Define your Security Lake configuration
After you establish your success criteria, you should define your desired Security Lake configuration. Some important decisions include the following:
Determine AWS log sources — Decide which AWS log sources to collect. For information about the available options, see Collecting data from AWS services.
Determine third-party log sources — Decide if you want to include non-AWS service logs as sources in your POC. For more information about your options, see Third-party integrations with Security Lake; the integrations listed as “Source” can send logs to Security Lake.
Note: You can add third-party integrations after the POC or in a second phase of the POC. Pre-planning will be required to make sure that you can get these set up during the 15-day free trial. Third-party integrations usually take more time to set up than AWS service logs.
Select a delegated administrator – Identify which account will serve as the delegated administrator. Make sure that you have the appropriate permissions from the organization admin account to identify and enable the account that will be your Security Lake delegated administrator. This account will be the location for the S3 buckets with your security data and where you centrally configure Security Lake. The AWS Security Reference Architecture (AWS SRA) recommends that you use the AWS logging account for this purpose. In addition, make sure to review Important considerations for delegated Security Lake administrators.
Select accounts in scope — Define which accounts to collect data from. To get the most realistic estimate of the cost of Security Lake, enable all accounts across your organization during the free trial.
Determine analytics tool — Determine if you want to use native AWS analytics tools, such as Athena and OpenSearch Service, or an existing SIEM, where the SIEM is a subscriber to Security Lake.
Define log retention and Regions — Define your log retention requirements and Regional restrictions or considerations.
Prepare for deployment
After you determine your success criteria and your Security Lake configuration, you should have an idea of your stakeholders, desired state, and timeframe. Now you need to prepare for deployment. In this step, you should complete as much as possible before you deploy Security Lake. The following are some steps to take:
Create a project plan and timeline so that everyone involved understands what success look like and what the scope and timeline is.
Define the relevant stakeholders and consumers of the Security Lake data. Some common stakeholders include security operations center (SOC) analysts, incident responders, security engineers, cloud engineers, finance, and others.
Define who is responsible, accountable, consulted, and informed during the deployment. Make sure that team members understand their roles.
Consider other technical prerequisites that you need to accomplish. For example, if you need roles in addition to what Security Lake creates for custom extract, transform, and load (ETL) pipelines for custom sources, can you work with the team in charge of that process before the POC?
Enable Security Lake
The next step is to enable Security Lake in your environment and configure your sources and subscribers.
Deploy Security Lake across the Regions, accounts, and AWS log sources that you previously defined.
Configure custom sources that are in scope for your POC.
Configure analytics tools in scope for your POC.
Validate deployment
The final step is to confirm that you have configured Security Lake and additional components, validate that everything is working as intended, and evaluate the solution against your success criteria.
Validate log collection — Verify that you are collecting the log sources that you configured. To do this, check the S3 buckets in the delegated administrator account for the logs.
Validate analytics tool — Verify that you can analyze the log sources in your analytics tool of choice. If you don’t want to configure additional analytics tooling, you can use Athena, which is configured when you set up Security Lake. For sample Athena queries, see Amazon Security Lake Example Queries on GitHub and Security Lake queries in the documentation.
Obtain a cost estimate — In the Security Lake console, you can review a usage page to verify that the cost of Security Lake in your environment aligns with your expectations and budgets.
Assess success criteria — Determine if you achieved the success criteria that you defined at the beginning of the project.
Next steps
Next steps will largely depend on whether you decide to move forward with Security Lake.
Determine if you have the approval and budget to use Security Lake.
Expand to other data sources that can help you provide more security outcomes for your business.
Configure S3 lifecycle policies to efficiently store logs long term based on your requirements.
Let other teams know that they can subscribe to Security Lake to use the log data for their own purposes. For example, a development team that gets access to CloudTrail through Security Lake can analyze the logs to understand the permissions needed for an application.
Conclusion
In this blog post, we showed you how to plan and implement a Security Lake POC. You learned how to do so through phases, including defining success criteria, configuring Security Lake, and validating that Security Lake meets your business needs.
As a customer, this guide will help you run a successful proof of value (POV) with Security Lake. It guides you in assessing the value and factors to consider when deciding to implement the current features.
Effective security incident response depends on adequate logging, as described in the AWS Security Incident Response Guide. If you have the proper logs and the ability to query them, you can respond more rapidly and effectively to security events. If a security event occurs, you can use various log sources to validate what occurred and understand the scope. Then, you can use the results of your analysis to take remediation actions. To learn more about logging best practices, see Configure service and application logging and Analyze logs, findings, and metrics centrally.
In this blog post, we will show you how to achieve an effective strategy for logging for security incident response. We will share logging options across the typical cloud application stack, log analysis options, and sample queries. AWS offers managed services, such as Amazon GuardDuty for threat detection and Amazon Detective for incident analysis. If you want to collect additional logs or perform custom analysis, then you should consider the options described in this blog post.
Selection of logs
To select the appropriate logs for security incident response, you should start with the common cloud application stack, which consists of the components and layers of your application deployed on AWS. For each component, we will describe the logging sources that you have. For each log source, we will describe why you should log it for security incident response, how to enable the logs, and what your log storage options are.
To select the logs for security incident response, first consider the following questions:
What are your compliance and regulatory requirements for logging?
Note: Make sure that you comply with the log retention requirements of compliance standards relevant to your organization, as well as your organization’s incident response strategy.
What AWS services do you commonly use?
What AWS services have access to or contain sensitive data?
What threats are most relevant to you?
Note: Performing a threat model of your cloud architectures can help you answer this question. For more information, see How to approach threat modelling.
Considering these questions can help you develop requirements for logging that will guide your selection of the following log sources.
AWS account logs
An AWS account is the first, fundamental component of an application deployed on AWS. The account is a container for your AWS resources. You create and manage your AWS resources in this account, and the account provides administrative capabilities for access and billing.
AWS CloudTrail
Within an account, each action performed is an API call. From a console sign-in to the deployment of each resource in an AWS CloudFormation stack, events are generated to provide transparency on what has occurred in the account. With AWS CloudTrail, you can log, continuously monitor, and retain account activity related to actions across supported AWS services. CloudTrail provides the event history of your account activity, including actions taken through the AWS Management Console, AWS SDKs, command line tools, and other AWS services. CloudTrail logs API calls as three types of events:
Management events(also known as control plane operations) show management operations that are performed on resources in your account. This includes actions like creating an Amazon Simple Storage Service (Amazon S3) bucket and setting up logging.
Data events(also known as data plane operations) show the resource operations performed on or within resources in your account. These operations are often high-volume activities, such as Amazon S3 object-level API activity (for example, GetObject, DeleteObject, and PutObject API operations) and AWS Lambda function invocation activity.
Insights events capture unusual API call rate or error rate activity in your account. You must enable these events on a trail in order to capture them, and they are logged to a different folder prefix in the destination S3 bucket for your trail. Insights events provide you with information such as the type of event, the incident time period, the associated API, the error code, and statistics to help you understand and respond effectively to unusual activity.
For security investigations, CloudTrail provides context on the creation, modification, and deletion of AWS resources. Therefore, CloudTrail is one of your most important log sources for security incident response in an AWS environment. You have three primary ways to set up CloudTrail:
CloudTrail Event history — CloudTrail is enabled by default with 90-day retention of management events that you can retrieve through the CloudTrail Event history facility using the console, AWS Command line Interface (AWS CLI), or AWS SDK. You don’t need to take any action to get started using the Event history feature.
CloudTrail trail — For longer retention and visibility of data events, you need to create a CloudTrail trail and associate it with an S3 bucket and optionally with an Amazon CloudWatch log group. If you use AWS Organizations, you can create an organization trail that will log events for each account in the organization. By default, trails are multi-Region, so you don’t need to enable CloudTrail logs in each AWS Region.
AWS CloudTrail Lake — You can create a CloudTrail lake, which retains CloudTrail logs for up to seven years and provides a SQL-based querying facility. You don’t need to have a trail configured in your account to use CloudTrail Lake.
Amazon Security Lake — You can use Security Lake to ingest CloudTrail events, which include management and data events. You can further analyze these events with Amazon QuickSight or another other third-party security information and event management (SIEM) tool.
AWS Config
Creating and modifying resources is an integral part of your account use. Tracking resource configuration changes made by calling the AWS API helps you review changes throughout the resource lifecycle. AWS Config provides a detailed view of the configuration of AWS resources in your account, examines the resource configurations periodically, and tracks configuration changes that were not initiated by the API. This includes how the resources are related to one another and how they were configured in the past so that you can see how configurations and relationships change over time.
You should enable AWS Config in each Region where you have resources deployed, and you should configure an S3 bucket to receive configuration history and configuration snapshot files, which contain details on the resources that AWS Config records. You can then review configuration compliance and analyze activities performed before, during, and after an event using the configuration history in S3. You should centralize AWS Config resource tracking across multiple accounts in the same organization by setting up an aggregator. You can use AWS Control Tower to automate the setup.
During a security investigation, you might want to understand how a resource configuration has changed over time. For example, you might want to investigate the changes to an S3 bucket policy before and after a security event that involves an S3 bucket. AWS Config provides a configuration history for resources that can help you track activities performed during a security event.
Operating system and application logs
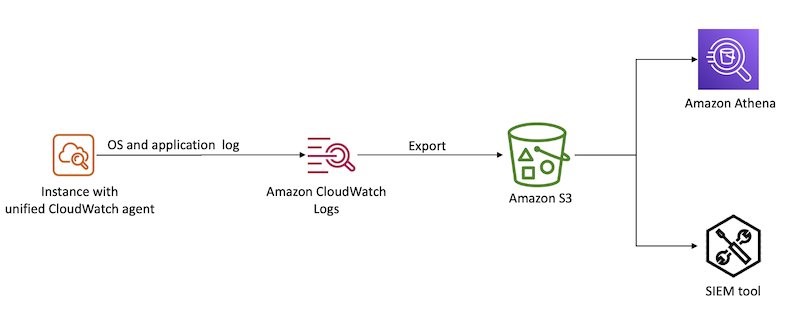
To record interactions with applications, you must capture operating system (OS) and application logs, especially custom logs generated by the application development framework. OS and local application logs are relevant for security events that involve an Amazon Elastic Compute Cloud (Amazon EC2) instance. These instances could be standalone, in an auto scaling group behind a load balancer, or compute workloads for Amazon Elastic Container Service (Amazon ECS) or an Amazon Elastic Kubernetes Service (Amazon EKS) cluster. OS logs track privileged use, processes, login events, access to directory services, and file system activity on a server. To analyze a potential compromise to an EC2 instance, you will want to review the security event logs for Windows OS and the system logs for Linux-based OS.
With the unified CloudWatch agent, you can collect metrics and logs from EC2 instances and on-premises servers. The CloudWatch agent aggregates log data into CloudWatch logs, which can then be exported to Amazon S3 for long-term retention and analyzed with a SIEM tool of your choice or Amazon Athena, as shown in Figure 1.
Figure 1: Aggregate OS and application logs using CloudWatch Logs
Database logs
With SQL databases, you can log transactions to help track modifications to the databases, such as additions or deletions. After an engine or system failure, you will need transaction logs to restore a database to a consistent state. Transaction logs are designed to be secure, and they require additional processing to access valuable information. It’s important that you understand data interactions during a security investigation, especially if your databases hold personally identifiable information (PII), financial and payments information, or other information subject to regulatory controls.
The goal of logging network activity is to gain insight into the communications that traverse your network. You might need this data for a variety of reasons, such as network troubleshooting or for use in a forensic investigation of suspected malware activity within your network.
In the AWS Cloud, you can log network activity by creating a proxy that logs network traffic or by using Traffic Mirroring to send a copy of network traffic to a logging server. You can adopt cloud-native approaches to capture this type of data using Amazon Route 53 DNS query logs and Amazon VPC Flow Logs.
There are also a variety of third-party networking solutions available like Palo Alto Networks and Fortinet, so you can continue to use the network logging mechanisms that you might have used in an on-premises environment.
Route 53 DNS query logs
You can configure Amazon Route 53 to log Domain Name System (DNS) queries. These logs are categorized into two groups:
Public DNS query logging
Resolver query logging
Logging public DNS queries against domains that you have hosted in Route 53 provides query information, such as the domain or subdomain requested, date and time stamp of the request, DNS record type, Route 53 edge location that responded, and response code.
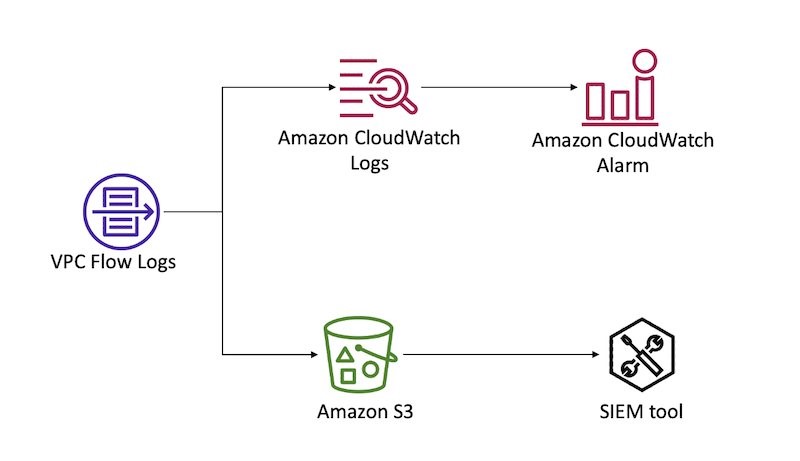
You can configure VPC Flow Logs for a VPC in your account to capture traffic that enters and moves around your VPC network, without the addition of instances or products. From these logs, you can review information, such as source and destination IP, ports, timestamps, protocol, account ID, and whether the traffic was accepted or rejected. For a complete list of the fields available for flow log records, see Available fields. You can create a flow log for a VPC, a subnet, or a network interface. If you create a flow log for a subnet or VPC, IP traffic going to and from each network interface in that subnet or VPC will be logged. For more details on VPC Flow Logs, see Logging IP traffic using VPC Flow Logs.
You can forward flow logs to Amazon CloudWatch Logs to create CloudWatch alarms based on metric filters. You can also forward flow logs to an S3 bucket for long-term retention and further analysis. Figure 2 demonstrates these configurations.
Figure 2: Sending VPC Flow logs to CloudWatch Logs and S3
Access logs
To identify access patterns for accessible endpoints, especially public endpoints, you should use access logs. Access logs capture detailed information about requests sent to your load balancer. Each log contains information such as the time the request was received, the client’s IP address, latencies, request paths, and server responses. With services built in layers behind a load balancer, unless you track the X-Forwarded-For request header, the requestor’s context is lost. Access logs help bridge that gap during investigations and analysis.
Amazon S3 server access logs
Access logs are critical to track object level access when using S3 buckets to store confidential or sensitive data. You can also turn on CloudTrail to capture S3 data events. You can store access logs in S3 buckets for long-term storage for compliance purposes and to run analyses during and after an event.
Load balancing logs
Elastic Load Balancing provides access logs that capture detailed information about requests sent to load balancers. Each log contains information such as the time the request was received, the client’s IP address, latencies, request paths, and server responses. You can use this log to analyze traffic patterns and to troubleshoot issues.
Access logs is an optional feature of Elastic Load Balancing that is turned off by default. To enable access logs for load balancers, see Access logs for your Application Load Balancer.
If you implement your own reverse proxy for load balancing needs, make sure that you capture the reverse proxy access logs. You can use the unified CloudWatch agent to forward the logs to CloudWatch. As with OS logs, you can export CloudWatch logs to an S3 bucket for long-term retention and analysis.
If you use an Amazon CloudFront distribution as the public endpoint for end users with load balancers as the custom origin, then load balancing access logs will represent the CloudFront distribution as the requestor, rather than the actual end user. If this information doesn’t add value to your incident handling process, then you can use CloudFront access logs as the log source that provides end user request details.
CloudFront access logs
You should enable standard logs, also known as access logs, when using CloudFront. Specify an S3 bucket where you want CloudFront to save the files.
CloudFront access logs are delivered on a best-effort basis. For information about requests made to a distribution in real time, use real-time logs that are delivered within seconds of receiving the requests. You should use real-time logs to monitor, analyze, and take action based on content delivery performance. For more details on the fields available from these logs, see the CloudFront standard log file format.
AWS WAF logs
When associated with a supported resource like a CloudFront distribution, Amazon API Gateway REST API, Application Load Balancer, AWS AppSync GraphQL API, Amazon Cognito user pool, or AWS App Runner, AWS WAF can help you monitor HTTP and HTTPS requests that are forwarded to the resource. You should configure web access control lists (ACLs) to gain fine-grained control over the requests, and enable logging for such ACLs to get detailed information about traffic that is analyzed by AWS WAF. Log information includes time of the request being received by AWS WAF from the AWS resource, details about the request, and the AWS WAF rules that the request matched. You can use this log information to monitor access patterns of public endpoints and configure rules to inspect requests in detail. For more information about AWS WAF logging, see Logging web ACL traffic.
Serverless logs
Serverless computing has become increasingly popular in the cloud-computing space. It provides on-demand compute power in a relatively short burst, meaning that cloud-based instances don’t need to be provisioned and kept around, idle, when there are no tasks to be completed. Although more and more compute tasks are being moved to serverless solutions, the need to log has not changed, but how the logs are generated has. In a serverless environment, security investigations not only benefit from logs that demonstrate the interactions and changes made by the code deployed, but that also document changes to the deployed code itself and access permissions of the Lambda execution role that is granting privileged access.
AWS Lambda
The logging of Lambda functions involves two components: how the function itself is operating, and what is happening inside the function (what your code is actually doing).
The logging of a Lambda function itself occurs through data events captured by CloudTrail. As noted earlier in this post, you must configure data events on a trail created in CloudTrail. During configuration, you will need to specify the function from which logs will be captured by your trail, and the destination S3 bucket where they will be stored. These logs contain details on the invocation of the function and help identify the IAM principals that called the Invoke API for Lambda.
AWS Lambda automatically monitors Lambda functions on your behalf and sends logs to CloudWatch. Your Lambda function comes with a CloudWatch Logs log group and a log stream for each instance of your function. The Lambda runtime environment sends details about each invocation to the log stream, and relays logs and other output from your function’s code. For more details on how to monitor Lambda functions, see Accessing Amazon CloudWatch logs for AWS Lambda.
Log analysis
For incident response, you need to be able to analyze and query your logs to validate what occurred and to understand the scope.
To begin, you can aggregate logs from various sources in S3 buckets for long-term storage, and you can integrate that data with query tools for further investigation. Logs can be exported and either parsed through directly, or ingested by another tool to help with the analysis. The following are some options that you can use to query these logs:
Amazon Athena — You can directly query CloudTrail events stored in S3 with Athena using SQL commands, specifying the LOCATION of the log files. You would generally use this approach if you have advanced queries to run, and you don’t have a SIEM. To set up Athena to query logs, you can use this open-source solution from AWS.
Amazon OpenSearch Service — OpenSearch is a distributed search and log analytics suite. Because it’s open source, it can ingest logs from more than just AWS log sources. To set this up, you can use this open-source SIEM solution from AWS.
CloudTrail Event History — Either from the console, or programmatically, you can query CloudTrail management events from the last 90-day period. This is ideal for when you have simple queries to make within the last 90 days, and you don’t need stored logs or more complex queries.
AWS CloudTrail Lake — Either from the console, or programmatically, you can query stored events in your configured CloudTrail Lake from the time of its configuration, up until the maximum storage duration of 2,557 days (7 years) from the time that you make your query. This approach allows for SQL-based queries, and it is ideal for when you need to make more complex queries against events, but don’t require the additional features of a SIEM solution.
Parse through raw JSON using CLI — This is achieved programmatically and parsed through terminal commands. It’s more a legacy method of parsing through logs. You might choose to use this approach for analysis if another service or solution isn’t feasible (for example, if you can’t use the service due to your corporate security policy).
Third-party SIEM — A third-party SIEM might be ideal if you already have a SIEM solution on AWS or elsewhere, and you don’t need a duplicated solution elsewhere. Typically, SIEM solutions will import logs from an S3 bucket and process and index events for analysis. To learn more about SIEM options, see the SIEM solutions in the AWS Marketplace, or the AWS Security Competency Partners for a partner local to you with threat detection and incident response (TDIR) expertise.
Sample queries
In this section, we provide samples of SQL queries. Both Athena and CloudTrail Lake accept SQL queries, but the following samples have been tested for use in Athena only. This is because some samples are for VPC Flow Logs, which you can’t query from CloudTrail Lake. To query CloudTrail logs in Athena, you must first create a table definition that points to the location of your logs stored in S3. You can do this from the CloudTrail Events console by using a hyperlinked suggestion, or from the Athena console directly. Alternatively, for Athena, you can use the AWS Security Analytics Bootstrap.
For each of these queries, you might need to modify some of the fields, such as the time frame that you are investigating, the IAM entity involved, and the account and Region in scope. For example, you might want to modify the time frame based on the current time and when you believe the security event began. This often involves expanding the time frame after running additional queries and learning more about the scope and timeline.
By using partitions for tables, you can restrict the amount of data scanned by each Athena query, helping to improve performance and reduce cost. For example, you can partition your CloudTrail Athena table manually or by using partition projection. You can include the partition column (for example, the timestamp) in your queries to limit the amount of data scanned.
Unauthorized attempts
When a security event occurs, you might want to review API calls that were attempted but failed due to the IAM principal not having access to perform the action on that resource. To discover this activity, run the following query (be sure to modify the time window first):
SELECT *
FROM cloudtrail
WHERE errorcode IN ('Client.UnauthorizedOperation','Client.InvalidPermission.NotFound','Client.OperationNotPermitted','AccessDenied')
AND useridentity.arn LIKE '%iam%'
AND eventtime >= '2023-01-01T00:00:00Z'
AND eventtime < '2023-03-01T00:00:00Z'
ORDER BY eventtime desc
This sample query can help you identify whether certain IAM principals have a significant amount of unauthorized API calls, which can indicate that an IAM principal is compromised.
Rejected TCP connections
During a security event, the unauthorized user that is interacting with the resources in your account is probably trying to establish persistence through the network layer. To get a list of rejected TCP connections and extract from it the day that these events occurred, run the following query:
SELECT day_of_week(date) AS
day,date,interface_id,srcaddr,action,protocol
FROM vpc_flow_logs
WHERE action = 'REJECT' AND protocol = 6
LIMIT 100;
Connections over older TLS versions
You might want to see how many calls to AWS APIs were made using older versions of the TLS protocol, as part of a forensic follow-up or a discovery job after a risk analysis. You can get this data by querying CloudTrail logs.
SELECT eventSource
COUNT(*) AS numOutdatedTlsCalls FROM cloudtrail WHERE tlsDetails.tlsVersion IN ('TLSv1', 'TLSv1.1') AND eventTime > '2023-01-01 00:00:00' GROUP BY eventSource ORDER BY numOutdatedTlsCalls DESC
Filter connections from an IP
With an IP address that you’d like to investigate, as a part of your forensic analysis, you might want to see the connections made to resources in a VPC. You can obtain this information by querying VPC Flow Logs. As with the server access logs, if you’re using Athena, you will first need to create a new table.
SELECT day_of_week(date) AS
day, date, srcaddr, dstaddr, action, protocol
FROM vpc_flow_logs
WHERE day >= '2023/01/01' AND day < '2023/03/01' AND srcaddr LIKE '172.50.%'
ORDER BY day DESC
LIMIT 100
Investigate user actions
If you have identified a user who has been compromised, or that you suspect has been compromised, you might want to know the API calls that they made over a specific time period. Understanding the activity of a user can help you understand the scope of impact during an incident, as well as the reach of user permissions when you design your access management strategy.
SELECT eventID, eventName, eventSource, eventTime, userIdentity.arn
AS user
FROM cloudtrail
WHERE userIdentity.arn = '%<username>%' AND eventTime > '2022-12-05 00:00:00' AND eventTime < '2022-12-08 00:00:00'
Conclusion
It is essential that you capture logs from various layers within your application architecture, so that you can effectively respond to a security event at various layers of the application stack. If a security event occurs, logs can help provide a clear picture of what happened and the scope of the affected resources. This post helps you build a logging strategy for security incident response by understanding what logs you want to analyze, where you want to store those logs, and how you will analyze them.
This post is part of a series about how Amazon Web Services (AWS) can help your US federal agency meet the requirements of the President’s Executive Order on Improving the Nation’s Cybersecurity. You will learn how you can use AWS information security practices to help meet the requirement to improve logging and log retention practices in your AWS environment.
Improving the security and operational readiness of applications relies on improving the observability of the applications and the infrastructure on which they operate. For our customers, this translates to questions of how to gather the right telemetry data, how to securely store it over its lifecycle, and how to analyze the data in order to make it actionable. These questions take on more importance as our federal customers seek to improve their collection and management of log data in all their IT environments, including their AWS environments, as mandated by the executive order.
Given the interest in the technologies used to support logging and log retention, we’d like to share our perspective. This starts with an overview of logging concepts in AWS, including log storage and management, and then proceeds to how to gain actionable insights from that logging data. This post will address how to improve logging and log retention practices consistent with the Security and Operational Excellence pillars of the AWS Well-Architected Framework.
Log actions and activity within your AWS account
AWS provides you with extensive logging capabilities to provide visibility into actions and activity within your AWS account. A security best practice is to establish a wide range of detection mechanisms across all of your AWS accounts. Starting with services such as AWS CloudTrail, AWS Config, Amazon CloudWatch, Amazon GuardDuty, and AWS Security Hub provides a foundation upon which you can base detective controls, remediation actions, and forensics data to support incident response. Here is more detail on how these services can help you gain more security insights into your AWS workloads:
AWS CloudTrail provides event history for all of your AWS account activity, including API-level actions taken through the AWS Management Console, AWS SDKs, command line tools, and other AWS services. You can use CloudTrail to identify who or what took which action, what resources were acted upon, when the event occurred, and other details. If your agency uses AWS Organizations, you can automate this process for all of the accounts in the organization.
CloudTrail log file integrity validation produces and cyptographically signs a digest file that contains references and hashes for every CloudTrail file that was delivered in that hour. This makes it computationally infeasible to modify, delete or forge CloudTrail log files without detection. Validated log files are invaluable in security and forensic investigations. For example, a validated log file enables you to assert positively that the log file itself has not changed, or that particular user credentials performed specific API activity.
AWS Config monitors and records your AWS resource configurations and allows you to automate the evaluation of recorded configurations against desired configurations. For example, you can use AWS Config to verify that resources are encrypted, multi-factor authentication (MFA) is enabled, and logging is turned on, and you can use AWS Config rules to identify noncompliant resources. Additionally, you can review changes in configurations and relationships between AWS resources and dive into detailed resource configuration histories, helping you to determine when compliance status changed and the reason for the change.
Amazon GuardDuty is a threat detection service that continuously monitors for malicious activity and unauthorized behavior to protect your AWS accounts and workloads. Amazon GuardDuty analyzes and processes the following data sources: VPC Flow Logs, AWS CloudTrail management event logs, CloudTrail Amazon Simple Storage Service (Amazon S3) data event logs, and DNS logs. It uses threat intelligence feeds, such as lists of malicious IP addresses and domains, and machine learning to identify potential threats within your AWS environment.
AWS Security Hub provides a single place that aggregates, organizes, and prioritizes your security alerts, or findings, from multiple AWS services and optional third-party products to give you a comprehensive view of security alerts and compliance status.
You should be aware that most AWS services do not charge you for enabling logging (for example, AWS WAF) but the storage of logs will incur ongoing costs. Always consult the AWS service’s pricing page to understand cost impacts. Related services such as Amazon Kinesis Data Firehose (used to stream data to storage services), and Amazon Simple Storage Service (Amazon S3), used to store log data, will incur charges.
Turn on service-specific logging as desired
After you have the foundational logging services enabled and configured, next turn your attention to service-specific logging. Many AWS services produce service-specific logs that include additional information. These services can be configured to record and send out information that is necessary to understand their internal state, including application, workload, user activity, dependency, and transaction telemetry. Here’s a sampling of key services with service-specific logging features:
Amazon CloudWatch provides you with data and actionable insights to monitor your applications, respond to system-wide performance changes, optimize resource utilization, and get a unified view of operational health. CloudWatch collects monitoring and operational data in the form of logs, metrics, and events, providing you with a unified view of AWS resources, applications, and services that run on AWS and on-premises servers. You can gain additional operational insights from your AWS compute instances (Amazon Elastic Compute Cloud, or EC2) as well as on-premises servers using the CloudWatch agent. Additionally, you can use CloudWatch to detect anomalous behavior in your environments, set alarms, visualize logs and metrics side by side, take automated actions, troubleshoot issues, and discover insights to keep your applications running smoothly.
Amazon CloudWatch Logs is a component of Amazon CloudWatch which you can use to monitor, store, and access your log files from Amazon Elastic Compute Cloud (Amazon EC2) instances, AWS CloudTrail, Route 53, and other sources. CloudWatch Logs enables you to centralize the logs from all of your systems, applications, and AWS services that you use, in a single, highly scalable service. You can then easily view them, search them for specific error codes or patterns, filter them based on specific fields, or archive them securely for future analysis. CloudWatch Logs enables you to see all of your logs, regardless of their source, as a single and consistent flow of events ordered by time, and you can query them and sort them based on other dimensions, group them by specific fields, create custom computations with a powerful query language, and visualize log data in dashboards.
Traffic Mirroring allows you to achieve full packet capture (as well as filtered subsets) of network traffic from an elastic network interface of EC2 instances inside your VPC. You can then send the captured traffic to out-of-band security and monitoring appliances for content inspection, threat monitoring, and troubleshooting.
The Elastic Load Balancing service provides access logs that capture detailed information about requests that are sent to your load balancer. Each log contains information such as the time the request was received, the client’s IP address, latencies, request paths, and server responses. The specific information logged varies by load balancer type:
Amazon S3 access logs record the S3 bucket and account that are being accessed, the API action, and requester information.
AWS Web Application Firewall (WAF) logs record web requests that are processed by AWS WAF, and indicate whether the requests matched AWS WAF rules and what actions, if any, were taken. These logs are delivered to Amazon S3 by using Amazon Kinesis Data Firehose.
Amazon Route 53 provides options for logging for both public DNS query requests as well as Route53 Resolver DNS queries:
Route 53 Resolver DNS query logs record DNS queries and responses that originate from your VPC, that use an inbound Resolver endpoint, that use an outbound Resolver endpoint, or that use a Route 53 Resolver DNS Firewall.
Route 53 DNS public query logs record queries to Route 53 for domains you have hosted with AWS, including the domain or subdomain that was requested; the date and time of the request; the DNS record type; the Route 53 edge location that responded to the DNS query; and the DNS response code.
Elastic Beanstalk logs can be streamed to CloudWatch Logs. You can also use the AWS Management Console to request the last 100 log entries from the web and application servers, or request a bundle of all log files that is uploaded to Amazon S3 as a ZIP file.
Now that you’ve enabled foundational and service-specific logging in your AWS accounts, that data needs to be persisted and managed throughout its lifecycle. AWS offers a variety of solutions and services to consolidate your log data and store it, secure access to it, and perform analytics.
Store log data
The primary service for storing all of this logging data is Amazon S3. Amazon S3 is ideal for this role, because it’s a highly scalable, highly resilient object storage service. AWS provides a rich set of multi-layered capabilities to secure log data that is stored in Amazon S3, including encrypting objects (log records), preventing deletion (the S3 Object Lock feature), and using lifecycle policies to transition data to lower-cost storage over time (for example, to S3 Glacier). Access to data in Amazon S3 can also be restricted through AWS Identity and Access Management (IAM) policies, AWS Organizations service control policies (SCPs), S3 bucket policies, Amazon S3 Access Points, and AWS PrivateLink interfaces. While S3 is particularly easy to use with other AWS services given its various integrations, many customers also centralize their storage and analysis of their on-premises log data, or log data from other cloud environments, on AWS using S3 and the analytic features described below.
If your AWS accounts are organized in a multi-account architecture, you can make use of the AWS Centralized Logging solution. This solution enables organizations to collect, analyze, and display CloudWatch Logs data in a single dashboard. AWS services generate log data, such as audit logs for access, configuration changes, and billing events. In addition, web servers, applications, and operating systems all generate log files in various formats. This solution uses the Amazon Elasticsearch Service (Amazon ES) and Kibana to deploy a centralized logging solution that provides a unified view of all the log events. In combination with other AWS-managed services, this solution provides you with a turnkey environment to begin logging and analyzing your AWS environment and applications.
You can also make use of services such as Amazon Kinesis Data Firehose, which you can use to transport log information to S3, Amazon ES, or any third-party service that is provided with an HTTP endpoint, such as Datadog, New Relic, or Splunk.
Finally, you can use Amazon EventBridge to route and integrate event data between AWS services and to third-party solutions such as software as a service (SaaS) providers or help desk ticketing systems. EventBridge is a serverless event bus service that allows you to connect your applications with data from a variety of sources. EventBridge delivers a stream of real-time data from your own applications, SaaS applications, and AWS services, and then routes that data to targets such as AWS Lambda.
Amazon Detective makes it easy to analyze, investigate, and quickly identify the root cause of security findings or suspicious activities. Detective automatically collects log data from your AWS resources. It then uses machine learning, statistical analysis, and graph theory to help you visualize and conduct faster and more efficient security investigations.
Incident Manager is a component of AWS Systems Manger which enables you to automatically take action when a critical issue is detected by an Amazon CloudWatch alarm or Amazon Eventbridge event. Incident Manager executes pre-configured response plans to engage responders via SMS and phone calls, enable chat commands and notifications using AWS Chatbot, and execute AWS Systems Manager Automation runbooks. The Incident Manager console integrates with AWS Systems Manager OpsCenter to help you track incidents and post-incident action items from a central place that also synchronizes with popular third-party incident management tools such as Jira Service Desk and ServiceNow.
Amazon Elasticsearch Service (Amazon ES) is a fully managed service that collects, indexes, and unifies logs and metrics across your environment to give you unprecedented visibility into your applications and infrastructure. With Amazon ES, you get the scalability, flexibility, and security you need for the most demanding log analytics workloads. You can configure a CloudWatch Logs log group to stream data it receives to your Amazon ES cluster in near real time through a CloudWatch Logs subscription.
CloudWatch Logs Insights enables you to interactively search and analyze your log data in CloudWatch Logs.
Amazon Athena is an interactive query service that you can use to analyze data in Amazon S3 by using standard SQL. Athena is serverless, so there is no infrastructure to manage, and you pay only for the queries that you run.
Conclusion
As called out in the executive order, information from network and systems logs is invaluable for both investigation and remediation services. AWS provides a broad set of services to collect an unprecedented amount of data at very low cost, optionally store it for long periods of time in tiered storage, and analyze that telemetry information from your cloud-based workloads. These insights will help you improve your organization’s security posture and operational readiness and, as a result, improve your organization’s ability to deliver on its mission.
Next steps
To learn more about how AWS can help you meet the requirements of the executive order, see the other post in this series:
If you have feedback about this post, submit comments in the Comments section below.
Want more AWS Security how-to content, news, and feature announcements? Follow us on Twitter.
The collective thoughts of the interwebz
Manage Consent
To provide the best experiences, we use technologies like cookies to store and/or access device information. Consenting to these technologies will allow us to process data such as browsing behavior or unique IDs on this site. Not consenting or withdrawing consent, may adversely affect certain features and functions.
Functional
Always active
The technical storage or access is strictly necessary for the legitimate purpose of enabling the use of a specific service explicitly requested by the subscriber or user, or for the sole purpose of carrying out the transmission of a communication over an electronic communications network.
Preferences
The technical storage or access is necessary for the legitimate purpose of storing preferences that are not requested by the subscriber or user.
Statistics
The technical storage or access that is used exclusively for statistical purposes.The technical storage or access that is used exclusively for anonymous statistical purposes. Without a subpoena, voluntary compliance on the part of your Internet Service Provider, or additional records from a third party, information stored or retrieved for this purpose alone cannot usually be used to identify you.
Marketing
The technical storage or access is required to create user profiles to send advertising, or to track the user on a website or across several websites for similar marketing purposes.