Tag Archives: odbc

Agentless Oracle database monitoring with ODBC

Post Syndicated from Aigars Kadiķis original https://blog.zabbix.com/agentless-oracle-database-monitoring-with-odbc/15589/

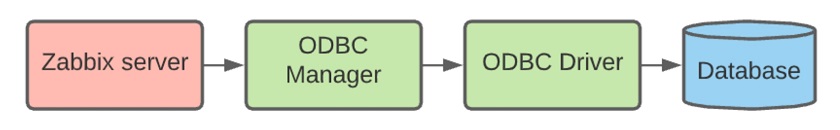
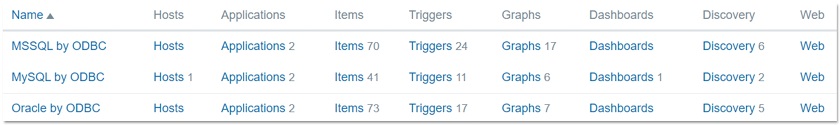
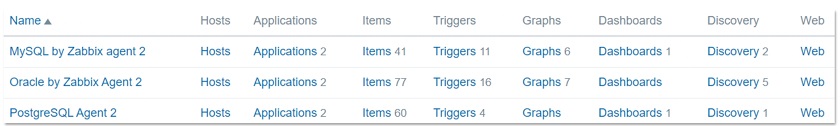
Did you know that Zabbix has an out-of-the-box template for collecting Oracle database metrics? With this template, we can collect data like database, tablespace, ASM, and many other metrics agentlessly, by using ODBC. This blog post will guide you on how to set up ODBC monitoring for Oracle 11.2, 12.1, 18.5, or 19.2 database servers. This post can serve as the perfect set of guidelines for deploying Oracle database monitoring in your environment.

Download Instant client and SQLPlus

The provided commands apply for the following operating systems: CentOS 8, Oracle Linux 8, or Rocky Linux.

First we have to download the following packages:
oracle-instantclient19.12-basic-19.12.0.0.0-1.x86_64.rpm
oracle-instantclient19.12-sqlplus-19.12.0.0.0-1.x86_64.rpm
oracle-instantclient19.12-odbc-19.12.0.0.0-1.x86_64.rpm

Here we are downloading

Oracle instant client – required, to establish connectivity to an Oracle database
SQLPlus  – A tool that we can use to test the connectivity to an Oracle database
Oracle ODBC package – contains the required ODBC drivers and configuration scripts to enable ODBC connectivity to an Oracle database

Upload the packages to the Zabbix server (or proxy, if you wish to monitor your Oracle DB on a proxy) and place it in:

/tmp/oracle-instantclient19.12-basic-19.12.0.0.0-1.x86_64.rpm
/tmp/oracle-instantclient19.12-sqlplus-19.12.0.0.0-1.x86_64.rpm
/tmp/oracle-instantclient19.12-odbc-19.12.0.0.0-1.x86_64.rpm

Solve OS dependencies

Install ‘libaio’ and ‘libnsl’ library:

dnf -y install libaio-devel libnsl

Otherwise, we will receive errors:

# rpm -ivh /tmp/oracle-instantclient19.12-basic-19.12.0.0.0-1.x86_64.rpm
error: Failed dependencies:
        libaio is needed by oracle-instantclient19.12-basic-19.12.0.0.0-1.x86_64
        libnsl.so.1()(64bit) is needed by oracle-instantclient19.12-basic-19.12.0.0.0-1.x86_64
# rpm -ivh /tmp/oracle-instantclient19.12-basic-19.12.0.0.0-1.x86_64.rpm
error: Failed dependencies:
        libnsl.so.1()(64bit) is needed by oracle-instantclient19.12-basic-19.12.0.0.0-1.x86_64

Check if Oracle components have been previously deployed on the system. The commands below should provide an empty output:

rpm -qa | grep oracle
ldconfig -p | grep oracle

Install Oracle Instant Client

rpm -ivh /tmp/oracle-instantclient19.12-basic-19.12.0.0.0-1.x86_64.rpm

Make sure that the package ‘oracle-instantclient19.12-basic-19.12.0.0.0-1.x86_64’ is installed:

rpm -qa | grep oracle

LD config

The official Oracle template page at git.zabbix.com talks about the method to configure Oracle ENV Usage for the service. For this version 19.12 of instant client, it is NOT REQUIRED to create a ‘/etc/sysconfig/zabbix-server’ file with content:

export ORACLE_HOME=/usr/lib/oracle/19.12/client64
export PATH=$PATH:$ORACLE_HOME/bin
export LD_LIBRARY_PATH=$ORACLE_HOME/lib:/usr/lib64:/usr/lib:$ORACLE_HOME/bin
export TNS_ADMIN=$ORACLE_HOME/network/admin

While we did install the rpm package, the Oracle 19.12 client package did auto-configure LD path at the global level – it means every user on the system can use the Oracle instant client. We can see the LD path have been configured under:

cat /etc/ld.so.conf.d/oracle-instantclient.conf

This will print:

/usr/lib/oracle/19.12/client64/lib

To ensure that the required Oracle libraries are recognized by the OS, we can run:

ldconfig -p | grep oracle

It should print:

liboramysql19.so (libc6,x86-64) => /usr/lib/oracle/19.12/client64/lib/liboramysql19.so
libocijdbc19.so (libc6,x86-64) => /usr/lib/oracle/19.12/client64/lib/libocijdbc19.so
libociei.so (libc6,x86-64) => /usr/lib/oracle/19.12/client64/lib/libociei.so
libocci.so.19.1 (libc6,x86-64) => /usr/lib/oracle/19.12/client64/lib/libocci.so.19.1
libnnz19.so (libc6,x86-64) => /usr/lib/oracle/19.12/client64/lib/libnnz19.so
libmql1.so (libc6,x86-64) => /usr/lib/oracle/19.12/client64/lib/libmql1.so
libipc1.so (libc6,x86-64) => /usr/lib/oracle/19.12/client64/lib/libipc1.so
libclntshcore.so.19.1 (libc6,x86-64) => /usr/lib/oracle/19.12/client64/lib/libclntshcore.so.19.1
libclntshcore.so (libc6,x86-64) => /usr/lib/oracle/19.12/client64/lib/libclntshcore.so
libclntsh.so.19.1 (libc6,x86-64) => /usr/lib/oracle/19.12/client64/lib/libclntsh.so.19.1
libclntsh.so (libc6,x86-64) => /usr/lib/oracle/19.12/client64/lib/libclntsh.so

Note: If for some reason the ldconfig command shows links to other dynamic libraries – that’s when we might have to create a separate ENV file for Zabbix server/Proxy, which would link the Zabbix application to the correct dynamic libraries, as per the example at the start of this section.

Check if the Oracle service port is reachable

To save us some headache down the line, let’s first check the network connectivity to our Oracle database host. Let’s check if we can reach the default Oracle port at the network level. In this example, we will try to connect to the default Oracle database port, 1521. Depending on which port your Oracle database is listening for connections, adjust accordingly,. Make sure the output says ‘Connected to 10.1.10.15:1521’:

nc -zv 10.1.10.15 1521

Test connection with SQLPlus

We can simulate the connection to the Oracle database before moving on with the ODBC configuration. Make sure that the Oracle username and password used in the command are correct. For this task, we will first need to install the SQLPlus package.:

rpm -ivh /tmp/oracle-instantclient19.12-sqlplus-19.12.0.0.0-1.x86_64.rpm

To simulate the connection, we can use a one-liner command. In the example command I’m using the username ‘system’ together with the password ‘oracle’ to reach out to the Oracle database server ‘10.1.10.15’ via port ‘1521’ and connect to the service name ‘xe’:

sqlplus64 'system/oracle@(DESCRIPTION=(ADDRESS_LIST=(ADDRESS=(PROTOCOL=TCP)(HOST=10.1.10.15)(PORT=1521)))(CONNECT_DATA=(SERVER=DEDICATED)(SERVICE_NAME=xe)))'

In the output we can see: we are using the 19.12 client to connect to 11.2 server:

SQL*Plus: Release 19.0.0.0.0 - Production on Mon Sep 6 13:47:36 2021
Version 19.12.0.0.0
Copyright (c) 1982, 2021, Oracle.  All rights reserved.
Connected to:
Oracle Database 11g Express Edition Release 11.2.0.2.0 - 64bit Production

Note: This gives us an extra hint regarding the Oracle instant client – newer versions of the client are backwards compatible with the older versions of the Oracle database server. Though this doesn’t apply to every version of Oracle client/server, please check the Oracle instant client documentation first.

ODBC connector

When it comes to configuring ODBC, let’s first install the ODBC driver manager

dnf -y install unixODBC

Now we can see that we have two new files –  ‘/etc/odbc.ini’ (possibly empty) and ‘/etc/odbcinst.ini’.

The file ‘/etc/odbcinst.ini’ describes driver relation. Currently, when we ‘grep’ the keyword ‘oracle’ there is no oracle relation installed, the output is empty when we run:

grep -i oracle /etc/odbcinst.ini

Our next step is to Install Oracle ODBC driver package:

rpm -ivh /tmp/oracle-instantclient19.12-odbc-19.12.0.0.0-1.x86_64.rpm

The ‘oracle-instantclient*-odbc’ package contains a script that will update the ‘/etc/odbcinst.ini’ configuration automatically:

cd /usr/lib/oracle/19.12/client64/bin
./odbc_update_ini.sh / /usr/lib/oracle/19.12/client64/lib

It will print:

 *** ODBCINI environment variable not set,defaulting it to HOME directory!

Now when we print the file on the screen:

cat /etc/odbcinst.ini

We will see that there is the Oracle 19 ODBC driver section added at the end of the file::

[Oracle 19 ODBC driver]
Description     = Oracle ODBC driver for Oracle 19
Driver          = /usr/lib/oracle/19.12/client64/lib/libsqora.so.19.1
Setup           =
FileUsage       =
CPTimeout       =
CPReuse         =

It’s important to check if there are no errors produced in the output when executing the ‘ldd’ command. This ensures that the dependencies are satisfied and accessible and there are no conflicts with the library versioning:

ldd /usr/lib/oracle/19.12/client64/lib/libsqora.so.19.1

It will print something similar like:

linux-vdso.so.1 (0x00007fff121b5000)
libdl.so.2 => /lib64/libdl.so.2 (0x00007fb18601c000)
libm.so.6 => /lib64/libm.so.6 (0x00007fb185c9a000)
libpthread.so.0 => /lib64/libpthread.so.0 (0x00007fb185a7a000)
libnsl.so.1 => /lib64/libnsl.so.1 (0x00007fb185861000)
librt.so.1 => /lib64/librt.so.1 (0x00007fb185659000)
libaio.so.1 => /lib64/libaio.so.1 (0x00007fb185456000)
libresolv.so.2 => /lib64/libresolv.so.2 (0x00007fb18523f000)
libclntsh.so.19.1 => /usr/lib/oracle/19.12/client64/lib/libclntsh.so.19.1 (0x00007fb1810e6000)
libclntshcore.so.19.1 => /usr/lib/oracle/19.12/client64/lib/libclntshcore.so.19.1 (0x00007fb180b42000)
libodbcinst.so.2 => /lib64/libodbcinst.so.2 (0x00007fb18092c000)
libc.so.6 => /lib64/libc.so.6 (0x00007fb180567000)
/lib64/ld-linux-x86-64.so.2 (0x00007fb1864da000)
libnnz19.so => /usr/lib/oracle/19.12/client64/lib/libnnz19.so (0x00007fb17fdba000)
libltdl.so.7 => /lib64/libltdl.so.7 (0x00007fb17fbb0000)

When we executed the ‘odbc_update_ini.sh’ script, a new DSN (data source name) file was made in ‘/root/.odbc.ini’. This is a sample configuration ODBC configuration file which describes what settings this version of ODBC driver supports.

Let’s move this configuration file from the user directories to a location accessible system-wide:

cat /root/.odbc.ini | sudo tee -a /etc/odbc.ini

And remove the file from the user directory completely:

rm /root/.odbc.ini

This way, every user in the system will use only this one ODBC configuration file.

We can now alter the existing configuration – /etc/odbc.ini. I’m highlighting things that have been changed from the defaults:

[Oracle11g]
AggregateSQLType = FLOAT
Application Attributes = T
Attributes = W
BatchAutocommitMode = IfAllSuccessful
BindAsFLOAT = F
CacheBufferSize = 20
CloseCursor = F
DisableDPM = F
DisableMTS = T
DisableRULEHint = T
Driver = Oracle 19 ODBC driver
DSN = Oracle11g
EXECSchemaOpt =
EXECSyntax = T
Failover = T
FailoverDelay = 10
FailoverRetryCount = 10
FetchBufferSize = 64000
ForceWCHAR = F
LobPrefetchSize = 8192
Lobs = T
Longs = T
MaxLargeData = 0
MaxTokenSize = 8192
MetadataIdDefault = F
QueryTimeout = T
ResultSets = T
ServerName = //10.1.10.15:1521/xe
SQLGetData extensions = F
SQLTranslateErrors = F
StatementCache = F
Translation DLL =
Translation Option = 0
UseOCIDescribeAny = F
UserID = system
Password = oracle

DNS – Data source name. Should match the section name in brackets, e.g.:[Oracle11g]
ServerName – Oracle server address
UserID – Oracle user name
Password – Oracle user password

To test the connection from the command line, let’s use the isql command-line tool which should simulate the ODBC connection akin to what the Zabbix is doing when gathering metrics:

isql -v Oracle11g

The isql command in this example picks up the ODBC settings (Username, Password, Server address) from the odbc.ini file. All we have to do is reference the particular DSN – Oracle11g

On the other hand, if we do not prefer to keep the password on the filesystem (/etc/odbc.ini), we can erase the lines ‘UserID’ and ‘Password’. Then we can test the ODBC connection with:

isql -v Oracle11g 'system' 'oracle'

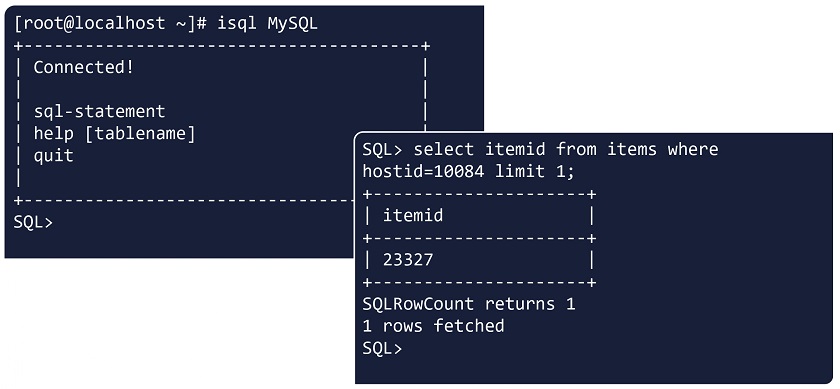
In case of a successful connection it should print:

+---------------------------------------+
| Connected!                            |
|                                       |
| sql-statement                         |
| help [tablename]                      |
| quit                                  |
|                                       |
+---------------------------------------+
SQL>

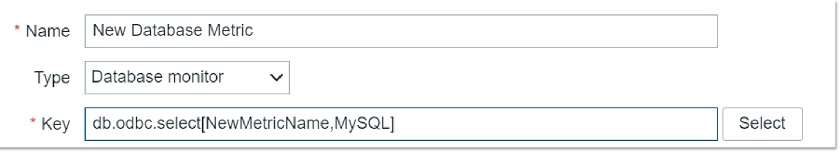
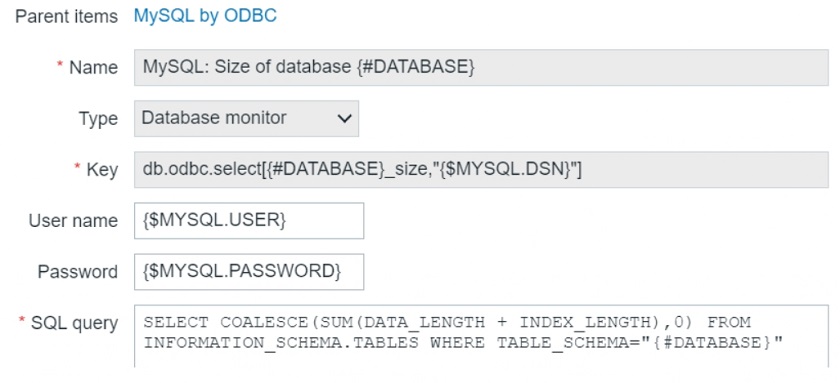
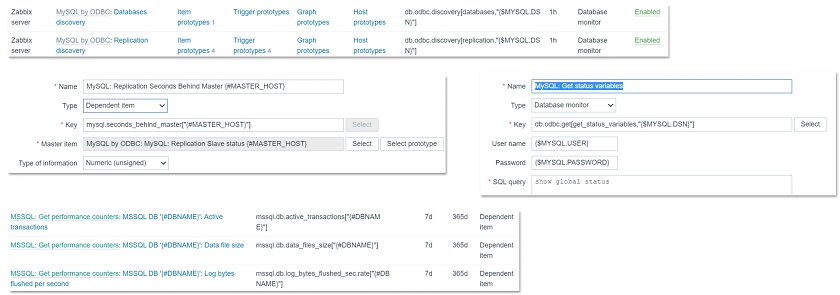
And that’s it for the ODBC configuration! Now we should be able to apply the Oracle by ODBC template in Zabbix

Don’t forget that we also need to provide the necessary Oracle credentials to start collecting Oracle database metrics:

The lessons learned in this blog post can be easily applied to ODBC monitoring and troubleshooting in general, not just Oracle. If you’re having any issues or wish to share your experience with ODBC or Oracle database monitoring – feel free to leave us a comment!

Out-of-the-box database monitoring

Post Syndicated from Renats Valiahmetovs original https://blog.zabbix.com/out-of-the-box-database-monitoring/13957/

From this post and the video, you’ll learn about the possibilities of database monitoring using out-of-the-box Zabbix functionality without having to install additional tools, additional applications, or additional software that might not be allowed by your company.

Contents

I. Classic ODBC monitoring (0:22)

II. Synthetic MySQL monitoring (11:13)
III. DB monitoring with Zabbix Agent 2 (13:48)

IV. LLD for DB monitoring (17:03)

V. Questions & Answers (21:09)

Classic ODBC monitoring

What is ODBC?

ODBC stands for open database connectivity. There are a couple of ODBC drivers available for different database management systems (DBMS):

    • Oracle,
    • PostgreSQL,
    • MySQL,
    • Microsoft SQL Server,
    • Sybase ASE,
    • SAP HANA,
    • DB2.

All of these databases have different ODBCs specifically tailored for them. They offer slightly different functionality. So, even if you have set up the database monitoring for one database it might not necessarily work just as good for the other, as the functionality used to monitor one database might not exist for the other. In addition, as different technologies have different capabilities, most ODBC drivers do not implement all functionality defined in the ODBC standard.

What to monitor?

When we are planning to use ODBC for monitoring, what kind of data we can expect to receive? The answer ultimately depends on your own preferences, needs, or your proficiency in a specific database. You can monitor any possible database performance metrics and incidents using Zabbix templates.

Generally, monitoring of the following areas is of interest:

    • database performance
    • engine availability
    • configuration changes that you need to be aware of

To make the process easier, we provide ready-to-use templates, which can be applied to a host where your database is deployed. You can browse a full list of available metrics in these templates’ descriptions. So, you don’t have to perform configuration completely from scratch, which is good news.

How does it work?

Without diving too deep into the transport layer and all of the technical details, the ODBC driver accesses the database over the network using the database API. So, there is no direct connection between Zabbix and the database. Zabbix only creates a query passed to the ODBC manager for processing, which then moves the request over to the ODBC driver that connects to the database management system and then executes the query. Here, Zabbix does not limit the query execution timeout, and the timeout parameter is used as the ODBC login timeout.

Chain of processes

ODBC configuration is based on two files:

  • odbc.ini — holds a list of installed ODBC database drivers, which are used for specific communication.
  • odbcinst.ini — holds the definitions of data sources so that we know to which database we are going to connect.

Where to start?

What do we need to do in order to start using this ODBC monitoring approach?

  1. First, we will need to install the ODBC driver relevant to the database we are going to monitor. A simple yum command will suffice if we’re working with CentOS.
# yum -y install unixODBC unixODBC-devel
  1. Then we need to specify the package (driver) we want to install and modify the ODBC driver files.
  • odbc.ini:
[root@localhost ~]# cat /etc/odbc.ini
[MySQL]
Description=NewDatabase
Driver=MariaDB
Server=localhost
User=root
Password=VerySecurePassword
Port=3306
Database=DatabaseName
  • odbcinst.ini:
[root@localhost ~]# cat /etc/odbcinst.ini
[MySQL]
Description=ODBC for MySQL
Driver=/usr/lib/libmyodbc5.so
Setup=/usr/lib/libodbcmyS.so
Driver64=/usr/lib64/libmyodbc8a.so
Setup64=/usr/lib64/libmyodbc8a.so
FileUsage=1

Then we need to populate them with the necessary information. So, in this case, DSN (data source name) is used to call a specific connection. We need to get this part correctly, otherwise, the connection will not work out, for instance, in case of a typo.

  1. After we have installed the ODBC driver and configured the configuration files, we don’t really need to go ahead into Zabbix to create a new item and see if it works. We can test the ODBC configuration using isql to connect or at least attempt to connect to a particular database using the specified configuration.

Using isql to test ODBC configuration

If we receive an output that you have been connected then the communication is correct. You can also execute a sort of query, for instance, select some information from the database. If you get the result, then you do have the necessary permissions to access that data, and the connection, that is the ODBC driver, is working fine. Then you can proceed to the frontend.

  1. In the frontend, we will need to create an item of the ‘Database monitor’ type on a particular host or a template and specify one of the two keys available for ODBC monitoring: db.odbc.select or db.odbc.get.

Creating ‘Database monitor’ item

The difference between these item keys is pretty simple — select will return only one value and get will return values in bulk. So, get is more efficient and allows for reducing the load on the database if we are working with a lot of data. Within the key parameters, we need to specify the same DSN that we have defined in our odbc.ini file.

We need to make sure that the first parameter is unique so that this particular item key is unique and does not duplicate anything else, and the second parameter is the DSN.

  1. After we have specified everything, we specify the query, which is a part of the item configuration.
  2. We test the item using the test form in the Zabbix frontend. If the test form returns a value or does not return an error message, then everything is fine and we can proceed with this item or create more items.

Testing the item

ODBC templates

  1. There are a couple of built-in templates. If the metrics obtained through these templates are sufficient, we obviously don’t need to create these items from scratch or configure them. We can simply assign the templates we need to the host, on which we are monitoring the database. All we need to do is to tweak a little, if necessary, modify the macro related to the DSN, and then start monitoring.

Assigning a template

NOTE. The easiest way to get the templates is to upgrade to the latest Zabbix with our official templates already built in. If you don’t have the needed templates for any reason, you can download them from Zabbix official repository or Zabbix integrations. If you still need a specific template, you can definitely check out the community-created templates.

  1. Finally, we can execute discovery rules:

and check the Latest data:

Synthetic MySQL monitoring

Synthetic MySQL monitoring approach is using capabilities of the Zabbix Agent. Though that is not something that Zabbix Agent is doing out of the box, still we don’t need to install anything or perform some super difficult manipulations to make it work as it is a part of Zabbix functionality.

As you might already know, the Zabbix Agent functionality can be extended using custom UserParameters and then used for database monitoring.

  1. So, we can create new UserParameters, which invoke native MySQL administration client commands providing output, which can then be used to calculate performance metrics.
UserParameter=mysql.ping[*], mysqladmin -h"$1" -P"$2" ping
UserParameter=mysql.get_status_variables[*], mysql -h"$1" -P"$2" -sNX -e "show
global status"
UserParameter=mysql.version[*], mysqladmin -s -h"$1" -P"$2" version
UserParameter=mysql.db.discovery[*], mysql -h"$1" -P"$2" -sN -e "show
databases"
  1. It is a good practice to test the commands themselves to make sure that they work and to test the UserParameter keys, for instance using the zabbix_get utility.
  2. Then you might want to use our official MySQL monitoring template by creating an additional file .my.cnf under /var/lib/zabbix (default location) as follows:
[client] 
user='zbx_monitor' 
password='<password>'
  1. Then we need to provide credentials for the user to confirm that the user has the necessary permissions to access the database.
  2. If everything is working, assign MySQL by Zabbix agent template.

In this case, we are not actually logging in to the database. We execute commands from the terminal by using Zabbix Agent and extending the functionality beyond the built-in functions.

DB monitoring with Zabbix Agent 2

Why Zabbix Agent 2?

What are the benefits of Zabbix Agent 2 in relation to database monitoring?

  • Zabbix Agent 2 is the improved version of our original Zabbix Agent, which is now written in Go.
  • Zabbix Agent 2 is more efficient and supports some new functions that Zabbix Agent 1 does not, for instance, custom intervals with active checks as Zabbix Agent 2 is using the Scheduler plugin and is capable of keeping track of time when certain checks need to be executed;
  • Older configuration is also supported. So, if we switch from Zabbix Agent 1 to Zabbix Agent 2, we do not need to rewrite the whole configuration file in order for Zabbix Agent 2 to work.
  • Zabbix Agent 2 is installed simply with one-line command just like Zabbix Agent 1, we need just to specify a different package.
# yum -y install zabbix-agent2
  • Zabbix Agent 2 is based on plugins, so you do not need to install it with ODBC drivers, as plugins do the work, or anything extra as Zabbix Agent 2 has out-of-the-box database-specific plugins to monitor your database, including MySQL, Oracle, and PostgreSQL.
  • Plugins are also written in Go.
  • We have created Zabbix Agent 2-specific templates, which we can assign to the host. So, if you decide to use Zabbix Agent 2, you need to perform even fewer manipulations in order to get your database monitored by Zabbix.

Built-in Zabbix Agent 2 templates

Configuration

The configuration is very simple. We need to decide whether we specify the necessary parameters within the item keys or, if we prefer named sessions, we edit the configuration file of Zabbix Agent 2 to define those and use the session name as the first parameter of the key.

  1. So, we specify the key according to the documentation page. In the first case, we can specify essentially the location of our database and provide the credentials.

In the second case, we simply need to provide the DSN in order to connect to the database using Zabbix Agent 2 built-in plugins.

Plugins.Mysql.Sessions.Prod.Uri=tcp://192.168.1.1:3306

Plugins.Mysql.Sessions.Prod.User=<UserForProd>

Plugins.Mysql.Sessions.Prod.Password=<PasswordForProd>
  1. After we have created these items or applied a template, we can definitely test them out and see whether they are working fine.

NOTE. Check available MySQL-related item keys documentation page.

LLD for DB monitoring

Why LLD?

Finally, you can definitely use low-level discovery for database monitoring. LLD is a very efficient and powerful tool within Zabbix. You can definitely use either built-in discovery keys, which utilize Zabbix Agent, or other sources such as custom scripts to pass the payload to your low-level discovery rule.

LLD:

    • Automatically creates items, triggers, and graphs from different entities on a host.
    • Parses data received in Zabbix-specific JSON format.
    • Different sources for LLD can be used, such as:
      • Built-in discovery keys,
      • Dependent on a built-in item key,
      • Dependent on a custom script/custom UserParameter.

Here we have a script providing our JSON-formatted payload, which is sent by the Data sender Zabbix utility to the Master trapper item within our Zabbix instance, while our LLD rule depends on this particular Master trapper item.

So, we just populate this trapper item with the JSON payload, LLD rule creates new entities based on the prototypes, and then the items created by those prototypes are collecting the data from that master trapper item each time a new payload comes in.

How to configure custom LLD?

In general, to create LLD from scratch:

  1. First, you will need to decide on the actual payload delivery method (Zabbix Agent, script, Zabbix sender, or UserParameter).
  2. Make sure that your payload is in JSON that is structurally sound so that Zabbix can accept and parse it.
[{"{#DATABASE}":"information_schema"},{"{#DATABASE}":"mysql"},{"{#DATABASE}":"p erformance_schema"},{"{#DATABASE}":"sys"},{"{#DATABASE}":"zabbix"}]
  1. Create LLD rule with type according to delivery method.
  2. Test the rule (if available for passive checks) to see JSON you receive.
  3. Create filters or overrides, if necessary.
  4. Create prototypes, based on which your entities will be created.

If we don’t want to create LLD rules from scratch, we can definitely modify the built-in templates without wasting time creating custom LLD rules:

    • Modify/create new entities;
    • Clone the templates;
    • Refer to templated discovery rule configuration.

Modifying LLD rules of official templates

Questions & Answers

Question. Can we monitor the database using active checks or passive checks?

Answer. As I have mentioned, everything depends on your preferences and, ultimately, on the way you want to pass this output to Zabbix Server. If we’re talking about active checks, you can utilize Zabbix sender, for instance. So, it will be a trapper item on the Zabbix Server side waiting for data. In case of passive checks, we can use Zabbix Agent. So, we can use both types of checks for database monitoring.

Question. Can we establish a secure connection between the ODBC gateway and the database, which is somewhere on a distant machine?

Answer. Yes, this can be done though it does require a little bit of finesse. It is an extensive topic, and the security of the connection is highly dependent on the driver, which should support a secure connection. Some older databases might not have this functionality.

Question. Are ODBC checks influencing the performance of the master server?

Answer. It depends on what kind of data you are collecting. If you have a lot of items utilizing db.odbc.get item key, which retrieves just one value from the database, this might impact your database performance. You might not notice this impact if your hardware is powerful enough. However, it is advisable to use the odbc.select key in order to collect this information in bulk. Otherwise, you might be locking up some entries within your database that could potentially lead to problems.

Question. So, we provide two solutions with one of them using ODBC agentless checks ODBC. In addition, we have the agent tool. Will you briefly describe the advantages of ODBC and Agent checks?

Answer. If we’re talking about the ODBC database monitoring method, the most obvious difference is that you don’t need to install an agent. From the data collection perspective, there is not much difference. Everything depends on your specific needs.