Tag Archives: LLD

JSON is your friend – Certificate monitoring on Microsoft CA server

Post Syndicated from Tibor Volanszki original https://blog.zabbix.com/json-is-your-friend-certificate-monitoring-on-microsoft-ca-server/20697/

Introduction

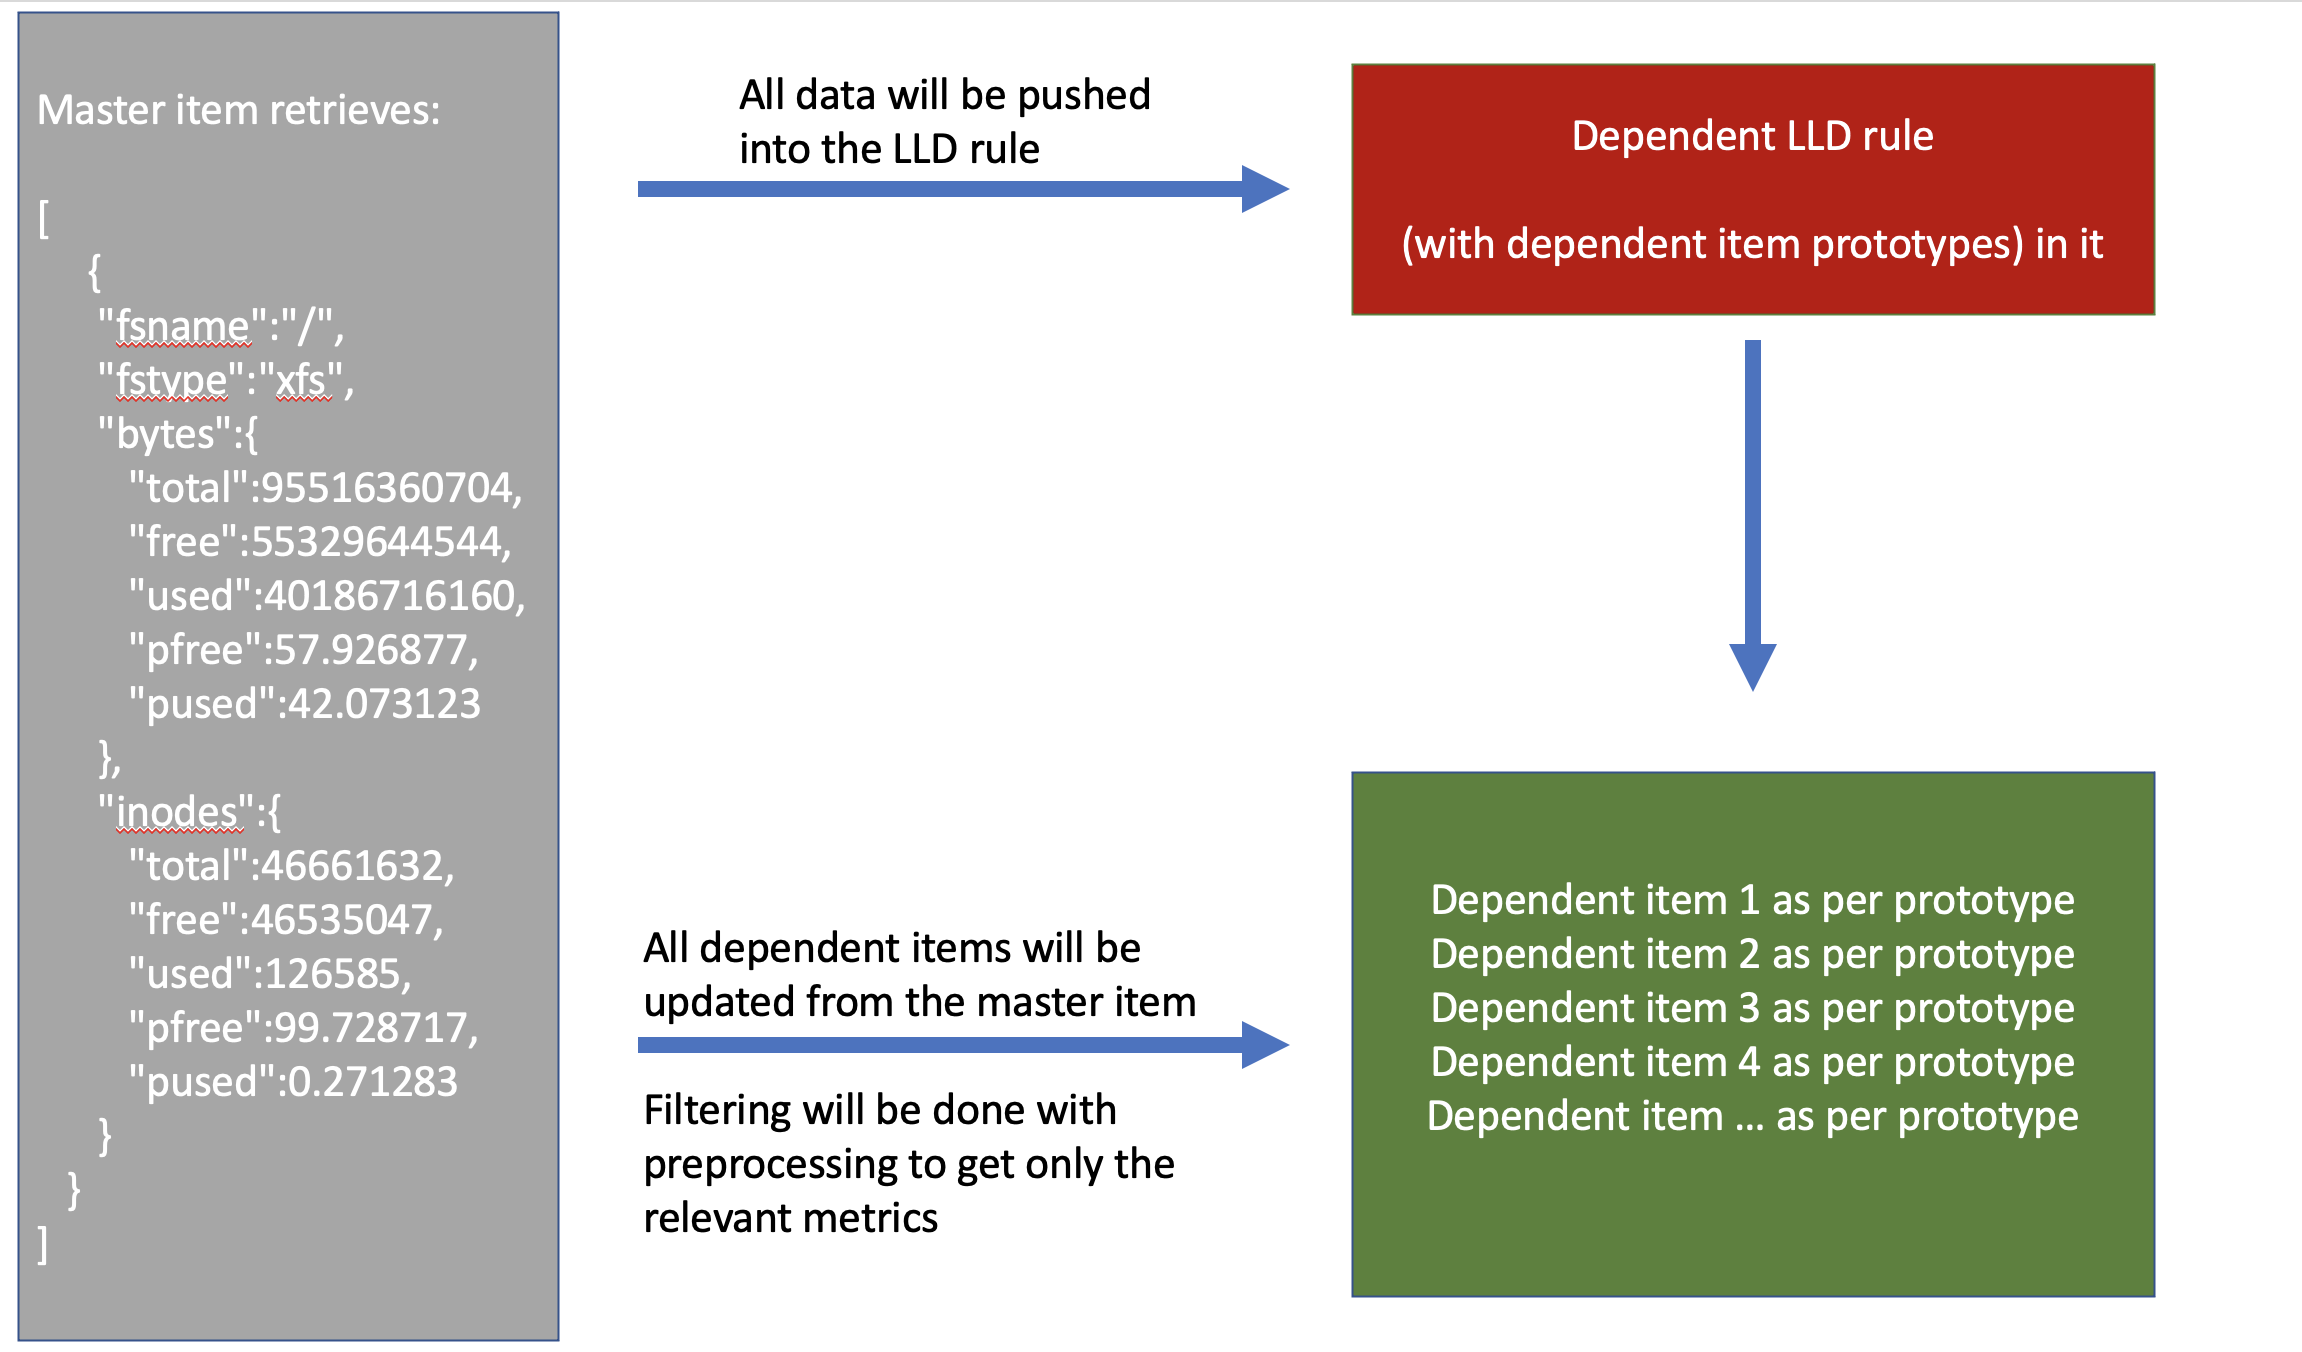
By transforming our data into JSON we can achieve great results with Zabbix without the need to have a complex external script logic. The article will provide an example of obtaining a set of master data with a single PowerShell script and then using the Zabbix native functionality to configure low-level discovery and collect the required metrics from the master JSON data set.

In this example, we will implement certificate monitoring by using a Microsoft Windows Certificate Authority server. The goal is to see how many days we have before our internally signed certificates will expire. As an extra, we will be able to filter the monitored items by requestors and template names.

  • Target system version: MS Windows Server 2019 (also tested on 2012)
  • Zabbix server & agent version: 6.0.3 (Other Zabbix versions should be supported too with no or minimal changes)
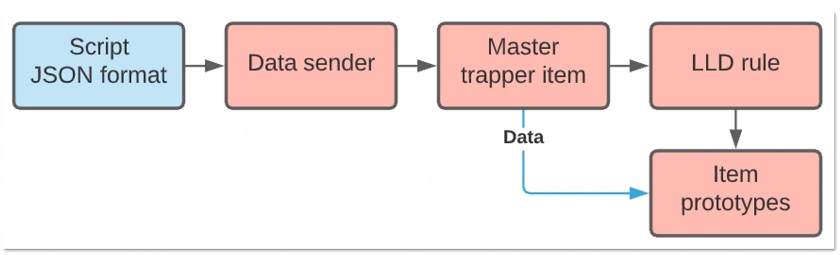
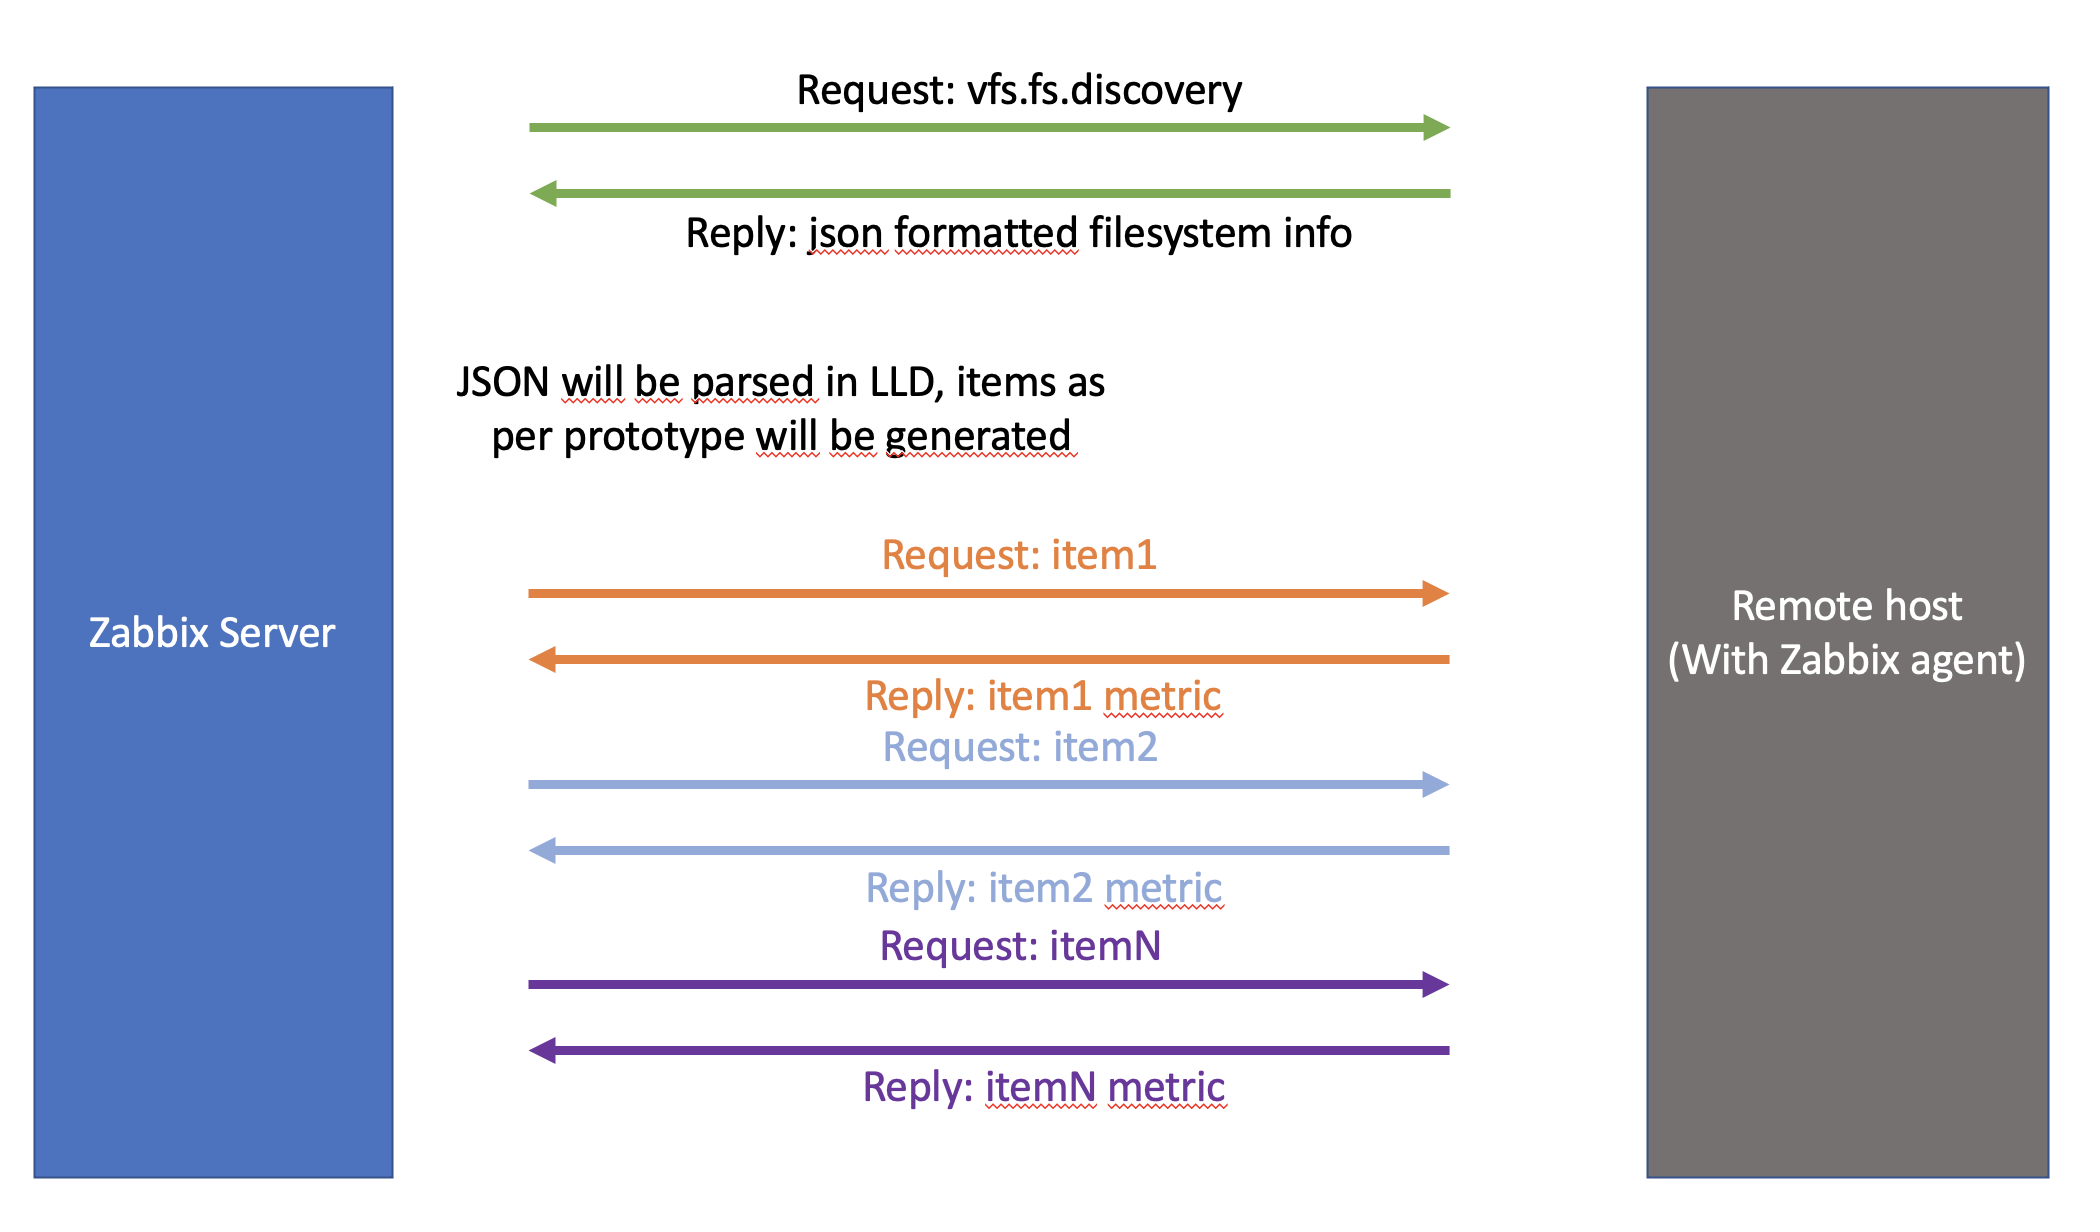
Core logic

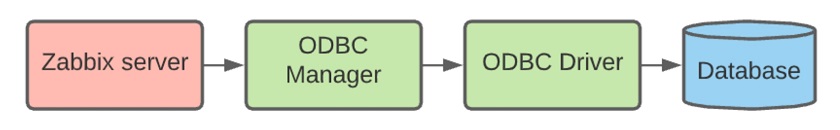
The below diagram shows the concept itself and you will find a detailed guide to implement this step by step in the next sections.

Core workflow


Sample output of Latest Data:

Prerequisites

To start, you will need to deploy Zabbix agent 2 on your target system – confirm that the Zabbix agent can communicate with your Zabbix server.  For the calculated item, we will require local time monitoring. The easiest way is to use the key “system.localtime”, which is already provided by the default Windows OS monitoring template. This item is intentionally not included within the certificate monitoring template to avoid key conflicts.

Below you can find the Powershell script which you have to implement: (name: “certmon_get_certs.ps1″) :

To import module PSPKI you may have to install the module first: https://pkisolutions.com/tools/pspki/

Import-Module PSPKI
$ca_hostname=$args[0]
$start = (Get-Date).AddDays(-7)
Get-IssuedRequest -CertificationAuthority $ca_hostname -Filter "NotAfter -ge $start" | Select-Object -Property RequestID,Request.RequesterName,CommonName,NotAfter,CertificateTemplateOid | ConvertTo-Json -Compress

*for Windows 2012 systems use CertificateTemplate instead of CertificateTemplateOid within this script.

This script expects one parameter, which is your CA server’s FQDN. That name will be loaded into variable “$ca_hostname”, so for testing purposes, you can just replace it with a static entry. Based on your needs you can adjust the “AddDays” parameter. Essentially this means to track back certificates, which are already expired for up to 7 days. Consider a situation, when you miss one just before a long weekend.

Script output

Let’s check the first part of the main command without further piping:

Simple script output without additional properties

As you can see, we are getting some basic information about the certificate. We do not need all the returned lines for the next steps, so it is better to filter the output down. Before we do that, we will use the option called “-Property”, and if you use it with a wildcard character, then it will list all the available parameters for a certificate. If you need more than the basic output, then you can list the extra parameters by using this option. Please be aware, that this will add extra lines compared to the basic output, but it will not do any filtering (the common lines will always remain visible).

Output with “-Property *”

Compare this with the output after using “Select-Object -Property RequestID,Request.RequesterName,CommonName,NotAfter,CertificateTemplateOid”

Output after using property filters

This looks good for us, but it is still not machine-readable. Let’s add the JSON output conversion, but without the “-Compress” option first:

JSON converted compressed output

What is especially great in this conversion, is that the “CertificateTemplateOid” part got 2 child entries, so later we can target the “FriendlyName” entry for discovery. Lastly, adding the “-Compress” option will help us to use less space by removing the white spaces and newlines from the output.

Depending on the amount of issued and valid certificates the output can be huge, especially without any filtering and compression (even megabytes in size). The current Zabbix server version (6.0.3) supports only 512KB as item output, this is why the output reduction is crucial. In my example the text data of one certificate takes approx 300 bytes, so 512KB will result in a limit of 1747 certificates. In case you are expecting more than this amount of ACTIVE certs within your CA, then I recommend cloning the PS script and adding some extra filtering to each variant (filter for template name / requestor / OU) and adjusting the template accordingly. Another approach would be to monitor the certificates, which will expire in the coming N days in case you have too many entries.

Agent configuration

To run the defined script, you have to allow it within the Zabbix Agent configuration file. You can either modify the main config or just define the extra lines within an additional file under zabbix_agent2.d folder. Below you can find the additional Zabbix agent configuration lines:

AllowKey=system.run[powershell -NoProfile -ExecutionPolicy bypass -File "C:\Program Files\Zabbix Agent 2\scripts\certmon_get_certs.ps1" *]
Timeout=20

The wildcard character at the end is needed to specify any hostname, which is expected by the script. The default timeout is 3 seconds, which is unfortunately insufficient. Importing Module PSPKI alone takes a few seconds, so the overall execution time is somewhere between 5 and 10 seconds. My assumption is that more certificates will not increase this significantly, but some extra seconds can be expected. 20 seconds sounds like a safe bet.

We are done with the pre-requisites, now we can start the real work!
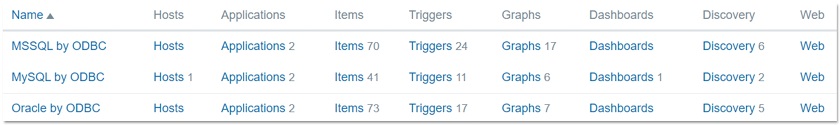
Template

Let’s create our template from scratch.

  • Name: “Microsoft Certificate Authority – Certificate monitoring”
  • Host group: any group will do
Master item

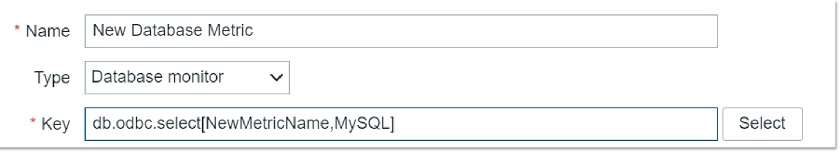
We need only the following item:

  • Name: “Get certificate data”
  • Type: “Zabbix agent / Zabbix agent (active)” – for testing I recommend the passive mode
  • Key: system.run[powershell -NoProfile -ExecutionPolicy bypass -File “C:\Program Files\Zabbix Agent 2\scripts\certmon_get_certs.ps1″ {HOST.DNS}]”
  • Type of information: Text”
  • Update interval: 6h”
  • History: 1d”
Item configuration example

Assign the template to a CA server and you can test the item already. The result should be a big block of data in JSON format. To review the output I recommend the following external websites:

The latter one is especially helpful to find the correct JSON path, which we will require in the upcoming steps.

Item output sample
Measuring the script execution time

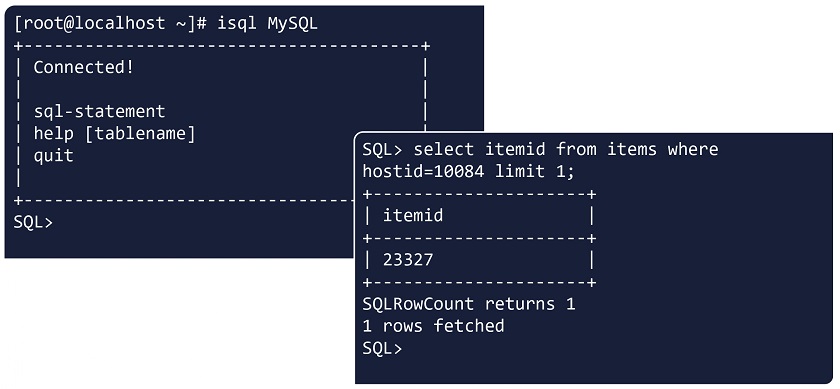
To measure the execution time, you can test it by using Zabbix get, which can connect to your Zabbix agent and request the item value over a CLI:

time zabbix_get -s [CA_SERVER_FQDN] --tls-connect psk --tls-psk-identity [PSK_IDEN] --tls-psk-file [PSK_FILE] -k 'system.run[powershell -NoProfile -ExecutionPolicy bypass -File "C:\Program Files\Zabbix Agent 2\scripts\certmon_get_certs.ps1" [CA_SERVER_FQDN]]'

This will give you the normal output and the execution time info:

real   0m5.771s
user   0m0.003s
sys    0m0.005s

To test the size of the output, redirect your command output to any file and measure it by “du -sk” to get it in kilobytes.

zabbix_get -s [CA_SERVER_FQDN] --tls-connect psk --tls-psk-identity [PSK_IDEN] --tls-psk-file [PSK_FILE] -k 'system.run[powershell -NoProfile -ExecutionPolicy bypass -File "C:\Program Files\Zabbix Agent 2\scripts\certmon_get_certs.ps1" [CA_SERVER_FQDN]]' > output.test
du -sk output.test
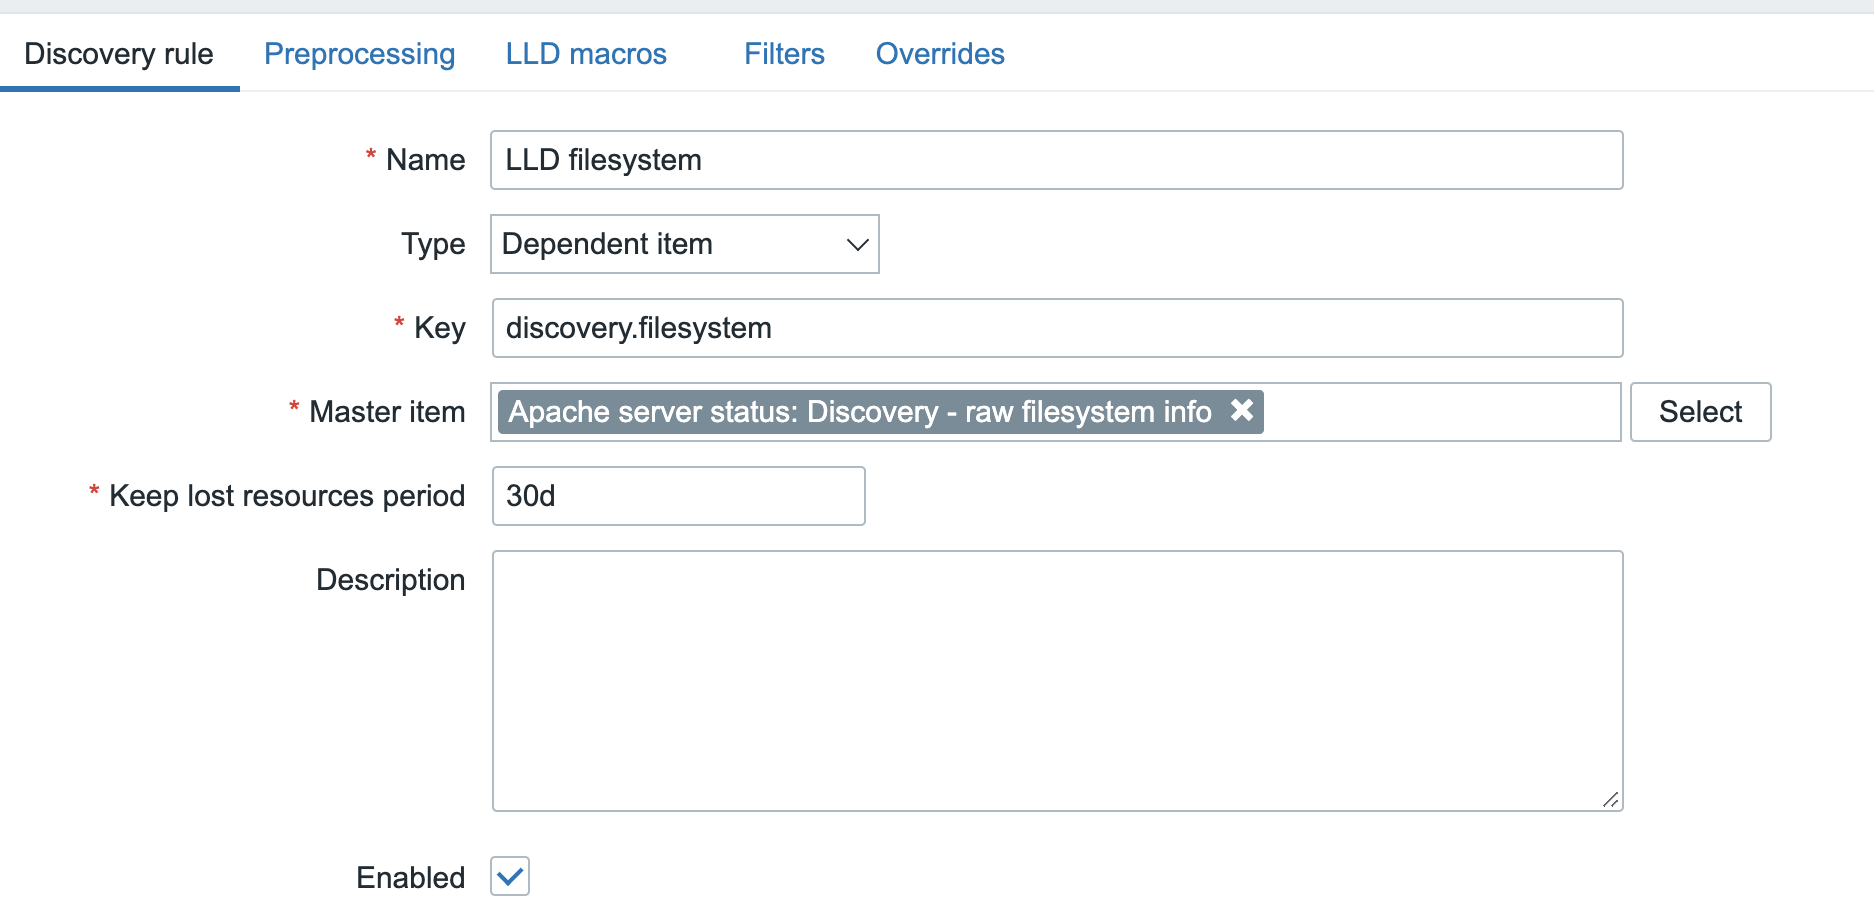
Low-level discovery rule definition

If the above part works just fine, then proceed with defining the low-level discovery rule as per the below example:

  • Name: Certificate discovery”
  • Type: Dependent item”
  • Key: certificate.discovery”
  • Master item: select our previously created item
  • Keep lost resources period: “6h”
Discovery rule configuration example

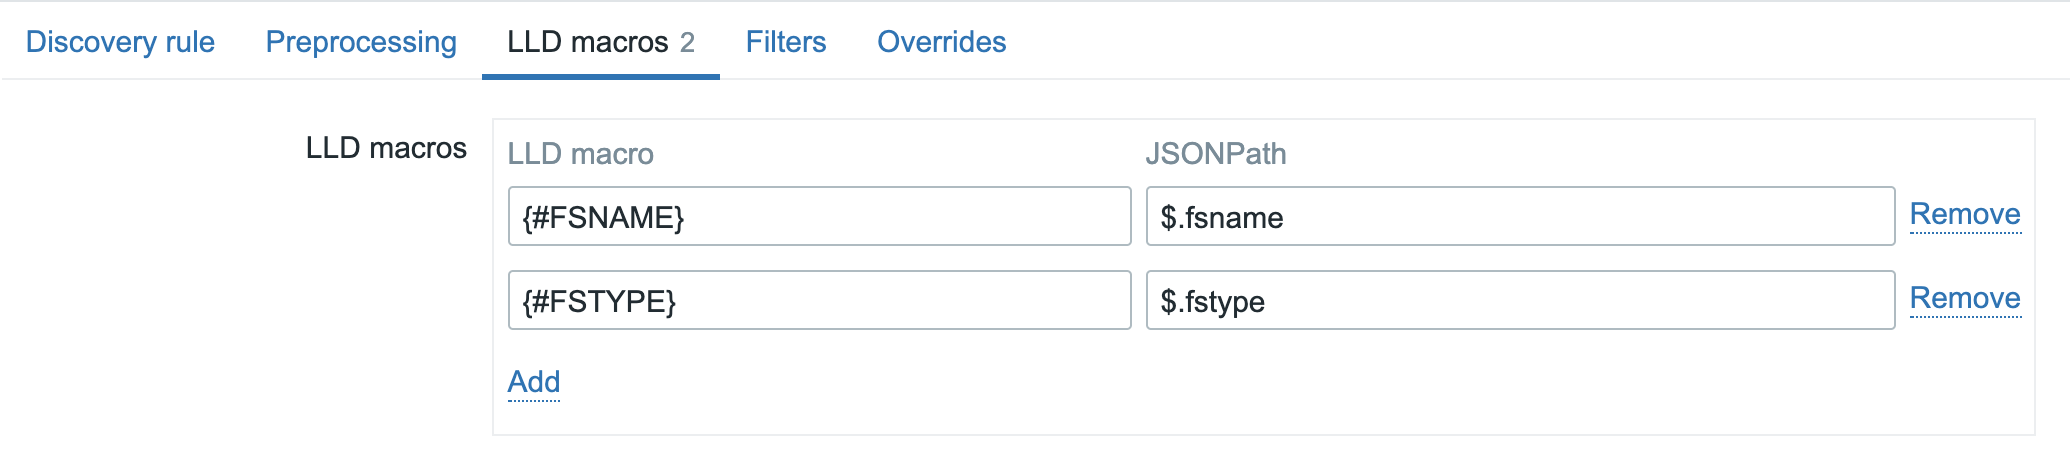
Then switch to LLD macros and define the below lines:

  • “{#COMMON_NAME}”: $.CommonName”
  • “{#REQUESTOR_NAME}”: $.[“Request.RequesterName”]”
  • “{#REQUEST_ID}”: $.RequestID”
  • “{#TEMPLATE_NAME1}”: “$.CertificateTemplate”
  • “{#TEMPLATE_NAME2}”: $.CertificateTemplateOid.FriendlyName”
Discovery rule LLD macro definitions

Some explanation:
The first LLD macro is self-explanatory – it obtains the certificate’s common name. The second one is also trivial, except the special marking, which is required due to the dot character in the middle. The third one is also simple, but the last 2 lines are somewhat special. If you have a fresh OS version, then most probably you will need only the 5th line without the 4th. In case you have a Windows server 2012 system, then you will need only the 4th line without the 5th. Why? Because of Windows 🙂 For testing you can keep both and then later remove the unnecessary one as well as the number suffix.

Now you are ready to create your item prototypes and this is where the real magic starts.

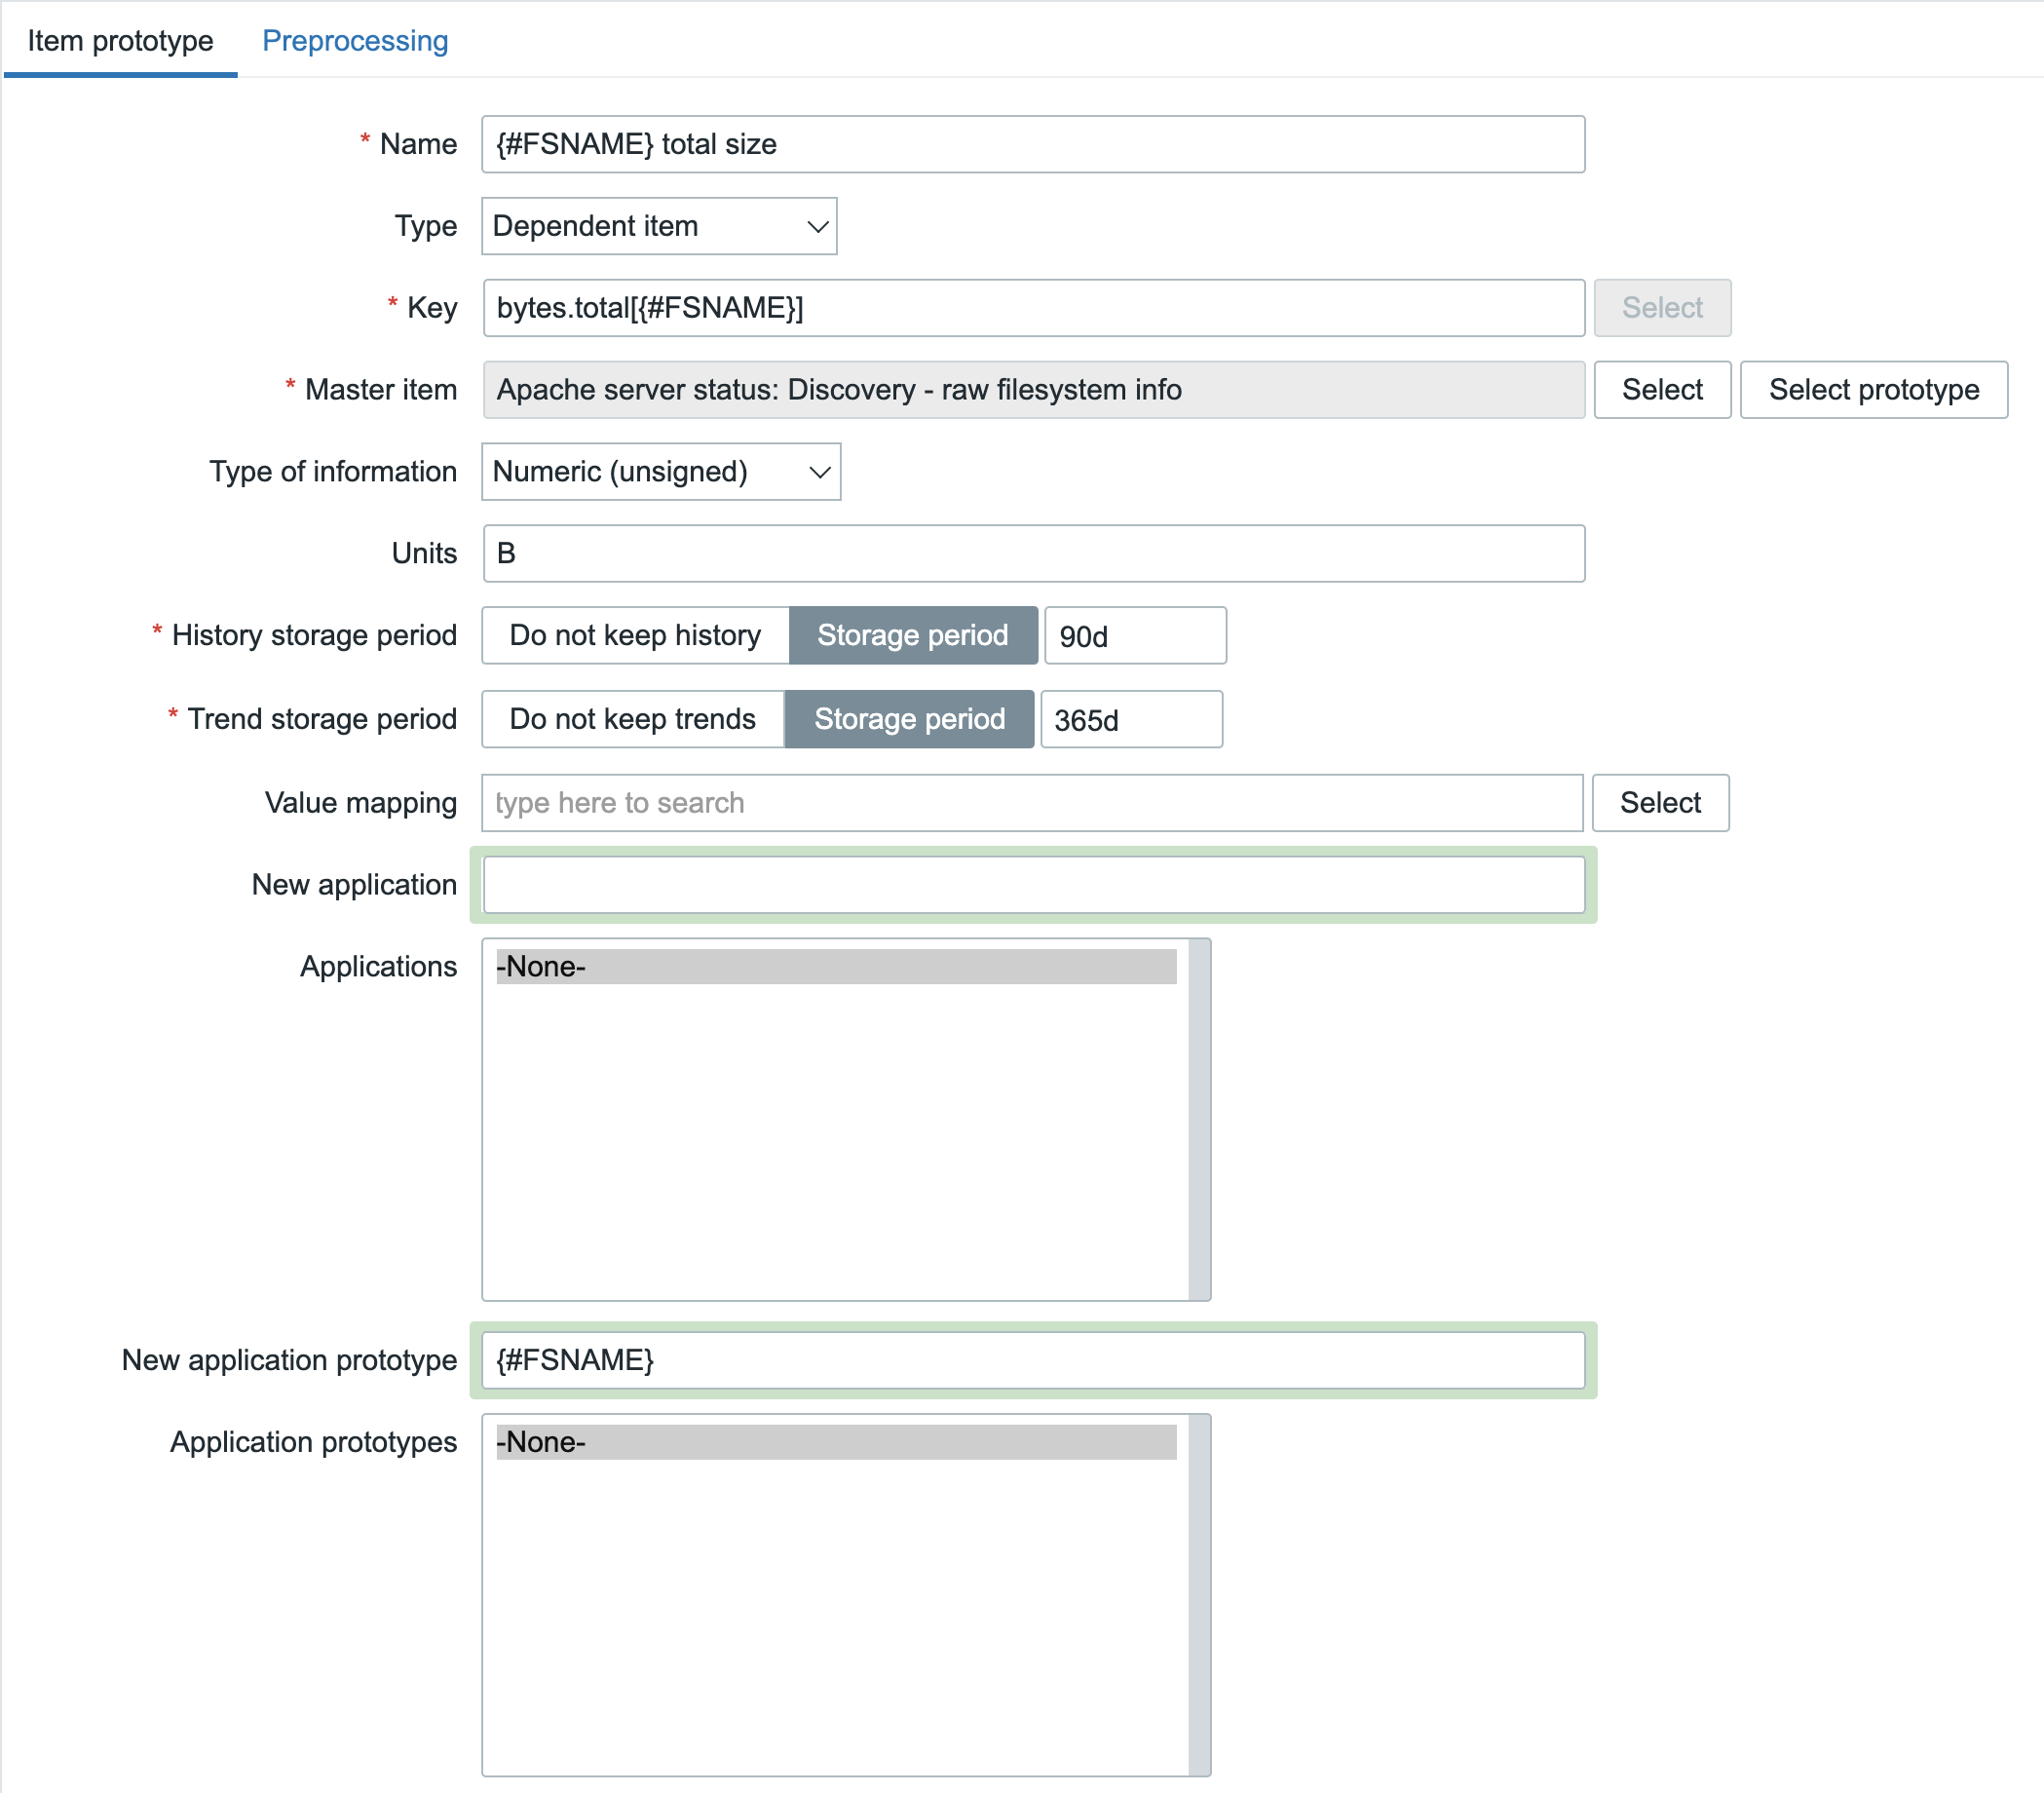
Certificate expiration date item prototype – Dependent item

Define the new item prototype as follows:

  • Name: Certificate [ ID #{#REQUEST_ID} ] {#COMMON_NAME} – Expiration date”
  • Type: Dependent item”
  • Key: certificate.expiration_date[{#REQUEST_ID}]”
  • Type of information: “Numeric (unsigned)”
  • Master item: pick the previously created master item
  • Units: unixtime”
  • History: 1d”
Item prototype example

Tags

  • cert_requestor“:  “{{#REQUESTOR_NAME}.regsub(“\\(\w+)”, “\1″)}”
  • cert_template1“: {#TEMPLATE_NAME1}”
  • cert_template2“: “{#TEMPLATE_NAME2}”
  • “scope”: certifcate / expiration date”
Item prototype tag definitions

As mentioned previously, it makes sense to keep only one template tag later, but for now, such an approach is fine.

The first line requires some explanation:
The requestor name starts with a domain prefix followed by 2 backslashes. If you are submitting CSRs from different domains to this CA server, then you can remove the extra formatting, but in a simple setup, we do not need the domain prefix, since it will be the same for all requestors.
Example: “DOMAIN\\someuser → someuser”
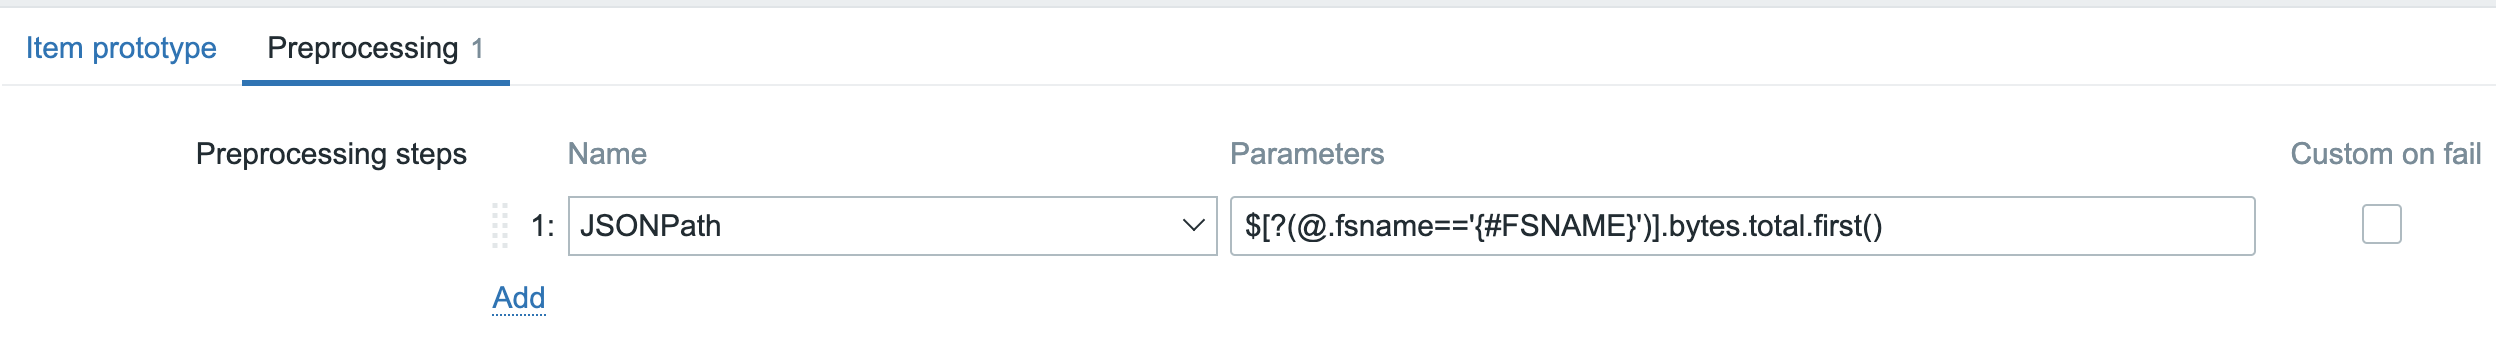
Preprocessing

  • JSONPath: $[?(@.RequestID == {#REQUEST_ID})].NotAfter”
  • Regular expression: (\d+) \1″
  • Custom multiplier: 0.001″
  • Discard unchanged with heartbeat: 1d”
Item prototype preprocessing step definitions

Explanation:
Since this item is a dependent item, it will point back to our master item, which returns a data block in JSON. Due to the nature of the discovery definitions, we are running a while loop, which is already loaded with our variables (the LLD macros). Therefore the “{#REQUEST_ID}” already has a numerical value within each cycle. With this number, we can go back to the original item and target that exact certificate, which has the same ID. Then we are interested in the NotAfter value considering the selected certificate.

You can find many other examples within Zabbix documentation: jsonpath functionality
At this point, we have the extracted value of the expiration date, but it is quite raw at the moment:

\/Date(1673594922000)\/

In the next step, we are taking the numerical part and then we have to apply a multiplier of 0.001 since by default the time is given in milliseconds. After this, we have an integer, which can be converted to a human-readable form by using the unit unixtime”. The last line is just a standard discard unchanged entry.

Since our discovery object is also a dependent item, you have to execute our master item to run the low-level discovery rule. The first execution will result in the creation of your certificate items and only the second execution of the master item will execute them all at once. After this point, you should have N certificate objects created and each should have a valid expiration date. This is already something, for which you could define a trigger, but personally, I prefer to see the remaining days and not the exact date itself.

Days to expire item prototype – Calculated item

Let’s define yet another item prototype as follows:

  • Name: Certificate [ ID #{#REQUEST_ID} ] {#COMMON_NAME} – Days to expire”
  • Type: Calculated”
  • Key: certificate.remaining_days[{#REQUEST_ID}]”
  • Type of information: Numeric (float)”
  • Formula: (last(//certificate.expiration_date[{#REQUEST_ID}])-last(//system.localtime))/86400″
  • Update interval: 6h”
  • History: 1d”
Remaining days to expiration item prototype example

Please do not forget, that you require an existing local time item, which is not provided by this template (but available within Windows by Zabbix agent*” template).

Tags:

Copy the same tags from the first prototype and only change the last tag to scope: certificate / remaining days
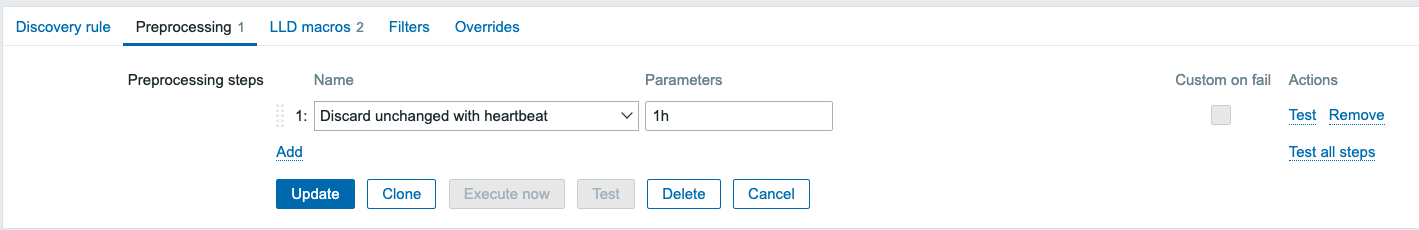
Remaining days to expiration item prototype tag definitions

Preprocessing:

  • Regular expression: ^(-?\d+)”: “\1”
  • Discard unchanged with heartbeat: 1d”
Remaining days to expiration item prototype preprocessing steps

As a result, this will give you a simple number with the remaining days to the expiration date. Then you can decide which item to use in the trigger to implement proper alerting based on your needs.

Certificate expiration trigger prototype

In my case I am just using a simple trigger expression for the remaining days:

  • Name:Certificate will expire within 30 days – {#COMMON_NAME}”
  • Operational data:Expires in {ITEM.LASTVALUE1} days”
  • Severity: up to you
  • Expression:last(/Microsoft Certificate Authority – Certificate monitoring/certificate.remaining_days[{#REQUEST_ID}])<=30″
Trigger prototype example

Tags:

  • cert_cn: “{#COMMON_NAME}”
  • cert_id“:{#REQUEST_ID}”
Trigger prototype tag definitions

When you check the relevant certificates in the Latest data section, then you can do the filtering by the item-based tags. Since we are adding the cert CN and ID only to the trigger, these will appear only in case of alerts. Based on your needs you can implement additional tags, you just have to adjust the PS script to show more properties. When you extend the input data, please always consider the 512KB limit or the configured timeout.

The logic defined in this example can be applied to any JSON formatted data.

Enjoy!

The post JSON is your friend – Certificate monitoring on Microsoft CA server appeared first on Zabbix Blog.

Out-of-the-box database monitoring

Post Syndicated from Renats Valiahmetovs original https://blog.zabbix.com/out-of-the-box-database-monitoring/13957/

From this post and the video, you’ll learn about the possibilities of database monitoring using out-of-the-box Zabbix functionality without having to install additional tools, additional applications, or additional software that might not be allowed by your company.

Contents

I. Classic ODBC monitoring (0:22)

II. Synthetic MySQL monitoring (11:13)
III. DB monitoring with Zabbix Agent 2 (13:48)

IV. LLD for DB monitoring (17:03)

V. Questions & Answers (21:09)

Classic ODBC monitoring

What is ODBC?

ODBC stands for open database connectivity. There are a couple of ODBC drivers available for different database management systems (DBMS):

    • Oracle,
    • PostgreSQL,
    • MySQL,
    • Microsoft SQL Server,
    • Sybase ASE,
    • SAP HANA,
    • DB2.

All of these databases have different ODBCs specifically tailored for them. They offer slightly different functionality. So, even if you have set up the database monitoring for one database it might not necessarily work just as good for the other, as the functionality used to monitor one database might not exist for the other. In addition, as different technologies have different capabilities, most ODBC drivers do not implement all functionality defined in the ODBC standard.

What to monitor?

When we are planning to use ODBC for monitoring, what kind of data we can expect to receive? The answer ultimately depends on your own preferences, needs, or your proficiency in a specific database. You can monitor any possible database performance metrics and incidents using Zabbix templates.

Generally, monitoring of the following areas is of interest:

    • database performance
    • engine availability
    • configuration changes that you need to be aware of

To make the process easier, we provide ready-to-use templates, which can be applied to a host where your database is deployed. You can browse a full list of available metrics in these templates’ descriptions. So, you don’t have to perform configuration completely from scratch, which is good news.

How does it work?

Without diving too deep into the transport layer and all of the technical details, the ODBC driver accesses the database over the network using the database API. So, there is no direct connection between Zabbix and the database. Zabbix only creates a query passed to the ODBC manager for processing, which then moves the request over to the ODBC driver that connects to the database management system and then executes the query. Here, Zabbix does not limit the query execution timeout, and the timeout parameter is used as the ODBC login timeout.

Chain of processes

ODBC configuration is based on two files:

  • odbc.ini — holds a list of installed ODBC database drivers, which are used for specific communication.
  • odbcinst.ini — holds the definitions of data sources so that we know to which database we are going to connect.

Where to start?

What do we need to do in order to start using this ODBC monitoring approach?

  1. First, we will need to install the ODBC driver relevant to the database we are going to monitor. A simple yum command will suffice if we’re working with CentOS.
# yum -y install unixODBC unixODBC-devel
  1. Then we need to specify the package (driver) we want to install and modify the ODBC driver files.
  • odbc.ini:
[root@localhost ~]# cat /etc/odbc.ini
[MySQL]
Description=NewDatabase
Driver=MariaDB
Server=localhost
User=root
Password=VerySecurePassword
Port=3306
Database=DatabaseName
  • odbcinst.ini:
[root@localhost ~]# cat /etc/odbcinst.ini
[MySQL]
Description=ODBC for MySQL
Driver=/usr/lib/libmyodbc5.so
Setup=/usr/lib/libodbcmyS.so
Driver64=/usr/lib64/libmyodbc8a.so
Setup64=/usr/lib64/libmyodbc8a.so
FileUsage=1

Then we need to populate them with the necessary information. So, in this case, DSN (data source name) is used to call a specific connection. We need to get this part correctly, otherwise, the connection will not work out, for instance, in case of a typo.

  1. After we have installed the ODBC driver and configured the configuration files, we don’t really need to go ahead into Zabbix to create a new item and see if it works. We can test the ODBC configuration using isql to connect or at least attempt to connect to a particular database using the specified configuration.

Using isql to test ODBC configuration

If we receive an output that you have been connected then the communication is correct. You can also execute a sort of query, for instance, select some information from the database. If you get the result, then you do have the necessary permissions to access that data, and the connection, that is the ODBC driver, is working fine. Then you can proceed to the frontend.

  1. In the frontend, we will need to create an item of the ‘Database monitor’ type on a particular host or a template and specify one of the two keys available for ODBC monitoring: db.odbc.select or db.odbc.get.

Creating ‘Database monitor’ item

The difference between these item keys is pretty simple — select will return only one value and get will return values in bulk. So, get is more efficient and allows for reducing the load on the database if we are working with a lot of data. Within the key parameters, we need to specify the same DSN that we have defined in our odbc.ini file.

We need to make sure that the first parameter is unique so that this particular item key is unique and does not duplicate anything else, and the second parameter is the DSN.

  1. After we have specified everything, we specify the query, which is a part of the item configuration.
  2. We test the item using the test form in the Zabbix frontend. If the test form returns a value or does not return an error message, then everything is fine and we can proceed with this item or create more items.

Testing the item

ODBC templates

  1. There are a couple of built-in templates. If the metrics obtained through these templates are sufficient, we obviously don’t need to create these items from scratch or configure them. We can simply assign the templates we need to the host, on which we are monitoring the database. All we need to do is to tweak a little, if necessary, modify the macro related to the DSN, and then start monitoring.

Assigning a template

NOTE. The easiest way to get the templates is to upgrade to the latest Zabbix with our official templates already built in. If you don’t have the needed templates for any reason, you can download them from Zabbix official repository or Zabbix integrations. If you still need a specific template, you can definitely check out the community-created templates.

  1. Finally, we can execute discovery rules:

and check the Latest data:

Synthetic MySQL monitoring

Synthetic MySQL monitoring approach is using capabilities of the Zabbix Agent. Though that is not something that Zabbix Agent is doing out of the box, still we don’t need to install anything or perform some super difficult manipulations to make it work as it is a part of Zabbix functionality.

As you might already know, the Zabbix Agent functionality can be extended using custom UserParameters and then used for database monitoring.

  1. So, we can create new UserParameters, which invoke native MySQL administration client commands providing output, which can then be used to calculate performance metrics.
UserParameter=mysql.ping[*], mysqladmin -h"$1" -P"$2" ping
UserParameter=mysql.get_status_variables[*], mysql -h"$1" -P"$2" -sNX -e "show
global status"
UserParameter=mysql.version[*], mysqladmin -s -h"$1" -P"$2" version
UserParameter=mysql.db.discovery[*], mysql -h"$1" -P"$2" -sN -e "show
databases"
  1. It is a good practice to test the commands themselves to make sure that they work and to test the UserParameter keys, for instance using the zabbix_get utility.
  2. Then you might want to use our official MySQL monitoring template by creating an additional file .my.cnf under /var/lib/zabbix (default location) as follows:
[client] 
user='zbx_monitor' 
password='<password>'
  1. Then we need to provide credentials for the user to confirm that the user has the necessary permissions to access the database.
  2. If everything is working, assign MySQL by Zabbix agent template.

In this case, we are not actually logging in to the database. We execute commands from the terminal by using Zabbix Agent and extending the functionality beyond the built-in functions.

DB monitoring with Zabbix Agent 2

Why Zabbix Agent 2?

What are the benefits of Zabbix Agent 2 in relation to database monitoring?

  • Zabbix Agent 2 is the improved version of our original Zabbix Agent, which is now written in Go.
  • Zabbix Agent 2 is more efficient and supports some new functions that Zabbix Agent 1 does not, for instance, custom intervals with active checks as Zabbix Agent 2 is using the Scheduler plugin and is capable of keeping track of time when certain checks need to be executed;
  • Older configuration is also supported. So, if we switch from Zabbix Agent 1 to Zabbix Agent 2, we do not need to rewrite the whole configuration file in order for Zabbix Agent 2 to work.
  • Zabbix Agent 2 is installed simply with one-line command just like Zabbix Agent 1, we need just to specify a different package.
# yum -y install zabbix-agent2
  • Zabbix Agent 2 is based on plugins, so you do not need to install it with ODBC drivers, as plugins do the work, or anything extra as Zabbix Agent 2 has out-of-the-box database-specific plugins to monitor your database, including MySQL, Oracle, and PostgreSQL.
  • Plugins are also written in Go.
  • We have created Zabbix Agent 2-specific templates, which we can assign to the host. So, if you decide to use Zabbix Agent 2, you need to perform even fewer manipulations in order to get your database monitored by Zabbix.

Built-in Zabbix Agent 2 templates

Configuration

The configuration is very simple. We need to decide whether we specify the necessary parameters within the item keys or, if we prefer named sessions, we edit the configuration file of Zabbix Agent 2 to define those and use the session name as the first parameter of the key.

  1. So, we specify the key according to the documentation page. In the first case, we can specify essentially the location of our database and provide the credentials.

In the second case, we simply need to provide the DSN in order to connect to the database using Zabbix Agent 2 built-in plugins.

Plugins.Mysql.Sessions.Prod.Uri=tcp://192.168.1.1:3306

Plugins.Mysql.Sessions.Prod.User=<UserForProd>

Plugins.Mysql.Sessions.Prod.Password=<PasswordForProd>
  1. After we have created these items or applied a template, we can definitely test them out and see whether they are working fine.

NOTE. Check available MySQL-related item keys documentation page.

LLD for DB monitoring

Why LLD?

Finally, you can definitely use low-level discovery for database monitoring. LLD is a very efficient and powerful tool within Zabbix. You can definitely use either built-in discovery keys, which utilize Zabbix Agent, or other sources such as custom scripts to pass the payload to your low-level discovery rule.

LLD:

    • Automatically creates items, triggers, and graphs from different entities on a host.
    • Parses data received in Zabbix-specific JSON format.
    • Different sources for LLD can be used, such as:
      • Built-in discovery keys,
      • Dependent on a built-in item key,
      • Dependent on a custom script/custom UserParameter.

Here we have a script providing our JSON-formatted payload, which is sent by the Data sender Zabbix utility to the Master trapper item within our Zabbix instance, while our LLD rule depends on this particular Master trapper item.

So, we just populate this trapper item with the JSON payload, LLD rule creates new entities based on the prototypes, and then the items created by those prototypes are collecting the data from that master trapper item each time a new payload comes in.

How to configure custom LLD?

In general, to create LLD from scratch:

  1. First, you will need to decide on the actual payload delivery method (Zabbix Agent, script, Zabbix sender, or UserParameter).
  2. Make sure that your payload is in JSON that is structurally sound so that Zabbix can accept and parse it.
[{"{#DATABASE}":"information_schema"},{"{#DATABASE}":"mysql"},{"{#DATABASE}":"p erformance_schema"},{"{#DATABASE}":"sys"},{"{#DATABASE}":"zabbix"}]
  1. Create LLD rule with type according to delivery method.
  2. Test the rule (if available for passive checks) to see JSON you receive.
  3. Create filters or overrides, if necessary.
  4. Create prototypes, based on which your entities will be created.

If we don’t want to create LLD rules from scratch, we can definitely modify the built-in templates without wasting time creating custom LLD rules:

    • Modify/create new entities;
    • Clone the templates;
    • Refer to templated discovery rule configuration.

Modifying LLD rules of official templates

Questions & Answers

Question. Can we monitor the database using active checks or passive checks?

Answer. As I have mentioned, everything depends on your preferences and, ultimately, on the way you want to pass this output to Zabbix Server. If we’re talking about active checks, you can utilize Zabbix sender, for instance. So, it will be a trapper item on the Zabbix Server side waiting for data. In case of passive checks, we can use Zabbix Agent. So, we can use both types of checks for database monitoring.

Question. Can we establish a secure connection between the ODBC gateway and the database, which is somewhere on a distant machine?

Answer. Yes, this can be done though it does require a little bit of finesse. It is an extensive topic, and the security of the connection is highly dependent on the driver, which should support a secure connection. Some older databases might not have this functionality.

Question. Are ODBC checks influencing the performance of the master server?

Answer. It depends on what kind of data you are collecting. If you have a lot of items utilizing db.odbc.get item key, which retrieves just one value from the database, this might impact your database performance. You might not notice this impact if your hardware is powerful enough. However, it is advisable to use the odbc.select key in order to collect this information in bulk. Otherwise, you might be locking up some entries within your database that could potentially lead to problems.

Question. So, we provide two solutions with one of them using ODBC agentless checks ODBC. In addition, we have the agent tool. Will you briefly describe the advantages of ODBC and Agent checks?

Answer. If we’re talking about the ODBC database monitoring method, the most obvious difference is that you don’t need to install an agent. From the data collection perspective, there is not much difference. Everything depends on your specific needs.


Low-Level Discovery with Dependent items

Post Syndicated from Brian van Baekel original https://blog.zabbix.com/low-level-discovery-with-dependent-items/13634/

The low-level discovery was introduced in Zabbix 2.0 and still belongs to one of the all-time favorites. Before LLD was available, adding items was all manual work. For example adding new disks, new interfaces, network ports on switches and everything else was all manual labor. And then LLD came around and suddenly we were able to ‘discover’ entities, and based on those discovered entities we can add new items, triggers, and such automatically.

Contents

  • Low-Level Discovery setup
  • Dependent items
  • Combing Low-Level Discovery and Dependent items
  • Conclusion

For a video guide, check out the Zabbix YouTube here: Zabbix: Low Level Discovery with Dependent items – YouTube

Low-Level Discovery setup

Let’s go over the idea of Low-Level Discovery first.

For the sake of clarity, we will stick with the default Zabbix agent item. Of course, as we will discover it’s only the format that matters for Zabbix to consider a response as LLD information. Let’s use built-in agent key: vfs.fs.discovery. Once we force the Zabbix agent to execute this item, it will reply with something like this:

[{"{#FSNAME}":"/sys","{#FSTYPE}":"sysfs"},{"{#FSNAME}":"/proc","{#FSTYPE}":"proc"},{"{#FSNAME}":"/dev","{#FSTYPE}":"devtmpfs"},{"{#FSNAME}":"/sys/kernel/security","{#FSTYPE}":"securityfs"},{"{#FSNAME}":"/dev/shm","{#FSTYPE}":"tmpfs"},{"{#FSNAME}":"/dev/pts","{#FSTYPE}":"devpts"},{"{#FSNAME}":"/run","{#FSTYPE}":"tmpfs"},{"{#FSNAME}":"/sys/fs/cgroup","{#FSTYPE}":"tmpfs"},{"{#FSNAME}":"/sys/fs/cgroup/systemd","{#FSTYPE}":"cgroup"},{"{#FSNAME}":"/sys/fs/pstore","{#FSTYPE}":"pstore"},{"{#FSNAME}":"/sys/firmware/efi/efivars","{#FSTYPE}":"efivarfs"},{"{#FSNAME}":"/sys/fs/bpf","{#FSTYPE}":"bpf"},{"{#FSNAME}":"/sys/fs/cgroup/net_cls,net_prio","{#FSTYPE}":"cgroup"},{"{#FSNAME}":"/sys/fs/cgroup/devices","{#FSTYPE}":"cgroup"},{"{#FSNAME}":"/sys/fs/cgroup/hugetlb","{#FSTYPE}":"cgroup"},{"{#FSNAME}":"/sys/fs/cgroup/memory","{#FSTYPE}":"cgroup"},{"{#FSNAME}":"/sys/fs/cgroup/rdma","{#FSTYPE}":"cgroup"},{"{#FSNAME}":"/sys/fs/cgroup/freezer","{#FSTYPE}":"cgroup"},{"{#FSNAME}":"/sys/fs/cgroup/cpu,cpuacct","{#FSTYPE}":"cgroup"},{"{#FSNAME}":"/sys/fs/cgroup/cpuset","{#FSTYPE}":"cgroup"},{"{#FSNAME}":"/sys/fs/cgroup/perf_event","{#FSTYPE}":"cgroup"},{"{#FSNAME}":"/sys/fs/cgroup/blkio","{#FSTYPE}":"cgroup"},{"{#FSNAME}":"/sys/fs/cgroup/pids","{#FSTYPE}":"cgroup"},{"{#FSNAME}":"/sys/kernel/tracing","{#FSTYPE}":"tracefs"},{"{#FSNAME}":"/sys/kernel/config","{#FSTYPE}":"configfs"},{"{#FSNAME}":"/","{#FSTYPE}":"xfs"},{"{#FSNAME}":"/sys/fs/selinux","{#FSTYPE}":"selinuxfs"},{"{#FSNAME}":"/proc/sys/fs/binfmt_misc","{#FSTYPE}":"autofs"},{"{#FSNAME}":"/dev/hugepages","{#FSTYPE}":"hugetlbfs"},{"{#FSNAME}":"/dev/mqueue","{#FSTYPE}":"mqueue"},{"{#FSNAME}":"/sys/kernel/debug","{#FSTYPE}":"debugfs"},{"{#FSNAME}":"/sys/fs/fuse/connections","{#FSTYPE}":"fusectl"},{"{#FSNAME}":"/boot","{#FSTYPE}":"ext4"},{"{#FSNAME}":"/boot/efi","{#FSTYPE}":"vfat"},{"{#FSNAME}":"/home","{#FSTYPE}":"xfs"},{"{#FSNAME}":"/run/user/0","{#FSTYPE}":"tmpfs"}]

When we put this in a more readable format (truncated) it will look like this:

[
{
"{#FSNAME}":"/sys",
"{#FSTYPE}":"sysfs"
},
{
"{#FSNAME}":"/proc",
"{#FSTYPE}":"proc"
},
{
"{#FSNAME}":"/dev",
"{#FSTYPE}":"devtmpfs"
},
{
"{#FSNAME}":"/sys/kernel/config",
"{#FSTYPE}":"configfs"
},
{
"{#FSNAME}":"/",
"{#FSTYPE}":"xfs"
},
{
"{#FSNAME}":"/boot",
"{#FSTYPE}":"ext4"
},
{
"{#FSNAME}":"/home",
"{#FSTYPE}":"xfs"
}
]

In this format it suddenly becomes clear, we have the {#FSNAME} macro, with the name of a filesystem, combined with the type, captured in {#FSTYPE}.

Perfect! We feed this information into Zabbix, and LLD magic will happen.
Based on the Item prototypes, new items per {#FSNAME} will be added, and monitoring will start on those items.

Looking at the Item prototypes, they look a lot like normal items:

So, we have one item prototype that is responsible for providing the LLD information, and then the created ‘normal’ items to query the filesystem statistics. As you can imagine, with just 5 filesystems and 1 metric per filesystem, queried once per minute, no problem. But what if we have 50 filesystems, 7 metrics per filesystem and they get queried every 10 seconds… That’s a lot of queries against the host! Not only does that add load to the Zabbix server, but obviously also to the monitored host. It works, but is it ideal? It certainly isn’t!

So we’ve basically just setup this:

Dependent items

But then Zabbix introduced dependent items. Let’s take a quick look at dependent items and what they are

We have one master item that gathers all information (in bulk) and propagates that information to all the dependent items. On those dependent items we just do the cherry picking and filtering of the relevant metrics. Let’s put this to work and see how that goes.

So we create an item, with, in this case, the http agent type, which will collect the following information regarding the server status in a single request:

ServerVersion: Apache/2.4.37 (centos)
ServerMPM: event
Server Built: Nov  4 2020 03:20:37
CurrentTime: Monday, 08-Mar-2021 14:35:20 CET
RestartTime: Monday, 08-Mar-2021 11:04:09 CET
ParentServerConfigGeneration: 1
ParentServerMPMGeneration: 0
ServerUptimeSeconds: 12671
ServerUptime: 3 hours 31 minutes 11 seconds
Load1: 0.01
Load5: 0.03
Load15: 0.00
Total Accesses: 1182
Total kBytes: 10829
Total Duration: 95552
CPUUser: 5.01
CPUSystem: 7.34
CPUChildrenUser: 0
CPUChildrenSystem: 0
CPULoad: .0974667
Uptime: 12671
ReqPerSec: .0932839
BytesPerSec: 875.14
BytesPerReq: 9381.47
DurationPerReq: 80.8393
BusyWorkers: 1
IdleWorkers: 99
Processes: 4
Stopping: 0
BusyWorkers: 1
IdleWorkers: 99
ConnsTotal: 4
ConnsAsyncWriting: 0
ConnsAsyncKeepAlive: 0
ConnsAsyncClosing: 0
Scoreboard: _________________________________________________________________________________________W__________............................................................................................................................................................................................................................................................................................................


Now, we create some dependent items, that depend on that first item (which we will call the Master item). Every time the Master item receives information, the complete reply will be pushed to the dependent items, without any altering of that data. So the master and dependent items are identical when no preprocessing is applied. That’s why on the dependent items we apply preprocessing to filter relevant information, for example, the BusyWorkers:

Perfect. So querying a host once, getting all the metrics in bulk, and then parsing it in Zabbix using preprocessing. Say bye to excessive load on the monitored host… (and due to preprocessing processes within Zabbix, no problem on the Zabbix server side).

Combining Low-Level Discovery and Dependent items

Ok, and what if we combine these to concepts? LLD with Dependent items? Wouldn’t that be the ultimate goal? Automatically creating new items without putting extra load to the monitored host? Let’s get this going!

To stick with the first example of LLD, we will discover filesystems, but now without the vfs.fs.discovery key, but the newly introduced vfs.fs.get key. Once we force the agent to execute this key, we will see this reply:

[{"fsname":"/dev","fstype":"devtmpfs","bytes":{"total":1940963328,"free":1940963328,"used":0,"pfree":100.000000,"pused":0.000000},"inodes":{"total":473868,"free":473487,"used":381,"pfree":99.919598,"pused":0.080402}},{"fsname":"/dev/shm","fstype":"tmpfs","bytes":{"total":1958469632,"free":1958469632,"used":0,"pfree":100.000000,"pused":0.000000},"inodes":{"total":478142,"free":478141,"used":1,"pfree":99.999791,"pused":0.000209}},{"fsname":"/run","fstype":"tmpfs","bytes":{"total":1958469632,"free":1892040704,"used":66428928,"pfree":96.608121,"pused":3.391879},"inodes":{"total":478142,"free":477519,"used":623,"pfree":99.869704,"pused":0.130296}},{"fsname":"/sys/fs/cgroup","fstype":"tmpfs","bytes":{"total":1958469632,"free":1958469632,"used":0,"pfree":100.000000,"pused":0.000000},"inodes":{"total":478142,"free":478125,"used":17,"pfree":99.996445,"pused":0.003555}},{"fsname":"/","fstype":"xfs","bytes":{"total":95516360704,"free":55329644544,"used":40186716160,"pfree":57.926877,"pused":42.073123},"inodes":{"total":46661632,"free":46535047,"used":126585,"pfree":99.728717,"pused":0.271283}},{"fsname":"/boot","fstype":"ext4","bytes":{"total":1023303680,"free":705544192,"used":247296000,"pfree":74.046435,"pused":25.953565},"inodes":{"total":65536,"free":65497,"used":39,"pfree":99.940491,"pused":0.059509}},{"fsname":"/home","fstype":"xfs","bytes":{"total":5358223360,"free":5286903808,"used":71319552,"pfree":98.668970,"pused":1.331030},"inodes":{"total":2621440,"free":2621428,"used":12,"pfree":99.999542,"pused":0.000458}},{"fsname":"/run/user/0","fstype":"tmpfs","bytes":{"total":391692288,"free":391692288,"used":0,"pfree":100.000000,"pused":0.000000},"inodes":{"total":478142,"free":478137,"used":5,"pfree":99.998954,"pused":0.001046}}]

And if we format it to be more readable, it will look like this (truncated):

[
  {
    "fsname":"/",
    "fstype":"xfs",
    "bytes":{
      "total":95516360704,
      "free":55329644544,
      "used":40186716160,
      "pfree":57.926877,
      "pused":42.073123
    },
    "inodes":{
      "total":46661632,
      "free":46535047,
      "used":126585,
      "pfree":99.728717,
      "pused":0.271283
    }
  },
  {
    "fsname":"/home",
    "fstype":"xfs",
    "bytes":{
      "total":5358223360,
      "free":5286903808,
      "used":71319552,
      "pfree":98.668970,
      "pused":1.331030
    },
    "inodes":{
      "total":2621440,
      "free":2621428,
      "used":12,
      "pfree":99.999542,
      "pused":0.000458
    }
  }
]

Per filesystem, we get the original information FSNAME and FSTYPE, but also the statistics of these filesystems… bulk metrics! So, we create a normal item (Which will serve as the master item) getting out all those metrics in a single query:

Once we’ve got this data in Zabbix, we feed it into the LLD rule, giving this LLD rule the dependent LLD type:

Of course there are no ready to use LLD macros in this data, but since it is in JSON format, it shouldn’t be too hard to create the LLD macros with the ‘LLD macros’ option in the frontend and the relevant JSONPath expression:

Note: Technically we do not need to create the {#FSTYPE} macro to get this working!

Once this is done, we should be ready to create the item prototypes for this LLD rule. The data is there, macros are available, nothing is going to stop us now!

Let’s move on to item prototypes. But of course, we do not want to poll that remote host again per discovered filesystem. That means we will make this item prototype of the dependent item type as well, pointing it back to the master item we’ve created.

For the first item prototype, we want to obtain the total size per filesystem:

But, as I mentioned earlier: a dependent item without any preprocessing is identical to the master item and of course that would be wrong in this case. We just want to see the total bytes per filesystem and not all the collected statistics. In the configuration above we already know what to get out, so the Type of information and Units are filled already. What is not visible on that screenshot is the preprocessing rule that we need. Here the ‘JSONPath’ preprocessing step comes in handy since we receive JSON data. We would like to get out this part for our item (truncated):

[
  {
    "fsname":"/",
    "fstype":"xfs",
    "bytes":{
      "total":95516360704,
      "free":55329644544,
       "used":40186716160,
      "pfree":57.926877,
      "pused":42.073123

So, if we try to get this information out using JSONPath, it should look like: $.bytes.total.first() but this will match on any filesystem, so we need to configure it a bit more specific like: $[?(@.fsname==’/’)].bytes.total.first() 

As you can see, the JSONPath is a bit more complex here. We are forcing it to match on @.fsname==’/’ and from that entity, get out the bytes.total. Now, to make it even more complex we shouldn’t configure the filesystem hardcoded in the JSONPath since we’re working with Item prototypes. It should be the LLD Macro {#FSNAME} instead!

Now we save this item prototype, grab a cup of coffee (or just force a config_cache_reload on the server) and just wait for the magic to happen.

We’ve now built this setup:


So the master item will get values (i.e. obtain bulk data every minute) and push it into the LLD rule. From there, as per item prototypes, items will be created and those are populated from the master item as well, filtering out only the relevant metrics using Preprocessing.

So far, so good, but we have one small problem to solve: We want to get metrics every minute or so, but since all those metrics will get pushed into the LLD rule, we might be adding unnecessary extra load due to the high frequency. Luckily, solving that problem is no too hard. Navigate to the discovery rule, go to the ‘Preprocessing tab’ and select ‘Discard unchanged with heartbeat’ parameter: 1h or even larger interval!

This is insane! With just one poll/query to a host, we will utilize the power of LLD and dependent items, getting all metrics without adding minimal extra load on that host.


Conclusion

That’s it. If you’ve setup everything correctly, you should now get out quite a few filesystem metrics without adding any extra performance overhead on the host by performing unnecessary data requests.

Of course, if you need help optimizing your Zabbix environment, support contracts, consultancy, or training, we from Opensource ICT Solutions are always available to assist you in every possible way, worldwide, 24×7.

Thanks for reading this blog post, see you in the next one.