Tag Archives: Power & Utilities

Physics on AWS: Optimizing wind turbine performance using OpenFAST in a digital twin

Post Syndicated from Marco Masciola original https://aws.amazon.com/blogs/architecture/physics-on-aws-optimizing-wind-turbine-performance-using-openfast-in-a-digital-twin/

Wind energy plays a crucial role in global decarbonization efforts by generating emission-free power from an abundant resource. In 2022, wind energy produced 2100 terawatt-hours (TWh) globally, or over 7% of global electricity, with expectations to reach 7400 TWh by 2030.

Despite its potential, several challenges must be addressed to help meet grid decarbonization targets. As wind energy adoption grows, issues like gearbox fatigue and leading-edge erosion need to be resolved to ensure a predictable supply of energy. For example, in the United States, wind turbines underperform by as much as 10% after 11 years of operation, despite expectations for the machine to operate at full potential for 25 years.

This blog reveals a digital twin architecture using the National Renewable Energy Laboratory’s (NREL) OpenFAST, an open-source multi-physics wind turbine simulation tool, to characterize operational anomalies and continuously improve wind farm performance. This approach can be used to support an overall maintenance strategy to optimize performance and profitability while reducing risk.

While a digital twin can take many forms, this architecture represents it with a physical wind turbine connected to the cloud using IoT devices to monitor performance and augmented knowledge using on-demand simulations. The insight gained from simulations can update the physical asset control system in near real-time to balance operational performance.

Why build this?

This digital twin can catch reliability assessment discrepancies by benchmarking real-world time series with simulations. Aeroelastic simulators like OpenFAST define operational envelopes as part of wind turbine design and certification in accordance with IEC 61400-1 and 61400-3. However, subtle, unanticipated changes in environmental conditions not accounted for in the initial design certification, such as higher turbulence intensity, accelerate degradation.

This architecture can be used to validate if a controller change can limit gradual performance damage before the controller changes are deployed by using the same simulation software for wind turbine design. This example scenario, one that operators currently struggle with, is threaded in the next section.

Digital twin architecture

Figure 1 illustrates the event-driven architecture in which resources launch on-demand simulations as anomalies occur.

Architecture for wind turbine digital twin solution

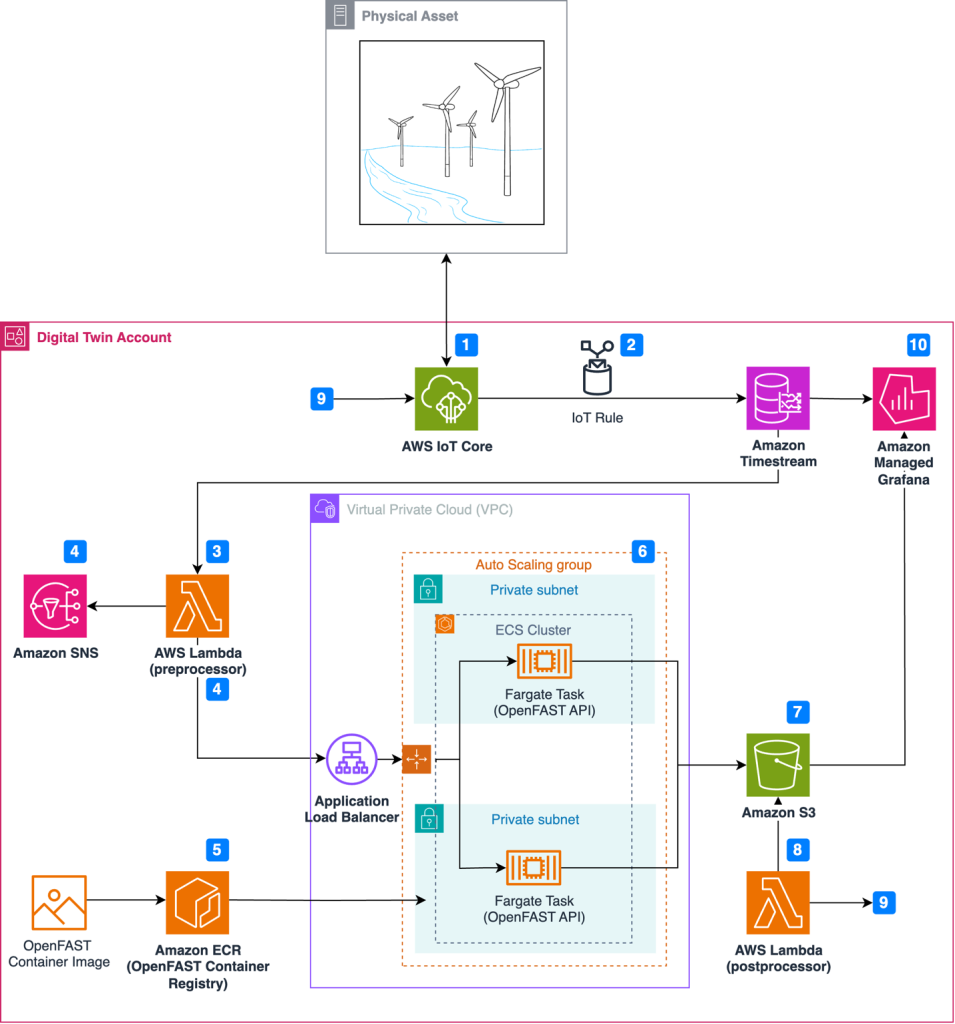
Figure 1. Architecture for wind turbine digital twin solution

Simulation and real-world results can feed into a calculation engine to update the wind turbine controller software and improve operational performance through this workflow:

  1. Wind turbine sensors are connected to the AWS cloud using AWS IoT Core.
  2. An IoT rule forwards sensor data to Amazon Timestream, a purpose-built time series database.
  3. A scheduled AWS Lambda function queries Timestream to detect anomalies in time-series data.
  4. Upon anomaly detection, Amazon Simple Notification Service (Amazon SNS) publishes notifications and OpenFAST simulation input files are prepared in the Lambda preprocessor.
  5. Simulations are executed on demand, where the latest OpenFAST simulation is pulled from Amazon Elastic Container Registry (Amazon ECR).
  6. Simulations are dispatched through RESTful API and run using AWS Fargate.
  7. Simulation results are uploaded to Amazon Simple Storage Service (Amazon S3).
  8. Simulation time-series data is processed using AWS Lambda, where a decision is made to update the controller software based on the anomaly.
  9. The Lambda post-processer initiates a wind turbine controller software update, which is communicated to the wind turbine through AWS IoT Core.
  10. Results are visualized in Amazon Managed Grafana.

An example of an anomaly in step 3 is a controller overspeed alarm. Simple rule-based anomaly detection can be used to detect exceedance thresholds. You can also incorporate more sophisticated forms of anomaly detection using machine learning through Amazon SageMaker. The workflow above preserves four elements to create a digital twin. We will explore these four elements in the next section:

Event-driven architecture

Event-driven architectures enable decoupled systems and asynchronous communications between services. An event-driven workflow is initiated automatically as events occur. An event might be an active alarm or an OpenFAST output file uploaded to Amazon S3. This means that the number of actively monitored wind turbines can scale from one to 100 (or more) without allocating new resources.

AWS Lambda provides instant scaling to increase the number of OpenFAST simulations available for processing. Additionally, Fargate removes the need to provision or manage the underlying OpenFAST compute instances. Leveraging serverless compute services removes the need to manage underlying infrastructure, provides demand-based scaling, and reduces costs compared to statically provisioned infrastructure.

In practice, event-driven architecture provides teams with flexibility to automatically prepare input files, dispatch simulations, and post-process results without manually provisioning resources.

Containerization

Containerization is a process to deploy an application with libraries needed for execution. Docker creates a container image that bundles the OpenFAST executable. FastAPI is also included in the OpenFAST container so that simulations can be dispatched through a web RESTful API, as demonstrated in Figure 2. Note that OpenFAST and FastAPI are independent projects. The RESTful API for OpenFAST is provisioned with commands to:

  • Run the simulation with initial conditions (PUT: /execute)
  • Upload simulation results to Amazon S3 (POST: /upload_to_s3)
  • Provide simulation status (GET: /status)
  • Delete simulation results (DELETE: /simulation)

This setup enables engineering teams to pull an OpenFAST simulation version aligned with physical wind turbines in operation without manual configuration.

Web frontend showing the RESTfulAPI commands available for dispatching OpenFAST simulations

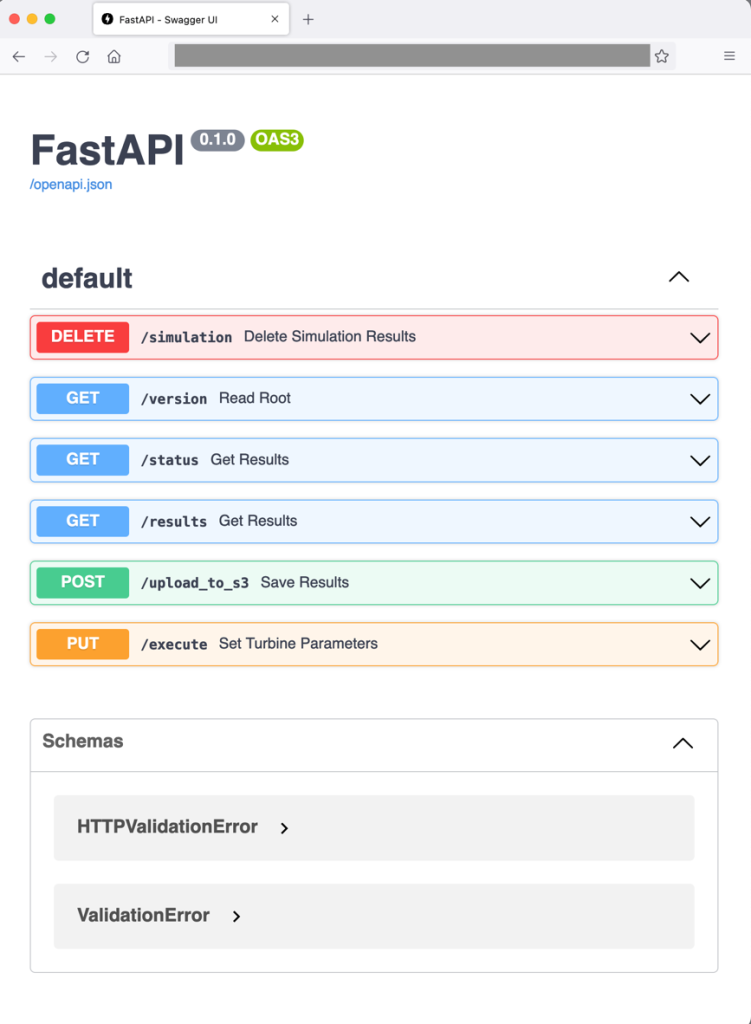
Figure 2. Web frontend showing the RESTfulAPI commands available for dispatching OpenFAST simulations

Load balancing and auto scaling

The architecture uses Amazon EC2 Auto Scaling and an ALB to manage fluctuating processing demands and enable concurrent OpenFAST simulations. EC2 Auto Scaling dynamically scales the number of OpenFAST containers based on the volume of simulation requests and offers cost savings to avoid idle resources. Paired with an ALB, this setup evenly distributes simulation requests across OpenFAST containers, ensuring desired performance levels and high availability.

Data visualization

Amazon Timestream collects and archives real-time metrics from physical wind turbines. Timestream can store any metric from the physical asset collected through IoT Core, including rotor speed, generator power, generator speed, generator torque, or wind turbine control system alarms, as shown in Figure 3. One distinctive Timestream feature is scheduled queries that can regularly perform automated tasks like measuring 10-minute average wind speeds or tracking down units with controller alarms.

This provides operations teams the ability to view granular insights in real time or query historical data using SQL. Amazon Managed Grafana is also connected to OpenFAST results stored in Amazon S3 to compare simulation results with real-world operational data and view the response of simulated components. Engineering teams benefit from Amazon Managed Grafana because it provides a window into how the simulation responds to controller changes. Engineers can then verify whether the physical machine responds in the expected manner.

Example Amazon Managed Grafana dashboard

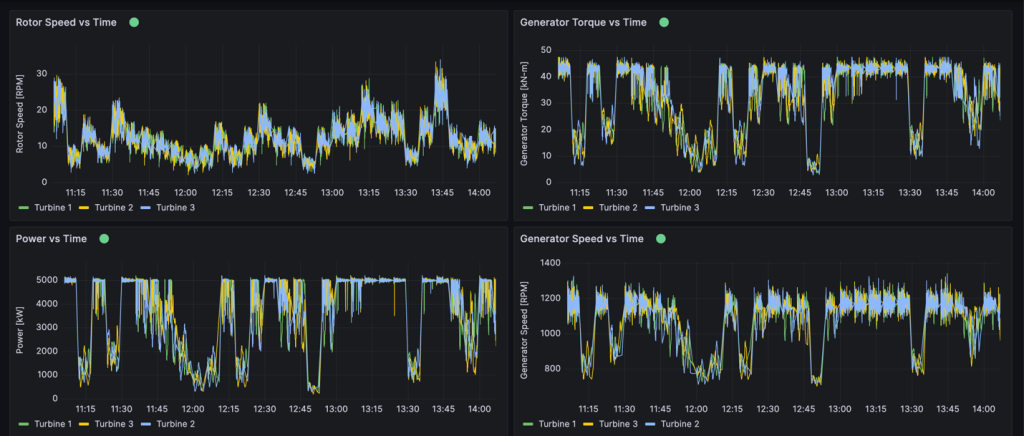
Figure 3. Example Amazon Managed Grafana dashboard

Conclusion

The AWS Cloud offers services and infrastructure to provide organization resources to process data and build digital twins. Organizations can leverage open-source models to improve operational performance and physics-based simulations to improve accuracy. By integrating technology paradigms such as event-drive architectures, wind turbine operators can make data-driven decisions in real time. Organizations can create virtual replicas of physical wind turbines to diagnose the source of alarms and adopt strategies to limit excessive wear before permanent damage occurs.

Ensure Workload Resiliency and Comply with Data Residency Requirements with AWS Outposts

Post Syndicated from Pedram Jahangiri original https://aws.amazon.com/blogs/architecture/ensure-workload-resiliency-and-comply-with-data-residency-requirements-with-aws-outposts/

Personally Identifiable Information (PII) and Personal Health Information (PHI) data are critical to the continued operation of healthcare organizations. Disaster recovery (DR) strategies must ensure that healthcare provider workloads with PII and PHI data operate with near-zero data loss recovery point objective (RPO) and recovery time objective (RTO). In most cases, an organization would typically use a multi-Region active/active strategy for DR to achieve this goal.

However, in a country like the UK where there is only one AWS Region available, you can’t use the typical approach to set up a multi-Region DR strategy. Additionally, laws like the UK General Data Protection Regulation (UK GDPR) apply to many businesses and organizations. These data residency requirements protect the privacy of data and workloads by storing and processing data within a particular country or geographic location.

In this post, we show you a use case from a healthcare organization in the UK. This example shows you how to set up a modified multi-Region DR strategy that uses one Region and AWS Outposts to ensure the resiliency of your workload and address data residency requirements. While our use case applies to healthcare, this solution can be applied to any industry where you need a highly available workload that must meet data residency requirements.

Overview of AWS Outposts

With Outposts, you get same reliable, secure, and high-performance infrastructure as AWS Cloud. It also provides services, APIs, tools for automation, deployment pipelines, and security controls.

Outposts are racks (as shown in Figure 1) moved from a Region and placed in your local data center. They are typically connected to a Region using AWS Direct Connect or an AWS VPN. These racks reside in a particular country, state, or municipality for regulatory, contractual, or security reasons. They provide a secondary data store in the same country or geographic area, which can be independent from the Region.

Outposts offers similar AWS infrastructure, AWS services, APIs, and tools to almost any data center, co-location space, or on-premises facility for a consistent integrated experience. They can run in any facility. AWS will deliver, install, and maintain the hardware infrastructure. If you do not want to host Outposts long term, you can migrate your applications to an AWS Local Zone or a Region.

Outpost (open standard 42U rack)

Figure 1. Outpost (open standard 42U rack)

Addressing UK GDPR requirements and maintaining workload RTO/RPO

For our use case, we worked with a healthcare organization in the UK. Their workload presented us with a couple of uncommon requirements. We had to set up a multi-Region DR strategy to comply with UK GDPR data residency requirements for PHI and PII data, and only one Region (eu-west-2 in London) was available.

Implementing a multi-Region DR strategy with AWS Outposts

To maintain business continuity in the event of a disaster, we physically installed an Outposts rack in the customer’s on-premises location in the UK. We selected the Outpost’s parent Region as another Region (Ireland). This way, the Outpost’s control plane stays accessible if the London Region is impacted by an outage.

All customer and workload data is stored locally in the UK in Outposts and provisioned by Amazon Elastic Block Store (Amazon EBS) and Amazon Simple Storage Service (Amazon S3). It is then synced between the workload Region (London Region) and the Outpost.

With the architecture shown in Figure 2, only control plane traffic such as instance health, instance activity (launched, stopped), and the underlying hypervisor system is sent back to the parent Region (Ireland). This information allows us to provide alerts on instance health and capacity and apply patches and updates to the Outpost.

Architecture for a multi-Region setup using a Region and Outpost

Figure 2. Architecture for a multi-Region setup using a Region and Outpost

Meeting data residency requirements

In our architecture, no customer data gets transferred out of the country. Also, through Direct Connect, all IP addressing is private. No public IPs are required.

The data plane path for the Outposts local gateway travels from the Outpost, through the local gateway, and to a private local gateway LAN segment. It then follows a private path back to the AWS service endpoints in the London Region through Direct Connect.

Figure 3 shows how to connect Outposts to a local network:

  • The local network equipment is connected via ports provided in the Outpost’s top of rack (TOR) switches.
  • Virtual interfaces (VIFs) are mapped to VLANs using Link Aggregation Control Protocol (LACP).
  • The new local gateway (LGW) on the Outpost routes traffic to and from the local network using these VIFs.
How to connect Outposts to your local network

Figure 3. How to connect Outposts to your local network

Summary

This post outlines our solution for running mission-critical workloads that need multi-Region environments and have data residency requirements. We showed you how to configure an Outpost to use a control plane in an external Region. This limits workload traffic to the country with the data residency requirement.

Our use case applies to healthcare. However, this solution is widely applicable. It can be used for other industries, such as power and utilities, that have workloads that need a multi-Region DR strategy and must meet data residency requirements. To deploy an Outpost in your facility, follow the steps in Getting Started with AWS Outposts.

Field Notes: Applying Machine Learning to Vegetation Management using Amazon SageMaker

Post Syndicated from Sameer Goel original https://aws.amazon.com/blogs/architecture/field-notes-applying-machine-learning-to-vegetation-management-using-amazon-sagemaker/

This post was co-written by Soheil Moosavi, a data scientist consultant in Accenture Applied Intelligence (AAI) team, and Louis Lim, a manager in Accenture AWS Business Group. 

Virtually every electric customer in the US and Canada has, at one time or another, experienced a sustained electric outage as a direct result of a tree and power line contact. According to the report from Federal Energy Regulatory Commission (FERC.gov), Electric utility companies actively work to mitigate these threats.

Vegetation Management (VM) programs represent one of the largest recurring maintenance expenses for electric utility companies in North America. Utilities and regulators generally agree that keeping trees and vegetation from conflicting with overhead conductors. It is a critical and expensive responsibility of all utility companies concerned about electric service reliability.

Vegetation management such as tree trimming and removal is essential for electricity providers to reduce unwanted outages and be rated with a low System Average Interruption Duration Index (SAIDI) score. Electricity providers are increasingly interested in identifying innovative practices and technologies to mitigate outages, streamline vegetation management activities, and maintain acceptable SAIDI scores. With the recent democratization of machine learning leveraging the power of cloud, utility companies are identifying unique ways to solve complex business problems on top of AWS. The Accenture AWS Business Group, a strategic collaboration by Accenture and AWS, helps customers accelerate their pace of innovation to deliver disruptive products and services. Learning how to machine learn helps enterprises innovate and disrupt unlocking business value.

In this blog post, you learn how Accenture and AWS collaborated to develop a machine learning solution for an electricity provider using Amazon SageMaker.  The goal was to improve vegetation management and optimize program cost.

Overview of solution 

VM is generally performed on a cyclical basis, prioritizing circuits solely based on the number of outages in the previous years. A more sophisticated approach is to use Light Detection and Ranging (LIDAR) and imagery from aircraft and low earth orbit (LEO) satellites with Machine Learning  models, to determine where VM is needed. This provides the information for precise VM plans, but is more expensive due to cost to acquire the LIDAR and imagery data.

In this blog, we show how a machine learning (ML) solution can prioritize circuits based on the impacts of tree-related outages on the coming year’s SAIDI without using imagery data.

We demonstrate how to implement a solution that cross-references, cleans, and transforms time series data from multiple resources. This then creates features and models that predict the number of outages in the coming year, and sorts and prioritizes circuits based on their impact on the coming year’s SAIDI. We show how you use an interactive dashboard designed to browse circuits and the impact of performing VM on SAIDI reduction based on your budget.

Walkthrough

  • Source data is first transferred into an Amazon Simple Storage Service (Amazon S3) bucket from the client’s data center.
  • Next, AWS Glue Crawlers are used to crawl the data from the  source bucket. Glue Jobs were used to cross-reference data files to create features for modeling and data for the dashboards.
  • We used Jupyter Notebooks on Amazon SageMaker to train and evaluate models. The best performing model was saved as a pickle file on Amazon S3 and Glue was used to add the predicted number of outages for each circuit to the data prepared for the dashboards.
  • Lastly, Operations users were granted access to Amazon QuickSight dashboards, sourced data from Athena, to browse the data and graphs, while VM users were additionally granted access to directly edit the data prepared for dashboards, such as the latest VM cost for each circuit.
  • We used Amazon QuickSight to create interactive dashboards for the VM team members to visualize analytics and predictions. These predictions are a list of circuits prioritized based on their impact on SAIDI in the coming year. The solution allows our team to analyze the data and experiment with different models in a rapid cycle.

Modeling

We were provided with 6 years worth of data across 127 circuits. Data included VM (VM work start and end date, number of trees trimmed and removed, costs), asset (pole count, height, and materials, wire count, length, and materials, and meter count and voltage), terrain (elevation, landcover, flooding frequency, wind erodibility, soil erodibility, slope, soil water absorption, and soil loss tolerance from GIS ESRI layers), and outages (outage coordinated, dates, duration, total customer minutes, total customers affected). In addition, we collected weather data from NOAA and DarkSky datasets, including wind, gust, precipitation, temperature.

Starting with 762 records (6 years * 127 circuits) and 226 features, we performed a series of data cleaning and feature engineering tasks including:

  • Dropped sparse, non-variant, and non-relevant features
  • Capped selected outliers based on features’ distributions and percentiles
  • Normalized imbalanced features
  • Imputed missing values
    • Used “0” where missing value meant zero (for example, number of trees removed)
    • Used 3650 (equivalent to 10 years) where missing values are days for VM work (for example, days since previous tree trimming job)
    • Used average of values for each circuit when applicable, and average of values across all circuits for circuits with no existing values (for example, pole mean height)
  • Merged conceptually relevant features
  • Created new features such as ratios (for example, tree trim cost per trim) and combinations(for example, % of land cover for low and medium intensity areas combined)

After further dropping highly correlated features to remove multi-collinearity for our models, we were left with 72 features for model development. The following diagram shows a high-level overview data partitioning and number of outages prediction.

Our best performing model out of Gradient Boosting Trees, Random Forest, and Feed Forward Neural Networks was Elastic Net, with Mean Absolute Error of 6.02 when using a combination of only 10 features. Elastic Net is appropriate for smaller sample for this dataset, good at feature selection, likely to generalize on a new dataset, and consistently showed a lower error rate. Exponential expansion of features showed small improvements in predictions, but we kept the non-expanded version due to better interpretability.

When analyzing the model performance, predictions were more accurate for circuits with lower outage count, and models suffered from under-predicting when the number of outages was high. This is due to having few circuits with a high number of outages for the model to learn from.

The following chart below shows the importance of each feature used in the model. An error of 6.02 means on average we over or under predict six outages for each circuit.

Dashboard

We designed two types of interactive dashboards for the VM team to browse results and predictions. The first set of dashboards show historical or predicted outage counts for each circuit on a geospatial map. Users can further filter circuits based on criteria such as the number of days since VM, as shown in the following screenshot.

The second type of dashboard shows predicted post-VM SAIDI on the y-axis and VM cost on the x-axis. This dashboard is used by the client to determine the reduction in SAIDI based on available VM budget for the year and dispatch the VM crew accordingly. Clients can also upload a list of update VM cost for each circuit, and the graph will automatically readjust.

Conclusion

This solution for Vegetation management demonstrates how we used Amazon SageMaker to train and evaluate machine learning models. Using this solution an Electric Utility can save time and cost, and scale easily to include more circuits within a set VM budget. We demonstrated how a utility can leverage machine learning to predict unwanted outages and also maintain vegetation, without incurring the cost of high-resolution imagery.

Further, to improve these predictions we recommend:

  1. A yearly collection of asset and terrain data (if data is only available for the most recent year, it is impossible for models to learn from each years’ changes),
  2. Collection of VM data per month per location (if current data is collected only at the end of each VM cycle and only per circuit, monthly, and subcircuit modeling is impossible), and
  3. Purchasing LiDAR imagery or tree inventory data to include features such as tree density, height, distance to wires, and more.

Accelerating Innovation with the Accenture AWS Business Group (AABG)

By working with the Accenture AWS Business Group (AABG), you can learn from the resources, technical expertise, and industry knowledge of two leading innovators, helping you accelerate the pace of innovation to deliver disruptive products and services. The AABG helps customers ideate and innovate cloud solutions with customers through rapid prototype development.

Connect with our team at [email protected] to learn and accelerate how to use machine learning in your products and services.


Field Notes provides hands-on technical guidance from AWS Solutions Architects, consultants, and technical account managers, based on their experiences in the field solving real-world business problems for customers.
Soheil

Soheil Moosavi

Soheil Moosavi is a data scientist consultant and part of Accenture Applied Intelligence (AAI) team. He comes with vast experience in Machine Learning and architecting analytical solutions to solve and improve business problems.

Soheil

Soheil Moosavi

Louis Lim is a manager in Accenture AWS Business Group, his team focus on helping enterprises to explore the art of possible through rapid prototyping and cloud-native solution.