Post Syndicated from Nadeem Bulsara original https://aws.amazon.com/blogs/big-data/integrate-scientific-data-management-and-analytics-with-the-next-generation-of-amazon-sagemaker-part-1/
Our customers tell us that scientists are increasingly spending more time managing data-related challenges than focusing on science. The primary reason for this challenge is that scientific data comes in many types and is siloed across systems, groups, and stages, and scientists struggle to efficiently discover, access, share, and analyze datasets across silos. This fragmentation creates lengthy cycles full of manual interventions, leading to inefficiencies. Mapping data sources and negotiating access across silos can take 4–6 weeks, integrating datasets can extend to months, and fully connecting data from source to tooling can take years, if ever achieved. These data challenges reduce lab productivity and slow down scientific innovation, which decrease drug and product pipeline throughput, and ultimately delay time-to-market. The solution lies in breaking down data silos by creating digital environments that help scientists efficiently connect disparate datasets and analytical tools, so they can conduct iterative hypothesis and product testing without technology friction.
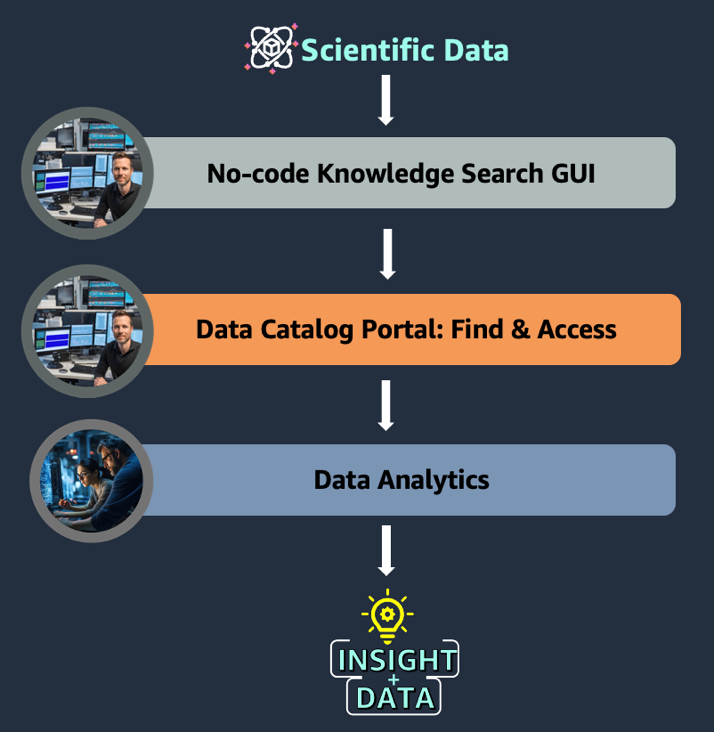
Part 1 of this series shows an example project in drug target identification where two groups of scientists need to collaborate as they integrate no-code knowledge searching, scientific data management, and sophisticated analytics. In this example, a computational biology team begins by mining the scientific literature on a knowledge search GUI. Next, they navigate to a data catalog to find and access relevant datasets, which they share with the data scientist team to run analytics with sophisticated tools (see the following figure). Although the end-to-end journey illustrates the benefits to a target identification example, the underlying data challenges and technology solution apply to any life sciences use case requiring the integration of data management and analytics. Details of the implementation and technical solution will be discussed in Part 2 of the series.
Example use case
A computational biologist has been tasked with identifying a target for Non-Alcoholic Fatty Liver Disease (NAFLD). A typical question from the biologist might be “Can I find genes associated with NAFLD and do we have a patient cohort with variants in those genes?” The solution we designed for this use case involves three simple steps:
- Search the scientific literature through a no-code interface to identify genomic variants associated with NAFLD.
- Search an internal data catalog with natural language:
- Find datasets of interest, such as multi-omics and clinical data for patients associated with NAFLD.
- Request access to the relevant datasets.
- Share relevant datasets with a data scientist collaborator for deeper analysis.
In designing this solution, we focused on the following features:
- Providing no-code scientists with point-and-click and natural-language interfaces
- Reducing silos with data findability, governance automation, and seamless collaboration
- Providing technical personas with the sophisticated tools and environments they prefer
Solution overview
This solution uses the next generation of Amazon SageMaker, including Amazon SageMaker Unified Studio, an integrated data and AI development environment. SageMaker Unified Studio offers capabilities for data processing, SQL analytics, model development, and generative AI application development, built on existing AWS services. The next generation of SageMaker also includes Amazon SageMaker Catalog, which is built on Amazon DataZone, a data management service designed to streamline data discovery, data cataloging, data sharing, and governance. Your organization can have a single secure data hub where everyone in the organization can find, access, and collaborate on data across AWS, on premises, and even third-party sources.
SageMaker Catalog supports certain system asset types, such as tables from Amazon Redshift, tables from AWS Glue, and object collections from Amazon Simple Storage Service (Amazon S3). It also offers the ability to support custom asset types, which gives users flexibility to catalog data that can’t be categorized as a system asset type. For asset type S3ObjectCollectionType, see Implement a custom subscription workflow for unmanaged Amazon S3 assets published with Amazon DataZone. SageMaker Catalog also offers the ability to support custom asset types, which gives users flexibility to catalog data that can’t be categorized as a system asset type. For this example use case, we used AWS HealthOmics variant stores to store and allow querying of genomic variant data. This example lists HealthOmics variant stores as a custom asset type within the catalog. Details of the implementation and technical solution for access management will be discussed in Part 2 of the series.
In the example use case, a computational biologist, in order to identify a target for NAFLD, relies heavily on diverse datasets from multiple sources (genomic sequences, gene expression data, clinical records, and more). This data comes from both internal sources (first-party) and external partners or public databases (third-party). Multiple teams are responsible for collecting and processing this data before making it available to computational biologists, researchers, data scientists, and bioinformaticians within the organization.
In this solution, users (data engineers, data scientists, bioinformaticians, computational biologists) log in to a project-based environment from SageMaker Unified Studio with a preconfigured authentication method. A typical workflow involves the following steps:
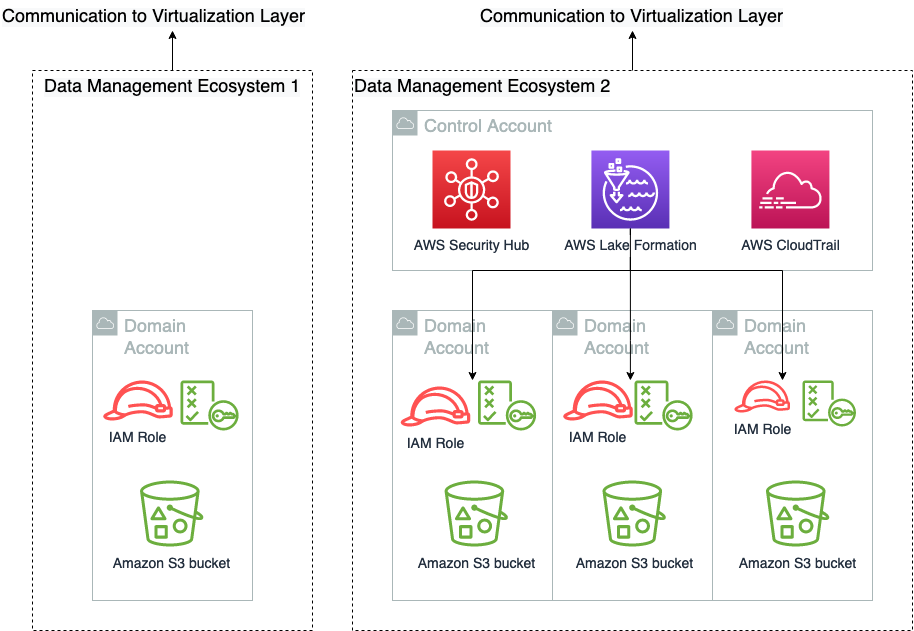
- Data stewards as authorized members of projects publish data assets into the SageMaker catalog.
- Data consumers as authorized members of projects seeking to analyze data for their scientific needs find and discover available data assets of interest from the SageMaker catalog.
- Data consumers request to subscribe to the relevant discovered data assets.
- Data producers review and decide to approve or reject the subscription request.
- Data consumers access and analyze the data using preconfigured tools from SageMaker Unified Studio.
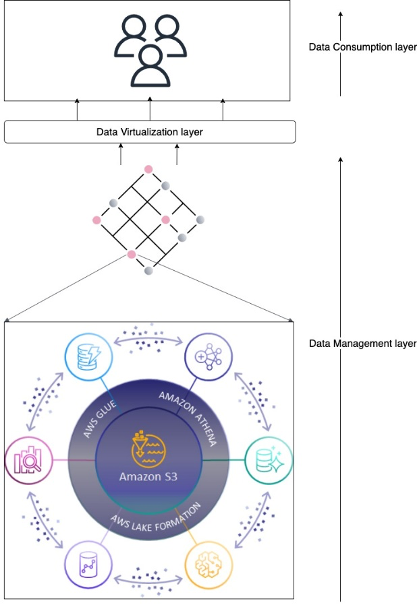
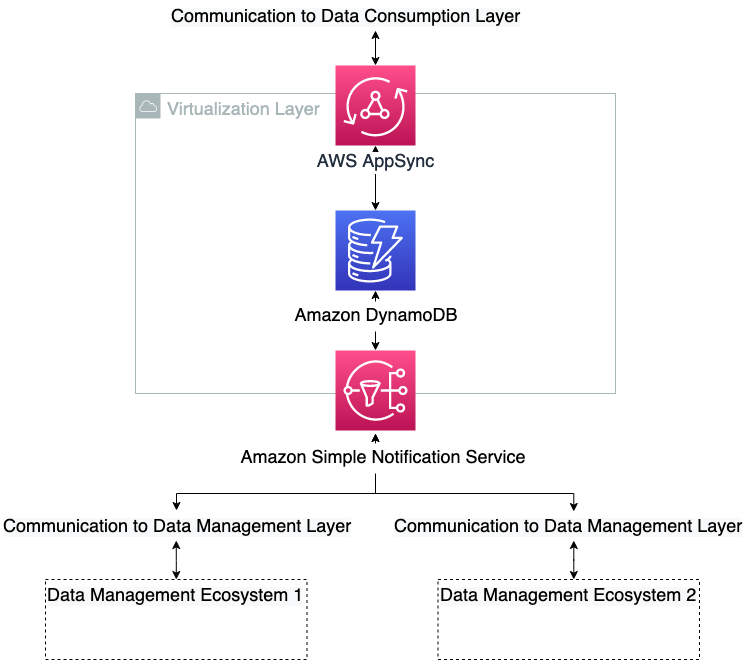
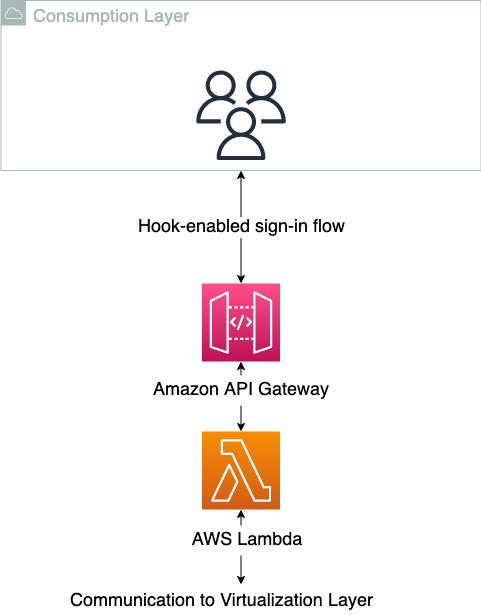
The following diagram illustrates the solution architecture and workflow.
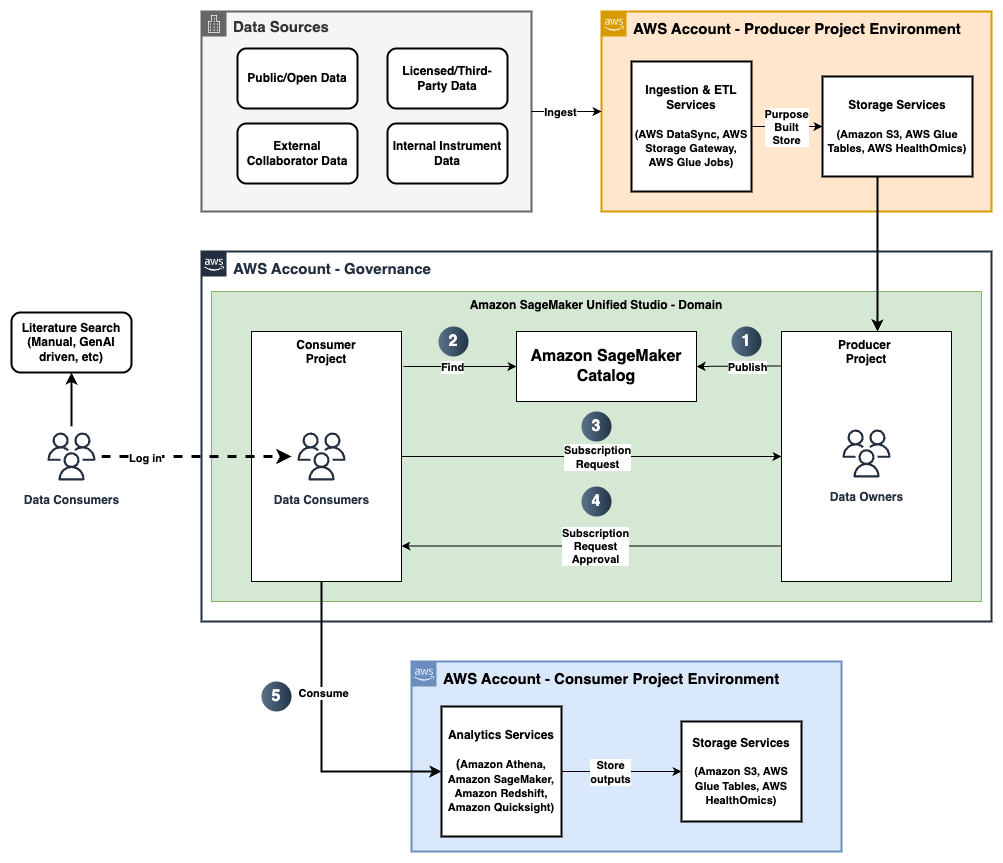
In the following sections, we explore each step of the workflow in more detail.
Step 1: Data producers publish data assets
As shown in the preceding workflow diagram, data producers can use SageMaker Catalog to publish their datasets as data assets or data products with appropriate business (such as source, license, vendor, study identifier), scientific (such as disease name, cohort information, data modality, assay type), or technical (file types, data formats, file sizes) metadata. In our example use case, the data producers publish clinical data as AWS Glue tables and genomic variant data as a table within the HealthOmics variant store. Additionally, data producers can use AI-based recommendations to automatically populate descriptors, making it straightforward for consumers to find and understand its use.
Step 2: Data consumers find relevant datasets
Data consumers, such as data scientists and bioinformaticians, can log in to SageMaker Unified Studio and navigate to SageMaker Catalog to search for the appropriate data assets and products, such as “NAFLD Variants” or “NAFLD Clinical.” They can also find data assets or products using metadata filters such as study identifiers or disease names to discover the possible datasets associated with a study or disease.
Step 3: Data consumers subscribe to required data assets or products
After the data consumers see a data asset or data product of interest (for example, the clinical and genomics data for NAFLD), they can subscribe to them. Data consumers can also optionally include a comment in the subscription request to add more context to the request. This initiates the subscription workflow based on the asset type.
Step 4: Data producers review and approve the subscription request
Data producers get notified of subscription requests and review if access should be granted and approve accordingly. The response can optionally include a comment for reasoning and traceability. In addition, data producers can limit access to certain rows and columns to protect controlled data.
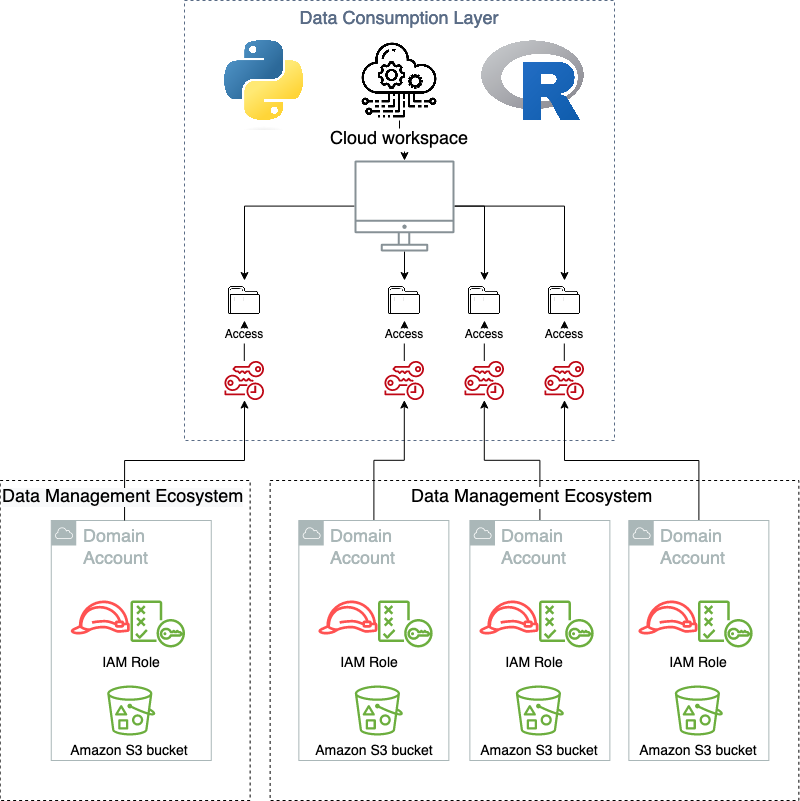
Step 5: Data consumers access the subscribed data assets or products
Upon approval from the data producer, the data consumer gets access to those data assets and can use them in the appropriate environments configured within their project. For example, data scientists can open a workspace with a JupyterLab notebook already available within SageMaker Unified Studio. Subsequently, the data scientist can start analyzing the tabular clinical and variant data that was just approved for access.
Conclusion
The next generation of SageMaker transforms how scientists work with data by creating an integrated data and analytics environment. In this unified environment, data producers are empowered to publish datasets with rich metadata. Data consumers are able to use the catalog within SageMaker Unified Studio to search for their required datasets, either using free text or using metadata and business glossary filters. Data consumers can subscribe to data securely, tap into powerful search capabilities using free text or metadata filters, and access essential analysis tools (Amazon Athena, JupyterLab IDE, Amazon EMR) directly. The result is a unified digital workspace that reduces communication bottlenecks, speeds up scientific cycles, and removes technical barriers. Scientists can now focus on what matters most—testing hypotheses and products, and scaling scientific innovation to production—within a unified, powerful platform. This streamlined approach accelerates data-driven science, enabling research institutions, pharmaceutical companies, and clinical laboratories to innovate more efficiently. For example, data scientists can launch a space with a JupyterLab notebook preinstalled.
Consider using the next generation of SageMaker to increase productivity within your organization. Contact your account representatives or an AWS Representative to learn how we can help accelerate your projects and your business.
About the authors
 Nadeem Bulsara is a Principal Solutions Architect at AWS specializing in Genomics and Life Sciences. He brings his 13+ years of Bioinformatics, Software Engineering, and Cloud Development skills as well as experience in research and clinical genomics and multi-omics to help Healthcare and Life Sciences organizations globally. He is motivated by the industry’s mission to enable people to have a long and healthy life.
 Chaitanya Vejendla is a Senior Solutions Architect specialized in DataLake & Analytics primarily working for Healthcare and Life Sciences industry division at AWS. Chaitanya is responsible for helping life sciences organizations and healthcare companies in developing modern data strategies, deploy data governance and analytical applications, electronic medical records, devices, and AI/ML-based applications, while educating customers about how to build secure, scalable, and cost-effective AWS solutions. His expertise spans across data analytics, data governance, AI, ML, big data, and healthcare-related technologies.
 Dr. Mileidy Giraldo has over 20 years of experience bridging bioinformatics, research, and industry technology strategy. She specializes in making technology accessible for organizations in the life sciences sector. In her current role as WW Lead for Life Sciences Strategy and Lab of the Future at AWS, she helps biotechs, biopharma, and diagnostics organizations design Data & AI-driven initiatives that modernize labs and help scientists unlock the full value of their data.
 Chris Clark is a Senior Solutions Architect focused on helping Life Science customers leverage AWS technology to advance their operational capabilities. With 20+ years of hands-on experience in life sciences manufacturing and supply chain, he combines deep industry knowledge with his AWS expertise to guide his customers. When he’s not working to solve customer challenges, he enjoys cycling and building and repairing things in his workshop.
 Nick Furr is a Specialist Solutions Architect at AWS, supporting Data & Analytics for Healthcare and Life Sciences. He helps providers, payers, and life sciences organizations build secure, scalable data platforms to drive innovation and improve outcomes. His work focuses on modernizing data strategies through cloud analytics, governed data processing, and machine learning for use cases like clinical research and population health.
 Subrat Das is a Principal Solutions Architect for Global Healthcare and Life Sciences accounts at AWS. He is passionate about modernizing and architecting complex customers workloads. When he’s not working on technology solutions, he enjoys long hikes and traveling around the world.


 Momota Sasaki is an Engineering Manager at DeSC Healthcare, a subsidiary of DeNA. He joined DeNA in 2021 and was seconded to DeSC Healthcare. Since then, he has been consistently involved in the healthcare business, leading and promoting the development and operation of the data platform.
 Kaito Tawara is a Data Engineer at DeSC Healthcare, a subsidiary of DeNA, focusing on improving healthcare data platforms. After gaining experience in backend development for web systems and data science, he transitioned to data engineering. He joined DeNA in 2023 and was seconded to DeSC Healthcare. Currently, he works remotely from Nagoya-city, contributing to the enhancement of healthcare data platforms.
 Shota Sato is an Analytics Specialist Solution Architect at AWS Japan, focusing on data analytics solutions powered by AWS for digital native business customers.


 Now that you know how to flatten JSON data, you can analyze it further. Use the following query to get the number of minutes a patient has been physically active per day, based on their heart rate (greater than 80):
 Saeed Barghi is a Sr. Analytics Specialist Solutions Architect specializing in architecting enterprise data platforms. He has extensive experience in the fields of data warehousing, data engineering, data lakes, and AI/ML. Based in Melbourne, Australia, Saeed works with public sector customers in Australia and New Zealand.
 Satesh Sonti is a Sr. Analytics Specialist Solutions Architect based out of Atlanta, specialized in building enterprise data platforms, data warehousing, and analytics solutions. He has over 17 years of experience in building data assets and leading complex data platform programs for banking and insurance clients across the globe.


 Gokhul Srinivasan is a Senior Partner Solutions Architect leading AWS Healthcare and Life Sciences (HCLS) Global Startup Partners. Gokhul has over 19 years of Healthcare experience helping organizations with digital transformation, platform modernization, and deliver business outcomes.
 Laks Sundararajan is a seasoned Enterprise Architect helping companies reset, transform and modernize their IT, digital, cloud, data and insight strategies. A proven leader with significant expertise around Generative AI, Digital, Cloud and Data/Analytics Transformation, Laks is a Sr. Solutions Architect with Healthcare and Life Sciences (HCLS).
 Anil Chinnam is a Solutions Architect in the Digital Native Business Segment at Amazon Web Services(AWS). He enjoys working with customers to understand their challenges and solve them by creating innovative solutions using AWS services. Outside of work, Anil enjoys being a father, swimming and traveling.


 Hari Thatavarthy is a Senior Solutions Architect on the AWS Data Lab team. He helps customers design and build solutions in the data and analytics space. He believes in data democratization and loves to solve complex data processing-related problems. In his spare time, he loves to play table tennis.
 Krishna Maddileti is a Senior Solutions Architect on the AWS Data Lab team. He partners with customers on their AWS journey and helps them with data engineering, data lakes, and analytics. In his spare time, he enjoys spending time with his family and playing video games with his 7-year-old.
 Yadukishore Tatavarthi is a Senior Partner Solutions Architect at AWS. He works closely with global system integrator partners to enable and support customers moving their workloads to AWS.
 Manish Kola is a Solutions Architect on the AWS Data Lab team. He partners with customers on their AWS journey.
 Noritaka Sekiyama is a Principal Big Data Architect on the AWS Glue team. He is responsible for building software artifacts to help customers. In his spare time, he enjoys cycling with his new road bike.


 You might learn in high school biology class that the human genome is composed of over three billion letters of code using adenine (A), guanine (G), cytosine (C), and thymine (T) paired in the deoxyribonucleic acid (DNA). The human genome acts as the biological blueprint of every human cell. And that’s only the foundation for what makes us human.