At Grab, we continuously enhance our systems to improve scalability, reliability and cost-efficiency. Recently, we undertook a project to split the read and write functionalities of one of our backend services into separate services. This was motivated by the need to independently scale these operations based on their distinct scalability requirements.
In this post, we will dive deep into how we migrated the stream processing (write) functionality to a new service with zero data loss and duplication. This was accomplished while handling a high volume of real-time traffic averaging 20,000 reads per second from 16 source Kafka streams writing to other output streams and several DynamoDB tables.
Migration challenges and strategy
Migrating the stream processing to the new service while ensuring zero data loss and duplication posed some interesting challenges, especially given the high volume of real-time data. We needed a strategy that would enable us to:
Migrate streams one by one gradually.
Validate the new service’s processing in production before fully switching over.
Perform the switchover with no downtime or data inconsistencies.
We considered various options for the switchover such as using feature flags via our unified config management and experimental rollout platform. However, these approaches had some limitations:
There could be some data loss or duplication during the deployment time when toggling the flags, which can be up to a few minutes.
There might be data inconsistencies as the flag value could be updated on the services (the existing and and the new one) at slightly different times.
Ultimately, we decided on a custom time-based switchover logic implemented in shared code between the two services leveraging our monorepo structure. In the following sections, we will walk you through the steps we took to achieve this seamless migration.
Step 1: Preparation
First, since both the existing and new services reside in our monorepo, we moved the stream processing code from the existing service to a shared /commons directory. This allowed both the old and new services to import and use the same code. We added logic in this commons package to selectively turn stream processing on or off based on the service processing them.
Next, we created temporary “sink” resources such as streams and DynamoDB tables for the new service to write the processed data. This allowed us to monitor and validate the new service’s behavior in production without impacting the main resources.
Figure 1. For a short period, both services consumed the incoming streams, but only the old service continued to write to the actual sink resources while the new service wrote to validation sink resources.
Step 2: Scheduling the switchover
In the shared /commons code, we added a map[string]time.Time to schedule the switchover for each stream.
When a stream is added to this map, it means it is scheduled for switchover at the specified time. This logic is shared between both services, so the switchover happens simultaneously. The new service starts writing to the main resources while the old service stops, with no overlap or gap.
Step 3: Deployment and monitoring
To perform the switchover, we:
Updated the switchover times for the streams.
Deployed both services with enough buffer time before the scheduled switch.
Closely monitored the process by creating dedicated monitors for the migration process using our observability tools.
Figure 2. This timeseries graph shows the stream received at the old and the new service (dotted line), facilitating real time monitoring of the stream processing volume across both services during the validation period.
The old service continued consuming the streams for a short monitoring period post-switchover, but without writing anywhere, ensuring no loss or duplication at the output sink resources. Then, the stream consumption was removed from the old service altogether, completing the entire migration process.
Results and learnings
Using this time-based approach, we were able to seamlessly migrate the high-volume stream processing to the new service with:
Zero data loss or duplication.
No downtime or production issues.
The whole migration, including the gradual stream-by-stream switchover, was completed in about three weeks.
One learning was that such custom time-based logic, while effective for our use case, has limitations. If a rollback was needed for any of the two services for some unexpected reasons, some data inconsistency would be unavoidable. Generally, such time-based logic should be used with caution as it can lead to unexpected scenarios if the systems fall out of sync. We went ahead with this approach as it was a temporary measure and we had thoroughly tested it before carrying out the switchover.
Join us
Grab is the leading superapp platform in Southeast Asia, providing everyday services that matter to consumers. More than just a ride-hailing and food delivery app, Grab offers a wide range of on-demand services in the region, including mobility, food, package and grocery delivery services, mobile payments, and financial services across 700 cities in eight countries.
Powered by technology and driven by heart, our mission is to drive Southeast Asia forward by creating economic empowerment for everyone. If this mission speaks to you, join our team today!
GrabX serves as Grab’s central platform for product configuration management. GrabX client services read product configurations through an SDK. This SDK reads the configurations in a way that’s eventually consistent, meaning it takes about a minute for any configuration updates to reach the client SDKs.
However, some GrabX SDK clients, particularly those that need to read larger configuration data (~400 MB), reported that the SDK takes an extended amount of time to initialise, approximately four minutes. This blog post details how we analysed and addressed this issue.
SDK Observations
GrabX clients have observed that the GrabX SDK requires several minutes to initialise. This results in what is known as ‘cold starts’, where the SDK takes an extended time to begin supporting the reading of configurations at startup. This challenge highlights the importance of efficient SDK start-up management, especially when a service handling a high volume of incoming traffic initiates new SDK instances to manage the load better. However, due to the extended SDK initialisation time, these instances continue to experience stress, potentially leading to service throttling.
SDK Initialisation Workflow
The SDK initialisation flow described below is based on the improvements we proposed to the SDK design in our previous post. In that post, we suggested enhancing the SDK design by:
A. Implementing service-based data partitioning and storage in the AWS S3 bucket
B. Allowing service-based subscription of data for the SDK
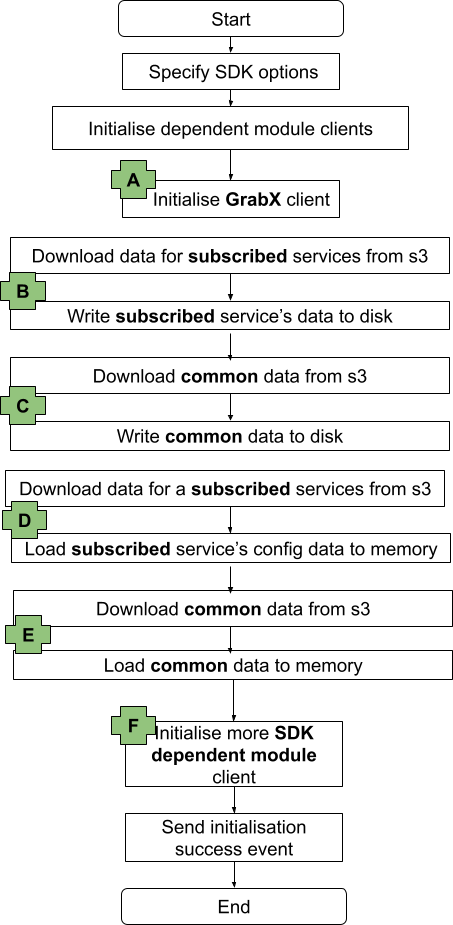
The following diagram provides a high-level overview of the initialisation process of the GrabX SDK, which can be divided into the following sequential steps:
Set options that drive the behaviour of the SDK.
Initialise dependent module clients.
Initialise the GrabX client. (Highlighted as A in the diagram below)
Download data for the SDK’s subscribed list of services from the AWS S3 bucket and store this data on the SDK instance disk. (Highlighted as B in the diagram below)
Download common data needed by the SDK from the AWS S3 bucket and store this data on the SDK instance disk. This data is referred to as ‘common’ because it is required by all different client services. (Highlighted as C in the diagram below)
Download data for the SDK’s subscribed list of services from the AWS S3 bucket and load this data into the SDK instance memory. (Highlighted as D in the diagram below)
Download common data needed by the SDK from the AWS S3 bucket and load this data into the SDK instance memory. (Highlighted as E in the diagram below)
Initialise dependent modules for resolving the configuration value. (Highlighted as F in the diagram below)
Proposed Solution
In order to address the issue of extended SDK initialisation time, we have decided to enhance the SDK initialisation design in multiple phases. Each phase focused on improving a specific part of the workflow.
Improvement Phase 1
As discussed in the previous section, the GrabX SDK needs to load two separate sets of data: the subscribed services data and the common data. These two data sets are currently downloaded from the AWS S3 bucket and sequentially loaded into disk and memory.
In the first phase of our improvement plan, we decided to change the sequential data load to a concurrent data load for these two data sets, as illustrated in the following diagram. This alteration in the SDK initialisation workflow reduced the initialisation time by approximately 80%.
Improvement Phase 2
Building on the progress made in Phase 1, we next turned our attention to the issue of large configuration file sizes. As mentioned in the introduction, the extended SDK initialisation time was particularly noticeable for client services that needed to load larger amounts of data.
In this phase, we decided to implement an SDK design change that allows the SDK to concurrently download data from the AWS S3 bucket and load it into memory for all these large configurations within a subscribed service, as illustrated in the following diagram. This modification to the SDK initialisation workflow further reduced the initialisation time by approximately 6%.
Improvement Phase 3
Upon examining the SDK’s behaviour, we observed that the SDK is both persisting configuration data downloaded from the AWS S3 bucket to disk and loading the data into memory. We understand that the data is loaded into memory to reduce the latency of configuration reads. The data is stored on disk to support a fallback mechanism, which is activated in a very specific use case: when the client SDK instance restarts and there is a connectivity issue with AWS S3 for downloading configuration files. In this scenario, the SDK will read the configuration data stored on disk. However, this data could be outdated as it is not freshly downloaded from the AWS S3 bucket, and most client services require the most recent data.
Therefore, we realised that the fallback mechanism, for which data is persisted on disk, actually conflicts with the desired SDK behaviour for most client services. As a result, we decided to eliminate the SDK initialisation step that downloads configuration data from AWS S3 and persists it on disk. If the SDK initialisation fails to connect to the AWS S3 bucket and download data, client services can then take the necessary action, such as retrying initialisation. This modification further reduced the initialisation time by approximately 50% compared to the improvement achieved in Phase 2.
Conclusion
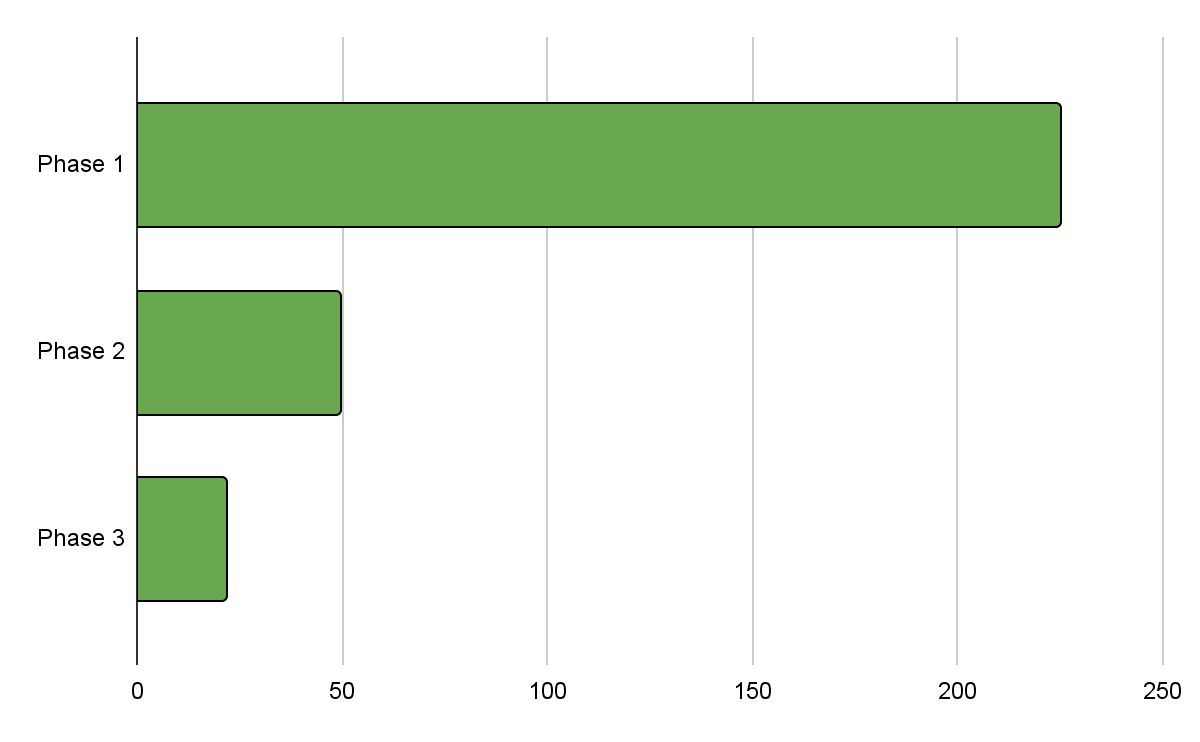
We benchmarked the proposed solution with a variety of services, each having different configuration data sizes. Our findings suggest that the proposed solution has the potential to reduce initialisation time by up to 90%.
The following chart illustrates the phase-wise reduction in initialisation time achieved through the improvements made to the GrabX SDK.
Join us
Grab is the leading superapp platform in Southeast Asia, providing everyday services that matter to consumers. More than just a ride-hailing and food delivery app, Grab offers a wide range of on-demand services in the region, including mobility, food, package and grocery delivery services, mobile payments, and financial services across 700 cities in eight countries.
Powered by technology and driven by heart, our mission is to drive Southeast Asia forward by creating economic empowerment for everyone. If this mission speaks to you, join our team today!
GrabX is Grab’s central platform for product configuration management. It has the capacity to control any component within Grab’s backend systems through configurations that are hosted directly on GrabX.
GrabX clients read these configurations through an SDK, which reads the configurations in a way that’s asynchronous and eventually consistent. As a result, it takes about a minute for any updates to the configurations to reach the client SDKs.
In this article, we discuss our analysis and the steps we took to reduce the peak memory and CPU usage of the SDK.
Observations on potential SDK improvements
Our GrabX clients noticed that the GrabX SDK tended to require high memory and CPU usage. From this, we saw opportunities for further improvements that could:
Optimise the tail latencies of client services.
Enable our clients to use their resources more effectively.
Reduce operation costs and improve the efficiency of using the GrabX SDK.
Accelerate the adoption of GrabX by Grab’s internal services.
SDK design
At a high-level, creating, updating, and serving configuration values via the GrabX SDK involved the following process:
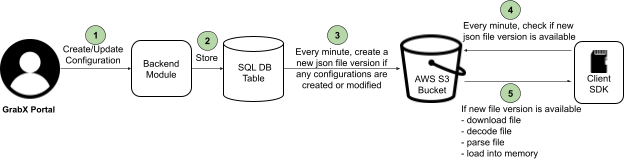
Figure 1. Previous GrabX SDK design.
The process begins when GrabX clients either create or update configurations. This is done through the GrabX web portal or by making an API call.
Once the configurations are created or updated, the GrabX backend module takes over. It stores the new configuration into an SQL database table.
The GrabX backend ensures that the latest configuration data is available to client SDKs.
a. The GrabX backend checks every minute for any newly created or updated configurations.
b. If there are new or updated configurations, GrabX backend creates a new JSON file. This file contains all existing and newly created configurations. It’s important to note that all configurations across all services are stored in a single JSON file.
c. The backend module uploads this newly created JSON file to an AWS S3 bucket.
d. The backend module assigns a version number to the new JSON file and updates a text file in the AWS S3 bucket. This text file stores the latest JSON file version number. The client SDK refers to this version file to check if a newer version of the configuration data is available.
The client SDK performs a check on the version file every minute to determine if a newer version is available. This mechanism is crucial to maintain data consistency across all instances of a service. If any instance fell out of sync, it would be brought back in sync within a minute.
If a new version of the configuration JSON file is available, the client SDK downloads this new file. Following the download, it loads the configuration data into memory. Storing the configuration data in memory reduces the read latency for the configurations.
Areas of improvement for existing SDK design
In this section we outline the areas of improvement we identified within the SDK design.
Service-based data partitioning
We saw an opportunity for service-based data partitioning. The configuration data for all services was consolidated into a single JSON file. Upon studying the data read patterns of client services, we observed that most services primarily needed to access configuration data specific to their own service. However, the present design required storing configuration data for all other services. This resulted in unnecessary memory consumption.
Retaining only new version of configuration in the same file
By using a single JSON file for storing old and new configuration data, we saw a significant increase in the size of the JSON file.
The SDK only needs the full data when it starts; the more common case is that it needs to stay updated with the latest configuration. Even in that scenario, the SDK needed to fetch a complete new JSON file every minute no matter the size of the updates. Consequently, the process of downloading, decoding, and loading high volumes of data at a high frequency (every minute) caused the client SDK to spike in memory and CPU usage.
More efficient JSON decoding
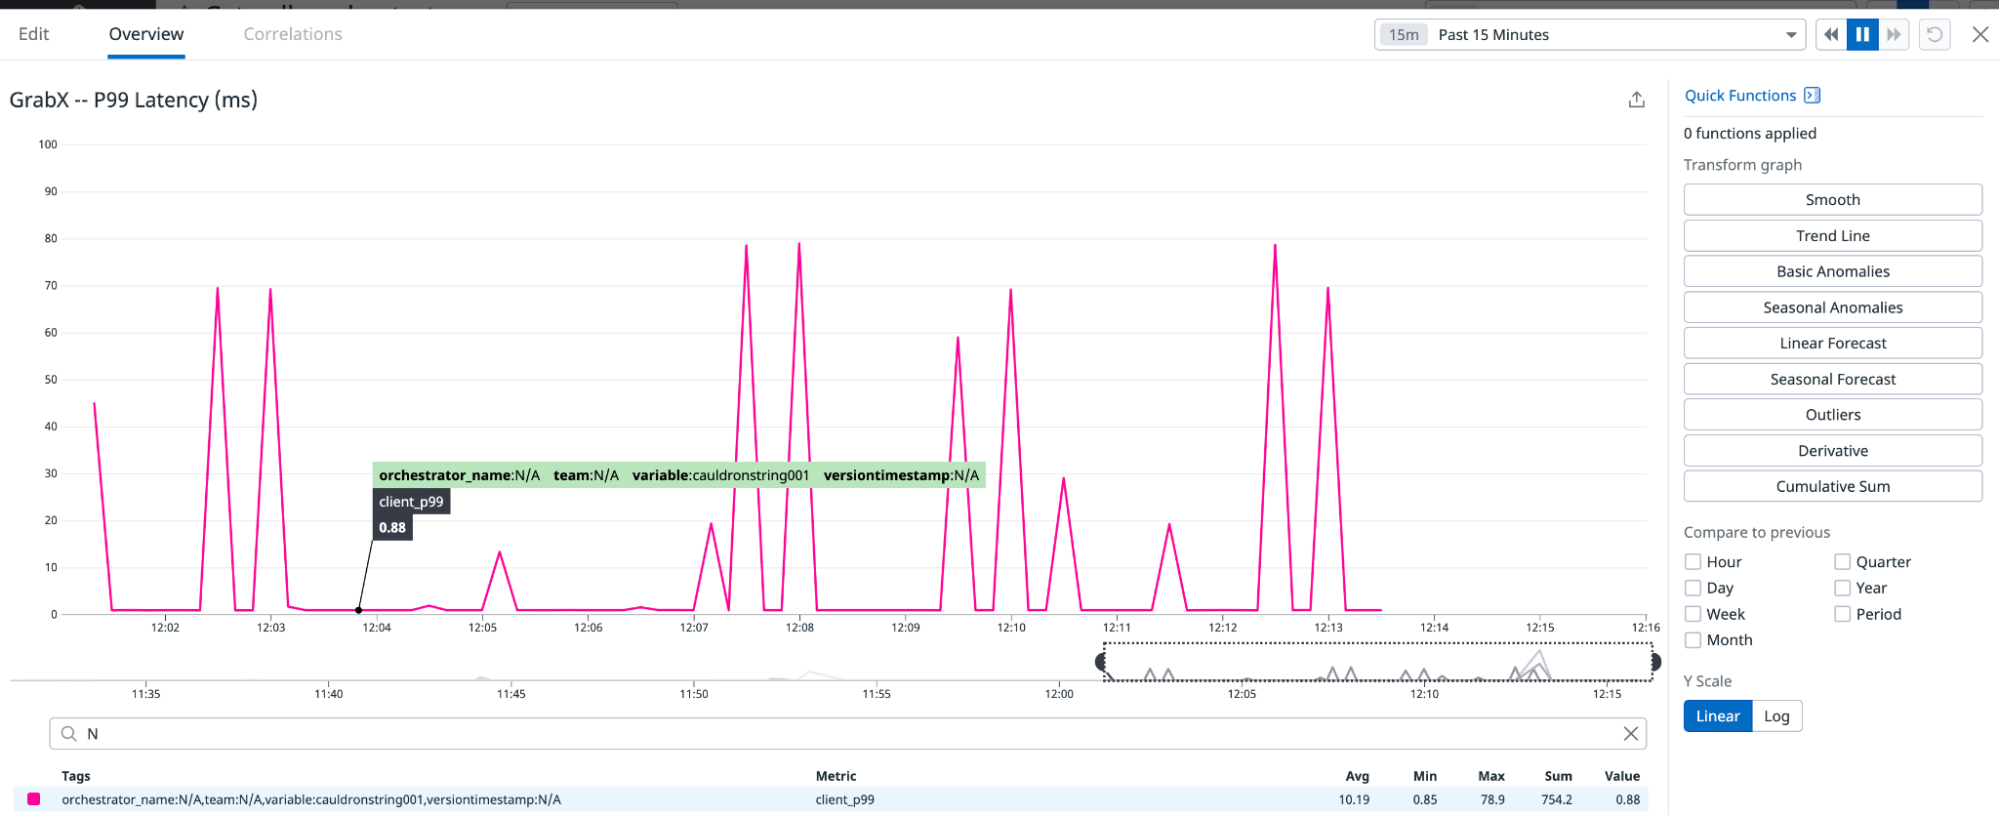
An additional factor which contributed to memory and CPU usage during the decoding phase was the inefficiency of the default JSON decode library to decode this large (>100MB) JSON file. Decoding this JSON file was heavy on available CPU resources, which tended to starve the service of its ability to handle incoming requests. This manifested as increasing the P99 latency of the service.
Figure 2. Graph illustrating the increased P99 latency due to CPU throttling for a service.
Implemented solution
We proposed modifications to the existing SDK design, which we discuss in this section.
Partition data by service
The proposed solution involved partitioning the data based on services. We chose this approach because a single configuration typically belonged to a single service, and most services primarily needed to read configurations that pertained to their own service.
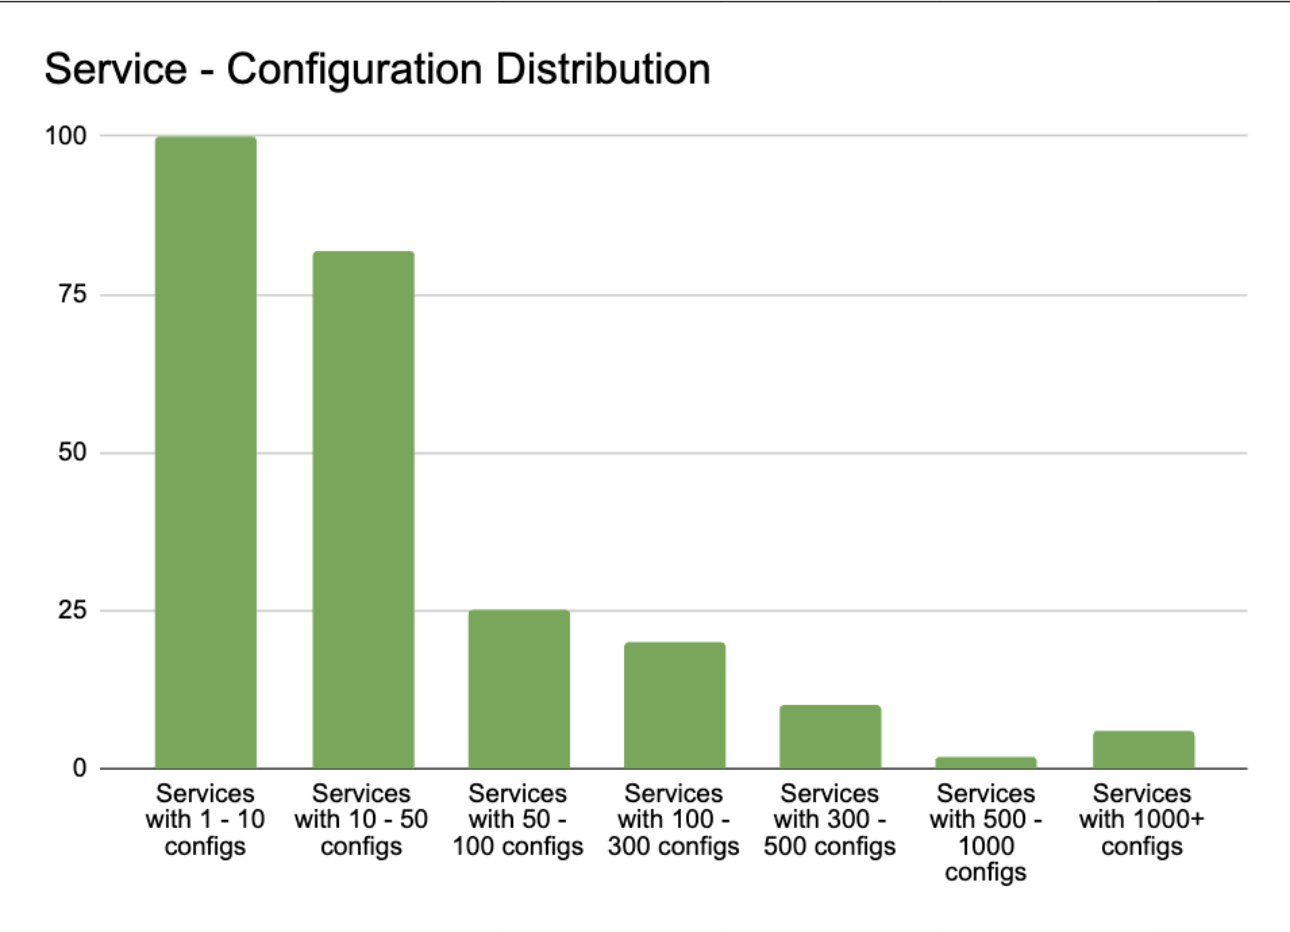
Upon analysing the distribution of service-configuration, we discovered that 98% of client services required less than 1% of the total configuration data. Despite this, they were required to maintain and reload 100% of the configuration data. Furthermore, the service with the largest number of configurations only required 20% of the total configuration data.
Therefore, we proposed a shift towards service-based partitioning of configuration data. This allowed individual client services to access only the data they needed to read.
Figure 3. Graph showing the number of services with varying amounts of configurations.
Create separate JSON files for each configuration
Our proposal also included creating a separate JSON file for each configuration in a service. Previously, all data was stored in a single JSON file housed in an AWS S3 bucket, which supported a maximum of 3,500 write/update requests and 5,500 read requests per second.
By storing each configuration in a separate JSON file, we were able to create a different S3 prefix for each configuration file. These S3 prefixes helped us to maximise S3 throughput by enhancing the read/write performance for each configuration. AWS S3 can handle at least 3,500 PUT/COPY/POST/DELETE requests or 5,500 GET/HEAD requests per second for each partitioned Amazon S3 prefix.
Therefore, with each configuration’s data stored in a separate S3 file with a different prefix, the GrabX platform could achieve a throughput of 5,500 read requests and 3,500 write/update requests per second per configuration. This was beneficial for boosting read/write capacity when needed.
Implement a service-level changelog
We proposed to create a changelog file at the service level. In other words, a changelog file was created for each service. This file was used to keep track of the latest update version, as well as previous service configuration update versions. This file also recorded the configurations which were created or updated in each version. This enables the SDK to accurately identify the configurations that were created or updated in each update version. This was useful to update the specific configurations belonging to a service on the client side.
Implement service-based SDK
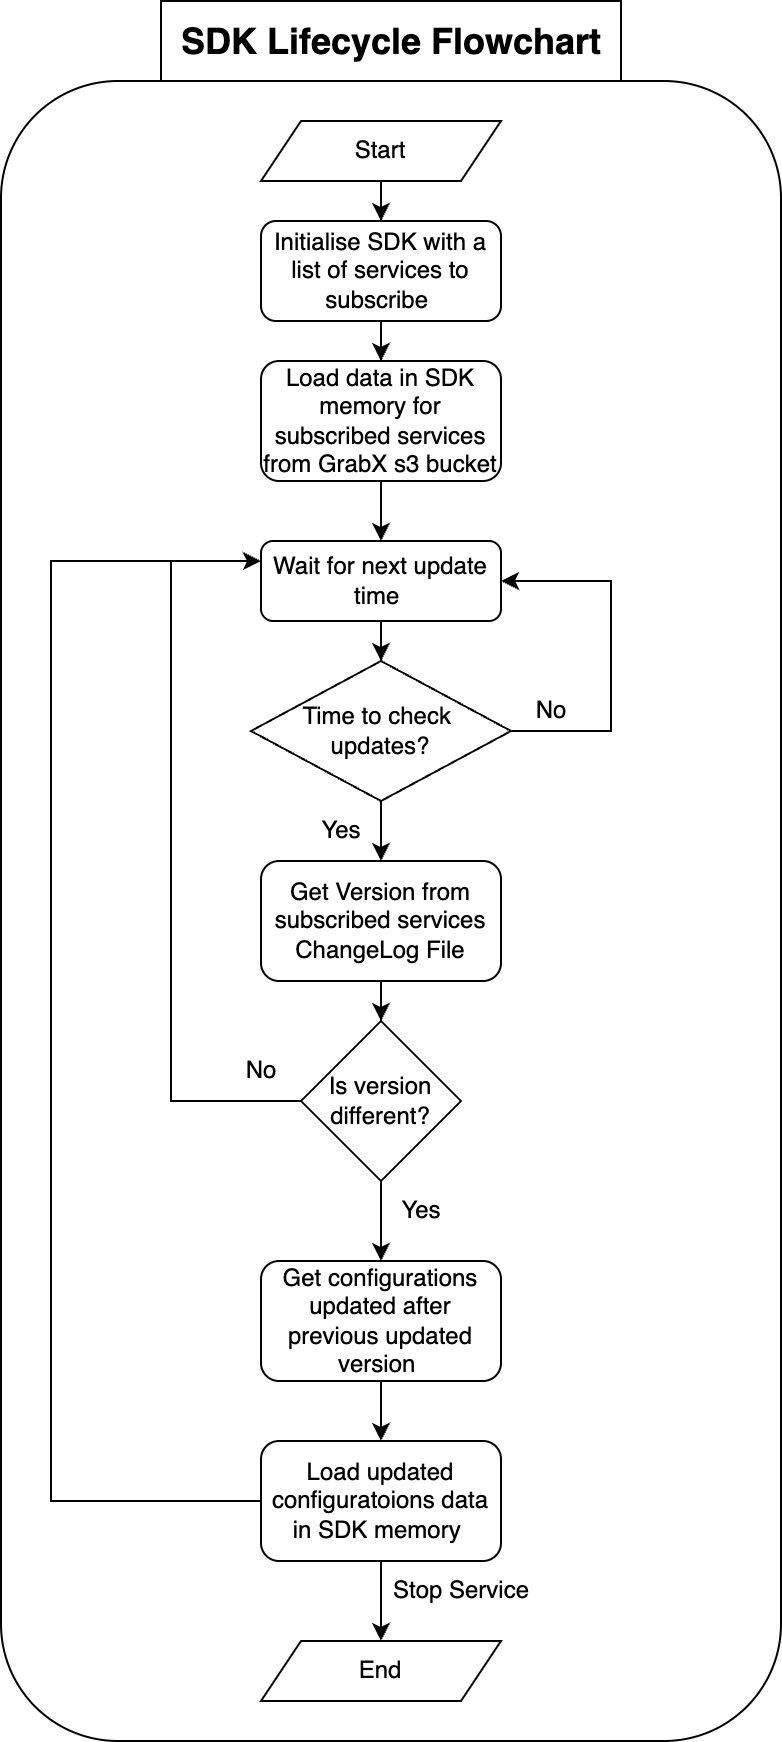
We proposed that SDK client services should be allowed to subscribe to a list of services for which they need to read configuration data. The SDK was initialised with data of the subscribed services and received updates only for configurations corresponding to the subscribed services.
Figure 4. This flowchart shows our proposed service-based SDK implementation.
The SDK only sought updates for the subscribed services. The client SDK needed to read the changelog file for each of the subscribed services, comparing the latest changelog version against the SDK version number. Whenever a newer changelog version was available, the SDK updated the variables with the latest version.
This approach significantly reduced the volume of data that the SDK needed to download, decode, and load into memory during both initialisation and each subsequent update.
Conclusion
In summary, we identified ways to optimise CPU and memory usage in the GrabX SDK. Our analysis revealed that frequent high resource consumption hindered the wider adoption of GrabX. We proposed a series of modifications, including partitioning data by service and creating separate JSON files for each configuration.
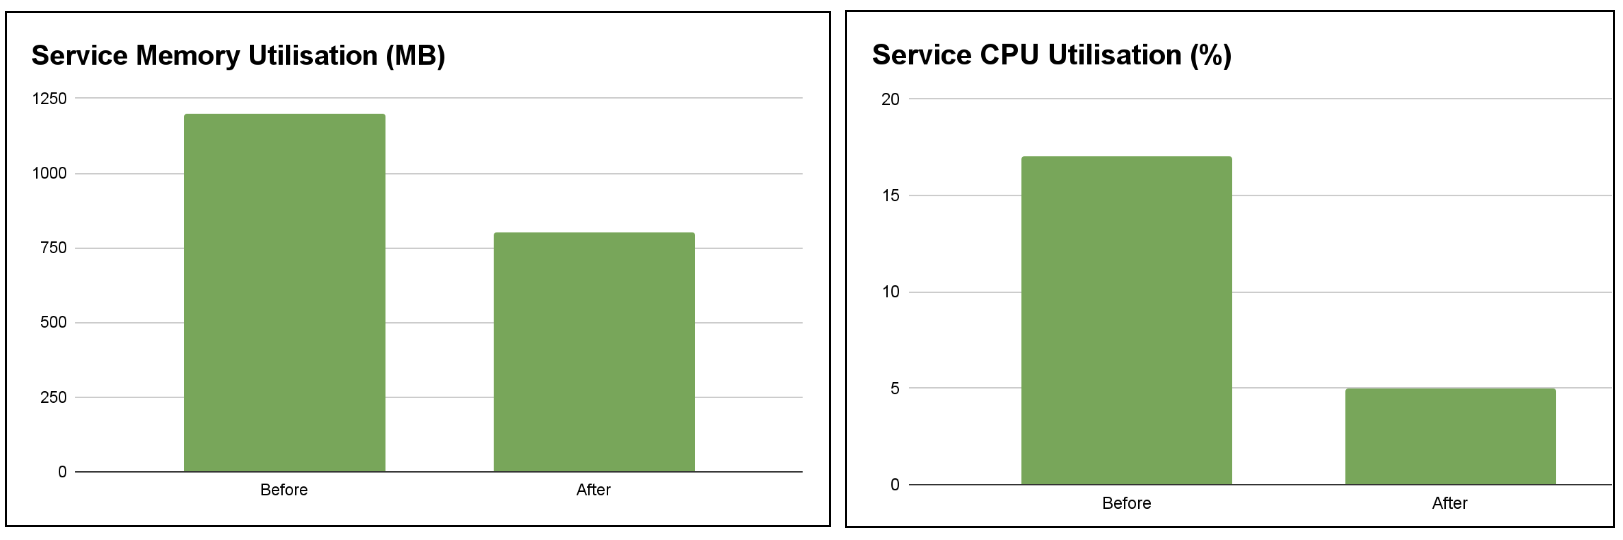
After benchmarking the proposed solution with a variety of configuration data sizes, we found that the solution has the potential to reduce memory utilisation by up to 70% and decrease the maximum CPU utilisation by more than 50%. These improvements significantly enhance the performance and scalability of the GrabX SDK.
Figure 5. Bar charts showcasing memory(MB) & CPU(%) utilisation for Service A before and after using the discussed solution.
Moving forward, we plan to continue optimising the GrabX SDK by exploring additional improvements, such as reducing its initialisation time. These efforts aim to make GrabX an even more robust and reliable solution for product configuration management within Grab’s ecosystem.
Join us
Grab is the leading superapp platform in Southeast Asia, providing everyday services that matter to consumers. More than just a ride-hailing and food delivery app, Grab offers a wide range of on-demand services in the region, including mobility, food, package and grocery delivery services, mobile payments, and financial services across 700 cities in eight countries.
Powered by technology and driven by heart, our mission is to drive Southeast Asia forward by creating economic empowerment for everyone. If this mission speaks to you, join our team today!
In this blog post, we’re excited to present Foundations, our foundational library for Rust services, now released as open source on GitHub. Foundations is a foundational Rust library, designed to help scale programs for distributed, production-grade systems. It enables engineers to concentrate on the core business logic of their services, rather than the intricacies of production operation setups.
Originally developed as part of our Oxy proxy framework, Foundations has evolved to serve a wider range of applications. For those interested in exploring its technical capabilities, we recommend consulting the library’s API documentation. Additionally, this post will cover the motivations behind Foundations’ creation and provide a concise summary of its key features. Stay with us to learn more about how Foundations can support your Rust projects.
What is Foundations?
In software development, seemingly minor tasks can become complex when scaled up. This complexity is particularly evident when comparing the deployment of services on server hardware globally to running a program on a personal laptop.
The key question is: what fundamentally changes when transitioning from a simple laptop-based prototype to a full-fledged service in a production environment? Through our experience in developing numerous services, we’ve identified several critical differences:
Observability: locally, developers have access to various tools for monitoring and debugging. However, these tools are not as accessible or practical when dealing with thousands of software instances running on remote servers.
Configuration: local prototypes often use basic, sometimes hardcoded, configurations. This approach is impractical in production, where changes require a more flexible and dynamic configuration system. Hardcoded settings are cumbersome, and command-line options, while common, don’t always suit complex hierarchical configurations or align with the “Configuration as Code” paradigm.
Security: services in production face a myriad of security challenges, exposed to diverse threats from external sources. Basic security hardening becomes a necessity.
Addressing these distinctions, Foundations emerges as a comprehensive library, offering solutions to these challenges. Derived from our Oxy proxy framework, Foundations brings the tried-and-tested functionality of Oxy to a broader range of Rust-based applications at Cloudflare.
Foundations was developed with these guiding principles:
High modularity: recognizing that many services predate Foundations, we designed it to be modular. Teams can adopt individual components at their own pace, facilitating a smooth transition.
API ergonomics: a top priority for us is user-friendly library interaction. Foundations leverages Rust’s procedural macros to offer an intuitive, well-documented API, aiming for minimal friction in usage.
Simplified setup and configuration: our goal is for engineers to spend minimal time on setup. Foundations is designed to be ‘plug and play’, with essential functions working immediately and adjustable settings for fine-tuning. We understand that this focus on ease of setup over extreme flexibility might be debatable, as it implies a trade-off. Unlike other libraries that cater to a wide range of environments with potentially verbose setup requirements, Foundations is tailored for specific, production-tested environments and workflows. This doesn’t restrict Foundations’ adaptability to other settings, but we approach this with compile-time features to manage setup workflows, rather than a complex setup API.
Next, let’s delve into the components Foundations offers. To better illustrate the functionality that Foundations provides we will refer to the example web server from Foundations’ source code repository.
Telemetry
In any production system, observability, which we refer to as telemetry, plays an essential role. Generally, three primary types of telemetry are adequate for most service needs:
Logging: this involves recording arbitrary textual information, which can be enhanced with tags or structured fields. It’s particularly useful for documenting operational errors that aren’t critical to the service.
Tracing: this method offers a detailed timing breakdown of various service components. It’s invaluable for identifying performance bottlenecks and investigating issues related to timing.
Metrics: these are quantitative data points about the service, crucial for monitoring the overall health and performance of the system.
Foundations integrates an API that encompasses all these telemetry aspects, consolidating them into a unified package for ease of use.
Tracing
Foundations’ tracing API shares similarities with tokio/tracing, employing a comparable approach with implicit context propagation, instrumentation macros, and futures wrapping:
However, Foundations distinguishes itself in a few key ways:
Simplified API: we’ve streamlined the setup process for tracing, aiming for a more minimalistic approach compared to tokio/tracing.
Enhanced trace sampling flexibility: Foundations allows for selective override of the sampling ratio in specific code branches. This feature is particularly useful for detailed performance bug investigations, enabling a balance between global trace sampling for overall performance monitoring and targeted sampling for specific accounts, connections, or requests.
Distributed trace stitching: our API supports the integration of trace data from multiple services, contributing to a comprehensive view of the entire pipeline. This functionality includes fine-tuned control over sampling ratios, allowing upstream services to dictate the sampling of specific traffic flows in downstream services.
Trace forking capability: addressing the challenge of long-lasting connections with numerous multiplexed requests, Foundations introduces trace forking. This feature enables each request within a connection to have its own trace, linked to the parent connection trace. This method significantly simplifies the analysis and improves performance, particularly for connections handling thousands of requests.
We regard telemetry as a vital component of our software, not merely an optional add-on. As such, we believe in rigorous testing of this feature, considering it our primary tool for monitoring software operations. Consequently, Foundations includes an API and user-friendly macros to facilitate the collection and analysis of tracing data within tests, presenting it in a format conducive to assertions.
Logging
Foundations’ logging API shares its foundation with tokio/tracing and slog, but introduces several notable enhancements.
During our work on various services, we recognized the hierarchical nature of logging contextual information. For instance, in a scenario involving a connection, we might want to tag each log record with the connection ID and HTTP protocol version. Additionally, for requests served over this connection, it would be useful to attach the request URL to each log record, while still including connection-specific information.
Typically, achieving this would involve creating a new logger for each request, copying tags from the connection’s logger, and then manually passing this new logger throughout the relevant code. This method, however, is cumbersome, requiring explicit handling and storage of the logger object.
To streamline this process and prevent telemetry from obstructing business logic, we adopted a technique similar to tokio/tracing’s approach for tracing, applying it to logging. This method relies on future instrumentation machinery (tracing-rs documentation has a good explanation of the concept), allowing for implicit passing of the current logger. This enables us to “fork” logs for each request and use this forked log seamlessly within the current code scope, automatically propagating it down the call stack, including through asynchronous function calls:
 let conn_tele_ctx = TelemetryContext::current();

 let on_request = service_fn({
        let endpoint_name = Arc::clone(&endpoint_name);

        move |req| {
            let routes = Arc::clone(&routes);
            let endpoint_name = Arc::clone(&endpoint_name);

            // Each request gets independent log inherited from the connection log and separate
            // trace linked to the connection trace.
            conn_tele_ctx
                .with_forked_log()
                .with_forked_trace("request")
                .apply(async move { respond(endpoint_name, req, routes).await })
        }
});
In an effort to simplify the user experience, we merged all APIs related to context management into a single, implicitly available in each code scope, TelemetryContext object. This integration not only simplifies the process but also lays the groundwork for future advanced features. These features could blend tracing and logging information into a cohesive narrative by cross-referencing each other.
Like tracing, Foundations also offers a user-friendly API for testing service’s logging.
Metrics
Foundations incorporates the official Prometheus Rust client library for its metrics functionality, with a few enhancements for ease of use. One key addition is a procedural macro provided by Foundations, which simplifies the definition of new metrics with typed labels, reducing boilerplate code:
use foundations::telemetry::metrics::{metrics, Counter, Gauge};
use std::sync::Arc;

#[metrics]
pub(crate) mod http_server {
    /// Number of active client connections.
    pub fn active_connections(endpoint_name: &Arc<String>) -> Gauge;

    /// Number of failed client connections.
    pub fn failed_connections_total(endpoint_name: &Arc<String>) -> Counter;

    /// Number of HTTP requests.
    pub fn requests_total(endpoint_name: &Arc<String>) -> Counter;

    /// Number of failed requests.
    pub fn requests_failed_total(endpoint_name: &Arc<String>, status_code: u16) -> Counter;
}
In addition to this, we have refined the approach to metrics collection and structuring. Foundations offers a streamlined, user-friendly API for both these tasks, focusing on simplicity and minimalism.
Memory profiling
Recognizing the efficiency of jemalloc for long-lived services, Foundations includes a feature for enabling jemalloc memory allocation. A notable aspect of jemalloc is its memory profiling capability. Foundations packages this functionality into a straightforward and safe Rust API, making it accessible and easy to integrate.
Telemetry server
Foundations comes equipped with a built-in, customizable telemetry server endpoint. This server automatically handles a range of functions including health checks, metric collection, and memory profiling requests.
Security
A vital component of Foundations is its robust and ergonomic API for seccomp, a Linux kernel feature for syscall sandboxing. This feature enables the setting up of hooks for syscalls used by an application, allowing actions like blocking or logging. Seccomp acts as a formidable line of defense, offering an additional layer of security against threats like arbitrary code execution.
Foundations provides a simple way to define lists of all allowed syscalls, also allowing a composition of multiple lists (in addition, Foundations ships predefined lists for common use cases):
Foundations simplifies the management of service settings and command-line argument parsing. Services built on Foundations typically use YAML files for configuration. We advocate for a design where every service comes with a default configuration that’s functional right off the bat. This philosophy is embedded in Foundations’ settings functionality.
In practice, applications define their settings and defaults using Rust structures and enums. Foundations then transforms Rust documentation comments into configuration annotations. This integration allows the CLI interface to generate a default, fully annotated YAML configuration files. As a result, service users can quickly and easily understand the service settings:
use foundations::settings::collections::Map;
use foundations::settings::net::SocketAddr;
use foundations::settings::settings;
use foundations::telemetry::settings::TelemetrySettings;

#[settings]
pub(crate) struct HttpServerSettings {
    /// Telemetry settings.
    pub(crate) telemetry: TelemetrySettings,
    /// HTTP endpoints configuration.
    #[serde(default = "HttpServerSettings::default_endpoints")]
    pub(crate) endpoints: Map<String, EndpointSettings>,
}

impl HttpServerSettings {
    fn default_endpoints() -> Map<String, EndpointSettings> {
        let mut endpoint = EndpointSettings::default();

        endpoint.routes.insert(
            "/hello".into(),
            ResponseSettings {
                status_code: 200,
                response: "World".into(),
            },
        );

        endpoint.routes.insert(
            "/foo".into(),
            ResponseSettings {
                status_code: 403,
                response: "bar".into(),
            },
        );

        [("Example endpoint".into(), endpoint)]
            .into_iter()
            .collect()
    }
}

#[settings]
pub(crate) struct EndpointSettings {
    /// Address of the endpoint.
    pub(crate) addr: SocketAddr,
    /// Endoint's URL path routes.
    pub(crate) routes: Map<String, ResponseSettings>,
}

#[settings]
pub(crate) struct ResponseSettings {
    /// Status code of the route's response.
    pub(crate) status_code: u16,
    /// Content of the route's response.
    pub(crate) response: String,
}
The settings definition above automatically generates the following default configuration YAML file:
---
# Telemetry settings.
telemetry:
  # Distributed tracing settings
  tracing:
    # Enables tracing.
    enabled: true
    # The address of the Jaeger Thrift (UDP) agent.
    jaeger_tracing_server_addr: "127.0.0.1:6831"
    # Overrides the bind address for the reporter API.
    # By default, the reporter API is only exposed on the loopback
    # interface. This won't work in environments where the
    # Jaeger agent is on another host (for example, Docker).
    # Must have the same address family as `jaeger_tracing_server_addr`.
    jaeger_reporter_bind_addr: ~
    # Sampling ratio.
    #
    # This can be any fractional value between `0.0` and `1.0`.
    # Where `1.0` means "sample everything", and `0.0` means "don't sample anything".
    sampling_ratio: 1.0
  # Logging settings.
  logging:
    # Specifies log output.
    output: terminal
    # The format to use for log messages.
    format: text
    # Set the logging verbosity level.
    verbosity: INFO
    # A list of field keys to redact when emitting logs.
    #
    # This might be useful to hide certain fields in production logs as they may
    # contain sensitive information, but allow them in testing environment.
    redact_keys: []
  # Metrics settings.
  metrics:
    # How the metrics service identifier defined in `ServiceInfo` is used
    # for this service.
    service_name_format: metric_prefix
    # Whether to report optional metrics in the telemetry server.
    report_optional: false
  # Server settings.
  server:
    # Enables telemetry server
    enabled: true
    # Telemetry server address.
    addr: "127.0.0.1:0"
# HTTP endpoints configuration.
endpoints:
  Example endpoint:
    # Address of the endpoint.
    addr: "127.0.0.1:0"
    # Endoint's URL path routes.
    routes:
      /hello:
        # Status code of the route's response.
        status_code: 200
        # Content of the route's response.
        response: World
      /foo:
        # Status code of the route's response.
        status_code: 403
        # Content of the route's response.
        response: bar
Refer to the example web server and documentation for settings and CLI API for more comprehensive examples of how settings can be defined and used with Foundations-provided CLI API.
Wrapping Up
At Cloudflare, we greatly value the contributions of the open source community and are eager to reciprocate by sharing our work. Foundations has been instrumental in reducing our development friction, and we hope it can do the same for others. We welcome external contributions to Foundations, aiming to integrate diverse experiences into the project for the benefit of all.
If you’re interested in working on projects like Foundations, consider joining our team — we’re hiring!
Email is a popular channel for applications, used in both marketing campaigns and other outbound customer communications. The challenge with email is that it can become increasingly complex to manage for companies that must send large quantities of messages per month. This complexity is especially true when companies need to measure detailed email engagement metrics to track campaign success.
As a marketer, you want to monitor several metrics, including open rates, click-through rates, bounce rates, and delivery rates. If you do not track your email results, you could potentially be wasting your campaign resources. Monitoring and interpreting your sending results can help you deliver the best content possible to your subscribers’ inboxes, and it can also ensure that your IP reputation stays high. Mailbox providers prioritize inbox placement for senders that deliver relevant content. As a business professional, tracking your emails can also help you stay on top of hot leads and important clients. For example, if someone has opened your email multiple times in one day, it might be a good idea to send out another follow-up email to touch base.
Building a large-scale email solution is a complex and expensive challenge for any business. You would need to build infrastructure, assemble your network, and warm up your IP addresses. Alternatively, working with some third-party email solutions require contract negotiations and upfront costs.
Fortunately, Amazon Simple Email Service (SES) has a highly scalable and reliable backend infrastructure to reduce the preceding challenges. It has improved content filtering techniques, reputation management features, and a vast array of analytics and reporting functions. These features help email senders reach their audiences and make it easier to manage email channels across applications. Amazon SES also provides API operations to monitor your sending activities through simple API calls. You can publish these events to Amazon CloudWatch, Amazon Kinesis Data Firehose, or by using Amazon Simple Notification Service (SNS).
In this post, you learn how to build and automate a serverless architecture that analyzes email events. We explore how to track important metrics such as open and click rate of the emails.
Solution overview
The metrics that you can measure using Amazon SES are referred to as email sending events. You can use Amazon CloudWatch to retrieve Amazon SES event data. You can also use Amazon SNS to interpret Amazon SES event data. However, in this post, we are going to use Amazon Kinesis Data Firehose to monitor our user sending activity.
Enable Amazon SES configuration sets with open and click metrics and publish email sending events to Amazon Kinesis Data Firehose as JSON records. A Lambda function is used to parse the JSON records and publish the content in the Amazon S3 bucket.
Ingested data lands in an Amazon S3 bucket that we refer to as the raw zone. To make that data available, you have to catalog its schema in the AWS Glue data catalog. You create and run the AWS Glue crawler that crawls your data sources and construct your Data Catalog. The Data Catalog uses pre-built classifiers for many popular source formats and data types, including JSON, CSV, and Parquet.
When the crawler is finished creating the table definition and schema, you analyze the data using Amazon Athena. It is an interactive query service that makes it easy to analyze data in Amazon S3 using SQL. Point to your data in Amazon S3, define the schema, and start querying using standard SQL, with most results delivered in seconds.
Now you can build visualizations, perform ad hoc analysis, and quickly get business insights from the Amazon SES event data using Amazon QuickSight. You can easily run SQL queries using Amazon Athena on data stored in Amazon S3, and build business dashboards within Amazon QuickSight.
Deploying the architecture:
Configuring Amazon Kinesis Data Firehose to write to Amazon S3:
Navigate to the Amazon Kinesis in the AWS Management Console. Choose Kinesis Data Firehose and create a delivery stream.
Enter delivery stream name as “SES_Firehose_Demo”.
Under the source category, select “Direct Put or other sources”.
On the next page, make sure to enable Data Transformation of source records with AWS Lambda. We use AWS Lambda to parse the notification contents that we only process the required information as per the use case.
Click the “Create New” Lambda function.
Click on “General Kinesis Data FirehoseProcessing” Lambda blueprint and this opens up the Lambda console. Enter following values in Lambda
Name: SES-Firehose-Json-Parser
Execution role: Create a new role with basic Lambda permissions.
Click “Create Function”. Now replace the Lambda code with the following provided code and save the function.
For this blog, we are only filtering out three fields i.e. Eventname, destination_Email, and SourceIP. If you want to store other parameters you can modify your code accordingly. For the list of information that we receive in notifications, you may check out the following document.
You may utilize the above values in the Amazon S3 prefix and error prefix. If you use your own prefixes make sure to accordingly update the target values in AWS Glue which you will see in further process.
Keep the Amazon S3 backup option disabled and click “Next”.
On the next page, under the Permissions section, select create a new role. This opens up a new tab and then click “Allow” to create the role.
Navigate back to the Amazon Kinesis Data Firehose console and click “Next”.
Review the changes and click on “Create delivery stream”.
Configure Amazon SES to publish event data to Kinesis Data Firehose:
Navigate to Amazon SES console and select “Email Addresses” from the left side.
Click on “Verify a New Email Address” on the top. Enter your email address to which you send a test email.
Go to your email inbox and click on the verify link. Navigate back to the Amazon SES console and you will see verified status on the email address provided.
Open the Amazon SES console and select Configuration set from the left side.
Create a new configuration set. Enter “SES_Firehose_Demo” as the configuration set name and click “Create”.
Choose Kinesis Data Firehose as the destination and provide the following details.
Name: OpenClick
Event Types: Open and Click
In the IAM Role field, select ‘Let SES make a new role’. This allows SES to create a new role and add sufficient permissions for this use case in that role.
Click “Save”.
Sending a Test email:
Navigate to Amazon SES console, click on “Email Addresses” on the left side.
Select your verified email address and click on “Send a Test email”.
Make sure you select the raw email format. You may use the following format to send out a test email from the console. Make sure you send out this email to a recipient inbox to which you have the access.
X-SES-CONFIGURATION-SET: SES_Firehose_Demo
X-SES-MESSAGE-TAGS: Email=NULL
From: [email protected]
To: [email protected]
Subject: Test email
Content-Type: multipart/alternative;
    		boundary="----=_boundary"

------=_boundary
Content-Type: text/html; charset=UTF-8
Content-Transfer-Encoding: 7bit
This is a test email.

<a href="https://aws.amazon.com/">Amazon Web Services</a>
------=_boundary
Once the email is received in the recipient’s inbox, open the email and click the link present in the same. This generates a click and open event and send the response back to SES.
Creating Glue Crawler:
Navigate to the AWS Glue console, select “crawler” from the left side, and then click on “Add crawler” on the top.
Enter the crawler name as “SES_Firehose_Crawler” and click “Next”.
Under Crawler source type, select “Data stores” and click “Next”.
Select Amazon S3 as the data source and prove the required path. Include the path until the “fhbase” folder.
Select “no” under Add another data source section.
In the IAM role, select the option to ‘Create an IAM role’. Enter the name as “SES_Firehose-Crawler”. This provides the necessary permissions automatically to the newly created role.
In the frequency section, select run on demand and click “Next”. You may choose this value as per your use case.
Click on add Database and provide the name as “ses_firehose_glue_db”. Click on create and then click “Next”.
Review your Glue crawler setting and click on “Finish”.
Run the above-created crawler. This crawls the data from the specified Amazon S3 bucket and create a catalog and table definition.
Now navigate to “tables” on the left, and verify a “fhbase” table is created after you run the crawler.
If you want to analyze the data stored until now, you can use Amazon Athena and test the queries. If not, you can move to the Amazon Quicksight directly.
Analyzing the data using Amazon Athena:
Open Athena console and select the database, which is created using AWS Glue
Click on “setup a query result location in Amazon S3” as shown in the following screenshot.
Navigate to the Amazon S3 bucket created in earlier steps and create a folder called “AthenaQueryResult”. We store our Athena query result in this bucket.
Now navigate back to Amazon Athena and select the Amazon S3 bucket with the folder location as shown in the following screenshot and click “Save”.
Run the following query to test the sample output and accordingly modify your SQL query to get the desired output.
Select * from “ses_firehose_glue_db”.”fhbase”
Note: If you want to track the opened emails by unique Ip addresses then you can modify your SQL query accordingly. This is because every time an email gets opened, you will receive a notification even if the same email was previously opened.
Visualizing the data in Amazon QuickSight dashboards:
Now, let’s analyze this data using Amazon Athena via Amazon Quicksight.
Log into Amazon Quicksight and choose Manage data, New dataset. Choose Amazon Athena as a new data source.
Enter the data source name as “SES-Demo” and click on “Create the data source”.
Select your database from the drop-down as “ses_firehose_glue_db” and table “fhbase” that you have created in AWS Glue.
And add a custom SQL based on your use case and click on “Confirm query”. Refer to the example below.
You can perform ad hoc analysis and modify your query according to your business needs as shown in the following image. Click “Save & Visualize”.
You can now visualize your event data on Amazon Quicksight dashboard. You can use various graphs to represent your data. For this demo, the default graph is used and two fields are selected to populate on the graph, as shown below.
Conclusion:
This architecture shows how to track your email sending activity at a granular level. You set up Amazon SES to publish event data to Amazon Kinesis Data Firehose based on fine-grained email characteristics that you define. You can also track several types of email sending events, including sends, deliveries, bounces, complaints, rejections, rendering failures, and delivery delays. This information can be useful for operational and analytical purposes.
Chirag Oswal is a solutions architect and AR/VR specialist working with the public sector India. He works with AWS customers to help them adopt the cloud operating model on a large scale.
Apoorv Gakhar is a Cloud Support Engineer and an Amazon SES Expert. He is working with AWS to help the customers integrate their applications with various AWS Services.
To provide the best experiences, we use technologies like cookies to store and/or access device information. Consenting to these technologies will allow us to process data such as browsing behavior or unique IDs on this site. Not consenting or withdrawing consent, may adversely affect certain features and functions.
Functional
Always active
The technical storage or access is strictly necessary for the legitimate purpose of enabling the use of a specific service explicitly requested by the subscriber or user, or for the sole purpose of carrying out the transmission of a communication over an electronic communications network.
Preferences
The technical storage or access is necessary for the legitimate purpose of storing preferences that are not requested by the subscriber or user.
Statistics
The technical storage or access that is used exclusively for statistical purposes.The technical storage or access that is used exclusively for anonymous statistical purposes. Without a subpoena, voluntary compliance on the part of your Internet Service Provider, or additional records from a third party, information stored or retrieved for this purpose alone cannot usually be used to identify you.
Marketing
The technical storage or access is required to create user profiles to send advertising, or to track the user on a website or across several websites for similar marketing purposes.