Today, AWS Lambda is promoting Rust support from Experimental to Generally Available. This means you can now use Rust to build business-critical serverless applications, backed by AWS Support and the Lambda availability SLA.
Rust is a popular programming language due to its combination of high performance, memory safety, and developer experience. It offers speed and memory utilization efficiency comparable with C++, together with the reliability normally associated with higher-level languages.
This post shows you how to build and deploy Rust-based Lambda functions using Cargo Lambda, a third-party open source tool for working with Lambda functions in Rust. We’ll also cover how to deploy your functions using the Cargo Lambda AWS Cloud Development Kit (AWS CDK) construct.
Rust installed on your development machine (version 1.70 or later)
Node.js 20 or later (for AWS CDK deployment)
AWS CDK installed: npm install -g aws-cdk
Solution overview
This post takes you through the following steps:
Install and configure Cargo Lambda.
Create and deploy a basic HTTP Lambda function using Cargo Lambda.
Build a complete serverless API using AWS CDK with Rust Lambda functions.
Install and configure Cargo Lambda
Cargo is the package manager and build system for Rust. Cargo Lambda is a third-party open source extension to the cargo command-line tool that simplifies building and deploying Rust Lambda functions.
To install Cargo Lambda on Linux systems, run:
curl -fsSL https://cargo-lambda.info/install.sh | sh
main.rs – The function entry point where you configure dependencies and shared state
http_handler.rs – The primary function logic
The main.rs file contains the following code:
use lambda_http::{run, service_fn, tracing, Error};
mod http_handler;
use http_handler::function_handler;
#[tokio::main]
async fn main() -> Result<(), Error> {
tracing::init_default_subscriber();
run(service_fn(function_handler)).await
}
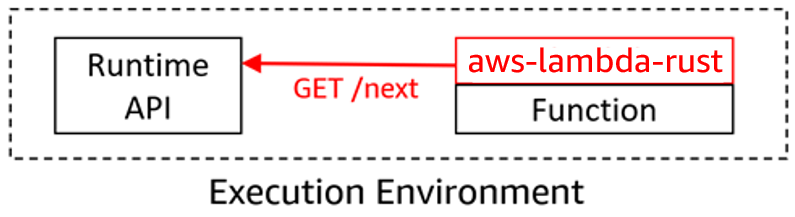
The key part of the main.rs file is run(service_fn(function_handler)).await. The run function is part of the http_lambda crate and starts the Lambda Rust runtime interface client (RIC), which actively polls for events from the Lambda Runtime API. The function_handler is the function that is defined in the http_handler.rs file. When the Runtime API returns the invoke event, the RIC calls the function_handler from http_handler.rs:
use lambda_http::{Body, Error, Request, RequestExt, Response};
pub(crate) async fn function_handler(event: Request) -> Result<Response, Error> {
// Extract some useful information from the request
let who = event
.query_string_parameters_ref()
.and_then(|params| params.first("name"))
.unwrap_or("world");
let message = format!("Hello {who}, this is an AWS Lambda HTTP request");
// Return something that implements IntoResponse.
// It will be serialized to the right response event automatically by the runtime

let resp = Response::builder()
    .status(200)
    .header("content-type", "text/html")
    .body(message.into())
    .map_err(Box::new)?;
Ok(resp)

}
The function_handler function signature includes a variable event of type Request. The event contents depend on the service triggering the function. For example, it may contain HTTP request information such as path parameters if the request is coming via HTTP, or even an array of Amazon Kinesis stream records.
For non-HTTP functions, events can be strongly typed. Additionally, you can accept any structure as input as long as it implements serde::Serialize and serde::Deserialize.
The example parses query parameters and looks for the first parameter that has the name name.
The lambda_http crate provides an idiomatic way to return a response, using a builder pattern. The function returns a response as a Result with an Ok() which is what the run function in main.rs expects.
Logging
The main.rs file includes the following line by default:
tracing::init_default_subscriber();
The Rust Lambda runtime integrates natively with Tracing libraries for logging and tracing, and supports JSON structured logging. When setting this line and the RUST_LOG environment variable, Lambda sends logs to Amazon CloudWatch. By default, the INFO log level is enabled.
To write logs, use the tracing crate and send events using the following syntax:
tracing::info("This is a log entry");
Building
To build the Lambda function, use cargo lambda build. When compiling the Lambda function, the AWS Lambda Runtime is built into your binary. The compiled binary file is called bootstrap. It is packaged in the function artifact .zip file and visible as a file in the AWS Lambda console.
When Lambda executes this binary, it starts an infinite loop (the Run function). This polls the Lambda Runtime API to receive the invoke request and then calls your handler, the function_handler function.
Your function code runs and then sends the function response back to the Lambda Runtime API, which forwards it onto the caller.
Testing
Before deploying the function, you can debug/test the function locally using cargo lambda.
cargo lambda watch sets up an environment that emulates the Lambda execution environment. This allows you to send requests to the Lambda function and see the results.
To send invocation requests, you can use either cargo lambda or send a curl request to the Lambda emulator.
To use cargo lambda, run the following, replace <lambda-function-name> with hi_api for this example
Once you have built the function using cargo lambda build, you can deploy it to your AWS account.
To deploy your function:
cargo lambda deploy
Once the Lambda function is deployed, you can test it remotely. cargo lambda invoke tests the remote Lambda function using a payload stored in a .json file:
You can create a serverless API in front of this Rust Lambda function using Amazon API Gateway. This example uses the AWS CDK. This example does not have authentication configured for the API Gateway endpoint as it is a sample. The AWS best practice is to implement relevant security controls where necessary.
First, create a new CDK project:
mkdir rusty_cdk
cd rusty_cdk
cdk init --language=typescript
The easiest way to deploy a Rust Lambda function using the AWS CDK is to use the cargo lambdaCDK Construct. This comes with everything required to run Rust Lambda functions on AWS. It is part of the cargo lambda project.
Install the Cargo Lambda CDK construct:
npm i cargo-lambda-cdk
Create a new HTTP Lambda function in your project:
mkdir lambda
cd lambda
cargo lambda new helloRust
When prompted for Is this function an HTTP function?, enter y.
Update your CDK stack lib/rusty_cdk-stack.ts to include both the Lambda function and API Gateway.
import * as cdk from 'aws-cdk-lib';
import { HttpApi } from 'aws-cdk-lib/aws-apigatewayv2';
import { HttpLambdaIntegration } from 'aws-cdk-lib/aws-apigatewayv2-integrations';
import { HttpMethod } from 'aws-cdk-lib/aws-events';
import { RustFunction } from 'cargo-lambda-cdk';
import { Construct } from 'constructs';
export class RustyCdkStack extends cdk.Stack {
  constructor(scope: Construct, id: string, props?: cdk.StackProps) {
    super(scope, id, props);
    const helloRust = new RustFunction(this, 'helloRust',{
      manifestPath: './lambda/helloRust',
      runtime: 'provided.al2023',
      timeout: cdk.Duration.seconds(30),
    });

    const api = new HttpApi(this, 'rustyApi');
    const helloInteg = new HttpLambdaIntegration('helloInteg', helloRust);

    api.addRoutes({
      path: '/hello',
      methods: [HttpMethod.GET],
      integration: helloInteg,
    })
    new cdk.CfnOutput(this, 'apiUrl',{
      description: 'The URL of the API Gateway',
      value: `https://${api.apiId}.execute-api.${this.region}.amazonaws.com`,
    })
  }
}
Bootstrap your AWS account and AWS Region for the AWS CDK:
cdk bootstrap
Deploy your stack:
cdk deploy
Testing the API
To test your deployed API using the URL provided in the AWS CDK output:
curl https://<YOUR_API_URL>/hello
Clean up
To avoid ongoing charges, remove the deployed resources:
cdk destroy
Conclusion
AWS Lambda support for Rust is now Generally Available to build high-performance, memory-efficient serverless applications. Cargo Lambda is a third-party extension to the Rust cargo CLI which simplifies the experience of developing, testing, and deploying Rust applications to Lambda.
To learn more about building serverless applications with Rust:
The world is in a race to build its first quantum computer capable of solving practical problems not feasible on even the largest conventional supercomputers. While the quantum computing paradigm promises many benefits, it also threatens the security of the Internet by breaking much of the cryptography we have come to rely on.
To mitigate this threat, Cloudflare is helping to migrate the Internet to Post-Quantum (PQ) cryptography. Today, about 50% of traffic to Cloudflare’s edge network is protected against the most urgent threat: an attacker who can intercept and store encrypted traffic today and then decrypt it in the future with the help of a quantum computer. This is referred to as the harvest now, decrypt laterthreat.
However, this is just one of the threats we need to address. A quantum computer can also be used to crack a server’s TLS certificate, allowing an attacker to impersonate the server to unsuspecting clients. The good news is that we already have PQ algorithms we can use for quantum-safe authentication. The bad news is that adoption of these algorithms in TLS will require significant changes to one of the most complex and security-critical systems on the Internet: the Web Public-Key Infrastructure (WebPKI).
The central problem is the sheer size of these new algorithms: signatures for ML-DSA-44, one of the most performant PQ algorithms standardized by NIST, are 2,420 bytes long, compared to just 64 bytes for ECDSA-P256, the most popular non-PQ signature in use today; and its public keys are 1,312 bytes long, compared to just 64 bytes for ECDSA. That’s a roughly 20-fold increase in size. Worse yet, the average TLS handshake includes a number of public keys and signatures, adding up to 10s of kilobytes of overhead per handshake. This is enough to have a noticeable impact on the performance of TLS.
That makes drop-in PQ certificates a tough sell to enable today: they don’t bring any security benefit before Q-day — the day a cryptographically relevant quantum computer arrives — but they do degrade performance. We could sit and wait until Q-day is a year away, but that’s playing with fire. Migrations always take longer than expected, and by waiting we risk the security and privacy of the Internet, which is dear to us.
It’s clear that we must find a way to make post-quantum certificates cheap enough to deploy today by default for everyone — not just those that can afford it. In this post, we’ll introduce you to the plan we’ve brought together with industry partners to the IETF to redesign the WebPKI in order to allow a smooth transition to PQ authentication with no performance impact (and perhaps a performance improvement!). We’ll provide an overview of one concrete proposal, called Merkle Tree Certificates (MTCs), whose goal is to whittle down the number of public keys and signatures in the TLS handshake to the bare minimum required.
But talk is cheap. We knowfromexperience that, as with any change to the Internet, it’s crucial to test early and often. Today we’re announcing our intent to deploy MTCs on an experimental basis in collaboration with Chrome Security. In this post, we’ll describe the scope of this experiment, what we hope to learn from it, and how we’ll make sure it’s done safely.
The WebPKI today — an old system with many patches
Why does the TLS handshake have so many public keys and signatures?
Let’s start with Cryptography 101. When your browser connects to a website, it asks the server to authenticate itself to make sure it’s talking to the real server and not an impersonator. This is usually achieved with a cryptographic primitive known as a digital signature scheme (e.g., ECDSA or ML-DSA). In TLS, the server signs the messages exchanged between the client and server using its secret key, and the client verifies the signature using the server’s public key. In this way, the server confirms to the client that they’ve had the same conversation, since only the server could have produced a valid signature.
If the client already knows the server’s public key, then only 1 signature is required to authenticate the server. In practice, however, this is not really an option. The web today is made up of around a billion TLS servers, so it would be unrealistic to provision every client with the public key of every server. What’s more, the set of public keys will change over time as new servers come online and existing ones rotate their keys, so we would need some way of pushing these changes to clients.
This scaling problem is at the heart of the design of all PKIs.
Trust is transitive
Instead of expecting the client to know the server’s public key in advance, the server might just send its public key during the TLS handshake. But how does the client know that the public key actually belongs to the server? This is the job of a certificate.
A certificate binds a public key to the identity of the server — usually its DNS name, e.g., cloudflareresearch.com. The certificate is signed by a Certification Authority (CA) whose public key is known to the client. In addition to verifying the server’s handshake signature, the client verifies the signature of this certificate. This establishes a chain of trust: by accepting the certificate, the client is trusting that the CA verified that the public key actually belongs to the server with that identity.
Clients are typically configured to trust many CAs and must be provisioned with a public key for each. Things are much easier however, since there are only 100s of CAs instead of billions. In addition, new certificates can be created without having to update clients.
These efficiencies come at a relatively low cost: for those counting at home, that’s +1 signature and +1 public key, for a total of 2 signatures and 1 public key per TLS handshake.
That’s not the end of the story, however. As the WebPKI has evolved, so have these chains of trust grown a bit longer. These days it’s common for a chain to consist of two or more certificates rather than just one. This is because CAs sometimes need to rotatetheir keys, just as servers do. But before they can start using the new key, they must distribute the corresponding public key to clients. This takes time, since it requires billions of clients to update their trust stores. To bridge the gap, the CA will sometimes use the old key to issue a certificate for the new one and append this certificate to the end of the chain.
That’s +1 signature and +1 public key, which brings us to 3 signatures and 2 public keys. And we still have a little ways to go.
Trust but verify
The main job of a CA is to verify that a server has control over the domain for which it’s requesting a certificate. This process has evolved over the years from a high-touch, CA-specific process to a standardized, mostly automated process used for issuing most certificates on the web. (Not all CAs fully support automation, however.) This evolution is marked by a number of security incidents in which a certificate was mis-issued to a party other than the server, allowing that party to impersonate the server to any client that trusts the CA.
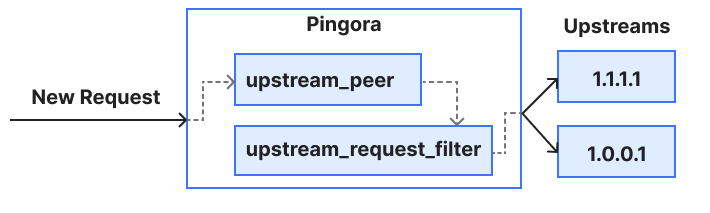
Automation helps, but attacks are still possible, and mistakes are almost inevitable. Earlier this year, several certificates for Cloudflare’s encrypted 1.1.1.1 resolver were issued without our involvement or authorization. This apparently occurred by accident, but it nonetheless put users of 1.1.1.1 at risk. (The mis-issued certificates have since been revoked.)
Ensuring mis-issuance is detectable is the job of the Certificate Transparency (CT) ecosystem. The basic idea is that each certificate issued by a CA gets added to a public log. Servers can audit these logs for certificates issued in their name. If ever a certificate is issued that they didn’t request itself, the server operator can prove the issuance happened, and the PKI ecosystem can take action to prevent the certificate from being trusted by clients.
Major browsers, including Firefox and Chrome and its derivatives, require certificates to be logged before they can be trusted. For example, Chrome, Safari, and Firefox will only accept the server’s certificate if it appears in at least two logs the browser is configured to trust. This policy is easy to state, but tricky to implement in practice:
Operating a CT log has historically been fairly expensive. Logs ingest billions of certificates over their lifetimes: when an incident happens, or even just under high load, it can take some time for a log to make a new entry available for auditors.
Clients can’t really audit logs themselves, since this would expose their browsing history (i.e., the servers they wanted to connect to) to the log operators.
The solution to both problems is to include a signature from the CT log along with the certificate. The signature is produced immediately in response to a request to log a certificate, and attests to the log’s intent to include the certificate in the log within 24 hours.
Per browser policy, certificate transparency adds +2 signatures to the TLS handshake, one for each log. This brings us to a total of 5 signatures and 2 public keys in a typical handshake on the public web.
The future WebPKI
The WebPKI is a living, breathing, and highly distributed system. We’ve had to patch it a number of times over the years to keep it going, but on balance it has served our needs quite well — until now.
Previously, whenever we needed to update something in the WebPKI, we would tack on another signature. This strategy has worked because conventional cryptography is so cheap. But 5 signatures and 2 public keys on average for each TLS handshake is simply too much to cope with for the larger PQ signatures that are coming.
The good news is that by moving what we already have around in clever ways, we can drastically reduce the number of signatures we need.
Crash course on Merkle Tree Certificates
Merkle Tree Certificates (MTCs) is a proposal for the next generation of the WebPKI that we are implementing and plan to deploy on an experimental basis. Its key features are as follows:
All the information a client needs to validate a Merkle Tree Certificate can be disseminated out-of-band. If the client is sufficiently up-to-date, then the TLS handshake needs just 1 signature, 1 public key, and 1 Merkle tree inclusion proof. This is quite small, even if we use post-quantum algorithms.
The MTC specification makes certificate transparency a first class feature of the PKI by having each CA run its own log of exactly the certificates they issue.
Let’s poke our head under the hood a little. Below we have an MTC generated by one of our internal tests. This would be transmitted from the server to the client in the TLS handshake:
Looks like your average PEM encoded certificate. Let’s decode it and look at the parameters:
$ openssl x509 -in merkle-tree-cert.pem -noout -text
Certificate:
    Data:
        Version: 3 (0x2)
        Serial Number: 531 (0x213)
        Signature Algorithm: 1.3.6.1.4.1.44363.47.0
        Issuer: 1.3.6.1.4.1.44363.47.1=44363.48.3
        Validity
            Not Before: Oct 21 15:33:26 2025 GMT
            Not After : Oct 28 15:33:26 2025 GMT
        Subject: CN=cloudflareresearch.com
        Subject Public Key Info:
            Public Key Algorithm: id-ecPublicKey
                Public-Key: (256 bit)
                pub:
                    04:70:ed:e1:96:87:b4:22:ef:fb:dc:a9:cd:9c:5c:
                    ef:1e:9e:ab:1b:6d:d7:11:74:7b:76:c8:3c:a1:5f:
                    94:37:45:99:d8:80:e3:5c:24:4f:28:46:b5:bf:84:
                    60:d8:fc:eb:82:5a:c4:4e:33:90:c7:b3:36:51:0c:
                    92:6d:bf:88:27
                ASN1 OID: prime256v1
                NIST CURVE: P-256
        X509v3 extensions:
            X509v3 Key Usage: critical
                Digital Signature
            X509v3 Extended Key Usage:
                TLS Web Server Authentication
            X509v3 Subject Alternative Name:
                DNS:cloudflareresearch.com, DNS:static-ct.cloudflareresearch.com
    Signature Algorithm: 1.3.6.1.4.1.44363.47.0
    Signature Value:
        00:00:00:00:00:00:02:00:00:00:00:00:00:00:02:58:00:e0:
        44:be:03:a5:bd:6a:b7:f2:9e:39:77:4c:16:4c:f8:06:e5:e1:
        55:c0:93:21:c6:79:83:3c:dd:5b:e6:57:89:c0:75:b3:4c:ec:
        75:8a:0b:53:a0:ca:1c:07:0c:1a:92:dd:c7:7c:a2:23:5d:83:
        0e:e4:23:43:38:af:43:20:a8:66:44:34:95:87:ea:2b:f0:0f:
        16:52:bb:ea:67:67:1e:89:36:4f:90:d4:05:55:89:46:f1:b7:
        b6:68:84:d3:57:31:ae:2b:c3:79:31:86:85:9d:24:ed:cf:25:
        a4:5c:fd:8f:f6:76:14:55:dd:67:2e:df:d6:8c:25:0d:52:48:
        c8:e3:fe:f9:7c:e6:a5:30:52:a5:b5:c7:3a:89:a5:c1:f6:4b:
        5b:95:ef:70:b8:91:fc:61:0f:6d:16:de:39:e9:a0:59:49:2b:
        34:71:7c:2a:16:da:c7:af:de:f7:01:94:10:c4:62:d1:f5:00:
        87:bd:e8:a2:f4:df:3b:35:79:27:0e:fc:cc:43:e7:60:5a:df:
        df:06:e8:d3:7e:eb:b3:bf:7b:25:43:0f:34:9a:26:c0:d3:6d:
        5d:0c:28:bc:87:58:58:15:00:00
While some of the parameters probably look familiar, others will look unusual. On the familiar side, the subject and public key are exactly what we might expect: the DNS name is cloudflareresearch.com and the public key is for a familiar signature algorithm, ECDSA-P256. This algorithm is not PQ, of course — in the future we would put ML-DSA-44 there instead.
On the unusual side, OpenSSL appears to not recognize the signature algorithm of the issuer and just prints the raw OID and bytes of the signature. There’s a good reason for this: the MTC does not have a signature in it at all! So what exactly are we looking at?
The trick to leave out signatures is that a Merkle Tree Certification Authority (MTCA) produces its signatureless certificates in batches rather than individually. In place of a signature, the certificate has an inclusion proof of the certificate in a batch of certificates signed by the MTCA.
To understand how inclusion proofs work, let’s think about a slightly simplified version of the MTC specification. To issue a batch, the MTCA arranges the unsigned certificates into a data structure called a Merkle tree that looks like this:
Each leaf of the tree corresponds to a certificate, and each inner node is equal to the hash of its children. To sign the batch, the MTCA uses its secret key to sign the head of the tree. The structure of the tree guarantees that each certificate in the batch was signed by the MTCA: if we tried to tweak the bits of any one of the certificates, the treehead would end up having a different value, which would cause the signature to fail.
An inclusion proof for a certificate consists of the hash of each sibling node along the path from the certificate to the treehead:
Given a validated treehead, this sequence of hashes is sufficient to prove inclusion of the certificate in the tree. This means that, in order to validate an MTC, the client also needs to obtain the signed treehead from the MTCA.
This is the key to MTC’s efficiency:
Signed treeheads can be disseminated to clients out-of-band and validated offline. Each validated treehead can then be used to validate any certificate in the corresponding batch, eliminating the need to obtain a signature for each server certificate.
During the TLS handshake, the client tells the server which treeheads it has. If the server has a signatureless certificate covered by one of those treeheads, then it can use that certificate to authenticate itself. That’s 1 signature,1 public key and 1 inclusion proof per handshake, both for the server being authenticated.
Now, that’s the simplified version. MTC proper has some more bells and whistles. To start, it doesn’t create a separate Merkle tree for each batch, but it grows a single large tree, which is used for better transparency. As this tree grows, periodically (sub)tree heads are selected to be shipped to browsers, which we call landmarks. In the common case browsers will be able to fetch the most recent landmarks, and servers can wait for batch issuance, but we need a fallback: MTC also supports certificates that can be issued immediately and don’t require landmarks to be validated, but these are not as small. A server would provision both types of Merkle tree certificates, so that the common case is fast, and the exceptional case is slow, but at least it’ll work.
Experimental deployment
Ever since early designs for MTCs emerged, we’ve been eager to experiment with the idea. In line with the IETF principle of “running code”, it often takes implementing a protocol to work out kinks in the design. At the same time, we cannot risk the security of users. In this section, we describe our approach to experimenting with aspects of the Merkle Tree Certificates design without changing any trust relationships.
Let’s start with what we hope to learn. We have lots of questions whose answers can help to either validate the approach, or uncover pitfalls that require reshaping the protocol — in fact, an implementation of an early MTC draft by Maximilian Pohl and Mia Celeste did exactly this. We’d like to know:
What breaks? Protocol ossification (the tendency of implementation bugs to make it harder to change a protocol) is an ever-present issue with deploying protocol changes. For TLS in particular, despite having built-in flexibility, time after time we’ve found that if that flexibility is not regularly used, there will be buggy implementations and middleboxes that break when they see things they don’t recognize. TLS 1.3 deployment took years longer than we hoped for this very reason. And more recently, the rollout of PQ key exchange in TLS caused the Client Hello to be split over multiple TCP packets, something that many middleboxes weren’t ready for.
What is the performance impact? In fact, we expect MTCs to reduce the size of the handshake, even compared to today’s non-PQ certificates. They will also reduce CPU cost: ML-DSA signature verification is about as fast as ECDSA, and there will be far fewer signatures to verify. We therefore expect to see a reduction in latency. We would like to see if there is a measurable performance improvement.
What fraction of clients will stay up to date? Getting the performance benefit of MTCs requires the clients and servers to be roughly in sync with one another. We expect MTCs to have fairly short lifetimes, a week or so. This means that if the client’s latest landmark is older than a week, the server would have to fallback to a larger certificate. Knowing how often this fallback happens will help us tune the parameters of the protocol to make fallbacks less likely.
In order to answer these questions, we are implementing MTC support in our TLS stack and in our certificate issuance infrastructure. For their part, Chrome is implementing MTC support in their own TLS stack and will stand up infrastructure to disseminate landmarks to their users.
As we’ve done in past experiments, we plan to enable MTCs for a subset of our free customers with enough traffic that we will be able to get useful measurements. Chrome will control the experimental rollout: they can ramp up slowly, measuring as they go and rolling back if and when bugs are found.
Which leaves us with one last question: who will run the Merkle Tree CA?
Bootstrapping trust from the existing WebPKI
Standing up a proper CA is no small task: it takes years to be trusted by major browsers. That’s why Cloudflare isn’t going to become a “real” CA for this experiment, and Chrome isn’t going to trust us directly.
Instead, to make progress on a reasonable timeframe, without sacrificing due diligence, we plan to “mock” the role of the MTCA. We will run an MTCA (on Workers based on our StaticCT logs), but for each MTC we issue, we also publish an existing certificate from a trusted CA that agrees with it. We call this the bootstrap certificate. When Chrome’s infrastructure pulls updates from our MTCA log, they will also pull these bootstrap certificates, and check whether they agree. Only if they do, they’ll proceed to push the corresponding landmarks to Chrome clients. In other words, Cloudflare is effectively just “re-encoding” an existing certificate (with domain validation performed by a trusted CA) as an MTC, and Chrome is using certificate transparency to keep us honest.
Conclusion
With almost 50% of our traffic already protected by post-quantum encryption, we’re halfway to a fully post-quantum secure Internet. The second part of our journey, post-quantum certificates, is the hardest yet though. A simple drop-in upgrade has a noticeable performance impact and no security benefit before Q-day. This means it’s a hard sell to enable today by default. But here we are playing with fire: migrations always take longer than expected. If we want to keep an ubiquitously private and secure Internet, we need a post-quantum solution that’s performant enough to be enabled by default today.
Merkle Tree Certificates (MTCs) solves this problem by reducing the number of signatures and public keys to the bare minimum while maintaining the WebPKI’s essential properties. We plan to roll out MTCs to a fraction of free accounts by early next year. This does not affect any visitors that are not part of the Chrome experiment. For those that are, thanks to the bootstrap certificates, there is no impact on security.
We’re excited to keep the Internet fast and secure, and will report back soon on the results of this experiment: watch this space! MTC is evolving as we speak, if you want to get involved, please join the IETF PLANTS mailing list.
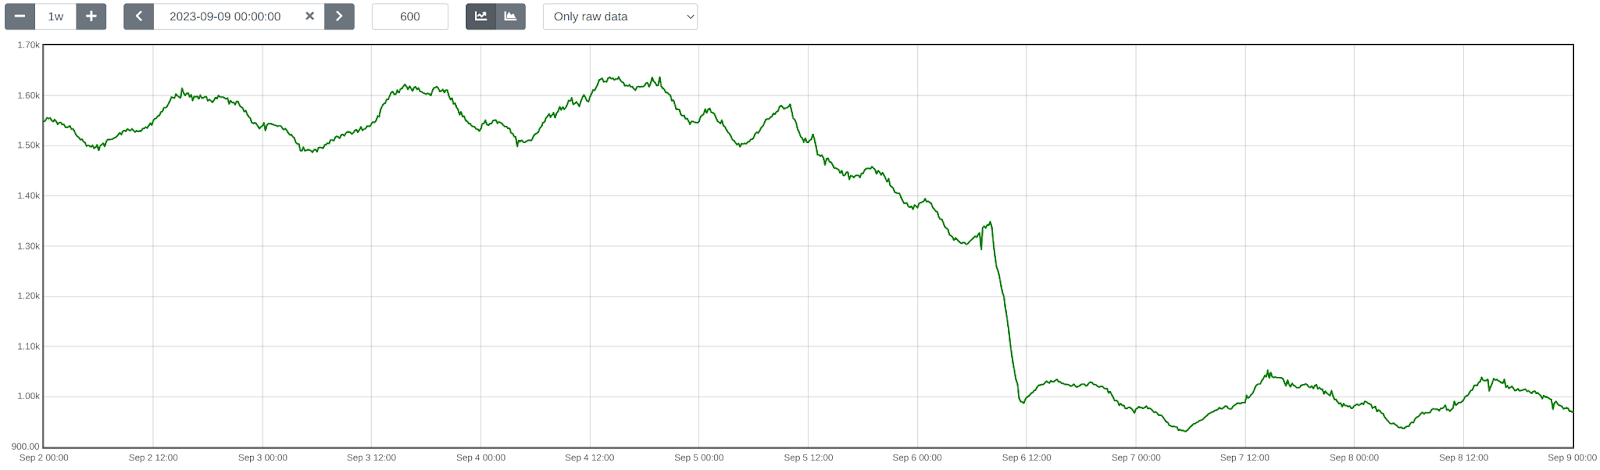
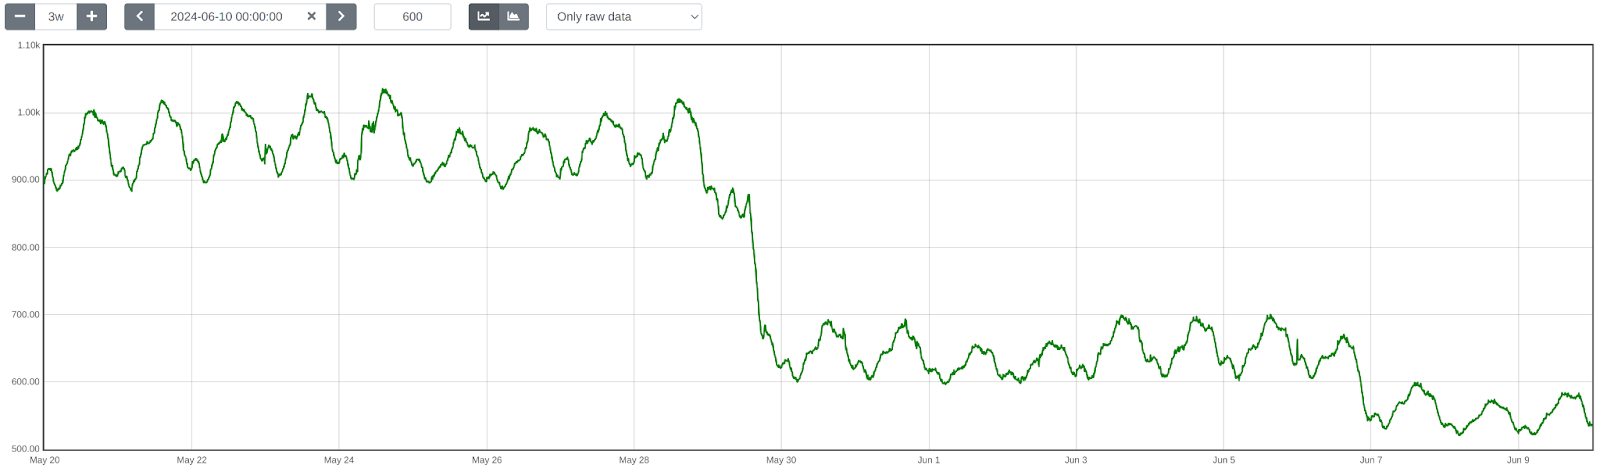
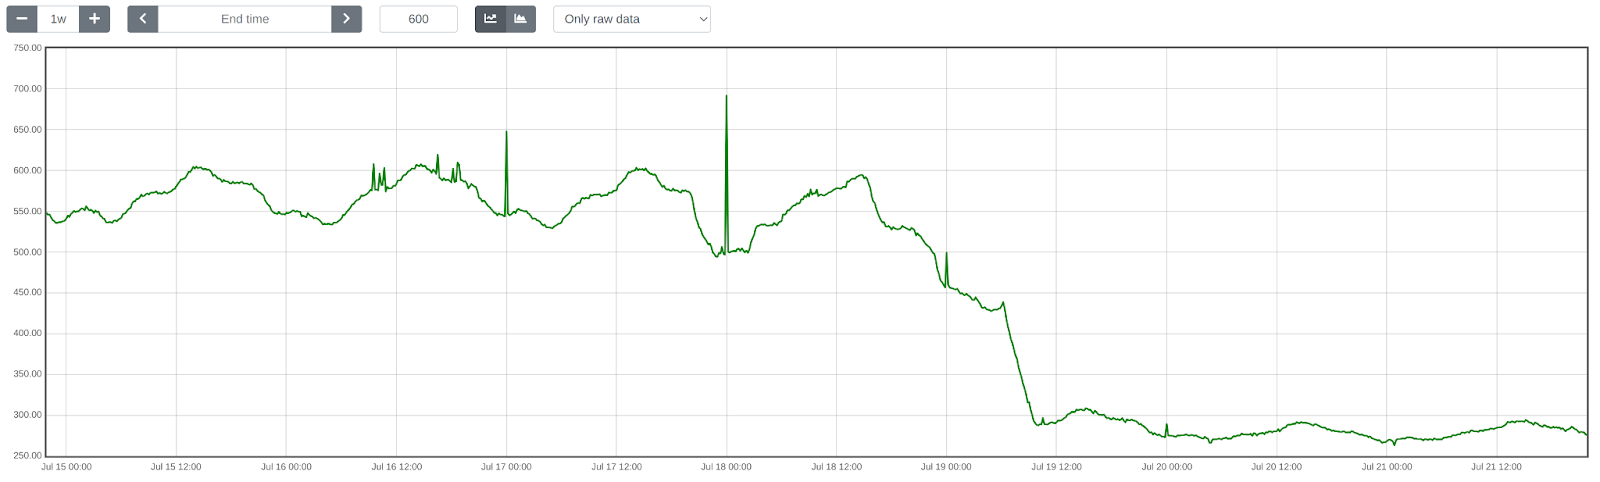
Building the fastest network requires work in many areas. We invest a lot of time in our hardware, to have efficient and fast machines. We invest in peering arrangements, to make sure we can talk to every part of the Internet with minimal delay. On top of this, we also have to invest in the software we run our network on, especially as each new product can otherwise add more processing delay.
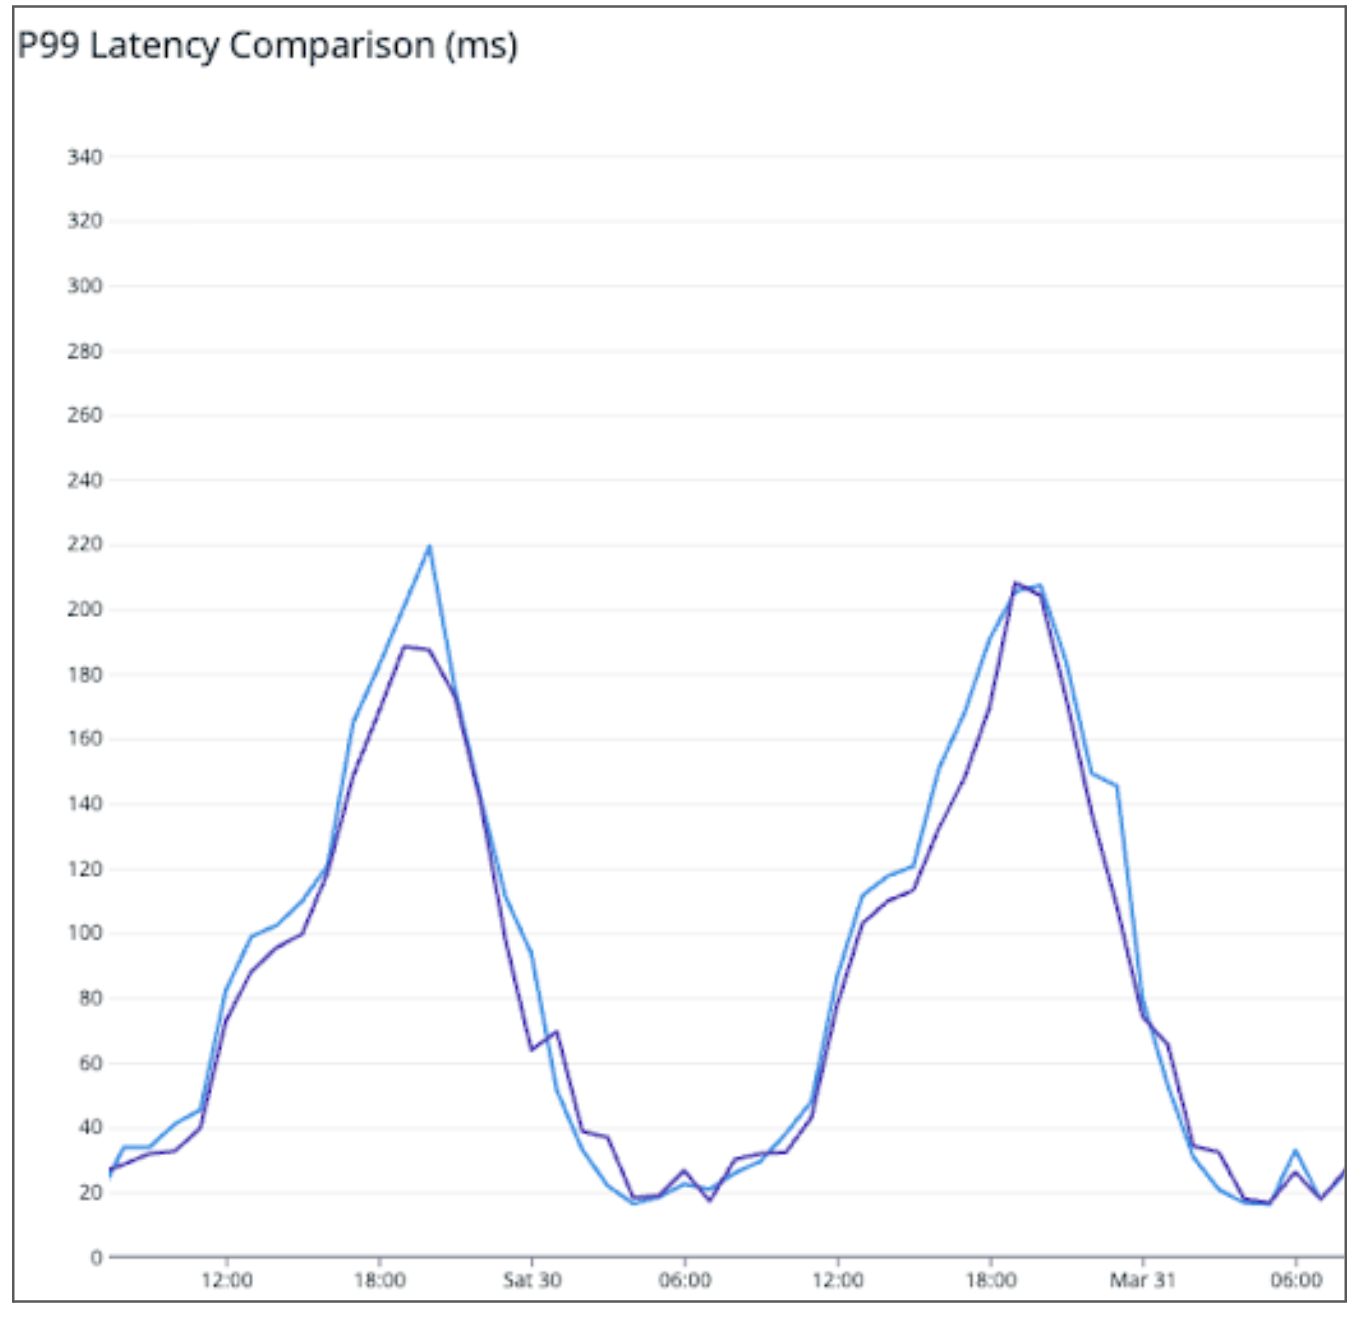
No matter how fast messages arrive, we introduce a bottleneck if that software takes too long to think about how to process and respond to requests. Today we are excited to share a significant upgrade to our software that cuts the median time we take to respond by 10ms and delivers a 25% performance boost, as measured by third-party CDN performance tests.
We’ve spent the last year rebuilding major components of our system, and we’ve just slashed the latency of traffic passing through our network for millions of our customers. At the same time, we’ve made our system more secure, and we’ve reduced the time it takes for us to build and release new products.
Where did we start?
Every request that hits Cloudflare starts a journey through our network. It might come from a browser loading a webpage, a mobile app calling an API, or automated traffic from another service. These requests first terminate at our HTTP and TLS layer, then pass into a system we call FL, and finally through Pingora, which performs cache lookups or fetches data from the origin if needed.
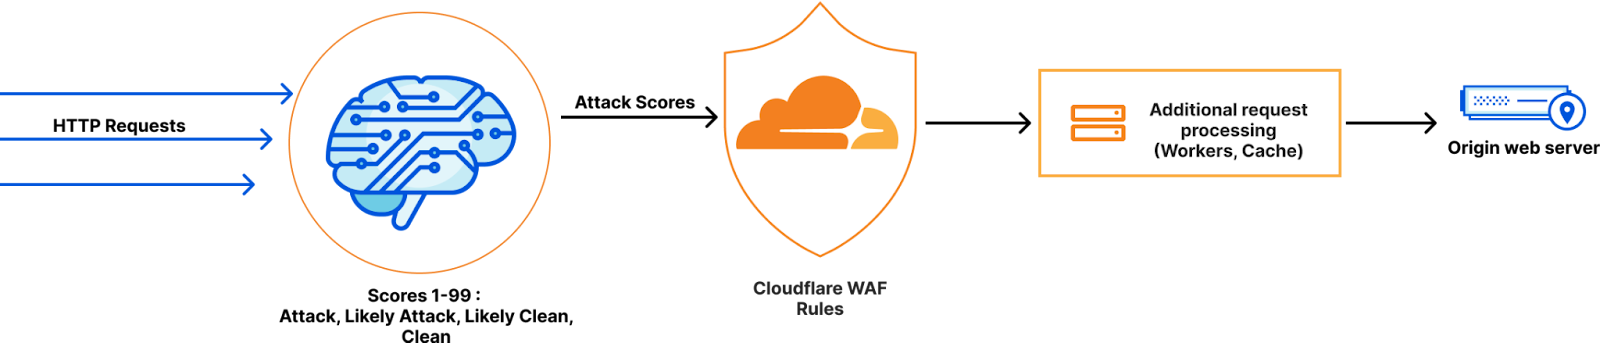
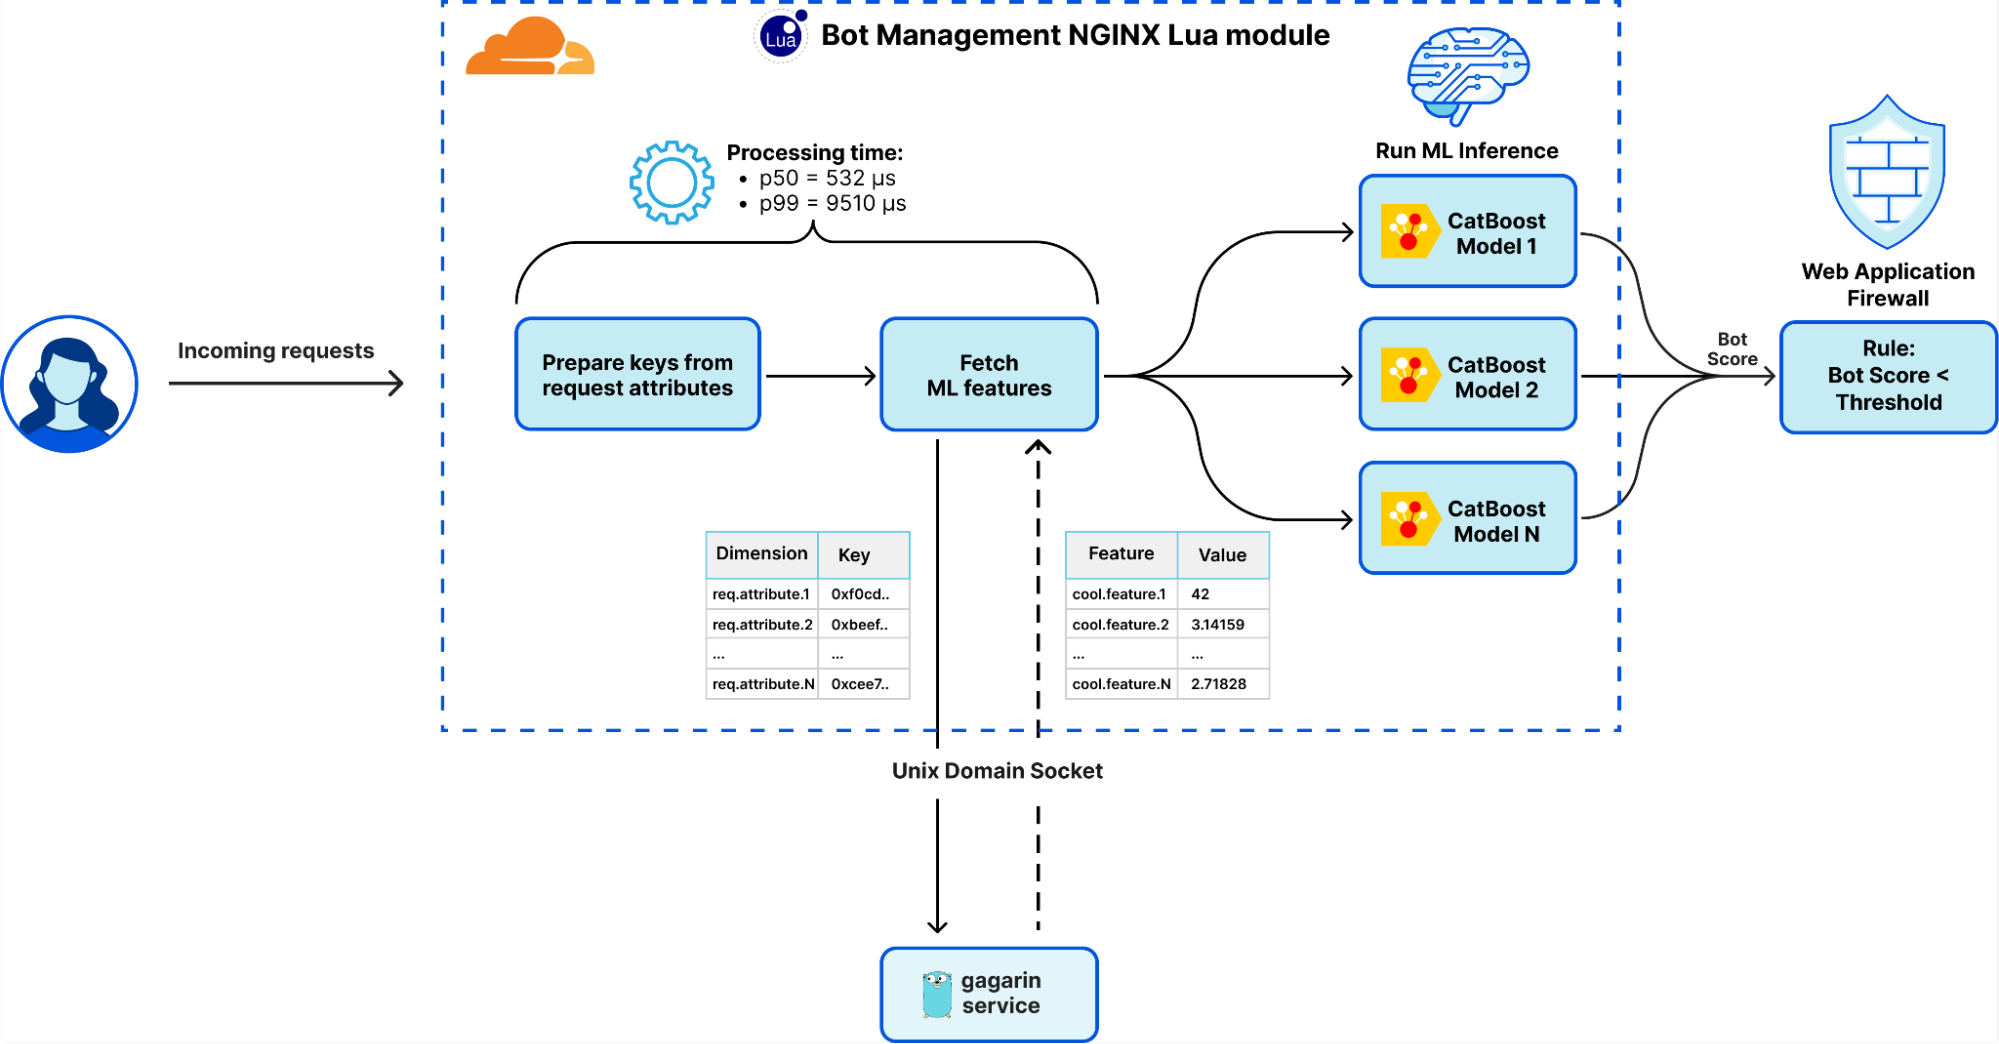
FL is the brain of Cloudflare. Once a request reaches FL, we then run the various security and performance features in our network. It applies each customer’s unique configuration and settings, from enforcing WAF rules and DDoS protection to routing traffic to the Developer Platform and R2.
Built more than 15 years ago, FL has been at the core of Cloudflare’s network. It enables us to deliver a broad range of features, but over time that flexibility became a challenge. As we added more products, FL grew harder to maintain, slower to process requests, and more difficult to extend. Each new feature required careful checks across existing logic, and every addition introduced a little more latency, making it increasingly difficult to sustain the performance we wanted.
You can see how FL is key to our system — we’ve often called it the “brain” of Cloudflare. It’s also one of the oldest parts of our system: the first commit to the codebase was made by one of our founders, Lee Holloway, well before our initial launch. We’re celebrating our 15th Birthday this week – this system started 9 months before that!
commit 39c72e5edc1f05ae4c04929eda4e4d125f86c5ce
Author: Lee Holloway <q@t60.(none)>
Date:   Wed Jan 6 09:57:55 2010 -0800

    nginx-fl initial configuration
As the commit implies, the first version of FL was implemented based on the NGINX webserver, with product logic implemented in PHP. After 3 years, the system became too complex to manage effectively, and too slow to respond, and an almost complete rewrite of the running system was performed. This led to another significant commit, this time made by Dane Knecht, who is now our CTO.
From this point on, FL was implemented using NGINX, the OpenResty framework, and LuaJIT. While this was great for a long time, over the last few years it started to show its age. We had to spend increasing amounts of time fixing or working around obscure bugs in LuaJIT. The highly dynamic and unstructured nature of our Lua code, which was a blessing when first trying to implement logic quickly, became a source of errors and delay when trying to integrate large amounts of complex product logic. Each time a new product was introduced, we had to go through all the other existing products to check if they might be affected by the new logic.
It was clear that we needed a rethink. So, in July 2024, we cut an initial commit for a brand new, and radically different, implementation. To save time agreeing on a new name for this, we just called it “FL2”, and started, of course, referring to the original FL as “FL1”.
We weren’t starting from scratch. We’ve previously blogged about how we replaced another one of our legacy systems with Pingora, which is built in the Rust programming language, using the Tokio runtime. We’ve also blogged about Oxy, our internal framework for building proxies in Rust. We write a lot of Rust, and we’ve gotten pretty good at it.
We built FL2 in Rust, on Oxy, and built a strict module framework to structure all the logic in FL2.
Why Oxy?
When we set out to build FL2, we knew we weren’t just replacing an old system; we were rebuilding the foundations of Cloudflare. That meant we needed more than just a proxy; we needed a framework that could evolve with us, handle the immense scale of our network, and let teams move quickly without sacrificing safety or performance.
Oxy gives us a powerful combination of performance, safety, and flexibility. Built in Rust, it eliminates entire classes of bugs that plagued our Nginx/LuaJIT-based FL1, like memory safety issues and data races, while delivering C-level performance. At Cloudflare’s scale, those guarantees aren’t nice-to-haves, they’re essential. Every microsecond saved per request translates into tangible improvements in user experience, and every crash or edge case avoided keeps the Internet running smoothly. Rust’s strict compile-time guarantees also pair perfectly with FL2’s modular architecture, where we enforce clear contracts between product modules and their inputs and outputs.
But the choice wasn’t just about language. Oxy is the culmination of years of experience building high-performance proxies. It already powers several major Cloudflare services, from our Zero Trust Gateway to Apple’s iCloud Private Relay, so we knew it could handle the diverse traffic patterns and protocol combinations that FL2 would see. Its extensibility model lets us intercept, analyze, and manipulate traffic from layer 3 up to layer 7, and even decapsulate and reprocess traffic at different layers. That flexibility is key to FL2’s design because it means we can treat everything from HTTP to raw IP traffic consistently and evolve the platform to support new protocols and features without rewriting fundamental pieces.
Oxy also comes with a rich set of built-in capabilities that previously required large amounts of bespoke code. Things like monitoring, soft reloads, dynamic configuration loading and swapping are all part of the framework. That lets product teams focus on the unique business logic of their module rather than reinventing the plumbing every time. This solid foundation means we can make changes with confidence, ship them quickly, and trust they’ll behave as expected once deployed.
Smooth restarts – keeping the Internet flowing
One of the most impactful improvements Oxy brings is handling of restarts. Any software under continuous development and improvement will eventually need to be updated. In desktop software, this is easy: you close the program, install the update, and reopen it. On the web, things are much harder. Our software is in constant use and cannot simply stop. A dropped HTTP request can cause a page to fail to load, and a broken connection can kick you out of a video call. Reliability is not optional.
In FL1, upgrades meant restarts of the proxy process. Restarting a proxy meant terminating the process entirely, which immediately broke any active connections. That was particularly painful for long-lived connections such as WebSockets, streaming sessions, and real-time APIs. Even planned upgrades could cause user-visible interruptions, and unplanned restarts during incidents could be even worse.
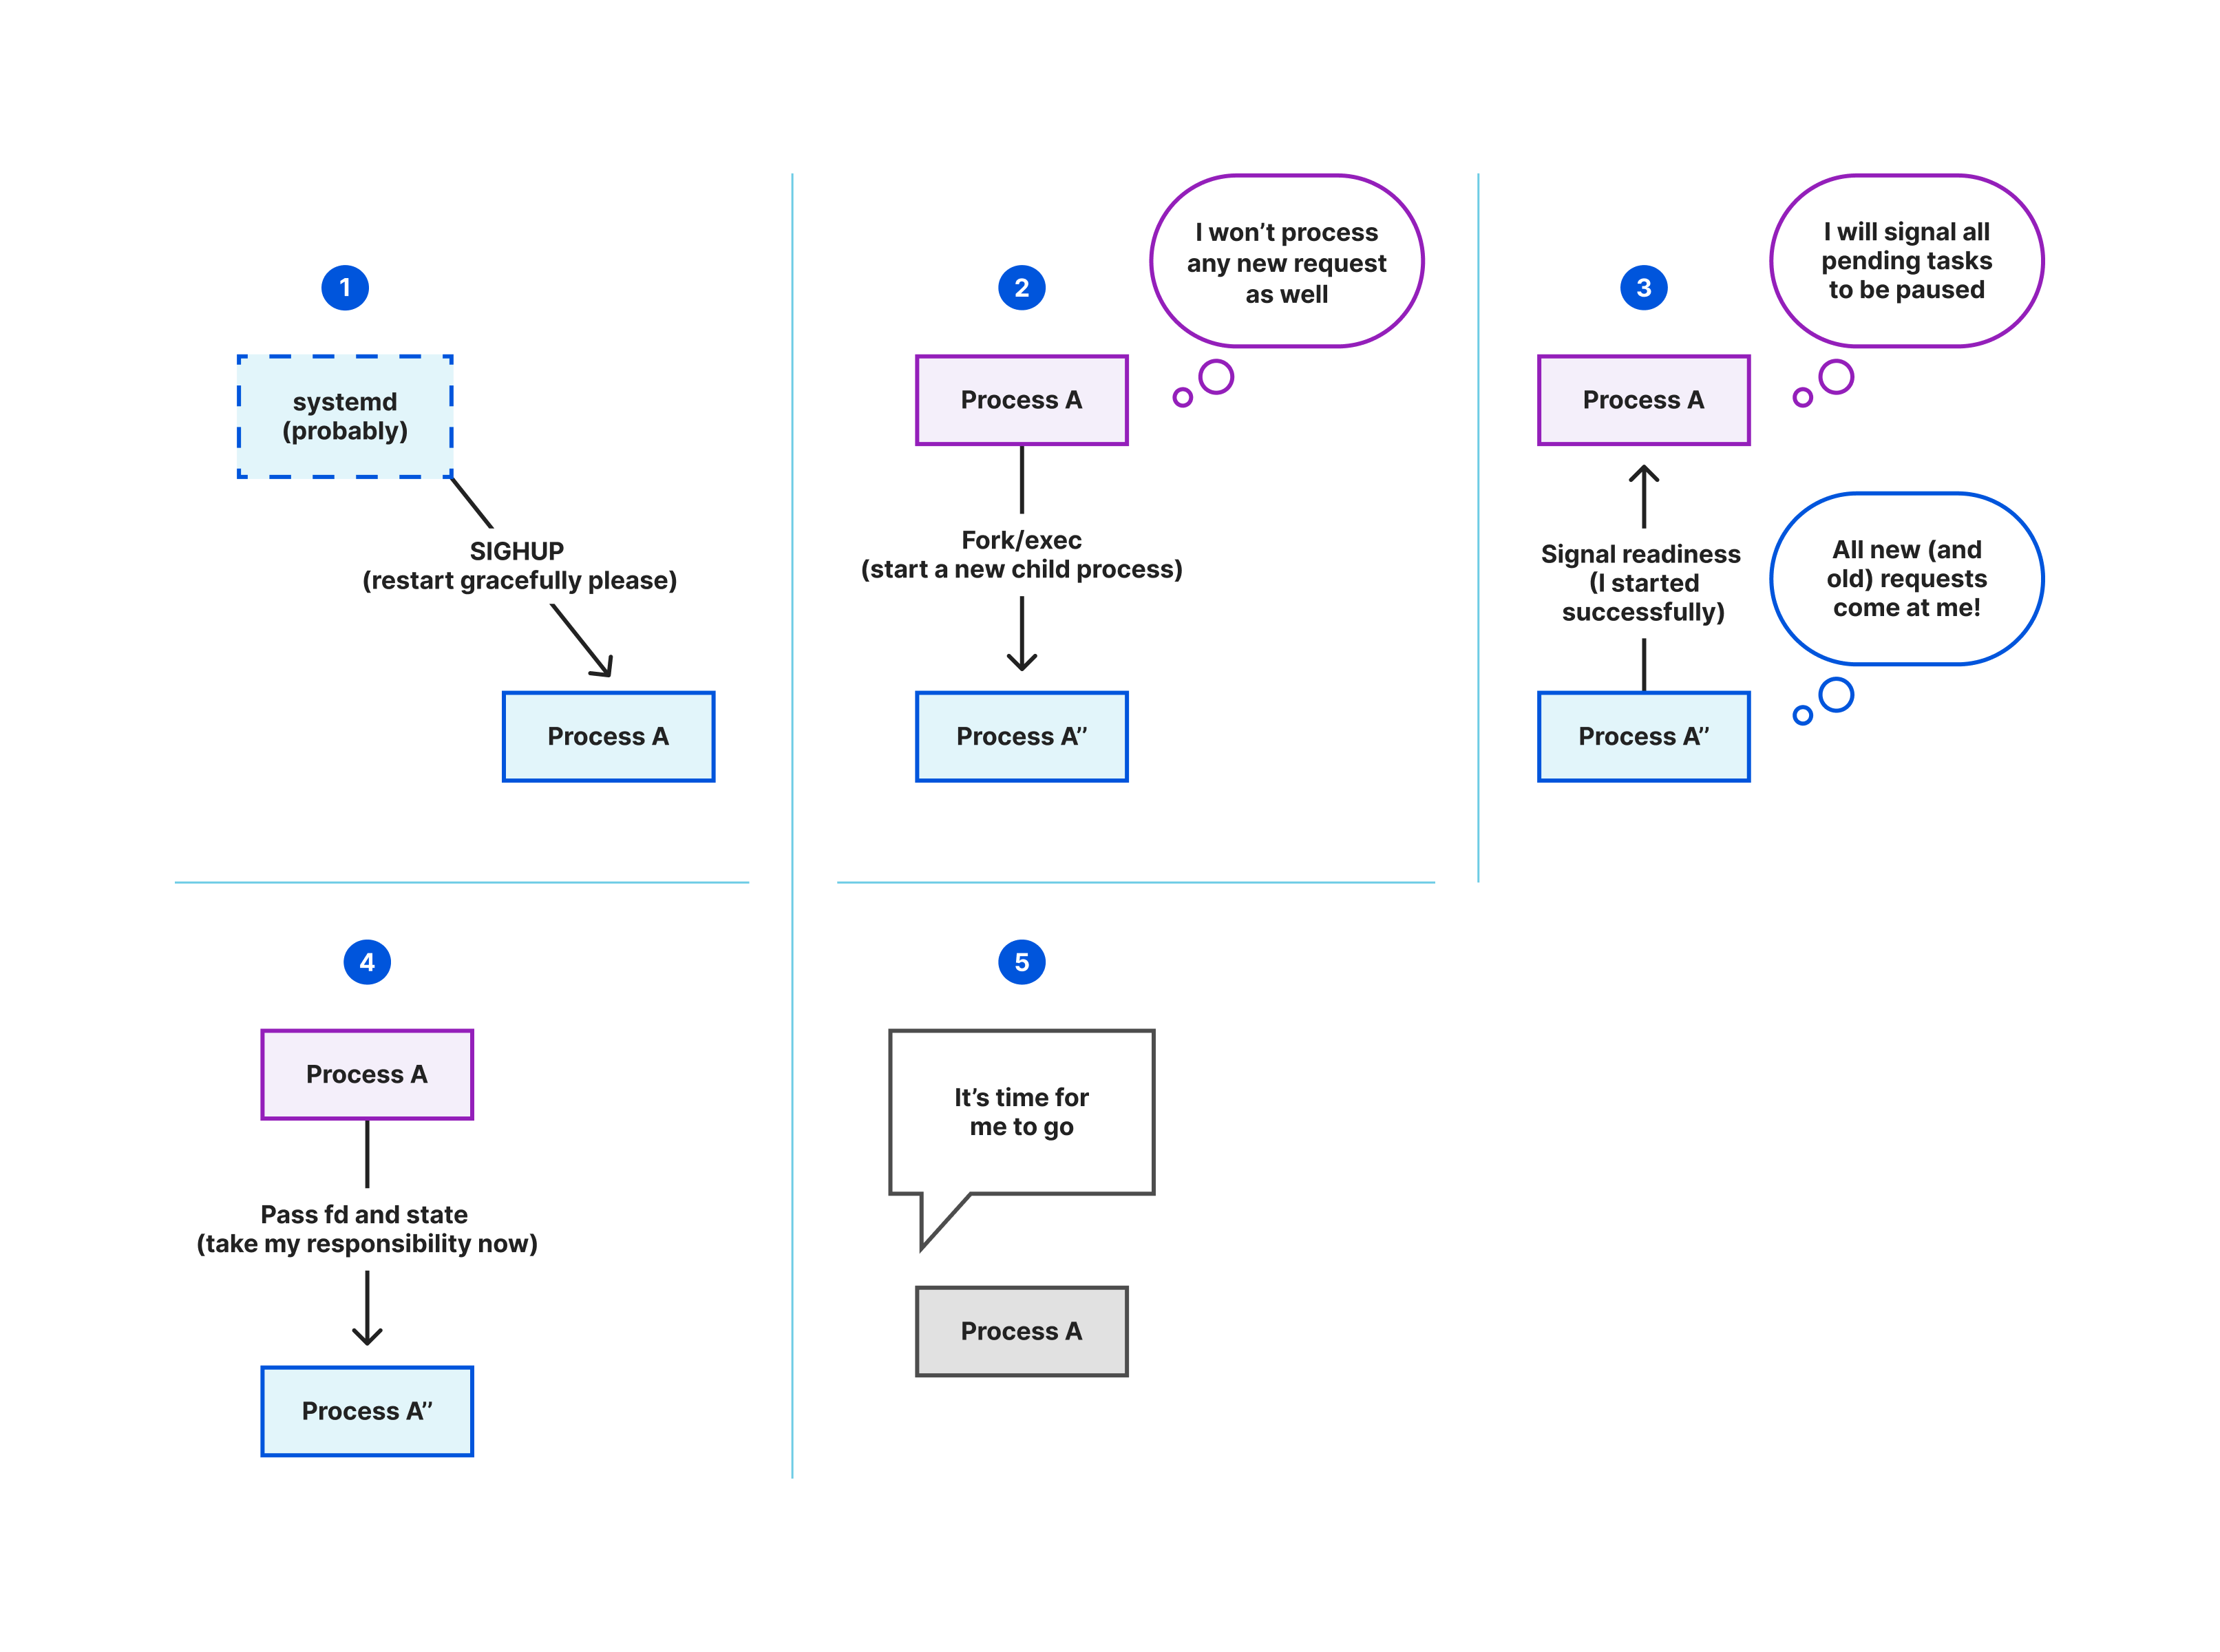
Oxy changes that. It includes a built-in mechanism for graceful restarts that lets us roll out new versions without dropping connections whenever possible. When a new instance of an Oxy-based service starts up, the old one stops accepting new connections but continues to serve existing ones, allowing those sessions to continue uninterrupted until they end naturally.
This means that if you have an ongoing WebSocket session when we deploy a new version, that session can continue uninterrupted until it ends naturally, rather than being torn down by the restart. Across Cloudflare’s fleet, deployments are orchestrated over several hours, so the aggregate rollout is smooth and nearly invisible to end users.
We take this a step further by using systemd socket activation. Instead of letting each proxy manage its own sockets, we let systemd create and own them. This decouples the lifetime of sockets from the lifetime of the Oxy application itself. If an Oxy process restarts or crashes, the sockets remain open and ready to accept new connections, which will be served as soon as the new process is running. That eliminates the “connection refused” errors that could happen during restarts in FL1 and improves overall availability during upgrades.
We also built our own coordination mechanisms in Rust to replace Go libraries like tableflip with shellflip. This uses a restart coordination socket that validates configuration, spawns new instances, and ensures the new version is healthy before the old one shuts down. This improves feedback loops and lets our automation tools detect and react to failures immediately, rather than relying on blind signal-based restarts.
Composing FL2 from Modules
To avoid the problems we had in FL1, we wanted a design where all interactions between product logic were explicit and easy to understand.
So, on top of the foundations provided by Oxy, we built a platform which separates all the logic built for our products into well-defined modules. After some experimentation and research, we designed a module system which enforces some strict rules:
No IO (input or output) can be performed by the module.
The module provides a list of phases.
Phases are evaluated in a strictly defined order, which is the same for every request.
Each phase defines a set of inputs which the platform provides to it, and a set of outputs which it may emit.
Here’s an example of what a module phase definition looks like:
This phase is for our custom error page product. It takes a few things as input — information about the IP of the visitor, some header and other HTTP information, and some “module values.” Module values allow one module to pass information to another, and they’re key to making the strict properties of the module system workable. For example, this module needs some information that is produced by the output of our rulesets-based custom errors product (the “MODULE_VALUE_RULESETS_CUSTOM_ERRORS_OUTPUT” input). These input and output definitions are enforced at compile time.
While these rules are strict, we’ve found that we can implement all our product logic within this framework. The benefit of doing so is that we can immediately tell which other products might affect each other.
How to replace a running system
Building a framework is one thing. Building all the product logic and getting it right, so that customers don’t notice anything other than a performance improvement, is another.
The FL code base supports 15 years of Cloudflare products, and it’s changing all the time. We couldn’t stop development. So, one of our first tasks was to find ways to make the migration easier and safer.
Step 1 – Rust modules in OpenResty
It’s a big enough distraction from shipping products to customers to rebuild product logic in Rust. Asking all our teams to maintain two versions of their product logic, and reimplement every change a second time until we finished our migration was too much.
So, we implemented a layer in our old NGINX and OpenResty based FL which allowed the new modules to be run. Instead of maintaining a parallel implementation, teams could implement their logic in Rust, and replace their old Lua logic with that, without waiting for the full replacement of the old system.
For example, here’s part of the implementation for the custom error page module phase defined earlier (we’ve cut out some of the more boring details, so this doesn’t quite compile as-written):
pub(crate) fn callback(_services: &mut Services, input: &Input<'_>) -> Output {
    // Rulesets produced a response to serve - this can either come from a special
    // Cloudflare worker for serving custom errors, or be directly embedded in the rule.
    if let Some(rulesets_params) = input
        .get_module_value(MODULE_VALUE_RULESETS_CUSTOM_ERRORS_OUTPUT)
        .cloned()
    {
        // Select either the result from the special worker, or the parameters embedded
        // in the rule.
        let body = input
            .get_module_value(MODULE_VALUE_CUSTOM_ERRORS_FETCH_WORKER_RESPONSE)
            .and_then(|response| {
                handle_custom_errors_fetch_response("rulesets", response.to_owned())
            })
            .or(rulesets_params.body);

        // If we were able to load a body, serve it, otherwise let the next bit of logic
        // handle the response
        if let Some(body) = body {
            let final_body = replace_custom_error_tokens(input, &body);

            // Increment a metric recording number of custom error pages served
            custom_pages::pages_served("rulesets").inc();

            // Return a phase output with one final action, causing an HTTP response to be served.
            return Output::from(TerminalAction::ServeResponse(ResponseAction::OriginError {
                rulesets_params.status,
                source: "rulesets http_custom_errors",
                headers: rulesets_params.headers,
                body: Some(Bytes::from(final_body)),
            }));
        }
    }
}
The internal logic in each module is quite cleanly separated from the handling of data, with very clear and explicit error handling encouraged by the design of the Rust language.
Many of our most actively developed modules were handled this way, allowing the teams to maintain their change velocity during our migration.
Step 2 – Testing and automated rollouts
It’s essential to have a seriously powerful test framework to cover such a migration. We built a system, internally named Flamingo, which allows us to run thousands of full end-to-end test requests concurrently against our production and pre-production systems. The same tests run against FL1 and FL2, giving us confidence that we’re not changing behaviours.
Whenever we deploy a change, that change is rolled out gradually across many stages, with increasing amounts of traffic. Each stage is automatically evaluated, and only passes when the full set of tests have been successfully run against it – as well as overall performance and resource usage metrics being within acceptable bounds. This system is fully automated, and pauses or rolls back changes if the tests fail.
The benefit is that we’re able to build and ship new product features in FL2 within 48 hours – where it would have taken weeks in FL1. In fact, at least one of the announcements this week involved such a change!
Step 3 – Fallbacks
Over 100 engineers have worked on FL2, and we have over 130 modules. And we’re not quite done yet. We’re still putting the final touches on the system, to make sure it replicates all the behaviours of FL1.
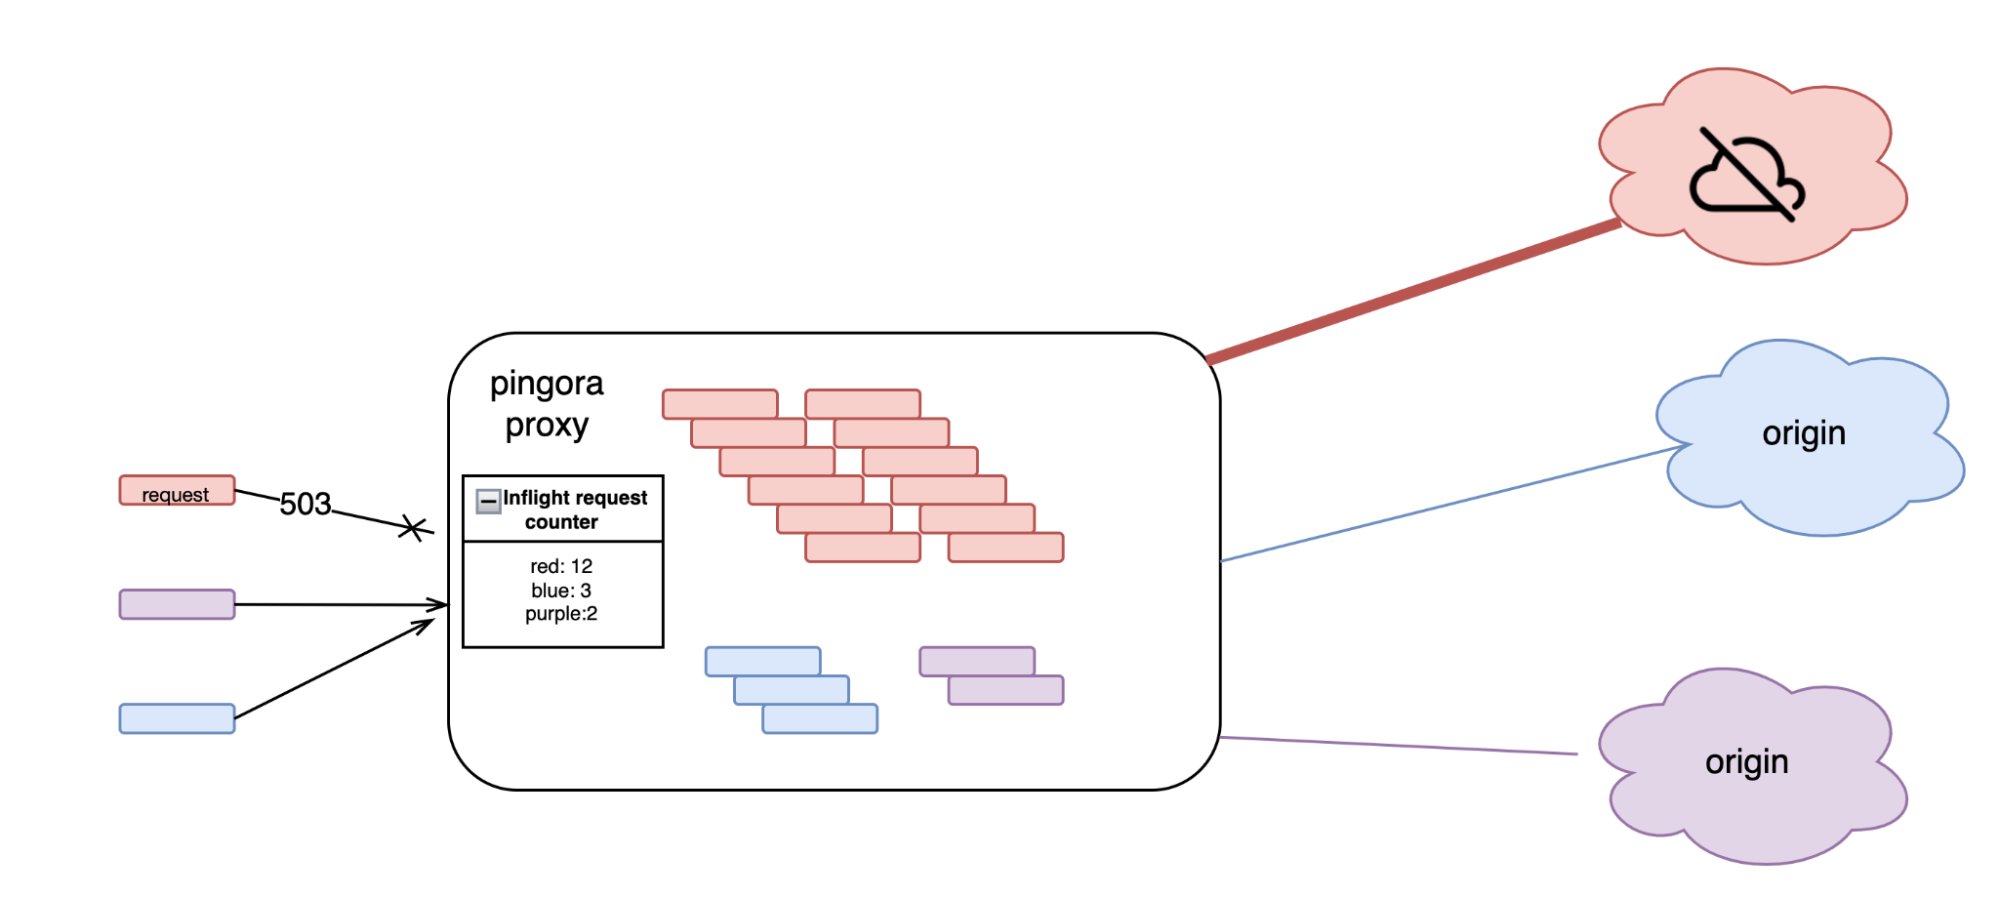
So how do we send traffic to FL2 without it being able to handle everything? If FL2 receives a request, or a piece of configuration for a request, that it doesn’t know how to handle, it gives up and does what we’ve called a fallback – it passes the whole thing over to FL1. It does this at the network level – it just passes the bytes on to FL1.
As well as making it possible for us to send traffic to FL2 without it being fully complete, this has another massive benefit. When we have implemented a piece of new functionality in FL2, but want to double check that it is working the same as in FL1, we can evaluate the functionality in FL2, and then trigger a fallback. We are able to compare the behaviour of the two systems, allowing us to get a high confidence that our implementation was correct.
Step 4 – Rollout
We started running customer traffic through FL2 early in 2025, and have been progressively increasing the amount of traffic served throughout the year. Essentially, we’ve been watching two graphs: one with the proportion of traffic routed to FL2 going up, and another with the proportion of traffic failing to be served by FL2 and falling back to FL1 going down.
We started this process by passing traffic for our free customers through the system. We were able to prove that the system worked correctly, and drive the fallback rates down for our major modules. Our Cloudflare Community MVPs acted as an early warning system, smoke testing and flagging when they suspected the new platform might be the cause of a new reported problem. Crucially their support allowed our team to investigate quickly, apply targeted fixes, or confirm the move to FL2 was not to blame.
We then advanced to our paying customers, gradually increasing the amount of customers using the system. We also worked closely with some of our largest customers, who wanted the performance benefits of FL2, and onboarded them early in exchange for lots of feedback on the system.
Right now, most of our customers are using FL2. We still have a few features to complete, and are not quite ready to onboard everyone, but our target is to turn off FL1 within a few more months.
Impact of FL2
As we described at the start of this post, FL2 is substantially faster than FL1. The biggest reason for this is simply that FL2 performs less work. You might have noticed in the module definition example a line
filters: vec![],
Every module is able to provide a set of filters, which control whether they run or not. This means that we don’t run logic for every product for every request — we can very easily select just the required set of modules. The incremental cost for each new product we develop has gone away.
Another huge reason for better performance is that FL2 is a single codebase, implemented in a performance focussed language. In comparison, FL1 was based on NGINX (which is written in C), combined with LuaJIT (Lua, and C interface layers), and also contained plenty of Rust modules. In FL1, we spent a lot of time and memory converting data from the representation needed by one language, to the representation needed by another.
As a result, our internal measures show that FL2 uses less than half the CPU of FL1, and much less than half the memory. That’s a huge bonus — we can spend the CPU on delivering more and more features for our customers!
How do we measure if we are getting better?
Using our own tools and independent benchmarks like CDNPerf, we measured the impact of FL2 as we rolled it out across the network. The results are clear: websites are responding 10 ms faster at the median, a 25% performance boost.
Security
FL2 is also more secure by design than FL1. No software system is perfect, but the Rust language brings us huge benefits over LuaJIT. Rust has strong compile-time memory checks and a type system that avoids large classes of errors. Combine that with our rigid module system, and we can make most changes with high confidence.
Of course, no system is secure if used badly. It’s easy to write code in Rust, which causes memory corruption. To reduce risk, we maintain strong compile time linting and checking, together with strict coding standards, testing and review processes.
We have long followed a policy that any unexplained crash of our systems needs to be investigated as a high priority. We won’t be relaxing that policy, though the main cause of novel crashes in FL2 so far has been due to hardware failure. The massively reduced rates of such crashes will give us time to do a good job of such investigations.
What’s next?
We’re spending the rest of 2025 completing the migration from FL1 to FL2, and will turn off FL1 in early 2026. We’re already seeing the benefits in terms of customer performance and speed of development, and we’re looking forward to giving these to all our customers.
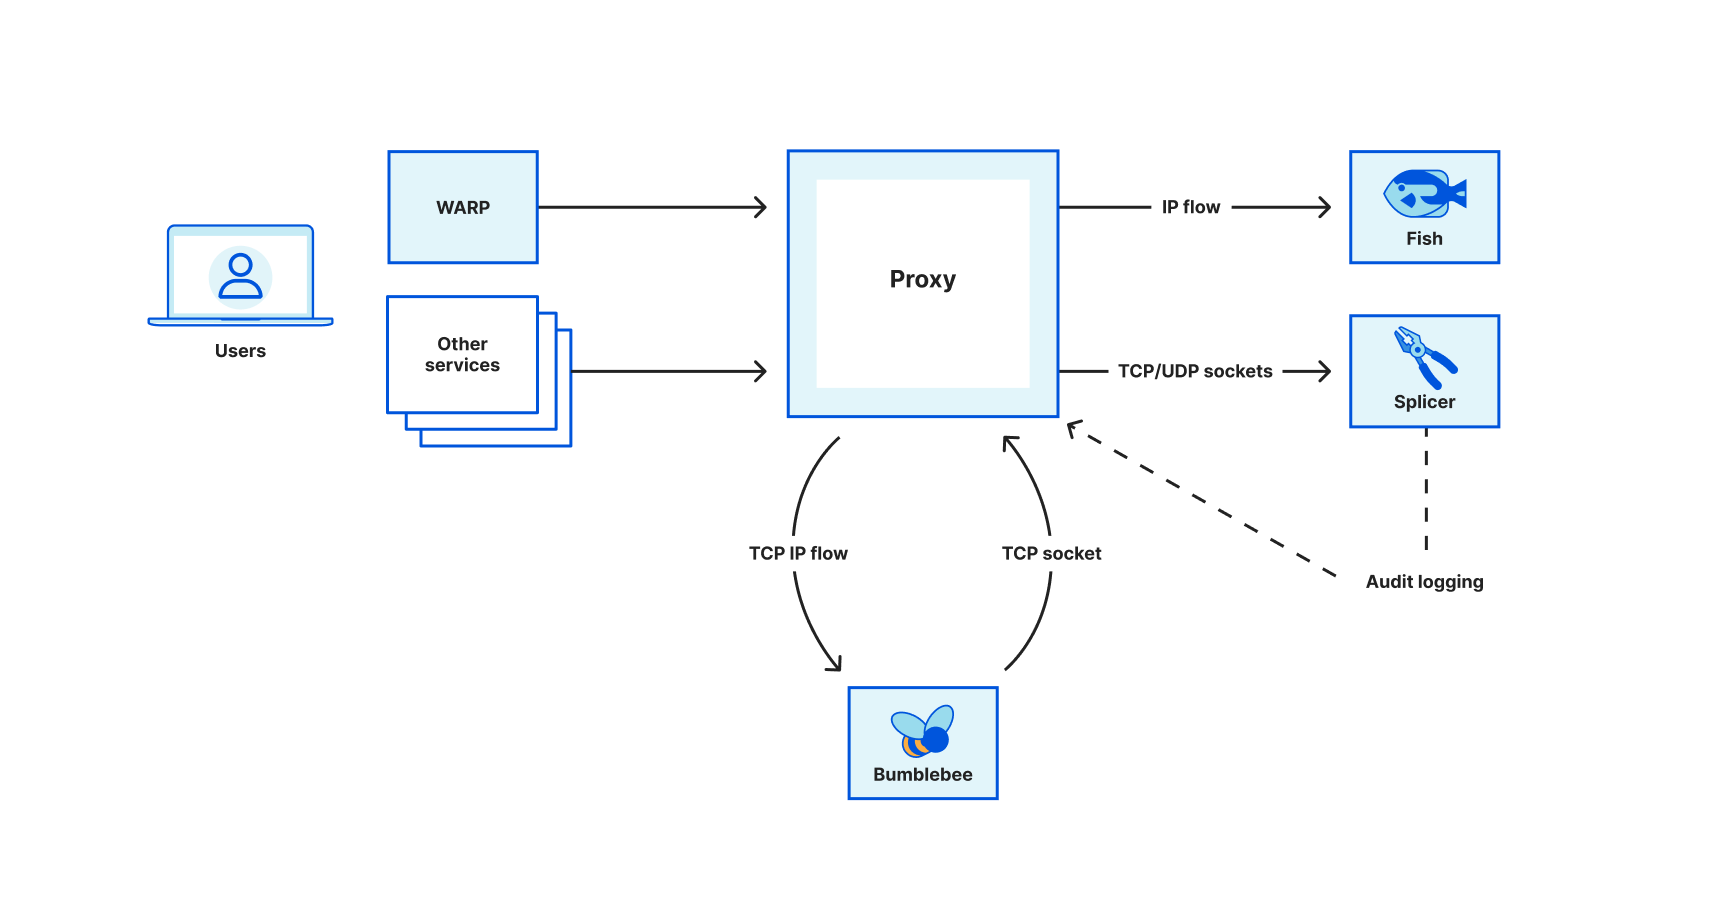
We have one last service to completely migrate. The “HTTP & TLS Termination” box from the diagram way back at the top is also an NGINX service, and we’re midway through a rewrite in Rust. We’re making good progress on this migration, and expect to complete it early next year.
After that, when everything is modular, in Rust and tested and scaled, we can really start to optimize! We’ll reorganize and simplify how the modules connect to each other, expand support for non-HTTP traffic like RPC and streams, and much more.
If you’re interested in being part of this journey, check out our careers page for open roles – we’re always looking for new talent to help us to help build a better Internet.
How do you run SQL queries over petabytes of data… without a server?
We have an answer for that: R2 SQL, a serverless query engine that can sift through enormous datasets and return results in seconds.
This post details the architecture and techniques that make this possible. We’ll walk through our Query Planner, which uses R2 Data Catalog to prune terabytes of data before reading a single byte, and explain how we distribute the work across Cloudflare’s global network, Workers and R2 for massively parallel execution.
From catalog to query
During Developer Week 2025, we launched R2 Data Catalog, a managed Apache Iceberg catalog built directly into your Cloudflare R2 bucket. Iceberg is an open table format that provides critical database features like transactions and schema evolution for petabyte-scale object storage. It gives you a reliable catalog of your data, but it doesn’t provide a way to query it.
Until now, reading your R2 Data Catalog required setting up a separate service like Apache Spark or Trino. Operating these engines at scale is not easy: you need to provision clusters, manage resource usage, and be responsible for their availability, none of which contributes to the primary goal of getting value from your data.
R2 SQL removes that step entirely. It’s a serverless query engine that executes retrieval SQL queries against your Iceberg tables, right where your data lives.
Designing a query engine for petabytes
Object storage is fundamentally different from a traditional database’s storage. A database is structured by design; R2 is an ocean of objects, where a single logical table can be composed of potentially millions of individual files, large and small, with more arriving every second.
Apache Iceberg provides a powerful layer of logical organization on top of this reality. It works by managing the table’s state as an immutable series of snapshots, creating a reliable, structured view of the table by manipulating lightweight metadata files instead of rewriting the data files themselves.
However, this logical structure doesn’t change the underlying physical challenge: an efficient query engine must still find the specific data it needs within that vast collection of files, and this requires overcoming two major technical hurdles:
The I/O problem: A core challenge for query efficiency is minimizing the amount of data read from storage. A brute-force approach of reading every object is simply not viable. The primary goal is to read only the data that is absolutely necessary.
The Compute problem: The amount of data that does need to be read can still be enormous. We need a way to give the right amount of compute power to a query, which might be massive, for just a few seconds, and then scale it down to zero instantly to avoid waste.
Our architecture for R2 SQL is designed to solve these two problems with a two-phase approach: a Query Planner that uses metadata to intelligently prune the search space, and a Query Execution system that distributes the work across Cloudflare’s global network to process the data in parallel.
Query Planner
The most efficient way to process data is to avoid reading it in the first place. This is the core strategy of the R2 SQL Query Planner. Instead of exhaustively scanning every file, the planner makes use of the metadata structure provided by R2 Data Catalog to prune the search space, that is, to avoid reading huge swathes of data irrelevant to a query.
This is a top-down investigation where the planner navigates the hierarchy of Iceberg metadata layers, using stats at each level to build a fast plan, specifying exactly which byte ranges the query engine needs to read.
What do we mean by “stats”?
When we say the planner uses “stats” we are referring to summary metadata that Iceberg stores about the contents of the data files. These statistics create a coarse map of the data, allowing the planner to make decisions about which files to read, and which to ignore, without opening them.
There are two primary levels of statistics the planner uses for pruning:
Partition-level stats: Stored in the Iceberg manifest list, these stats describe the range of partition values for all the data in a given Iceberg manifest file. For a partition on day(event_timestamp), this would be the earliest and latest day present in the files tracked by that manifest.
Column-level stats: Stored in the manifest files, these are more granular stats about each individual data file. Data files in R2 Data Catalog are formatted using the Apache Parquet. For every column of a Parquet file, the manifest stores key information like:
The minimum and maximum values. If a query asks for http_status = 500, and a file’s stats show its http_status column has a min of 200 and a max of 404, that entire file can be skipped.
A count of null values. This allows the planner to skip files when a query specifically looks for non-null values (e.g., WHERE error_code IS NOT NULL) and the file’s metadata reports that all values for error_code are null.
Now, let’s see how the planner uses these stats as it walks through the metadata layers.
Pruning the search space
The pruning process is a top-down investigation that happens in three main steps:
Table metadata and the current snapshot
The planner begins by asking the catalog for the location of the current table metadata. This is a JSON file containing the table’s current schema, partition specs, and a log of all historical snapshots. The planner then fetches the latest snapshot to work with.
2. Manifest list and partition pruning
The current snapshot points to a single Iceberg manifest list. The planner reads this file and uses the partition-level stats for each entry to perform the first, most powerful pruning step, discarding any manifests whose partition value ranges don’t satisfy the query. For a table partitioned by day(event_timestamp), the planner can use the min/max values in the manifest list to immediately discard any manifests that don’t contain data for the days relevant to the query.
3. Manifests and file-level pruning
For the remaining manifests, the planner reads each one to get a list of the actual Parquet data files. These manifest files contain more granular, column-level stats for each individual data file they track. This allows for a second pruning step, discarding entire data files that cannot possibly contain rows matching the query’s filters.
4. File row-group pruning
Finally, for the specific data files that are still candidates, the Query Planner uses statistics stored inside Parquet file’s footers to skip over entire row groups.
The result of this multi-layer pruning is a precise list of Parquet files, and of row groups within those Parquet files. These become the query work units that are dispatched to the Query Execution system for processing.
The Planning pipeline
In R2 SQL, the multi-layer pruning we’ve described so far isn’t a monolithic process. For a table with millions of files, the metadata can be too large to process before starting any real work. Waiting for a complete plan would introduce significant latency.
Instead, R2 SQL treats planning and execution together as a concurrent pipeline. The planner’s job is to produce a stream of work units for the executor to consume as soon as they are available.
The planner’s investigation begins with two fetches to get a map of the table’s structure: one for the table’s snapshot and another for the manifest list.
Starting execution as early as possible
From that point on, the query is processed in a streaming fashion. As the Query Planner reads through the manifest files and subsequently the data files they point to and prunes them, it immediately emits any matching data files/row groups as work units to the execution queue.
This pipeline structure ensures the compute nodes can begin the expensive work of data I/O almost instantly, long before the planner has finished its full investigation.
On top of this pipeline model, the planner adds a crucial optimization: deliberate ordering. The manifest files are not streamed in an arbitrary sequence. Instead, the planner processes them in an order matching by the query’s ORDER BY clause, guided by the metadata stats. This ensures that the data most likely to contain the desired results is processed first.
These two concepts work together to address query latency from both ends of the query pipeline.
The streamed planning pipeline lets us start crunching data as soon as possible, minimizing the delay before the first byte is processed. At the other end of the pipeline, the deliberate ordering of that work lets us finish early by finding a definitive result without scanning the entire dataset.
The next section explains the mechanics behind this “finish early” strategy.
Stopping early: how to finish without reading everything
Thanks to the Query Planner streaming work units in an order matching the ORDER BY clause, the Query Execution system first processes the data that is most likely to be in the final result set.
This prioritization happens at two levels of the metadata hierarchy:
Manifest ordering: The planner first inspects the manifest list. Using the partition stats for each manifest (e.g., the latest timestamp in that group of files), it decides which entire manifest files to stream first.
Parquet file ordering: As it reads each manifest, it then uses the more granular column-level stats to decide the processing order of the individual Parquet files within that manifest.
This ensures a constantly prioritized stream of work units is sent to the execution engine. This prioritized stream is what allows us to stop the query early.
For instance, with a query like … ORDER BY timestamp DESC LIMIT 5, as the execution engine processes work units and sends back results, the planner does two things concurrently:
It maintains a bounded heap of the best 5 results seen so far, constantly comparing new results to the oldest timestamp in the heap.
It keeps a “high-water mark” on the stream itself. Thanks to the metadata, it always knows the absolute latest timestamp of any data file that has not yet been processed.
The planner is constantly comparing the state of the heap to the water mark of the remaining stream. The moment the oldest timestamp in our Top 5 heap is newer than the high-water mark of the remaining stream, the entire query can be stopped.
At that point, we can prove no remaining work unit could possibly contain a result that would make it into the top 5. The pipeline is halted, and a complete, correct result is returned to the user, often after reading only a fraction of the potentially matching data.
Currently, R2 SQL supports ordering on columns that are part of the table’s partition key only. This is a limitation we are working on lifting in the future.
Architecture
Query Execution
Query Planner streams the query work in bite-sized pieces called row groups. A single Parquet file usually contains multiple row groups, but most of the time only a few of them contain relevant data. Splitting query work into row groups allows R2 SQL to only read small parts of potentially multi-GB Parquet files.
The server that receives the user’s request and performs query planning assumes the role of query coordinator. It distributes the work across query workers and aggregates results before returning them to the user.
Cloudflare’s network is vast, and many servers can be in maintenance at the same time. The query coordinator contacts Cloudflare’s internal API to make sure only healthy, fully functioning servers are picked for query execution. Connections between coordinator and query worker go through Cloudflare Argo Smart Routing to ensure fast, reliable connectivity.
Servers that receive query execution requests from the coordinator assume the role of query workers. Query workers serve as a point of horizontal scalability in R2 SQL. With a higher number of query workers, R2 SQL can process queries faster by distributing the work among many servers. That’s especially true for queries covering large amounts of files.
Both the coordinator and query workers run on Cloudflare’s distributed network, ensuring R2 SQL has plenty of compute power and I/O throughput to handle analytical workloads.
Each query worker receives a batch of row groups from the coordinator as well as an SQL query to run on it. Additionally, the coordinator sends serialized metadata about Parquet files containing the row groups. Thanks to that, query workers know exact byte offsets where each row group is located in the Parquet file without the need to read this information from R2.
Apache DataFusion
Internally, each query worker uses Apache DataFusion to run SQL queries against row groups. DataFusion is an open-source analytical query engine written in Rust. It is built around the concept of partitions. A query is split into multiple concurrent independent streams, each working on its own partition of data.
Partitions in DataFusion are similar to partitions in Iceberg, but serve a different purpose. In Iceberg, partitions are a way to physically organize data on object storage. In DataFusion, partitions organize in-memory data for query processing. While logically they are similar – rows grouped together based on some logic – in practice, a partition in Iceberg doesn’t always correspond to a partition in DataFusion.
DataFusion partitions map perfectly to the R2 SQL query worker’s data model because each row group can be considered its own independent partition. Thanks to that, each row group is processed in parallel.
At the same time, since row groups usually contain at least 1000 rows, R2 SQL benefits from vectorized execution. Each DataFusion partition stream can execute the SQL query on multiple rows in one go, amortizing the overhead of query interpretation.
There are two ends of the spectrum when it comes to query execution: processing all rows sequentially in one big batch and processing each individual row in parallel. Sequential processing creates a so-called “tight loop”, which is usually more CPU cache friendly. In addition to that, we can significantly reduce interpretation overhead, as processing a large number of rows at a time in batches means that we go through the query plan less often. Completely parallel processing doesn’t allow us to do these things, but makes use of multiple CPU cores to finish the query faster.
DataFusion’s architecture allows us to achieve a balance on this scale, reaping benefits from both ends. For each data partition, we gain better CPU cache locality and amortized interpretation overhead. At the same time, since many partitions are processed in parallel, we distribute the workload between multiple CPUs, cutting the execution time further.
In addition to the smart query execution model, DataFusion also provides first-class Parquet support.
As a file format, Parquet has multiple optimizations designed specifically for query engines. Parquet is a column-based format, meaning that each column is physically separated from others. This separation allows better compression ratios, but it also allows the query engine to read columns selectively. If the query only ever uses five columns, we can only read them and skip reading the remaining fifty. This massively reduces the amount of data we need to read from R2 and the CPU time spent on decompression.
DataFusion does exactly that. Using R2 ranged reads, it is able to read parts of the Parquet files containing the requested columns, skipping the rest.
DataFusion’s optimizer also allows us to push down any filters to the lowest levels of the query plan. In other words, we can apply filters right as we are reading values from Parquet files. This allows us to skip materialization of results we know for sure won’t be returned to the user, cutting the query execution time further.
Returning query results
Once the query worker finishes computing results, it returns them to the coordinator through the gRPC protocol.
R2 SQL uses Apache Arrow for internal representation of query results. Arrow is an in-memory format that efficiently represents arrays of structured data. It is also used by DataFusion during query execution to represent partitions of data.
In addition to being an in-memory format, Arrow also defines the Arrow IPC serialization format. Arrow IPC isn’t designed for long-term storage of the data, but for inter-process communication, which is exactly what query workers and the coordinator do over the network. The query worker serializes all the results into the Arrow IPC format and embeds them into the gRPC response. The coordinator in turn deserializes results and can return to working on Arrow arrays.
Future plans
While R2 SQL is currently quite good at executing filter queries, we also plan to rapidly add new capabilities over the coming months. This includes, but is not limited to, adding:
Support for complex aggregations in a distributed and scalable fashion;
Tools to help provide visibility in query execution to help developers improve performance;
Support for many of the configuration options Apache Iceberg supports.
In addition to that, we have plans to improve our developer experience by allowing users to query their R2 Data Catalogs using R2 SQL from the Cloudflare Dashboard.
Given Cloudflare’s distributed compute, network capabilities, and ecosystem of developer tools, we have the opportunity to build something truly unique here. We are exploring different kinds of indexes to make R2 SQL queries even faster and provide more functionality such as full text search, geospatial queries, and more.
Try it now!
It’s early days for R2 SQL, but we’re excited for users to get their hands on it. R2 SQL is available in open beta today! Head over to ourgetting started guide to learn how to create an end-to-end data pipeline that processes and delivers events to an R2 Data Catalog table, which can then be queried with R2 SQL.
We’re excited to see what you build! Come share your feedback with us on ourDeveloper Discord.
Social media users are tired of losing their identity and data every time a platform shuts down or pivots. In the ATProto ecosystem — short for Authenticated Transfer Protocol — users own their data and identities. Everything they publish becomes part of a global, cryptographically signed shared social web. Bluesky is the first big example, but a new wave of decentralized social networks is just beginning. In this post I’ll show you how to get started, by building and deploying a fully serverless ATProto application on Cloudflare’s Developer Platform.
Why serverless? The overhead of managing VMs, scaling databases, maintaining CI pipelines, distributing data across availability zones, and securing APIs against DDoS attacks pulls focus away from actually building.
That’s where Cloudflare comes in. You can take advantage of our Developer Platform to build applications that run on our global network: Workers deploy code globally in milliseconds, KV provides fast, globally distributed caching, D1 offers a distributed relational database, and Durable Objects manage WebSockets and handle real-time coordination. Best of all, everything you need to build your serverless ATProto application is available on our free tier, so you can get started without spending a cent.
The ATProto ecosystem: a quick introduction
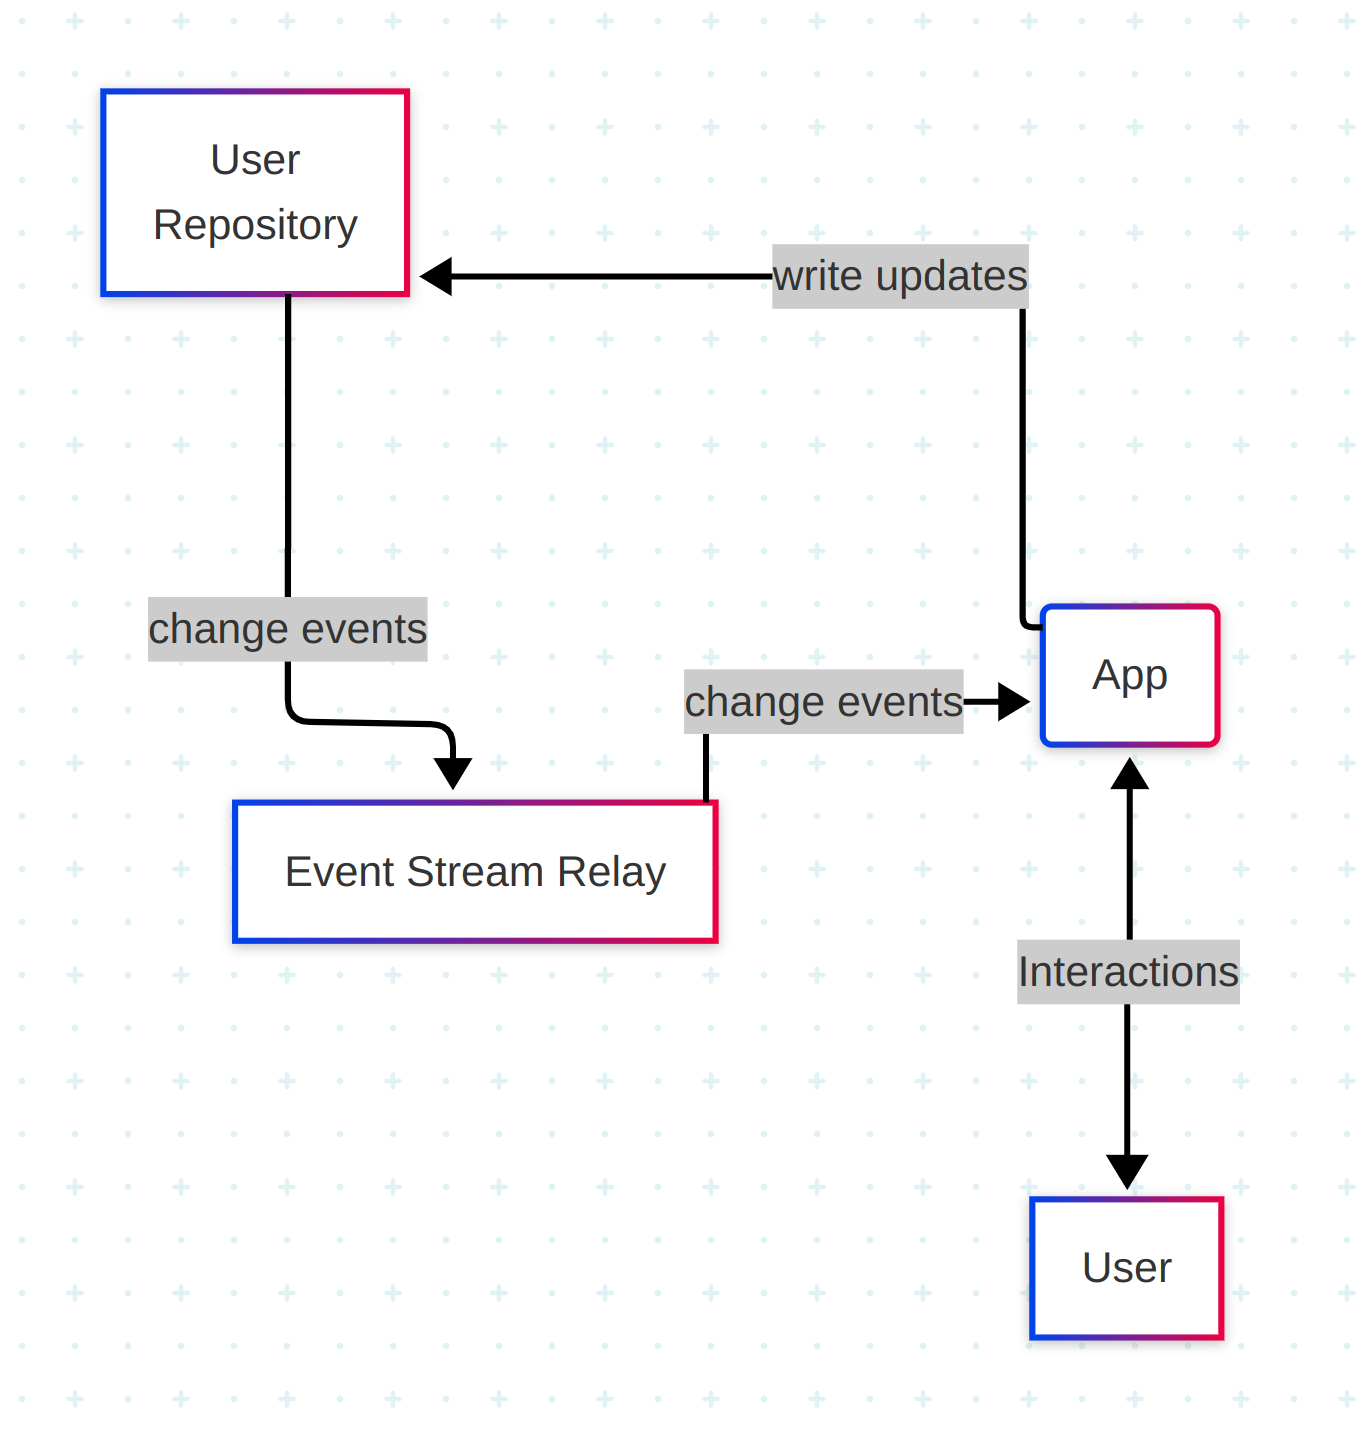
Let’s start with a conceptual overview of how data flows in the ATProto ecosystem:
Users interact with apps, which write updates to their personal repositories. Those updates trigger change events, which are published to a relay and broadcast through the global event stream. Any app can subscribe to these events — even if it didn’t publish the original update — because in ATProto, repos, relays, and apps are all independent components, which can be (and are) run by different operators.
Identity
User identity starts with handles — human-readable names like alice.example.com. Each handle must be a valid domain name, allowing the protocol to leverage DNS to provide a global view of who owns what account. Handles map to a user’s Decentralized Identifier (DID), which contains the location of the user’s Personal Data Server (PDS).
Authentication
A user’s PDS manages their keys and repos. It handles authentication and provides an authoritative view of their data via their repo.
What’s different here — and easy to miss — is how little any part of this stack relies on trust in a single service. DID resolution is verifiable. The PDS is user-selected. The client app is just an interface.
When we publish or fetch data, it’s signed and self-validating. That means any other app can consume or build on top of it without asking permission, and without trusting our backend.
Our application
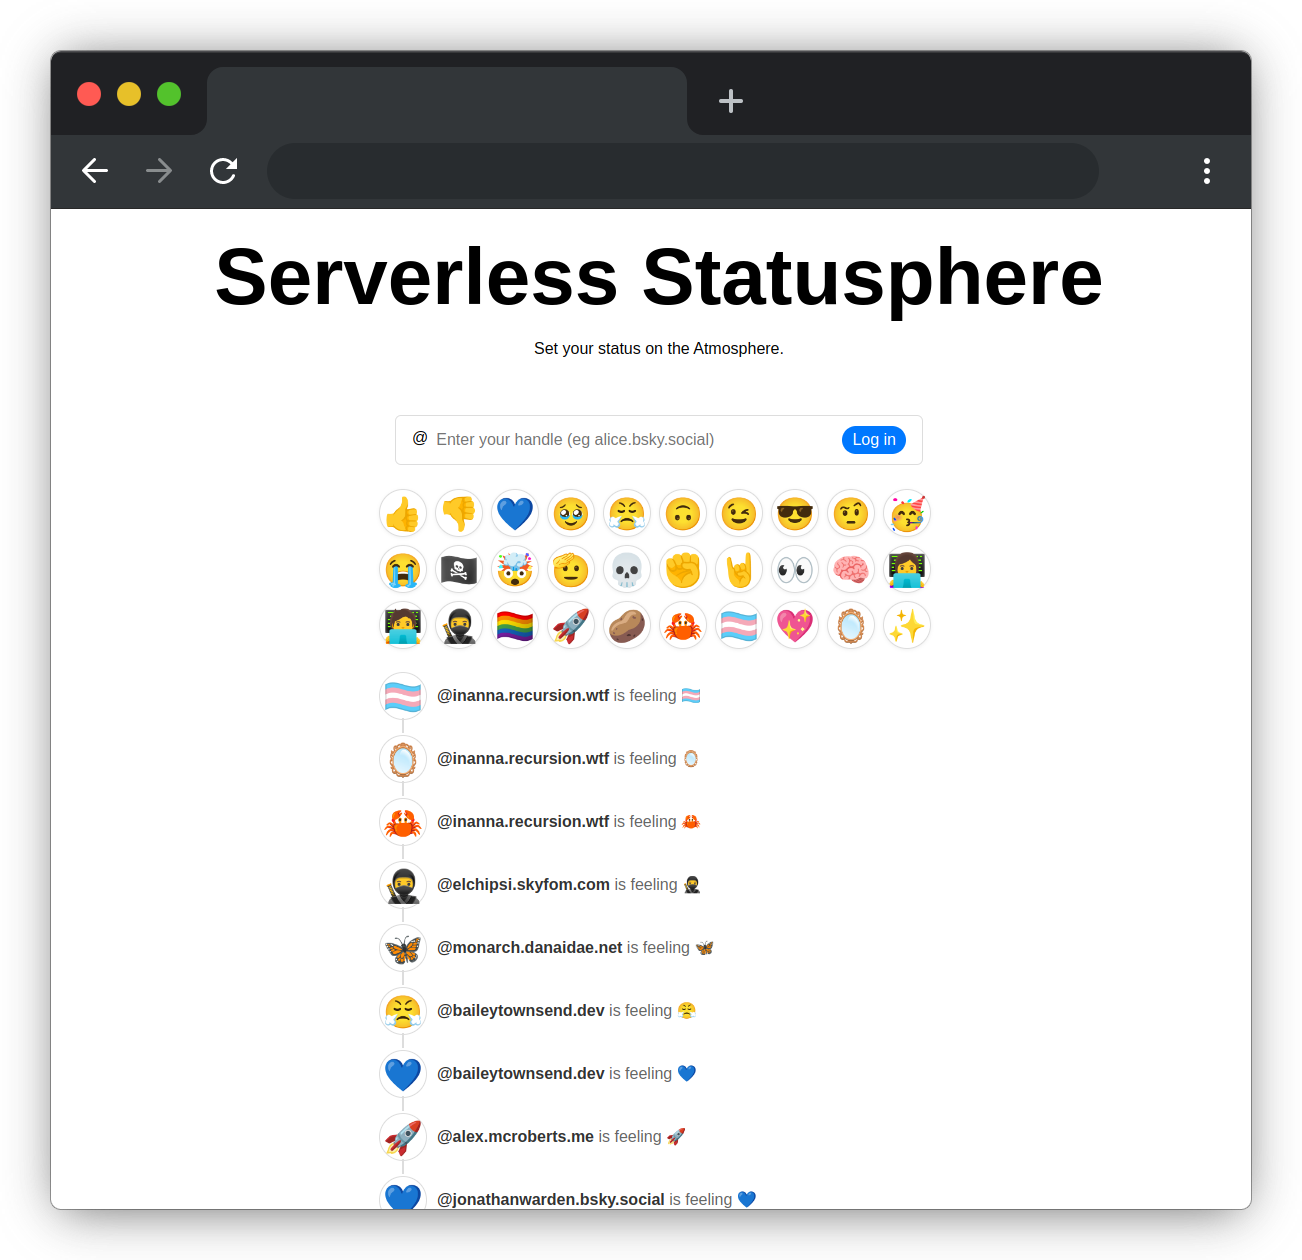
We’ll be working with Statusphere, a tiny but complete demo app built by the ATProto team. It’s the simplest possible social media app: users post single-emoji status updates. Because it’s so minimal, Statusphere is a perfect starting point for learning how decentralized ATProto apps work, and how to adapt them to run on Cloudflare’s serverless stack.
Statusphere schema
In ATProto, all repository data is typed using Lexicons — a shared schema language similar to JSON-Schema. For Statusphere, we use the xyz.statusphere.status record, originally defined by the ATProto team:
Lexicons are strongly typed, which allows for easy interoperability between apps.
How it’s built
In this section, we’ll follow the flow of data inside Statusphere: from authentication, to repo reads and writes, to real-time updates, and look at how we handle live event streams on serverless infrastructure.
1. Language choice
ATProto’s core libraries are written in TypeScript, and Cloudflare Workers provide first-class TypeScript support. It’s the natural starting point for building ATProto services on Cloudflare Workers.
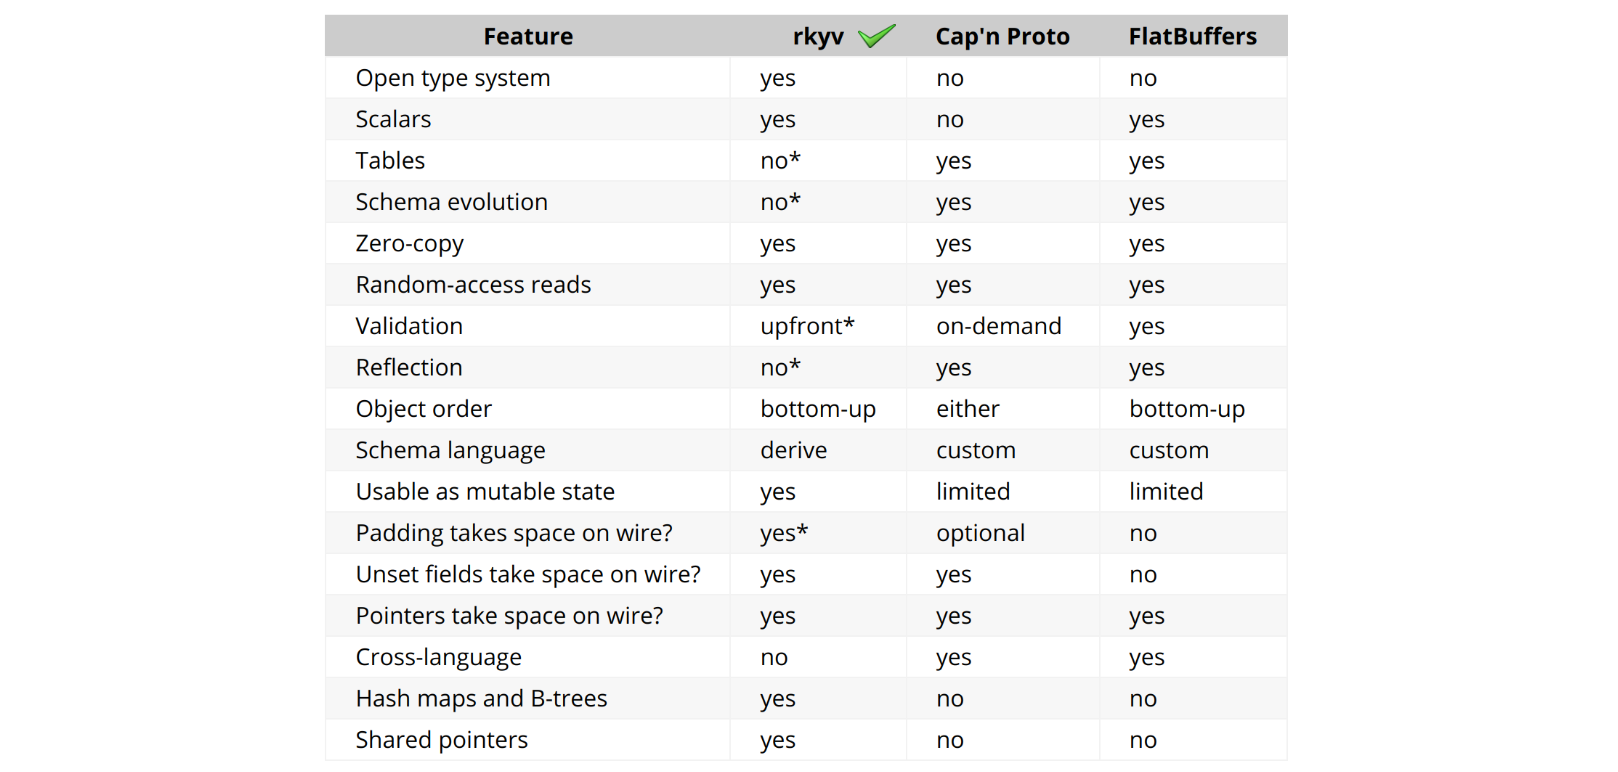
Cloudflare also supports Rust in Workers via WASM cross-compilation, so I tried that next. The ATProto Rust crates and codegen tooling make strong use of Rust’s type system and build tooling, but they’re still in active development. Rust’s WASM ecosystem is solid, though, so I was able to get a working prototype running quickly by adapting an existing Rust implementation of Statusphere — originally written by Bailey Townsend. You can find the code in this GitHub repo.
If you’re building ATProto apps on Cloudflare Workers, I’d suggest contributing to the TypeScript libraries to better support serverless runtimes. A TypeScript version of this app would be a great next step — if you’re interested in building it, please get in touch via the Cloudflare Developer Discord server.
2. Follow along
Use this Deploy to Cloudflare button to clone the repo and set up your own KV and D1 instances and a CI pipeline.
Follow the steps at this link, use the default values or choose custom names, and it’ll build and deploy your own Statusphere Worker.
Note: this project includes a scheduled component that reads from the public event stream. You may wish to delete it when you finish experimenting to save resources.
3. Resolving the user’s handle
To interact with a user’s data, we start by resolving their handle to a DID using the record registered at the _atproto subdomain. For example, my handle is inanna.recursion.wtf, so my DID record is stored at _atproto.inanna.recursion.wtf. The value of that record is did:plc:p2sm7vlwgcbbdjpfy6qajd4g.
We then resolve the DID to its corresponding DID Document, which contains identity metadata including the location of the user’s Personal Data Server. Depending on the DID method, this resolution is handled directly via DNS (for did:web identifiers) or, more frequently, via the Public Ledger of Credentials for did:plc identifiers.
Since these values don’t change frequently, we cache them using Cloudflare KV — it’s perfect for cases like this, where we have some infrequently updated but frequently read key-value mapping that needs to be globally available with low latency.
From the DID document, we extract the location of the user’s Personal Data Server. In my case, it’s bsky.social, but other users may self-host their own PDS or use an alternative provider.
The details of the OAuth flow aren’t important here — you can read the code I used to implement it or dig into the OAuth spec if you’re curious — but the short version is: the user signs in via their PDS, and it grants our app permission to act on their behalf, using the signing keys it manages.
We persist session data in a secure session cookie using tower-sessions. This means that only an opaque session ID is stored client-side, and all session/oauth state data is stored in Cloudflare KV. Again, it’s a natural fit for this use case.
When a user posts a new emoji status, we create a new record in their personal repo — using the same authenticated agent we used to fetch their data. This time, instead of reading, we perform a create record operation:
let uri = agent.create_status(form.status.clone()).await?.uri;
The operation returns a URI — the canonical identifier for the new record.
We then write the status update into D1, so it can immediately be reflected in the UI.
6. Using Durable Objects to broadcast updates
Every active homepage maintains a WebSocket connection to a Durable Object, which acts as a lightweight real-time message broker. When idle, the Durable Object hibernates, saving resources while keeping the WebSocket connections alive. We send a message to the Durable Object to wake it up and broadcast the new update:
for ws in self.state.get_websockets() {
    ws.send(&status);
}
It then iterates over every live WebSocket and sends the update.
One practical note: Durable Objects perform better when sharded across instances. For simplicity, I’ve described the case where everything runs everything through one single Durable Object.
To scale beyond that, the next step would be using multiple Durable Object instances per supported location using location hints, to minimize latency for users around the globe and avoid bottlenecks if we encounter high numbers of concurrent users in a single location. I initially considered implementing this pattern, but it conflicted with my goal of creating a concise ‘hello world’ style example that ATProto devs could clone and use as a template for their app.
7. Listening for live changes
The challenge: realtime feeds vs serverless
Publishing updates inside our own app is easy, but in the ATProto ecosystem, other applications can publish status updates for users. If we want Statusphere to be fully integrated, we need to pick up those events too.
Listening for live event updates requires a persistent WebSocket connection to the ATProto Jetstream service. Traditional server-based apps can keep WebSocket client sockets open indefinitely, but serverless platformscan’t — workers aren’t allowed to run forever.
We need a way to “listen” without running a live server.
The solution: Cloudflare worker Cron Triggers
To solve this, we moved the listening logic into a Cron Trigger — instead of keeping a live socket open, we used this feature to read updates in small batches using a recurring scheduled job.
When the scheduled worker invocation fires, it loads the last seen cursor from its persistent storage. Then it connects to Jetstream — a streaming service for ATProto repo events — filtered by the xyz.statusphere.status collection and starting at the last seen cursor.
let ws = WebSocket::connect("wss://jetstream1.us-east.bsky.network/subscribe?wantedCollections=xyz.statusphere.status&cursor={cursor}").await?;
We store a cursor — a microsecond timestamp marking the last message we received — in the Durable Object’s persistent storage, so even if the object restarts, it knows exactly where to resume. As soon as we process an event newer than our start time, we close the WebSocket connection and let the Durable Object go back to sleep.
The tradeoff: updates can lag by up to a minute, but the system stays fully serverless. This is a great fit for early-stage apps and prototypes, where minimizing infrastructure complexity matters more than achieving perfect real-time delivery.
Optional upgrade: real-time event listener
If you want real time updates, and you’re willing to bend the serverless model slightly, you can deploy a lightweight listener process that maintains a live WebSocket connection to Jetstream.
Instead of polling once a minute, this process listens for new events for the xyz.statusphere.status collection and pushes updates to our Cloudflare Worker as soon as they arrive. When this mode is active, we disable the Cron Trigger step with an environment variable. You can find a sketch of this listener process here and the endpoint that handles updates from it here.
The result still isn’t a traditional server:
No public exposure to the web
No open HTTP ports
No persistent database
It’s just a single-purpose, stateless listener — something simple enough to run on a home server until your app grows large enough to need more serious infrastructure.
Later on, you could swap this design for something more scalable using tools like Cloudflare Queues to provide batching and retries — but for small-to-medium apps, this lightweight listener is an easy and effective upgrade.
Looking ahead
Today, Durable Objects can hibernate while holding long-lived WebSocket server connections but don’t support hibernation when holding long-lived WebSocket client connections (like a Jetstream listener). That’s why Statusphere uses workarounds — scheduled Worker invocations via Cron Trigger and lightweight external listeners — to stay synced with the network.
Future improvements to Durable Objects — like adding support for hibernating active WebSocket clients — could remove the need for these workarounds entirely.
Build your own ATProto app
This is a full-featured atproto app running entirely on Cloudflare with zero servers and minimal ops overhead. Workers run your code within 50 ms of most users, KV and D1 keep your data available, and Durable Objects handle WebSocket fan-out and live coordination.
Use the Deploy to Cloudflare Button to clone the repo and set up your serverless environment. Then show us what you build. Drop a link in our Discord, or tag @cloudflare.social on Bluesky or @CloudflareDev on X — we’d love to see it.
The Integrity Data Platform (IDP) team decided to rewrite one of our heavy Queries Per Second (QPS) Golang microservices in Rust. It resulted in 70% infrastructure savings at a similar performance, but was not without its pitfalls. This article will elaborate on:
How we picked what to rewrite in Rust.
Approach taken to tackle the rewrite.
The pitfalls and speed bumps along the way.
Was it worthwhile?
Introduction
Grab is predominantly based on a microservice architecture, with the vast majority of microservices being hosted in a monorepo and written in Golang. It has served the company well so far, as the “simplicity” of Golang allows developers to ramp up and iterate quickly.
However, Rust has seen some gradual adoption across the company. Starting with a few minor CLIs, which then progressed to notable success with a Rust-based reverse proxy in Catwalk for model serving. Additionally, a growing community of Rust enthusiasts within the organisation has expressed interest in advocating for and expanding the adoption of Rust more proactively.
After achieving success with several projects on the ML platform and addressing concerns about Rust’s ability to handle traffic at scale, the next logical step was to assess the Return on Investment (ROI) of rewriting a Golang microservice in Rust.
Background
Rust has the reputation of being highly efficient yet poses a steep learning curve. Rust is often touted to perform close to C, doing away with garbage collection while remaining memory safe through strict compile checks and the borrow checker. It is loved by developers for having rich features like being multi-paradigm (supporting both functional and OOP style), having a rich type system, and doing away with nil pointers and errors.
However, regardless of how well regarded a certain language is in the industry, rewrites of any system should always be considered very carefully. When it comes to “legacy software”, there is a prevalent assumption that rewriting legacy software is a solution to eliminate technical debt and phase out legacy systems. The reality is often more nuanced.
Legacy code occurs when the developers who originally wrote the code are no longer working on the project. There are often business logic and edge-cases baked into complex legacy codebases of which the context has been lost over time. In practice, rewrites frequently take longer than anticipated and tend to reintroduce bugs and edge cases that must be identified and resolved all over again.
Rewriting vs refactoring has been written at length across the internet, you can read more about it here.
The trade-offs of rewriting need to be properly weighed and balanced. It must take into consideration:
How much engineering bandwidth goes into the rewrite?
What is the complexity of the rewrite?
What tangible benefits are brought about by the rewrite?
Rewriting a system solely for the purpose of “rewriting it in Rust” is not a strong enough business justification.
A legitimate concern was the steep learning curve of Rust, coupled with the risk of having only one team member proficient in the language, which would make its adoption unsustainable.
Therefore, we established a set of guidelines to follow when identifying a suitable system for a potential rewrite:
The system must be “simple” enough in functionality. For example, it has one or two main functionalities that can be rewritten in a reasonable amount of time and have its complexity constrained.
The system targeted should have large enough traffic such that cost savings brought about by adopting Rust is something tangible when balanced against the effort.
The members of the team must be comfortable and willing to pick up the language and achieve a certain level of familiarity to make maintaining the service sustainable.
Finding the right service
The ideal service should have a sufficiently large infrastructure footprint to justify the potential cost savings, while also being straightforward in functionality to minimise time spent on handling edge cases and complex business logic.
Looking across the stack of microservices in Integrity, Counter Service stands out. As its name implies, Counter Service is a service that “counts” and serves the counters for ML models and fraud rules. The original service has two primary functionalities:
Consuming from streams, counting events and writing to Scylla.
Exposing Google Remote Procedure Call (GRPC) endpoints to query from Scylla (and Redis) and return counts of events based on query keys. For example, BatchRead. BatchRead’s functionality of Counter Service serves up to tens of thousands of QPS at peak and is fairly constrained in functionality. Hence, it fulfilled our target criteria of being “simple” in functionality yet serving a large enough amount of traffic that justifies the ROI of a rewrite.
Figure 1: BatchRead flow of Counter Service, reading data from Scylla, DynamoDB, Redis, MySQL and serving the counters through GRPC.
Rewrite approach
There are a few ways to approach a rewrite in another language. One popular way is to convert your code line by line. If the languages are close enough, it might even be possible to programmatically convert your code like C2Rust.
We decided not to use such an approach for our rewrite. The major reason is that idiomatic Golang was not necessarily idiomatic Rust. We wanted to approach this rewrite with a fresh perspective and treat this as a true rewrite.
We treated the application like a black box, with the interfaces well defined, like GRPC endpoints and contracts. Similar to a function, you could call the API and get a deterministic result, and we had the data that was stored in Scylla.
Based on how we understood the application to work based on its specs and contract, we chose to rewrite the application logic from scratch to meet the API contract and to get as close as identical outputs from the new black box.
OSS library support
We started out by mapping out the key external dependencies and checking how well they were supported in the Rust ecosystem and in open source.
All the functionality we need is available through libraries in the Rust ecosystem. However, we found that some libraries are not particularly “popular,” as indicated by their relatively low number of GitHub stars.
The practical concern with using less “popular” libraries is the risk of limited community support or potential abandonment over time. That said, if an “unpopular” library is officially maintained by the associated open-source project—for instance, the Scylla driver has only about 500 stars but is officially provided by the Scylla project—we would need to ensure confidence that it will continue to receive active support.
Out of the list of libraries above, the “unpopular” and unofficial libraries can be narrowed down to two libraries:
Datadog – Cadence
Redis – Fred
For Datadog, there is no “official” Datadog Rust client. Yet, we picked Cadence as the API looked intuitive and the features we needed were already supported.
In regards to Redis, after testing it, we discovered that the support was not up to par with our requirements. We then opted for a newer and less popular library, fred.rs that seemed to be actively being developed by the community.
Company specific internal libraries
With the vast majority of microservices being written in Golang, most internal libraries are also written in Golang. Opting to rewrite a service in Rust means we are not able to use these internal libraries.
Examples include:
An internal configuration library that utilises Go Templates to template configurations for different environments (staging and production).
The internal configuration library has its own wrappers and injectors to pull and render secrets.
To overcome this gap and re-use Go Templates and configuration language, we decided to write a simple wrapper and parser using the nom parser combinator to parse the templates and render the config.
Nom poses a steep learning curve. But once familiarised, it is flexible and performant enough to build an equivalent to the internal library. Parser combinators are an interesting subset of tooling that allows you to create some fairly elegant parsers.
Road bumps
The borrow checker
One of the most striking paradigm shifts for developers transitioning to Rust is adapting to the strict rules of the borrow checker, which enforces that variables cannot be reused multiple times unless explicitly cloned or borrowed.
Interestingly, the borrow checker was not the biggest hurdle for new developers. The key is to avoid introducing lifetimes too early in the development process, as this can lead to premature code optimisation.
In many cases, adding a few clones (and occasionally Arcs) can help new developers get up to speed and iterate more quickly during development. The resulting code is usually “fast” enough for initial purposes. After that, the code can be revisited to eliminate unnecessary clones for improved performance. An efficient approach to this can be taken by using Flamegraph to profile your code and identify memory allocation bottlenecks.
Async gotchas
When rewriting Golang logic in Rust, there are fundamental differences in how they treat concurrency and parallelism.
One of Golang’s most remarkable strengths is its ability to deliver high-performance concurrency while preserving simplicity.
There are two fundamental approaches to concurrency in programming languages, namely:
Preemptive scheduling (stackful coroutines).
Cooperative scheduling (stackless coroutines).
Preemptive vs cooperative scheduling is an in-depth topic with the gist of it being, Golang uses preemptive scheduling and each “Goroutine” has a stack that needs a runtime. The Golang scheduler has the power to “preempt” and “freeze” functions and switch to another stack like stackful coroutine. This is a gross oversimplification of the nuances. For more details, this is a good introduction to the topic.
Rust opts for cooperative scheduling whereby it has no runtime and each coroutine does not maintain a stack. Hence, it has no ability to “freeze” a function and swap context. This allows Rust to be more efficient in terms of memory and resources, as it maintains a state machine. However, the consequence is that this moves the complexity up the stack to the programming language itself. Similar to Javascript, functions are “coloured”, and the developer has to explicitly annotate their functions to be async or sync. Await points need to be explicitly called and control needs to be “yielded” (i.e. cooperative and stackless) so the Rust program knows when it is allowed to stop and swap between coroutines. To read more on this, refer to this and this article for the history of async Rust.
Needing to annotate a function is a classic complaint that is addressed in the article “What Colour is Your Function” that highlights developers’ responsibility to explicitly colour their function and consciously think about blocking vs non-blocking code.
Contrast this with Golang, where you simply need to add the go keyword without thinking about which code might block the execution and use channels to communicate across Goroutines. Golang allows the developer to achieve high performance without much cognitive overhead.
This is especially important for developers new to Rust. As the lack of experience in async and blocking code can be somewhat of a footgun. In the initial rewrite of Rust, we made an amateur mistake of using a synchronous Redis function to call the Redis cache. It resulted in the application performing poorly until we corrected it with the non-blocking asynchronous version using the Fred redis library.
Impact
Following the eventful process of rewriting the service from the ground up in Rust, the outcomes proved to be quite intriguing.
Shadowing traffic to both services as seen in Figure 2, the P99 latency is similar (or perhaps even slightly worse) in the Rust service compared to the original Golang one.
Figure 2: P99 latency comparison between the Golang service (purple) and Rust service (blue).
Normalising the QPS and resource consumption, we see from Table 2 that Rust consumes ~20% of the resources of the original Golang application, resulting in 5x savings in terms of resource consumption.
Table 2: Comparison of resource consumption between Rust and Golang service.
Service
Indicative QPS
Resources
Original Golang Service
1,000
20 Cores
New Rust Service
1,000
4.5 Cores
Learnings and conclusion
The outcomes and insights from this rewrite have been eye-opening, debunking certain myths while also validating others.
Myth 1: Rust is blazingly fast! Faster than Golang!
Verdict: Disproved.
Golang is “fast enough” for most use cases. It’s a mature language built with concurrency at its core, and it performs exceptionally well in its intended domain. While Rust can outperform Golang due to its higher performance ceiling and finer-grained control, rewriting a Golang service in Rust solely for performance improvements is unlikely to yield significant benefits.
Myth 2: Rust is more efficient than Golang
Verdict: True.
Rewriting a Golang service in Rust will probably give you 50% savings in compute. Rust does fulfill its promise of being memory safe without garbage collection, allowing it to be one of the more efficient languages out there. This is in line with other discoveries in the market.
Myth 3: The learning curve of Rust is too high
Verdict: It depends.
Pure synchronous Rust is fine. As long as you don’t overcomplicate the code and only clone what is needed, it is mostly true. The language is easy enough to pick up for most experienced developers. Even with cloning sprinkled in, the code is usually “fast enough”. The compiler is a good teacher, the compiler error messages are amazing, and if your code compiles, it probably works. Also, the Clippy linter is amazing.
However, introducing async can be challenging. Async is something quite different from what you would encounter in other languages like Go. Improper use of blocking code in async code can result in nuanced bugs that can catch inexperienced Rust developers off-guard.
Evaluating the worth of the rewrite
Yes, the effort was worth it for this service. The trade-off between development effort spent and the cost savings were justified.
As a side effect, the service is 80% cheaper and probably more bug free, as Rust eliminates a class of common Golang errors like Null pointers and concurrent map writes by virtue of the design of the language. If your code compiles, you usually have the confidence that it will work as you expect due to the language being more explicit.
Would we encourage choosing Rust over Golang for new microservices? Absolutely, as the resulting service is likely to be at least 50% more efficient than its Go counterpart. However, this decision presents an important and exciting opportunity for management and leaders to invest in empowering their engineers by equipping them with the skills to master Rust’s unique concepts, such as Async and Lifetimes. While the initial development pace might be slower as the team builds proficiency, this investment can unlock long-term benefits. Once the workforce is skilled in Rust, development speed should align with expectations, and the resulting systems are likely to be more stable and secure, thanks to Rust’s inherent safety features.
Join us
Grab is a leading superapp in Southeast Asia, operating across the deliveries, mobility and digital financial services sectors. Serving over 800 cities in eight Southeast Asian countries, Grab enables millions of people everyday to order food or groceries, send packages, hail a ride or taxi, pay for online purchases or access services such as lending and insurance, all through a single app. Grab was founded in 2012 with the mission to drive Southeast Asia forward by creating economic empowerment for everyone. Grab strives to serve a triple bottom line – we aim to simultaneously deliver financial performance for our shareholders and have a positive social impact, which includes economic empowerment for millions of people in the region, while mitigating our environmental footprint.
Powered by technology and driven by heart, our mission is to drive Southeast Asia forward by creating economic empowerment for everyone. If this mission speaks to you, join our team today!
Any public certification authority (CA) can issue a certificate for any website on the Internet to allow a webserver to authenticate itself to connecting clients. Take a moment to scroll through the list of trusted CAs for your web browser (e.g., Chrome). You may recognize (and even trust) some of the names on that list, but it should make you uncomfortable that any CA on that list could issue a certificate for any website, and your browser would trust it. It’s a castle with 150 doors.
Certificate Transparency (CT) plays a vital role in the Web Public Key Infrastructure (WebPKI), the set of systems, policies, and procedures that help to establish trust on the Internet. CT ensures that all website certificates are publicly visible and auditable, helping to protect website operators from certificate mis-issuance by dishonest CAs, and helping honest CAs to detect key compromise and other failures.
In this post, we’ll discuss the history, evolution, and future of the CT ecosystem. We’ll cover some of the challenges we and others have faced in operating CT logs, and how the new static CT API log design lowers the bar for operators, helping to ensure that this critical infrastructure keeps up with the fast growth and changing landscape of the Internet and WebPKI. We’re excited to open source our Rust implementation of the new log design, built for deployment on Cloudflare’s Developer Platform, and to announce test logs deployed using this infrastructure.
What is Certificate Transparency?
In 2011, the Dutch CA DigiNotar was hacked, allowing attackers to forge a certificate for *.google.com and use it to impersonate Gmail to targeted Iranian users in an attempt to compromise personal information. Google caught this because they used certificate pinning, but that technique doesn’t scale well for the web. This, among other similar attacks, led a team at Google in 2013 to develop Certificate Transparency (CT) as a mechanism to catch mis-issued certificates. CT creates a public audit trail of all certificates issued by public CAs, helping to protect users and website owners by holding CAs accountable for the certificates they issue (even unwittingly, in the event of key compromise or software bugs). CT has been a great success: since 2013, over 17 billion certificates have been logged, and CT was awarded the prestigious Levchin Prize in 2024 for its role as a critical safety mechanism for the Internet.
Let’s take a brief look at the entities involved in the CT ecosystem. Cloudflare itself operates the Nimbus CT logs and the CT monitor powering the Merkle Towndashboard.
Certification Authorities (CAs) are organizations entrusted to issue certificates on behalf of website operators, which in turn can use those certificates to authenticate themselves to connecting clients.
CT-enforcing clients like the Chrome, Safari, and Firefox browsers are web clients that only accept certificates compliant with their CT policies. For example, a policy might require that a certificate includes proof that it has been submitted to at least two independently-operated public CT logs.
Log operators run CT logs, which are public, append-only lists of certificates. CAs and other clients can submit a certificate to a CT log to obtain a “promise” from the CT log that it will incorporate the entry into the append-only log within some grace period. CT logs periodically (every few seconds, typically) update their log state to incorporate batches of new entries, and publish a signed checkpoint that attests to the new state.
Monitors are third parties that continuously crawl CT logs and check that their behavior is correct. For instance, they verify that a log is self-consistent and append-only by ensuring that when new entries are added to the log, no previous entries are deleted or modified. Monitors may also examine logged certificates to help website operators detect mis-issuance.
Challenges in operating a CT log
Despite the success of CT, it is a less than perfect system. Eric Rescorla has an excellent writeup on the many compromises made to make CT deployable on the Internet of 2013. We’ll focus on the operational complexities of running a CT log.
Let’s look at the requirements for running a CT log from Chrome’s CT log policy (which are more or less mirrored by those of Safari and Firefox), and what can go wrong. The requirements center around integrity and availability.
To be considered a trusted auditing source, CT logs necessarily have stringent integrity requirements. Anything the log produces must be correct and self-consistent, meaning that a CT log cannot present two different views of the log to different clients, and must present a consistent history for its entire lifetime. Similarly, when a CT log accepts a certificate and promises to incorporate it by returning a Signed Certificate Timestamp (SCT) to the client, it must eventually incorporate that certificate into its append-only log.
The integrity requirements are unforgiving. A single bit-flip due to a hardware failure or cosmic ray can (andhas) caused logs to produce incorrect results and thus be disqualified by CT programs. Even software updates to running logs can be fatal, as a change that causes a correctness violation cannot simply be rolled back. Perhaps the greatest risk to individual log integrity is failing to incorporate certificates for which they issued SCTs, for example if they fail to commit those pending certificates to durable storage. See Andrew Ayer’s great synopsis for more examples of CT log failures (up to 2021).
A CT log must also meet certain availability requirements to effectively provide its core functionality as a publicly auditable log. Clients must be able to reliably retrieve log data — Chrome’s policy requires a minimum of 99% average uptime over a 90-day rolling period for each API endpoint — and any entries for which an SCT has been issued must be incorporated into the log within the grace period, called the Maximum Merge Delay (MMD), 24 hours in Chrome’s policy.
The design of the current CT log read APIs puts strain on the ability of log operators to meet uptime requirements. The API endpoints are dynamic and not easily cacheable without bespoke caching rules that are aware of the CT API. For instance, the get-entries endpoint allows a client to request arbitrary ranges of entries from a log, and the get-proof-by-hash requires the server to construct inclusion proofs for any certificate requested by the client. To serve these requests, CT log servers need to be backed by databases easily 5-10TB in size capable of serving tens of millions of requests per day. This increases operator complexity and expense, not to mention the high cost of bandwidth of serving these requests.
MMD violations are unfortunately not uncommon. Cloudflare’s own Nimbus logs have experienced prolonged outages in the past, most recently in November 2023 due to complete power loss in the datacenter running the logs. During normal log operation, if the log accepts entries more quickly than it incorporates them, the backlog can grow to exceed the MMD. Log operators can remedy this by rate-limiting or temporarily disabling the write APIs, but this can in turn contribute to violations of the uptime requirements.
The high bar for log operation has limited the organizations operating CT logs to only Cloudflare and five others! Losing one or two logs is enough to compromise the stability of the CT ecosystem. Clearly, a change is needed.
A next-generation CT log design
In May 2024, Let’s Encrypt announcedSunlight, an implementation of a next-generation CT log designed for the modern WebPKI, incorporating a decade of lessons learned from running CT and similar transparency systems. The new CT log design, called the static CT API, is partially based on the Go checksum database, and organizes log data as a series of tiles that are easy to cache and serve. The new design provides efficiency improvements that cut operation costs, help logs to meet availability requirements, and reduce the risk of integrity violations.
The static CT API is split into two parts, the monitoring APIs (so named because CT monitors are the primary clients), and the submission APIs for adding new certificates to the log.
The monitoring APIs replace the dynamic read APIs of RFC 6962, and organize log data into static, cacheable tiles. (See Russ Cox’s blog post for an in-depth explanation of tiled logs.) CT log operators can efficiently serve static tiles from S3-compatible object storage buckets and cache them using CDN infrastructure, without needing dedicated API servers. Clients can then download the necessary tiles to retrieve specific log entries or reconstruct arbitrary proofs.
The static CT API introduces another efficiency by deduplicating intermediate and root “issuer” certificates in a log entry’s certificate chain. The number of publicly-trusted issuer certificates is small (in the low thousands), so instead of storing them repeatedly for each log entry, only the issuer hash is stored. Clients can look up issuer certificates by hash from a separate endpoint.
The submission APIs remain backwards-compatible with RFC 6962, meaning that TLS clients and CAs can submit to them without any changes. However, there is one notable addition: the static CT specification requires logs to hold on to requests as it batches and sequences them, and responds with an SCT only after entries have been incorporated into the log. The specification defines a required SCT extension indicating the entry’s index in the log. At the cost of slightly delayed SCT issuance (on the order of seconds), this change eliminates one of the major pain points of operating a CT log (the Merge Delay).
Having the log index of a certificate available in an SCT enables further efficiencies. SCT auditing refers to the process by which TLS clients or monitors can check if a log has fulfilled its promise to incorporate a certificate for which it has issued an SCT. In the RFC 6962 API, checking if a certificate is present in a log when you don’t already know the index requires using the get-proof-by-hash endpoint to look up the entry by the certificate hash (and the server needs to maintain a mapping from hash to index to efficiently serve these requests). Instead, with the index immediately available in the SCT, clients can directly retrieve the specific log data tile covering that index, even with efficient privacy-preserving techniques.
Since it was announced, the static CT API has taken the CT ecosystem by storm. Aside from Sunlight and our brand new Azul (discussed below), there are at least two other independent implementations, Itko and Trillian Tessera. Several CT monitors (including crt.sh, certspotter, Censys, and our own Merkle Town) have added support for the new log format, and as of April 1, 2025, Chrome has begun accepting submissions for static CT API logs into their CT log program.
A static CT API implementation on Workers
This section discusses how we designed and built our static CT log implementation, Azul (short for azulejos, the colorful Portuguese and Spanish ceramic tiles). For curious readers and prospective CT log operators, we encourage you to follow the instructions in the repo to quickly set up your own static CT log. Questions and feedback in the form of GitHub issues are welcome!
The advent of the static CT API gave us the perfect opportunity to rethink how we run our CT logs. There were a few design decisions we made early on to shape the project.
First and foremost, we wanted to run our CT logs on our distributed global network. Especially after the painful November 2023 control plane outage, there’s been a push to deploy services on our highly available and resilient network instead of running in centralized datacenters.
Second, with Cloudflare’s deeply engrained culture of dogfooding (building Cloudflare on top of Cloudflare), we decided to implement the CT log on top of Cloudflare’s Developer Platform and Workers.
Dogfooding gives us an opportunity to find pain points in our product offerings, and to provide feedback to our development teams to improve the developer experience for everyone. We restricted ourselves to only features and default limits generally available to customers, so that we could have the same experience as an external Cloudflare developer, and would produce an implementation that anyone could deploy.
Another major design decision was to implement the CT log in Rust, a modern systems programming language with static typing and built-in memory safety that is heavily used across Cloudflare, and which already has mature (if sometimes lacking full feature parity) Workers bindings that we have used to build several production services. This also provided us with an opportunity to produce Rust crates porting Go implementations of various C2SP specifications that can be reused across other projects.
For the new logs to be deployable, they needed to be at least as performant as existing CT logs. As a point of reference, the Nimbus2025 log currently handles just over 33 million requests per day (~380/s) across the read APIs, and about 6 million per day (~70/s) across the write APIs.
Implementation
We based Azul heavily on Sunlight, a Go application built for deployment as a standalone server. As such, this section serves as a reference for translating a traditional server to Cloudflare’s serverless platform.
To start, let’s briefly review the Sunlight architecture (described in more detail in the README and original design doc). A Sunlight instance is a single Go process, serving one or multiple CT logs. It is backed by three different storage locations with different properties:
A “lock backend” which stores the current checkpoint for each log. This datastore needs to be strongly consistent, but only stores trivial amounts of data.
A per-log object storage bucket from which to serve tiles, checkpoints, and issuers to CT clients. This datastore needs to be strongly consistent, and to handle multiple terabytes of data.
A per-log deduplication cache, to return SCTs for previously-submitted (pre-)certificates. This datastore is best-effort (as duplicate entries are not fatal to log operation), and stores tens to hundreds of gigabytes of data.
Two major components handle the bulk of the CT log application logic:
A frontend HTTP server handles incoming requests to the submission APIs to add new certificates to the log, validates them, checks the deduplication cache, adds the certificate to a pool of entries to be sequenced, and waits for sequencing to complete before responding to the client.
The sequencer periodically (every 1s, by default) sequences the pool of pending entries, writes new tiles to the object backend, persists the latest checkpoint covering the new log state to the lock and object backends, and signals to waiting requests that the pool has been sequenced.
A static CT API log running on a traditional server using the Sunlight implementation.
Next, let’s look at how we can translate these components into ones suitable for deployment on Workers.
Making it work
Let’s start with the easy choices. The static CT monitoring APIs are designed to serve static, cacheable, compressible assets from object storage. The API should be highly available and have the capacity to serve any number of CT clients. The natural choice is Cloudflare R2, which provides globally consistent storage with capacity for large data volumes, customizability to configure caching and compression, and unbounded read operations.
A static CT API log running on Workers using a preliminary version of the Azul implementation which ran into performance limitations.
The static CT submission APIs are where the real challenge lies. In particular, they allow CT clients to submit certificate chains to be incorporated into the append-only log. We used Workers as the frontend for the CT log application. Workers run in data centers close to the client, scaling on demand to handle request load, making them the ideal place to run the majority of the heavyweight request handling logic, including validating requests, checking the deduplication cache (discussed below), and submitting the entry to be sequenced.
The next question was where and how we’d run the backend to handle the CT log sequencing logic, which needs to be stateful and tightly coordinated. We chose Durable Objects (DOs), a special type of stateful Cloudflare Worker where each instance has persistent storage and a unique name which can be used to route requests to it from anywhere in the world. DOs are designed to scale effortlessly for applications that can be easily broken up into self-contained units that do not need a lot of coordination across units. For example, a chat application can use one DO to control each chat room. In our model, then, each CT log is controlled by a single DO. This architecture allows us to easily run multiple CT logs within a single Workers application, but as we’ll see, the limitations of individual single-threaded DOs can easily become a bottleneck. More on this later.
With the CT log backend as a Durable Object, several other components fell into place: Durable Objects’ strongly-consistent transactional storage neatly fit the requirements for the “lock backend” to persist the log’s latest checkpoint, and we can use an alarm to trigger the log sequencing every second. We can also use location hints to place CT logs in locations geographically close to clients for reduced latency, similar to Google’s Argon and Xenon logs.
The choice of datastore for the deduplication cache proved to be non-obvious. The cache is best-effort, and intended to avoid re-sequencing entries that are already present in the log. The cache key is computed by hashing certain fields of the add-[pre-]chain request, and the cache value consists of the entry’s index in the log and the timestamp at which it was sequenced. At current log submission rates, the deduplication cache could grow in excess of 50 GB for 6 months of log data. In the Sunlight implementation, the deduplication cache is implemented as a local SQLite database, where checks against it are tightly coupled with sequencing, which ensures that duplicates from in-flight requests are correctly accounted for. However, this architecture did not translate well to Cloudflare’s architecture. The data size doesn’t comfortably fit within Durable Object Storage or single-database D1 limits, and it was too slow to directly read and write to remote storage from within the sequencing loop. Ultimately, we split the deduplication cache into two components: a local fixed-size in-memory cache for fast deduplication over short periods of time (on the order of minutes), and the other a long-term deduplication cache built on Cloudflare Workers KV a global, low-latency, eventually-consistent key-value store without storage limitations.
With this architecture, it was relatively straightforward to port the Go code to Rust, and to bring up a functional static CT log up on Workers. We’re done then, right? Not quite. Performance tests showed that the log was only capable of sequencing 20-30 new entries per second, well under the 70 per second target of existing logs. We could work around this by simply running more logs, but that puts strain on other parts of the CT ecosystem — namely on TLS clients and monitors, which need to keep state for each log. Additionally, the alarm used to trigger sequencing would often be delayed by multiple seconds, meaning that the log was failing to produce new tree heads at consistent intervals. Time to go back to the drawing board.
Making it fast
In the design thus far, we’re asking a single-threaded Durable Object instance to do a lot of multi-tasking. The DO processes incoming requests from the Frontend Worker to add entries to the sequencing pool, and must periodically sequence the pool and write state to the various storage backends. A log handling 100 requests per second needs to switch between 101 running tasks (the extra one for the sequencing), plus any async tasks like writing to remote storage — usually 10+ writes to object storage and one write to the long-term deduplication cache per sequenced entry. No wonder the sequencing task was getting delayed!
A static CT API log running on Workers using the Azul implementation with batching to improve performance.
We were able to work around these issues by adding an additional layer of DOs between the Frontend Worker and the Sequencer, which we call Batchers. The Frontend Worker uses consistent hashing on the cache key to determine which of several Batchers to submit the entry to, and the Batcher helps to reduce the number of requests to the Sequencer by buffering requests and sending them together in batches. When the batch is sequenced, the Batcher distributes the responses back to the Frontend Workers that submitted the request. The Batcher also handles writing updates to the deduplication cache, further freeing up resources for the Sequencer.
By limiting the scope of the critical block of code that needed to be run synchronously in a single DO, and leaning on the strengths of DOs by scaling horizontally where the workload allows it, we were able to drastically improve application performance. With this new architecture, the CT log application can handle upwards of 500 requests per second to the submission APIs to add new log entries, while maintaining a consistent sequencing tempo to keep per-request latency low (typically 1-2 seconds).
Developing a Workers application in Rust
One of the reasons I was excited to work on this project is that it gave me an opportunity to implement a Workers application in Rust, which I’d never done from scratch before. Not everything was smooth, but overall I would recommend the experience.
To be clear, these rough edges are expected! The Workers platform is continuously gaining new features, and it’s natural that the Rust bindings would fall behind. As more developers rely on (and contribute to, hint hint) the Rust bindings, the developer experience will continue to improve.
What is next for Certificate Transparency
The WebPKI is constantly evolving and growing, and upcoming changes, in particular shorter certificate lifetimes and larger post-quantum certificates, are going to place significantly more load on the CT ecosystem.
The CA/Browser Forum defines a set of Baseline Requirements for publicly-trusted TLS server certificates. As of 2020, the maximum certificate lifetime for publicly-trusted certificates is 398 days. However, there is a ballot measure to reduce that period to as low as 47 days by March 2029. Let’s Encrypt is going even further, and at the end of 2024 announced that they will be offering short-lived certificates with a lifetime of only six days by the end of 2025. Based on some back-of-the-envelope calculations using statistics from Merkle Town, these changes could increase the number of logged entries in the CT ecosystem by 16-20x.
If you’ve been keeping up with this blog, you’ll also know that post-quantum certificates are on the horizon, bringing with them larger signature and public key sizes. Today, a certificate with an P-256 ECDSA public key and issuer signature can be less than 1kB. Dropping in a ML-DSA44 public key and signature brings the same certificate size to 4.6 kB, assuming the SCTs use 96-byte UOVls-pkc signatures. With these choices, post-quantum certificates could require CT logs to store 4x the amount of data per log entry.
The static CT API design helps to ensure that CT logs are much better equipped to handle this increased load, especially if the load is distributed across multiple logs per operator. Our new implementation makes it easy for log operators to run CT logs on top of Cloudflare’s infrastructure, adding more operational diversity and robustness to the CT ecosystem. We welcome feedback on the design and implementation as GitHub issues, and encourage CAs and other interested parties to start submitting to and consuming from our test logs.
Have you ever built a piece of IKEA furniture, or put together a LEGO set, by following the instructions closely and only at the end realized at some point you didn’t quite follow them correctly? The final result might be close to what was intended, but there’s a nagging thought that maybe, just maybe, it’s not as rock steady or functional as it could have been.
Internet protocol specifications are instructions designed for engineers to build things. Protocol designers take great care to ensure the documents they produce are clear. The standardization process gathers consensus and review from experts in the field, to further ensure document quality. Any reasonably skilled engineer should be able to take a specification and produce a performant, reliable, and secure implementation. The Internet is central to everyone’s lives, and we depend on these implementations. Any deviations from the specification can put us at risk. For example, mishandling of malformed requests can allow attacks such as request smuggling.
h3i is a binary command line tool and Rust library designed for low-level testing and debugging of HTTP/3, which runs over QUIC. h3i is free and open source as part of Cloudflare’s quiche project. In this post we’ll explain the motivation behind developing h3i, how we use it to help develop robust and safe standards-compliant software and production systems, and how you can similarly use it to test your own software or services. If you just want to jump into how to use h3i, go to the h3i command line tool section.
A recap of QUIC and HTTP/3
QUIC is a secure-by-default transport protocol that provides performance advantages compared to TCP and TLS via a more efficient handshake, along with stream multiplexing that provides head-of-line blocking avoidance. HTTP/3 is an application protocol that maps HTTP semantics to QUIC, such as defining how HTTP requests and responses are assigned to individual QUIC streams.
Cloudflare has supported QUIC on our global network in some shape or form since 2018. We started while the Internet Engineering Task Force (IETF) was earnestly standardizing the protocol, working through early iterations and using interoperability testing and experience to help provide feedback for the standards process. We launched support for QUIC version 1 and HTTP/3 as soon as RFC 9000 (and its accompanying specifications) were published in 2021.
We work on the Protocols team, who own the ingress proxy into the Cloudflare network. This is essentially Cloudflare’s “front door” — HTTP requests that come to Cloudflare from the Internet pass through us first. The majority of requests are passed onwards to things like rulesets, workers, caches, or a customer origin. However, you might be surprised that many requests don’t ever make it that far because they are, in some way, invalid or malformed. Servers listening on the Internet have to be robust to traffic that is not RFC compliant, whether caused by accident or malicious intent.
The Protocols team actively participates in IETF standardization work and has also helped build and maintain other Cloudflare services that leverage quiche for QUIC and HTTP/3, from the proxies that help iCloud Private Relay via MASQUE proxying, to replacing WARP’s use of Wireguard with MASQUE, and beyond.
Throughout all of these different use cases, it is important for us to extensively test all aspects of the protocols. A deep dive into protocol details is a blog post (or three) in its own right. So let’s take a thin slice across HTTP to help illustrate the concepts.
HTTP Semantics are common to all versions of HTTP — the overall architecture, terminology, and protocol aspects such as request and response messages, methods, status codes, header and trailer fields, message content, and much more. Each individual HTTP version defines how semantics are transformed into a “wire format” for exchange over the Internet. You can read more about HTTP/1.1 and HTTP/2 in some of our previous blogposts.
With HTTP/3, HTTP request and response messages are split into a series of binary frames. HEADERS frames carry a representation of HTTP metadata (method, path, status code, field lines). The payload of the frame is the encoded QPACK compression output. DATA frames carry HTTP content (aka “message body”). In order to exchange these frames, HTTP/3 relies on QUIC streams. These provide an ordered and reliable byte stream and each have an identifier (ID) that is unique within the scope of a connection. There are four different stream types, denominated by the two least significant bits of the ID.
As a simple example, assuming a QUIC connection has already been established, a client can make a GET request and receive a 200 OK response with an HTML body using the follow sequence:
Client allocates the first available client-initiated bidirectional QUIC stream. (The IDs start at 0, then 4, 8, 12 and so on)
Client sends the request HEADERS frame on the stream and sets the stream’s FIN bit to mark the end of stream.
Server receives the request HEADERS frame and validates it against RFC 9114 rules. If accepted, it processes the request and prepares the response.
Server sends the response HEADERS frame on the same stream.
Server sends the response DATA frame on the same stream and sets the FIN bit.
Client receives the response frames and validates them. If accepted, the content is presented to the user.
At the QUIC layer, stream data is split into STREAM frames, which are sent in QUIC packets over UDP. QUIC deals with any loss detection and recovery, helping to ensure stream data is reliable. The layer cake diagram below provides a handy comparison of how HTTP/1.1, HTTP/2 and HTTP/3 use TCP, UDP and IP.
Background on testing QUIC and HTTP/3 at Cloudflare
The Protocols team has a diverse set of automated test tools that exercise our ingress proxy software in order to ensure it can stand up to the deluge that the Internet can throw at it. Just like a bouncer at a nightclub front door, we need to prevent as much bad traffic as possible before it gets inside and potentially causes damage.
HTTP/2 and HTTP/3 share several concepts. When we started developing early HTTP/3 support, we’d already learned a lot from production experience with HTTP/2. While HTTP/2 addressed many issues with HTTP/1.1 (especially problems like request smuggling, caused by its ASCII-based message delineation), HTTP/2 also added complexity and new avenues for attack. Security is an ongoing process, and the Protocols team continually hardens our software and systems to threats. For example, mitigating the range of denial-of-service attacks identified by Netflix in 2019, or the HTTP/2 Rapid Reset attacks of 2023.
For testing HTTP/2, we rely on the Python Requests library for testing conventional HTTP exchanges. However, that mostly only exercises HEADERS and DATA frames. There are eight other frame types and a plethora of ways that they can interact (hence the new attack vectors mentioned above). In order to get full testing coverage, we have to break down into the lower layer h2 library, which allows exact frame-by-frame control. However, even that is not always enough. Libraries tend to want to follow the RFC rules and prevent their users from doing “the wrong thing”. This is entirely logical for most purposes. For our needs though, we need to take off the safety guards just like any potential attackers might do. We have a few cases where the best way to exercise certain traffic patterns is to handcraft HTTP/2 frames in a hex editor, store that as binary, and replay it with a tool such as OpenSSL s_client.
We knew we’d need similar testing approaches for HTTP/3. However, when we started in 2018, there weren’t many other suitable client implementations. The rate of iteration on the specifications also meant it was hard to always keep in sync. So we built tests on quiche, using a mix of our quiche-client and http3_test. Over time, the python library aioquic has matured, and we have used it to add a range of lower-layer tests that break or bend HTTP/3 rules, in order to prove our proxies are robust.
Finally, we would be remiss not to mention that all the tests in our ingress proxy are in addition to the suite of over 500 integration tests that run on the quiche project itself.
Making HTTP/3 testing more accessible and maintainable with h3i
While we are happy with the coverage of our current tests, the smorgasbord of test tools makes it hard to know what to reach for when adding new tests. For example, we’ve had cases where aioquic’s safety guards prevent us from doing something, and it has needed a patch or workaround. This sort of thing requires a time investment just to debug/develop the tests.
We believe it shouldn’t take a protocol or code expert to develop what are often very simple to describe tests. While it is important to provide guide rails for the majority of conventional use cases, it is also important to provide accessible methods for taking them off.
Let’s consider a simple example. In HTTP/3 there is something called the control stream. It’s used to exchange frames such as SETTINGS, which affect the HTTP/3 connection. RFC 9114 Section 6.2.1 states:
Each side MUST initiate a single control stream at the beginning of the connection and send its SETTINGS frame as the first frame on this stream. If the first frame of the control stream is any other frame type, this MUST be treated as a connection error of type H3_MISSING_SETTINGS. Only one control stream per peer is permitted; receipt of a second stream claiming to be a control stream MUST be treated as a connection error of type H3_STREAM_CREATION_ERROR. The sender MUST NOT close the control stream, and the receiver MUST NOT request that the sender close the control stream. If either control stream is closed at any point, this MUST be treated as a connection error of type H3_CLOSED_CRITICAL_STREAM. Connection errors are described in Section 8.
There are many tests we can conjure up just from that paragraph:
Send a non-SETTINGS frame as the first frame on the control stream.
Open two control streams.
Open a control stream and then close it with a FIN bit.
Open a control stream and then reset it with a RESET_STREAM QUIC frame.
Wait for the peer to open a control stream and then ask for it to be reset with a STOP_SENDING QUIC frame.
All of the above actions should cause a remote peer that has implemented the RFC properly to close the connection. Therefore, it is not in the interest of the local client or server applications to ever do these actions.
Many QUIC and HTTP/3 implementations are developed as libraries that are integrated into client or server applications. There may be an extensive set of unit or integration tests of the library checking RFC rules. However, it is also important to run the same tests on the integrated assembly of library and application, since it’s all too common that an unhandled/mishandled library error can cascade to cause issues in upper layers. For instance, the HTTP/2 Rapid Reset attacks affected Cloudflare due to their impact on how one service spoke to another.
We’ve developed h3i, a command line tool and library, to make testing more accessible and maintainable for all. We started with a client that can exercise servers, since that’s what our focus has been. Future developments could support the opposite, a server that behaves in unusual ways in order to exercise clients.
Note: h3i is not intended to be a production client! Its flexibility may cause issues that are not observed in other production-oriented clients. It is also not intended to be used for any type of performance testing and measurement.
The h3i command line tool
The primary purpose of the h3i command line tool is quick low-level debugging and exploratory testing. Rather than worrying about writing code or a test script, users can quickly run an ad-hoc client test against a target, guided by interactive prompts.
In the simplest case, you can think of h3i a bit like curl but with access to some extra HTTP/3 parameters. In the example below, we issue a request to https://cloudflare-quic.com/ and receive a response.
Walking through a simple GET with h3i step-by-step:
Grab a copy of the h3i binary either by running cargo install h3i or cloning the quiche source repo at https://github.com/cloudflare/quiche/. Both methods assume you have some familiarity with Rust and Cargo. See the cargo documentation for more information.
cargo install will place the binary on your path, so you can then just run it by executing h3i.
If running from source, navigate to the quiche/h3i directory and then use cargo run.
Run the binary and provide the name and port of the target server. If the port is omitted, the default value 443 is assumed. E.g, cargo run cloudflare-quic.com
h3i then enters the action prompting phase. A series of one or more HTTP/3 actions can be queued up, such as sending frames, opening or terminating streams, or waiting on data from the server. The full set of options is documented in the readme.
The prompting interface adapts to keyboard inputs and supports tab completion.
In the example above, the headers action is selected, which walks through populating the fields in a HEADERS frame. It includes mandatory fields from RFC 9114 for convenience. If a test requires omitting these, the headers_no_pseudo can be used instead.
The commit prompt choice finalizes the action list and moves to the connection phase. h3i initiates a QUIC connection to the server identified in step 2. Once connected, actions are executed in order.
By default, h3i reports some limited information about the frames the server sent. To get more detailed information, the RUST_LOG environment can be set with either debug or trace levels.
Instant record and replay, powered by qlog
It can be fun to play around with the h3i command line tool to see how different servers respond to different combinations or sequences of actions. Occasionally, you’ll find a certain set that you want to run over and over again, or share with a friend or colleague. Having to manually enter the prompts repeatedly, or share screenshots of the h3i input can turn tedious. Fortunately, h3i records all the actions in a log file by default — the file path is printed immediately after h3i starts. The format of this file is based on qlog, an in-progress standard in development at the IETF for network protocol logging. It’s a perfect fit for our low-level needs.
h3i logs can be replayed using the --qlog-input option. You can change the target server host and port, and keep all the same actions. However, most servers will validate the :authority pseudo-header or Host header contained in a HEADERS frame. The –replay-host-override option allows changing these fields without needing to modify the file by hand.
And yes, qlog files are human-readable text in the JSON-SEQ format. So you can also just write these by hand in the first place if you like! However, if you’re going to start writing things, maybe Rust is your preferred option…
Using the h3i library to send a malformed request with Rust
In our previous example, we just sent a valid request so there wasn’t anything interesting to observe. Where h3i really shines is in generating traffic that isn’t RFC compliant, such as malformed HTTP messages, invalid frame sequences, or other actions on streams. This helps determine if a server is acting robustly and defensively.
Let’s explore this more with an example of HTTP content-length mismatch. RFC 9114 section 4.1.2 specifies:
A request or response that is defined as having content when it contains a Content-Length header field (Section 8.6 of [HTTP]) is malformed if the value of the Content-Length header field does not equal the sum of the DATA frame lengths received. A response that is defined as never having content, even when a Content-Length is present, can have a non-zero Content-Length header field even though no content is included in DATA frames.
Intermediaries that process HTTP requests or responses (i.e., any intermediary not acting as a tunnel) MUST NOT forward a malformed request or response. Malformed requests or responses that are detected MUST be treated as a stream error of type H3_MESSAGE_ERROR.
For malformed requests, a server MAY send an HTTP response indicating the error prior to closing or resetting the stream.
There are good reasons that the RFC is so strict about handling mismatched content lengths. They can be a vector for desynchronization attacks (similar to request smuggling), especially when a proxy is converting inbound HTTP/3 to outbound HTTP/1.1.
We’ve provided an example of how to use the h3i Rust library to write a tailor-made test client that sends a mismatched content length request. It sends a Content-Length header of 5, but its body payload is “test”, which is only 4 bytes. It then waits for the server to respond, after which it explicitly closes the connection by sending a QUIC CONNECTION_CLOSE frame.
When running low-level tests, it can be interesting to also take a packet capture (pcap) and observe what is happening on the wire. Since QUIC is an encrypted transport, we’ll need to use the SSLKEYLOG environment variable to capture the session keys so that tools like Wireshark can decrypt and dissect.
To follow along at home, clone a copy of the quiche repository, start a packet capture on the appropriate network interface and then run:
cd quiche/h3i
SSLKEYLOGFILE="h3i-example.keys" cargo run --example content_length_mismatch
In our decrypted capture, we see the expected sequence of handshake, request, response, and then closure.
Surveying the example code
The example is a simple binary app with a main() entry point. Let’s survey the key elements.
First, we set up an h3i configuration to a target server:
let config = Config::new()
        .with_host_port("cloudflare-quic.com".to_string())
        .with_idle_timeout(2000)
        .build()
        .unwrap();
The idle timeout is a QUIC concept which tells each endpoint when it should close the connection if the connection has been idle. This prevents endpoints from spinning idly if the peer hasn’t closed the connection. h3i’s default is 30 seconds, which can be too long for tests, so we set ours to 2 seconds here.
Next, we define a set of request headers and encode them with QPACK compression, ready to put in a HEADERS frame. Note that h3i does provide a send_headers_frame helper method which does this for you, but the example does it manually for clarity:
let headers = vec![
        Header::new(b":method", b"POST"),
        Header::new(b":scheme", b"https"),
        Header::new(b":authority", b"cloudflare-quic.com"),
        Header::new(b":path", b"/"),
        // We say that we're going to send a body with 5 bytes...
        Header::new(b"content-length", b"5"),
    ];

    let header_block = encode_header_block(&headers).unwrap();
Then, we define the set of h3i actions that we want to execute in order: send HEADERS, send a too-short DATA frame, wait for the server’s HEADERS, then close the connection.
let actions = vec![
        Action::SendHeadersFrame {
            stream_id: STREAM_ID,
            fin_stream: false,
            headers,
            frame: Frame::Headers { header_block },
        },
        Action::SendFrame {
            stream_id: STREAM_ID,
            fin_stream: true,
            frame: Frame::Data {
                // ...but, in actuality, we only send 4 bytes. This should yield a
                // 400 Bad Request response from an RFC-compliant
                // server: https://datatracker.ietf.org/doc/html/rfc9114#section-4.1.2-3
                payload: b"test".to_vec(),
            },
        },
        Action::Wait {
            wait_type: WaitType::StreamEvent(StreamEvent {
                stream_id: STREAM_ID,
                event_type: StreamEventType::Headers,
            }),
        },
        Action::ConnectionClose {
            error: quiche::ConnectionError {
                is_app: true,
                error_code: quiche::h3::WireErrorCode::NoError as u64,
                reason: vec![],
            },
        },
    ];
Finally, we’ll set things in motion with connect(), which sets up the QUIC connection, executes the actions list and collects the summary.
let summary =
        sync_client::connect(config, &actions).expect("connection failed");

    println!(
        "=== received connection summary! ===\n\n{}",
        serde_json::to_string_pretty(&summary).unwrap_or_else(|e| e.to_string())
    );
ConnectionSummary provides data about the connection, including the frames h3i received, details about why the connection closed, and connection statistics. The example prints the summary out. However, you can programmatically check it. We do this to write our own internal automation tests.
If you’re running the example, it should print something like the following:
Let’s walk through the output. Up first is the StreamMap, which is a record of all frames received on each stream. We can see that we received 5 frames on stream 0: 2 UNKNOWNs, one EnrichedHeaders frame, and two DATA frames.
The UNKNOWN frames are extension frames that are unknown to h3i; the server under test is sending what are known as GREASE frames to help exercise the protocol and ensure clients are not erroring when they receive something unexpected per RFC 9114 requirements.
The EnrichedHeaders frame is essentially an HTTP/3 HEADERS frame, but with some small helpers, like one to get the response status code. The server under test sent a 400 as expected.
The DATA frames carry response body bytes. In this case, the body is the HTML required to render the Cloudflare Bad Request page (you can peek at the HTML yourself in Wireshark). We chose to omit the raw bytes from the ConnectionSummary since they may not be representable safely as text. A future improvement could be to encode the bytes in base64 or hex, in order to support tests that need to check response content.
h3i for test automation
We believe h3i is a great library for building automated tests on. You can take the above example and modify it to fit within various types of (continuous) integration tests.
We outlined earlier how the Protocols team HTTP/3 testing has organically grown to use three different frameworks. Even within those, we still didn’t have much flexibility and ease of use. Over the last year we’ve been building h3i itself and reimplementing our suite of ingress proxy test cases using the Rust library. This has helped us improve test coverage with a range of new tests not previously possible. It also surprisingly identified some problems with the old tests, particularly for some edge cases where it wasn’t clear how the old test code implementation was running under the hood.
Bake offs, interop, and wider testing of HTTP
RFC 1025 was published in 1987. Authored by Jon Postel, it discusses bake offs:
In the early days of the development of TCP and IP, when there were very few implementations and the specifications were still evolving, the only way to determine if an implementation was “correct” was to test it against other implementations and argue that the results showed your own implementation to have done the right thing. These tests and discussions could, in those early days, as likely change the specification as change the implementation.
There were a few times when this testing was focused, bringing together all known implementations and running through a set of tests in hopes of demonstrating the N squared connectivity and correct implementation of the various tricky cases. These events were called “Bake Offs”.
While nearly 4 decades old, the concept of exercising Internet protocol implementations and seeing how they compare to the specification still holds true. The QUIC WG made heavy use of interoperability testing through its standardization process. We started off sitting in a room and running tests manually by hand (or with some help from scripts). Then Marten Seemann developed the QUIC Interop Runner, which runs regular automated testing and collects and renders all the results. This has proven to be incredibly useful.
The state of HTTP/3 interoperability testing is not quite as mature. Although there are tools such as Kazu Yamamoto’s excellent h3spec (in Haskell) for testing conformance, there isn’t a similar continuous integration process of collection and rendering of results. While h3i shares similarities with h3spec, we felt it important to focus on the framework capabilities rather than creating a corpus of tests and assertions. Cloudflare is a big fan of Rust and as several teams move to Rust-based proxies, having a consistent ecosystem provides advantages (such as developer velocity).
We certainly feel there is a great opportunity for continued collaboration and cross-pollination between projects in the QUIC and HTTP space. For example, h3i might provide a suitable basis to build another tool (or set of scripts) to run bake offs or interop tests. Perhaps it even makes sense to have a common collection of test cases owned by the community, that can be specialized to the most appropriate or preferred tooling. This topic was recently presented at the HTTP Workshop 2024 by Mohammed Al-Sahaf, and it excites us to see new potential directions of testing improvements.
When using any tools or methods for protocol testing, we encourage responsible handling of security-related matters. If you believe you may have identified a vulnerability in an IETF Internet protocol itself, please follow the IETF’s reporting guidance. If you believe you may have discovered an implementation vulnerability in a product, open source project, or service using QUIC or HTTP, then you should report these directly to the responsible party. Implementers or operators often provide their own publicly-available guidance and contact details to send reports. For example, the Cloudflare quiche security policy is available in the Security tab of the GitHub repository.
Summary and outlook
Cloudflare takes testing very seriously. While h3i has a limited feature set as a test HTTP/3 client, we believe it provides a strong framework that can be extended to a wider range of different cases and different protocols. For example, we’d like to add support for low-level HTTP/2.
We’ve designed h3i to integrate into a wide range of testing methodologies, from manual ad-hoc testing, to native Rust tests, to conformance testbenches built with scripting languages. We’ve had great success migrating our existing zoo of test tools to a single one that is more accessible and easier to maintain.
Now that you’ve read about h3i’s capabilities, it’s left as an exercise to the reader to go back to the example of HTTP/3 control streams and consider how you could write tests to exercise a server.
We encourage the community to experiment with h3i and provide feedback, and propose ideas or contributions to the GitHub repository as issues or Pull Requests.
With September’s announcement of Hyperdrive’s ability to send database traffic from Workers over Cloudflare Tunnels, we wanted to dive into the details of what it took to make this happen.
Hyper-who?
Accessing your data from anywhere in Region Earth can be hard. Traditional databases are powerful, familiar, and feature-rich, but your users can be thousands of miles away from your database. This can cause slower connection startup times, slower queries, and connection exhaustion as everything takes longer to accomplish.
Cloudflare Workers is an incredibly lightweight runtime, which enables our customers to deploy their applications globally by default and renders the cold start problem almost irrelevant. The trade-off for these light, ephemeral execution contexts is the lack of persistence for things like database connections. Database connections are also notoriously expensive to spin up, with many round trips required between client and server before any query or result bytes can be exchanged.
Hyperdrive is designed to make the centralized databases you already have feel like they’re global while keeping connections to those databases hot. We use our global network to get faster routes to your database, keep connection pools primed, and cache your most frequently run queries as close to users as possible.
Why a Tunnel?
For something as sensitive as your database, exposing access to the public Internet can be uncomfortable. It is common to instead host your database on a private network, and allowlist known-safe IP addresses or configure GRE tunnels to permit traffic to it. This is complex, toilsome, and error-prone.
On Cloudflare’s Developer Platform, we strive for simplicity and ease-of-use. We cannot expect all of our customers to be experts in configuring networking solutions, and so we went in search of a simpler solution. Being your own customer is rarely a bad choice, and it so happens that Cloudflare offers an excellent option for this scenario: Tunnels.
Integrating with Tunnels to support sending Postgres directly through them was a bit of a new challenge for us. Most of the time, when we use Tunnels internally (more on that later!), we rely on the excellent job cloudflared does of handling all of the mechanics, and we just treat them as pipes. That wouldn’t work for Hyperdrive, though, so we had to dig into how Tunnels actually ingress traffic to build a solution.
Hyperdrive handles Postgres traffic using an entirely custom implementation of the Postgres message protocol. This is necessary, because we sometimes have to alter the specific type or content of messages sent from client to server, or vice versa. Handling individual bytes gives us the flexibility to implement whatever logic any new feature might need.
An additional, perhaps less obvious, benefit of handling Postgres message traffic as just bytes is that we are not bound to the transport layer choices of some ORM or library. One of the nuances of running services in Cloudflare is that we may want to egress traffic over different services or protocols, for a variety of different reasons. In this case, being able to egress traffic via a Tunnel would be pretty challenging if we were stuck with whatever raw TCP socket a library had established for us.
The way we accomplish this relies on a mainstay of Rust: traits (which are how Rust lets developers apply logic across generic functions and types). In the Rust ecosystem, there are two traits that define the behavior Hyperdrive wants out of its transport layers: AsyncRead and AsyncWrite. There are a couple of others we also need, but we’re going to focus on just these two. These traits enable us to code our entire custom handler against a generic stream of data, without the handler needing to know anything about the underlying protocol used to implement the stream. So, we can pass around a WebSocket connection as a generic I/O stream, wherever it might be needed.
As an example, the code to create a generic TCP stream and send a Postgres startup message across it might look like this:
/// Send a startup message to a Postgres server, in the role of a PG client.
/// https://www.postgresql.org/docs/current/protocol-message-formats.html#PROTOCOL-MESSAGE-FORMATS-STARTUPMESSAGE
pub async fn send_startup<S>(stream: &mut S, user_name: &str, db_name: &str, app_name: &str) -> Result<(), ConnectionError>
where
    S: AsyncWrite + Unpin,
{
    let protocol_number = 196608 as i32;
    let user_str = &b"user\0"[..];
    let user_bytes = user_name.as_bytes();
    let db_str = &b"database\0"[..];
    let db_bytes = db_name.as_bytes();
    let app_str = &b"application_name\0"[..];
    let app_bytes = app_name.as_bytes();
    let len = 4 + 4
        + user_str.len() + user_bytes.len() + 1
        + db_str.len() + db_bytes.len() + 1
        + app_str.len() + app_bytes.len() + 1 + 1;

    // Construct a BytesMut of our startup message, then send it
    let mut startup_message = BytesMut::with_capacity(len as usize);
    startup_message.put_i32(len as i32);
    startup_message.put_i32(protocol_number);
    startup_message.put(user_str);
    startup_message.put_slice(user_bytes);
    startup_message.put_u8(0);
    startup_message.put(db_str);
    startup_message.put_slice(db_bytes);
    startup_message.put_u8(0);
    startup_message.put(app_str);
    startup_message.put_slice(app_bytes);
    startup_message.put_u8(0);
    startup_message.put_u8(0);

    match stream.write_all(&startup_message).await {
        Ok(_) => Ok(()),
        Err(err) => {
            error!("Error writing startup to server: {}", err.to_string());
            ConnectionError::InternalError
        }
    }
}

/// Connect to a TCP socket
let stream = match TcpStream::connect(("localhost", 5432)).await {
    Ok(s) => s,
    Err(err) => {
        error!("Error connecting to address: {}", err.to_string());
        return ConnectionError::InternalError;
    }
};
let _ = send_startup(&mut stream, "db_user", "my_db").await;
With this approach, if we wanted to encrypt the stream using TLS before we write to it (upgrading our existing TcpStream connection in-place, to an SslStream), we would only have to change the code we use to create the stream, while generating and sending the traffic would remain unchanged. This is because SslStream also implements AsyncWrite!
/// We're handwaving the SSL setup here. You're welcome.
let conn_config = new_tls_client_config()?;

/// Encrypt the TcpStream, returning an SslStream
let ssl_stream = match tokio_boring::connect(conn_config, domain, stream).await {
    Ok(s) => s,
    Err(err) => {
        error!("Error during websocket TLS handshake: {}", err.to_string());
        return ConnectionError::InternalError;
    }
};
let _ = send_startup(&mut ssl_stream, "db_user", "my_db").await;
Whence WebSocket
WebSocket is an application layer protocol that enables bidirectional communication between a client and server. Typically, to establish a WebSocket connection, a client initiates an HTTP request and indicates they wish to upgrade the connection to WebSocket via the “Upgrade” header. Then, once the client and server complete the handshake, both parties can send messages over the connection until one of them terminates it.
Now, it turns out that the way Cloudflare Tunnels work under the hood is that both ends of the tunnel want to speak WebSocket, and rely on a translation layer to convert all traffic to or from WebSocket. The cloudflared daemon you spin up within your private network handles this for us! For Hyperdrive, however, we did not have a suitable translation layer to send Postgres messages across WebSocket, and had to write one.
One of the (many) fantastic things about Rust traits is that the contract they present is very clear. To be AsyncRead, you just need to implement poll_read. To be AsyncWrite, you need to implement only three functions (poll_write, poll_flush, and poll_shutdown). Further, there is excellent support for WebSocket in Rust built on top of the tungstenite-rs library.
Thus, building our custom WebSocket stream such that it can share the same machinery as all our other generic streams just means translating the existing WebSocket support into these poll functions. There are some existing OSS projects that do this, but for multiple reasons we could not use the existing options. The primary reason is that Hyperdrive operates across multiple threads (thanks to the tokio runtime), and so we rely on our connections to also handle Send, Sync, and Unpin. None of the available solutions had all five traits handled. It turns out that most of them went with the paradigm of Sink and Stream, which provide a solid base from which to translate to AsyncRead and AsyncWrite. In fact some of the functions overlap, and can be passed through almost unchanged. For example, poll_flush and poll_shutdown have 1-to-1 analogs, and require almost no engineering effort to convert from Sink to AsyncWrite.
/// We use this struct to implement the traits we need on top of a WebSocketStream
pub struct HyperSocket<S>
where
    S: AsyncRead + AsyncWrite + Send + Sync + Unpin,
{
    inner: WebSocketStream<S>,
    read_state: Option<ReadState>,
    write_err: Option<Error>,
}

impl<S> AsyncWrite for HyperSocket<S>
where
    S: AsyncRead + AsyncWrite + Send + Sync + Unpin,
{
    fn poll_flush(mut self: Pin<&mut Self>, cx: &mut Context<'_>) -> Poll<io::Result<()>> {
        match ready!(Pin::new(&mut self.inner).poll_flush(cx)) {
            Ok(_) => Poll::Ready(Ok(())),
            Err(err) => Poll::Ready(Err(Error::new(ErrorKind::Other, err))),
        }
    }

    fn poll_shutdown(mut self: Pin<&mut Self>, cx: &mut Context<'_>) -> Poll<io::Result<()>> {
        match ready!(Pin::new(&mut self.inner).poll_close(cx)) {
            Ok(_) => Poll::Ready(Ok(())),
            Err(err) => Poll::Ready(Err(Error::new(ErrorKind::Other, err))),
        }
    }
}
With that translation done, we can use an existing WebSocket library to upgrade our SslStream connection to a Cloudflare Tunnel, and wrap the result in our AsyncRead/AsyncWrite implementation. The result can then be used anywhere that our other transport streams would work, without any changes needed to the rest of our codebase!
That would look something like this:
let websocket = match tokio_tungstenite::client_async(request, ssl_stream).await {
    Ok(ws) => Ok(ws),
    Err(err) => {
        error!("Error during websocket conn setup: {}", err.to_string());
        return ConnectionError::InternalError;
    }
};
let websocket_stream = HyperSocket::new(websocket));
let _ = send_startup(&mut websocket_stream, "db_user", "my_db").await;
Access granted
An observant reader might have noticed that in the code example above we snuck in a variable named request that we passed in when upgrading from an SslStream to a WebSocketStream. This is for multiple reasons. The first reason is that Tunnels are assigned a hostname and use this hostname for routing. The second and more interesting reason is that (as mentioned above) when negotiating an upgrade from HTTP to WebSocket, a request must be sent to the server hosting the ingress side of the Tunnel to perform the upgrade. This is pretty universal, but we also add in an extra piece here.
At Cloudflare, we believe that secure defaults and defense in depth are the correct ways to build a better Internet. This is why traffic across Tunnels is encrypted, for example. However, that does not necessarily prevent unwanted traffic from being sent into your Tunnel, and therefore egressing out to your database. While Postgres offers a robust set of access control options for protecting your database, wouldn’t it be best if unwanted traffic never got into your private network in the first place?
To that end, all Tunnels set up for use with Hyperdrive should have a Zero Trust Access Application configured to protect them. These applications should use a Service Token to authorize connections. When setting up a new Hyperdrive, you have the option to provide the token’s ID and Secret, which will be encrypted and stored alongside the rest of your configuration. These will be presented as part of the WebSocket upgrade request to authorize the connection, allowing your database traffic through while preventing unwanted access.
This can be done within the request’s headers, and might look something like this:
let ws_url = format!("wss://{}", host);
let mut request = match ws_url.into_client_request() {
    Ok(req) => req,
    Err(err) => {
        error!(
            "Hostname {} could not be parsed into a valid request URL: {}",
            host,
            err.to_string()
        );
        return ConnectionError::InternalError;
    }
};
request.headers_mut().insert(
    "CF-Access-Client-Id",
    http::header::HeaderValue::from_str(&client_id).unwrap(),
);
request.headers_mut().insert(
    "CF-Access-Client-Secret",
    http::header::HeaderValue::from_str(&client_secret).unwrap(),
);
Building for customer zero
If you’ve been reading the blog for a long time, some of this might sound a bit familiar. This isn’t the first time that we’ve sent Postgres traffic across a tunnel, it’s something most of us do from our laptops regularly. This works very well for interactive use cases with low traffic volume and a high tolerance for latency, but historically most of our products have not been able to employ the same approach.
Cloudflare operates many data centers around the world, and most services run in every one of those data centers. There are some tasks, however, that make the most sense to run in a more centralized fashion. These include tasks such as managing control plane operations, or storing configuration state. Nearly every Cloudflare product houses its control plane information in Postgres clusters run centrally in a handful of our data centers, and we use a variety of approaches for accessing that centralized data from elsewhere in our network. For example, many services currently use a push-based model to publish updates to Quicksilver, and work through the complexities implied by such a model. This has been a recurring challenge for any team looking to build a new product.
Hyperdrive’s entire reason for being is to make it easy to access such central databases from our global network. When we began exploring Tunnel integrations as a feature, many internal teams spoke up immediately and strongly suggested they’d be interested in using it themselves. This was an excellent opportunity for Cloudflare to scratch its own itch, while also getting a lot of traffic on a new feature before releasing it directly to the public. As always, being “customer zero” means that we get fast feedback, more reliability over time, stronger connections between teams, and an overall better suite of products. We jumped at the chance.
As we rolled out early versions of Tunnel integration, we worked closely with internal teams to get them access to it, and fixed any rough spots they encountered. We’re pleased to share that this first batch of teams have found great success building new or refactored products on Hyperdrive over Tunnels. For example: if you’ve already tried out Workers Builds, or recently submitted an abuse report, you’re among our first users! At the time of this writing, we have several more internal teams working to onboard, and we on the Hyperdrive team are very excited to see all the different ways in which fast and simple connections from Workers to a centralized database can help Cloudflare just as much as they’ve been helping our external customers.
Outro
Cloudflare is on a mission to make the Internet faster, safer, and more reliable. Hyperdrive was built to make connecting to centralized databases from the Workers runtime as quick and consistent as possible, and this latest development is designed to help all those who want to use Hyperdrive without directly exposing resources within their virtual private clouds (VPCs) on the public web.
To this end, we chose to build a solution around our suite of industry-leading Zero Trust tools, and were delighted to find how simple it was to implement in our runtime given the power and extensibility of the Rust trait system.
Without waiting for the ink to dry, multiple teams within Cloudflare have adopted this new feature to quickly and easily solve what have historically been complex challenges, and are happily operating it in production today.
We made our WAF Machine Learning models 5.5x faster, reducing execution time by approximately 82%, from 1519 to 275 microseconds! Read on to find out how we achieved this remarkable improvement.
WAF Attack Score is Cloudflare’s machine learning (ML)-powered layer built on top of our Web Application Firewall (WAF). Its goal is to complement the WAF and detect attack bypasses that we haven’t encountered before. This has proven invaluable in catching zero-day vulnerabilities, like the one detected in Ivanti Connect Secure, before they are publicly disclosed and enhancing our customers’ protection against emerging and unknown threats.
Since its launch in 2022, WAF attack score adoption has grown exponentially, now protecting millions of Internet properties and running real-time inference on tens of millions of requests per second. The feature’s popularity has driven us to seek performance improvements, enabling even broader customer use and enhancing Internet security.
In this post, we will discuss the performance optimizations we’ve implemented for our WAF ML product. We’ll guide you through specific code examples and benchmark numbers, demonstrating how these enhancements have significantly improved our system’s efficiency. Additionally, we’ll share the impressive latency reduction numbers observed after the rollout.
Before diving into the optimizations, let’s take a moment to review the inner workings of the WAF Attack Score, which powers our WAF ML product.
WAF Attack Score system design
Cloudflare’s WAF attack score identifies various traffic types and attack vectors (SQLi, XSS, Command Injection, etc.) based on structural or statistical content properties. Here’s how it works during inference:
HTTP Request Content: Start with raw HTTP input.
Normalization & Transformation: Standardize and clean the data, applying normalization, content substitutions, and de-duplication.
Feature Extraction: Tokenize the transformed content to generate statistical and structural data.
Machine Learning Model Inference: Analyze the extracted features with pre-trained models, mapping content representations to classes (e.g., XSS, SQLi or RCE) or scores.
Classification Output in WAF: Assign a score to the input, ranging from 1 (likely malicious) to 99 (likely clean), guiding security actions.
Next, we will explore feature extraction and inference optimizations.
Feature extraction optimizations
In the context of the WAF Attack Score ML model, feature extraction or pre-processing is essentially a process of tokenizing the given input and producing a float tensor of 1 x m size:
In our initial pre-processing implementation, this is achieved via a sliding window of 3 bytes over the input with the help of Rust’s std::collections::HashMap to look up the tensor index for a given ngram.
Initial benchmarks
To establish performance baselines, we’ve set up four benchmark cases representing example inputs of various lengths, ranging from 44 to 9482 bytes. Each case exemplifies typical input sizes, including those for a request body, user agent, and URI. We run benchmarks using the Criterion.rs statistics-driven micro-benchmarking tool:
Here are initial numbers for these benchmarks executed on a Linux laptop with a 13th Gen Intel® Core™ i7-13800H processor:
Benchmark case
Pre-processing time, μs
Throughput, MiB/s
preprocessing/long-body-9482
248.46
36.40
preprocessing/avg-body-1000
28.19
33.83
preprocessing/avg-url-44
1.45
28.94
preprocessing/avg-ua-91
2.87
30.24
An important observation from these results is that pre-processing time correlates with the length of the input string, with throughput ranging from 28 MiB/s to 36 MiB/s. This suggests that considerable time is spent iterating over longer input strings. Optimizing this part of the process could significantly enhance performance. The dependency of processing time on input size highlights a key area for performance optimization. To validate this, we should examine where the processing time is spent by analyzing flamegraphs created from a 100-second profiling session visualized using pprof:
Looking at the pre-processing flamegraph above, it’s clear that most of the time was spent on the following two operations:
Function name
% Time spent
std::collections::hash::map::HashMap<K,V,S>::get
61.8%
regex::regex::bytes::Regex::replace_all
18.5%
Let’s tackle the HashMap lookups first. Lookups are happening inside the tensor_populate_ngrams function, where input is split into windows of 3 bytes representing ngram and then lookup inside two hash maps:
fn tensor_populate_ngrams(tensor: &mut [f32], input: &[u8]) {
   // Populate the NORM ngrams
   let mut unknown_norm_ngrams = 0;
   let norm_offset = 1;

   for s in input.windows(3) {
       match NORM_VOCAB.get(s) {
           Some(pos) => {
               tensor[*pos as usize + norm_offset] += 1.0f32;
           }
           None => {
               unknown_norm_ngrams += 1;
           }
       };
   }

   // Populate the SIG ngrams
   let mut unknown_sig_ngrams = 0;
   let sig_offset = norm_offset + NORM_VOCAB.len();

   let res = SIG_REGEX.replace_all(&input, b"#");

   for s in res.windows(3) {
       match SIG_VOCAB.get(s) {
           Some(pos) => {
               // adding +1 here as the first position will be the unknown_sig_ngrams
               tensor[*pos as usize + sig_offset + 1] += 1.0f32;
           }
           None => {
               unknown_sig_ngrams += 1;
           }
       }
   }
}
So essentially the pre-processing function performs a ton of hash map lookups, the volume of which depends on the size of the input string, e.g. 1469 lookups for the given benchmark case avg-body-1000.
Optimization attempt #1: HashMap → Aho-Corasick
Rust hash maps are generally quite fast. However, when that many lookups are being performed, it’s not very cache friendly.
So can we do better than hash maps, and what should we try first? The answer is the Aho-Corasick library.
This library provides multiple pattern search principally through an implementation of the Aho-Corasick algorithm, which builds a fast finite state machine for executing searches in linear time.
We can also tune Aho-Corasick settings based on this recommendation:
Then we use the constructed AhoCorasick dictionary to lookup ngrams using its find_overlapping_iter method:
for mat in NORM_VOCAB_AC.find_overlapping_iter(&input) {
    tensor_input_data[mat.pattern().as_usize() + 1] += 1.0;
}
We ran benchmarks and compared them against the baseline times shown above:
Benchmark case
Baseline time, μs
Aho-Corasick time, μs
Optimization
preprocessing/long-body-9482
248.46
129.59
-47.84% or 1.64x
preprocessing/avg-body-1000
28.19
16.47
-41.56% or 1.71x
preprocessing/avg-url-44
1.45
1.01
-30.38% or 1.44x
preprocessing/avg-ua-91
2.87
1.90
-33.60% or 1.51x
That’s substantially better – Aho-Corasick DFA does wonders.
Optimization attempt #2: Aho-Corasick → match
One would think optimization with Aho-Corasick DFA is enough and that it seems unlikely that anything else can beat it. Yet, we can throw Aho-Corasick away and simply use the Rust match statement and let the compiler do the optimization for us!
Here’s how it performs in practice, based on the assembly generated by the Godbolt compiler explorer. The corresponding assembly code efficiently implements this lookup by employing a jump table and byte-wise comparisons to determine the return value based on input sequences, optimizing for quick decisions and minimal branching. Although the example only includes ten ngrams, it’s important to note that in applications like our WAF Attack Score ML models, we deal with thousands of ngrams. This simple match-based approach outshines both HashMap lookups and the Aho-Corasick method.
Benchmark case
Baseline time, μs
Match time, μs
Optimization
preprocessing/long-body-9482
248.46
112.96
-54.54% or 2.20x
preprocessing/avg-body-1000
28.19
13.12
-53.45% or 2.15x
preprocessing/avg-url-44
1.45
0.75
-48.37% or 1.94x
preprocessing/avg-ua-91
2.87
1.4076
-50.91% or 2.04x
Switching to match gave us another 7-18% drop in latency, depending on the case.
Optimization attempt #3: Regex → WindowedReplacer
So, what exactly is the purpose of Regex::replace_all in pre-processing? Regex is defined and used like this:
pub static SIG_REGEX: Lazy<Regex> =
    Lazy::new(|| RegexBuilder::new("[a-z]+").unicode(false).build().unwrap());
    ...
    let res = SIG_REGEX.replace_all(&input, b"#");
    for s in res.windows(3) {
        tensor[sig_vocab_lookup(s.try_into().unwrap())] += 1.0;
    }
Essentially, all we need is to:
Replace every sequence of lowercase letters in the input with a single byte “#”.
Iterate over replaced bytes in a windowed fashion with a step of 3 bytes representing an ngram.
Look up the ngram index and increment it in the tensor.
This logic seems simple enough that we could implement it more efficiently with a single pass over the input and without any allocations:
type Window = [u8; 3];
type Iter<'a> = Peekable<std::slice::Iter<'a, u8>>;

pub struct WindowedReplacer<'a> {
    window: Window,
    input_iter: Iter<'a>,
}

#[inline]
fn is_replaceable(byte: u8) -> bool {
    matches!(byte, b'a'..=b'z')
}

#[inline]
fn next_byte(iter: &mut Iter) -> Option<u8> {
    let byte = iter.next().copied()?;
    if is_replaceable(byte) {
        while iter.next_if(|b| is_replaceable(**b)).is_some() {}
        Some(b'#')
    } else {
        Some(byte)
    }
}

impl<'a> WindowedReplacer<'a> {
    pub fn new(input: &'a [u8]) -> Option<Self> {
        let mut window: Window = Default::default();
        let mut iter = input.iter().peekable();
        for byte in window.iter_mut().skip(1) {
            *byte = next_byte(&mut iter)?;
        }
        Some(WindowedReplacer {
            window,
            input_iter: iter,
        })
    }
}

impl<'a> Iterator for WindowedReplacer<'a> {
    type Item = Window;

    #[inline]
    fn next(&mut self) -> Option<Self::Item> {
        for i in 0..2 {
            self.window[i] = self.window[i + 1];
        }
        let byte = next_byte(&mut self.input_iter)?;
        self.window[2] = byte;
        Some(self.window)
    }
}
By utilizing the WindowedReplacer, we simplify the replacement logic:
if let Some(replacer) = WindowedReplacer::new(&input) {
    for ngram in replacer.windows(3) {
        tensor[sig_vocab_lookup(ngram.try_into().unwrap())] += 1.0;
    }
}
This new approach not only eliminates the need for allocating additional buffers to store replaced content, but also leverages Rust’s iterator optimizations, which the compiler can more effectively optimize. You can view an example of the assembly output for this new iterator at the provided Godbolt link.
Now let’s benchmark this and compare against the original implementation:
Benchmark case
Baseline time, μs
Match time, μs
Optimization
preprocessing/long-body-9482
248.46
51.00
-79.47% or 4.87x
preprocessing/avg-body-1000
28.19
5.53
-80.36% or 5.09x
preprocessing/avg-url-44
1.45
0.40
-72.11% or 3.59x
preprocessing/avg-ua-91
2.87
0.69
-76.07% or 4.18x
The new letters replacement implementation has doubled the preprocessing speed compared to the previously optimized version using match statements, and it is four to five times faster than the original version!
Optimization attempt #4: Going nuclear with branchless ngram lookups
At this point, 4-5x improvement might seem like a lot and there is no point pursuing any further optimizations. After all, using an ngram lookup with a match statement has beaten the following methods, with benchmarks omitted for brevity:
A Rust crate that allows you to use static compile-time generated hash maps and hash sets using PTHash perfect hash functions.
However, if we look again at the assembly of the norm_vocab_lookup function, it is clear that the execution flow has to perform a bunch of comparisons using cmp instructions. This creates many branches for the CPU to handle, which can lead to branch mispredictions. Branch mispredictions occur when the CPU incorrectly guesses the path of execution, causing delays as it discards partially completed instructions and fetches the correct ones. By reducing or eliminating these branches, we can avoid these mispredictions and improve the efficiency of the lookup process. How can we get rid of those branches when there is a need to look up thousands of unique ngrams?
Since there are only 3 bytes in each ngram, we can build two lookup tables of 256 x 256 x 256 size, storing the ngram tensor index. With this naive approach, our memory requirements will be: 256 x 256 x 256 x 2 x 2 = 64 MB, which seems like a lot.
However, given that we only care about ASCII bytes 0..127, then memory requirements can be lower: 128 x 128 x 128 x 2 x 2 = 8 MB, which is better. However, we will need to check for bytes >= 128, which will introduce a branch again.
So can we do better? Considering that the actual number of distinct byte values used in the ngrams is significantly less than the total possible 256 values, we can reduce memory requirements further by employing the following technique:
1. To avoid the branching caused by comparisons, we use precomputed offset lookup tables. This means instead of comparing each byte of the ngram during each lookup, we precompute the positions of each possible byte in a lookup table. This way, we replace the comparison operations with direct memory accesses, which are much faster and do not involve branching. We build an ngram bytes offsets lookup const array, storing each unique ngram byte offset position multiplied by the number of unique ngram bytes:
const NGRAM_OFFSETS: [[u32; 256]; 3] = [
    [
        // offsets of first byte in ngram
    ],
    [
        // offsets of second byte in ngram
    ],
    [
        // offsets of third byte in ngram
    ],
];
2. Then to obtain the ngram index, we can use this simple const function:
#[inline]
const fn ngram_index(ngram: [u8; 3]) -> usize {
    (NGRAM_OFFSETS[0][ngram[0] as usize]
        + NGRAM_OFFSETS[1][ngram[1] as usize]
        + NGRAM_OFFSETS[2][ngram[2] as usize]) as usize
}
3. To look up the tensor index based on the ngram index, we construct another const array at compile time using a list of all ngrams, where N is the number of unique ngram bytes:
4. Finally, to update the tensor based on given ngram, we lookup the ngram index, then the tensor index, and then increment it with help of get_unchecked_mut, which avoids unnecessary (in this case) boundary checks and eliminates another source of branching:
This logic works effectively, passes correctness tests, and most importantly, it’s completely branchless! Moreover, the memory footprint of used lookup arrays is tiny – just ~500 KiB of memory – which easily fits into modern CPU L2/L3 caches, ensuring that expensive cache misses are rare and performance is optimal.
The last trick we will employ is loop unrolling for ngrams processing. By taking 6 ngrams (corresponding to 8 bytes of the input array) at a time, the compiler can unroll the second loop and auto-vectorize it, leveraging parallel execution to improve performance:
const CHUNK_SIZE: usize = 6;

let chunks_max_offset =
    ((input.len().saturating_sub(2)) / CHUNK_SIZE) * CHUNK_SIZE;
for i in (0..chunks_max_offset).step_by(CHUNK_SIZE) {
    for ngram in input[i..i + CHUNK_SIZE + 2].windows(3) {
        update_tensor_with_ngram(tensor, ngram.try_into().unwrap());
    }
}
Tying up everything together, our final pre-processing benchmarks show the following:
Benchmark case
Baseline time, μs
Branchless time, μs
Optimization
preprocessing/long-body-9482
248.46
21.53
-91.33% or 11.54x
preprocessing/avg-body-1000
28.19
2.33
-91.73% or 12.09x
preprocessing/avg-url-44
1.45
0.26
-82.34% or 5.66x
preprocessing/avg-ua-91
2.87
0.43
-84.92% or 6.63x
The longer input is, the higher the latency drop will be due to branchless ngram lookups and loop unrolling, ranging from six to twelve times faster than baseline implementation.
After trying various optimizations, the final version of pre-processing retains optimization attempts 3 and 4, using branchless ngram lookup with offset tables and a single-pass non-allocating replacement iterator.
There are potentially more CPU cycles left on the table, and techniques like memory pre-fetching and manual SIMD intrinsics could speed this up a bit further. However, let’s now switch gears into looking at inference latency a bit closer.
Model inference optimizations
Initial benchmarks
Let’s have a look at original performance numbers of the WAF Attack Score ML model, which uses TensorFlow Lite 2.6.0:
Benchmark case
Inference time, μs
inference/long-body-9482
247.31
inference/avg-body-1000
246.31
inference/avg-url-44
246.40
inference/avg-ua-91
246.88
Model inference is actually independent of the original input length, as inputs are transformed into tensors of predetermined size during the pre-processing phase, which we optimized above. From now on, we will refer to a singular inference time when benchmarking our optimizations.
Digging deeper with profiler, we observed that most of the time is spent on the following operations:
The most expensive operation is matrix multiplication, which boils down to iteration within three nested loops:
void PortableMatrixBatchVectorMultiplyAccumulate(const float* matrix,
                                                 int m_rows, int m_cols,
                                                 const float* vector,
                                                 int n_batch, float* result) {
  float* result_in_batch = result;
  for (int b = 0; b < n_batch; b++) {
    const float* matrix_ptr = matrix;
    for (int r = 0; r < m_rows; r++) {
      float dot_prod = 0.0f;
      const float* vector_in_batch = vector + b * m_cols;
      for (int c = 0; c < m_cols; c++) {
        dot_prod += *matrix_ptr++ * *vector_in_batch++;
      }
      *result_in_batch += dot_prod;
     ++result_in_batch;
    }
  }
}
This doesn’t look very efficient and many blogs and research papers have been written on how matrix multiplication can be optimized, which basically boils down to:
Blocking: Divide matrices into smaller blocks that fit into the cache, improving cache reuse and reducing memory access latency.
Vectorization: Use SIMD instructions to process multiple data points in parallel, enhancing efficiency with vector registers.
Loop Unrolling: Reduce loop control overhead and increase parallelism by executing multiple loop iterations simultaneously.
To gain a better understanding of how these techniques work, we recommend watching this video, which brilliantly depicts the process of matrix multiplication:
Tensorflow Lite with AVX2
TensorFlow Lite does, in fact, support SIMD matrix multiplication – we just need to enable it and re-compile the TensorFlow Lite library:
if [[ "$(uname -m)" == x86_64* ]]; then
    # On x86_64 target x86-64-v3 CPU to enable AVX2 and FMA.
    arguments+=("--copt=-march=x86-64-v3")
fi
After running profiler again using the SIMD-optimized TensorFlow Lite library:
Matrix multiplication now uses AVX2 instructions, which uses blocks of 8×8 to multiply and accumulate the multiplication result.
Proportionally, matrix multiplication and quantization operations take a similar time share when compared to non-SIMD version, however in absolute numbers, it’s almost twice as fast when SIMD optimizations are enabled:
Benchmark case
Baseline time, μs
SIMD time, μs
Optimization
inference/avg-body-1000
246.31
130.07
-47.19% or 1.89x
Quite a nice performance boost just from a few lines of build config change!
Tensorflow Lite with XNNPACK
Tensorflow Lite comes with a useful benchmarking tool called benchmark_model, which also has a built-in profiler.
Tensorflow Lite with XNNPACK enabled emerges as a leader, achieving ~50% latency reduction, when compared to the original Tensorflow Lite implementation.
More technical details about XNNPACK can be found in these blog posts:
Re-running benchmarks with XNNPack enabled, we get the following results:
Benchmark case
Baseline time, μs TFLite 2.6.0
SIMD time, μs TFLite 2.6.0
SIMD time, μs TFLite 2.16.1
SIMD + XNNPack time, μs TFLite 2.16.1
Optimization
inference/avg-body-1000
246.31
130.07
115.17
56.22
-77.17% or 4.38x
By upgrading TensorFlow Lite from 2.6.0 to 2.16.1 and enabling SIMD optimizations along with the XNNPack, we were able to decrease WAF ML model inference time more than four-fold, achieving a 77.17% reduction.
Caching inference result
While making code faster through pre-processing and inference optimizations is great, it’s even better when code doesn’t need to run at all. This is where caching comes in. Amdahl’s Law suggests that optimizing only parts of a program has diminishing returns. By avoiding redundant executions with caching, we can achieve significant performance gains beyond the limitations of traditional code optimization.
A simple key-value cache would quickly occupy all available memory on the server due to the high cardinality of URLs, HTTP headers, and HTTP bodies. However, because “everything on the Internet has an L-shape” or more specifically, follows a Zipf’s law distribution, we can optimize our caching strategy.
Zipf‘s law states that in many natural datasets, the frequency of any item is inversely proportional to its rank in the frequency table. In other words, a few items are extremely common, while the majority are rare. By analyzing our request data, we found that URLs, HTTP headers, and even HTTP bodies follow this distribution. For example, here is the user agent header frequency distribution against its rank:
By caching the top-N most frequently occurring inputs and their corresponding inference results, we can ensure that both pre-processing and inference are skipped for the majority of requests. This is where the Least Recently Used (LRU) cache comes in – frequently used items stay hot in the cache, while the least recently used ones are evicted.
We use lua-resty-mlcache as our caching solution, allowing us to share cached inference results between different Nginx workers via a shared memory dictionary. The LRU cache effectively exploits the space-time trade-off, where we trade a small amount of memory for significant CPU time savings.
This approach enables us to achieve a ~70% cache hit ratio, significantly reducing latency further, as we will analyze in the final section below.
Optimization results
The optimizations discussed in this post were rolled out in several phases to ensure system correctness and stability.
First, we enabled SIMD optimizations for TensorFlow Lite, which reduced WAF ML total execution time by approximately 41.80%, decreasing from 1519 ➔ 884 μs on average.
Next, we upgraded TensorFlow Lite from version 2.6.0 to 2.16.1, enabled XNNPack, and implemented pre-processing optimizations. This further reduced WAF ML total execution time by ~40.77%, bringing it down from 932 ➔ 552 μs on average. The initial average time of 932 μs was slightly higher than the previous 884 μs due to the increased number of customers using this feature and the months that passed between changes.
Lastly, we introduced LRU caching, which led to an additional reduction in WAF ML total execution time by ~50.18%, from 552 ➔ 275 μs on average.
Overall, we cut WAF ML execution time by ~81.90%, decreasing from 1519 ➔ 275 μs, or 5.5x faster!
To illustrate the significance of this: with Cloudflare’s average rate of 9.5 million requests per second passing through WAF ML, saving 1244 microseconds per request equates to saving ~32 years of processing time every single day! That’s in addition to the savings of 523 microseconds per request or 65 years of processing time per day demonstrated last year in our Every request, every microsecond: scalable machine learning at Cloudflare post about our Bot Management product.
Conclusion
We hope you enjoyed reading about how we made our WAF ML models go brrr, just as much as we enjoyed implementing these optimizations to bring scalable WAF ML to more customers on a truly global scale.
Looking ahead, we are developing even more sophisticated ML security models. These advancements aim to bring our WAF and Bot Management products to the next level, making them even more useful and effective for our customers.
Today, we are proud to open source Pingora, the Rust framework we have been using to build services that power a significant portion of the traffic on Cloudflare. Pingora is released under the Apache License version 2.0.
As mentioned in our previous blog post, Pingora is a Rust async multithreaded framework that assists us in constructing HTTP proxy services. Since our last blog post, Pingora has handled nearly a quadrillion Internet requests across our global network.
We are open sourcing Pingora to help build a better and more secure Internet beyond our own infrastructure. We want to provide tools, ideas, and inspiration to our customers, users, and others to build their own Internet infrastructure using a memory safe framework. Having such a framework is especially crucial given the increasing awareness of the importance of memory safety across the industry and the US government. Under this common goal, we are collaborating with the Internet Security Research Group (ISRG) Prossimo project to help advance the adoption of Pingora in the Internet’s most critical infrastructure.
In our previous blog post, we discussed why and how we built Pingora. In this one, we will talk about why and how you might use Pingora.
Pingora provides building blocks for not only proxies but also clients and servers. Along with these components, we also provide a few utility libraries that implement common logic such as event counting, error handling, and caching.
What’s in the box
Pingora provides libraries and APIs to build services on top of HTTP/1 and HTTP/2, TLS, or just TCP/UDP. As a proxy, it supports HTTP/1 and HTTP/2 end-to-end, gRPC, and websocket proxying. (HTTP/3 support is on the roadmap.) It also comes with customizable load balancing and failover strategies. For compliance and security, it supports both the commonly used OpenSSL and BoringSSL libraries, which come with FIPS compliance and post-quantum crypto.
Besides providing these features, Pingora provides filters and callbacks to allow its users to fully customize how the service should process, transform and forward the requests. These APIs will be especially familiar to OpenResty and NGINX users, as many map intuitively onto OpenResty’s “*_by_lua” callbacks.
Operationally, Pingora provides zero downtime graceful restarts to upgrade itself without dropping a single incoming request. Syslog, Prometheus, Sentry, OpenTelemetry and other must-have observability tools are also easily integrated with Pingora as well.
Who can benefit from Pingora
You should consider Pingora if:
Security is your top priority: Pingora is a more memory safe alternative for services that are written in C/C++. While some might argue about memory safety among programming languages, from our practical experience, we find ourselves way less likely to make coding mistakes that lead to memory safety issues. Besides, as we spend less time struggling with these issues, we are more productive implementing new features.
Your service is performance-sensitive: Pingora is fast and efficient. As explained in our previous blog post, we saved a lot of CPU and memory resources thanks to Pingora’s multi-threaded architecture. The saving in time and resources could be compelling for workloads that are sensitive to the cost and/or the speed of the system.
Your service requires extensive customization: The APIs that the Pingora proxy framework provides are highly programmable. For users who wish to build a customized and advanced gateway or load balancer, Pingora provides powerful yet simple ways to implement it. We provide examples in the next section.
Let’s build a load balancer
Let’s explore Pingora’s programmable API by building a simple load balancer. The load balancer will select between https://1.1.1.1/ and https://1.0.0.1/ to be the upstream in a round-robin fashion.
Any object that implements the ProxyHttp trait (similar to the concept of an interface in C++ or Java) is an HTTP proxy. The only required method there is upstream_peer(), which is called for every request. This function should return an HttpPeer which contains the origin IP to connect to and how to connect to it.
Next let’s implement the round-robin selection. The Pingora framework already provides the LoadBalancer with common selection algorithms such as round robin and hashing, so let’s just use it. If the use case requires more sophisticated or customized server selection logic, users can simply implement it themselves in this function.
pub struct LB(Arc<LoadBalancer<RoundRobin>>);

#[async_trait]
impl ProxyHttp for LB {
    async fn upstream_peer(...) -> Result<Box<HttpPeer>> {
        let upstream = self.0
            .select(b"", 256) // hash doesn't matter for round robin
            .unwrap();

        // Set SNI to one.one.one.one
        let peer = Box::new(HttpPeer::new(upstream, true, "one.one.one.one".to_string()));
        Ok(peer)
    }
}
Since we are connecting to an HTTPS server, the SNI also needs to be set. Certificates, timeouts, and other connection options can also be set here in the HttpPeer object if needed.
Finally, let’s put the service in action. In this example we hardcode the origin server IPs. In real life workloads, the origin server IPs can also be discovered dynamically when the upstream_peer() is called or in the background. After the service is created, we just tell the LB service to listen to 127.0.0.1:6188. In the end we created a Pingora server, and the server will be the process which runs the load balancing service.
fn main() {
    let mut upstreams = LoadBalancer::try_from_iter(["1.1.1.1:443", "1.0.0.1:443"]).unwrap();

    let mut lb = pingora_proxy::http_proxy_service(&my_server.configuration, LB(upstreams));
    lb.add_tcp("127.0.0.1:6188");

    let mut my_server = Server::new(None).unwrap();
    my_server.add_service(lb);
    my_server.run_forever();
}
We can see that the proxy is working, but the origin server rejects us with a 403. This is because our service simply proxies the Host header, 127.0.0.1:6188, set by curl, which upsets the origin server. How do we make the proxy correct that? This can simply be done by adding another filter called upstream_request_filter. This filter runs on every request after the origin server is connected and before any HTTP request is sent. We can add, remove or change http request headers in this filter.
curl 127.0.0.1:6188 -svo /dev/null
< HTTP/1.1 200 OK
This time it works! The complete example can be found here.
Below is a very simple diagram of how this request flows through the callback and filter we used in this example. The Pingora proxy framework currently provides more filters and callbacks at different stages of a request to allow users to modify, reject, route and/or log the request (and response).
Behind the scenes, the Pingora proxy framework takes care of connection pooling, TLS handshakes, reading, writing, parsing requests and any other common proxy tasks so that users can focus on logic that matters to them.
Open source, present and future
Pingora is a library and toolset, not an executable binary. In other words, Pingora is the engine that powers a car, not the car itself. Although Pingora is production-ready for industry use, we understand a lot of folks want a batteries-included, ready-to-go web service with low or no-code config options. Building that application on top of Pingora will be the focus of our collaboration with the ISRG to expand Pingora’s reach. Stay tuned for future announcements on that project.
Other caveats to keep in mind:
Today, API stability is not guaranteed. Although we will try to minimize how often we make breaking changes, we still reserve the right to add, remove, or change components such as request and response filters as the library evolves, especially during this pre-1.0 period.
Support for non-Unix based operating systems is not currently on the roadmap. We have no immediate plans to support these systems, though this could change in the future.
How to contribute
Feel free to raise bug reports, documentation issues, or feature requests in our GitHub issue tracker. Before opening a pull request, we strongly suggest you take a look at our contribution guide.
Conclusion
In this blog we announced the open source of our Pingora framework. We showed that Internet entities and infrastructure can benefit from Pingora’s security, performance and customizability. We also demonstrated how easy it is to use Pingora and how customizable it is.
Whether you’re building production web services or experimenting with network technologies we hope you find value in Pingora. It’s been a long journey, but sharing this project with the open source community has been a goal from the start. We’d like to thank the Rust community as Pingora is built with many great open-sourced Rust crates. Moving to a memory safe Internet may feel like an impossible journey, but it’s one we hope you join us on.
Today, we are thrilled to announce the release of bpftop, a command-line tool designed to streamline the performance optimization and monitoring of eBPF applications. As Netflix increasingly adopts eBPF [1, 2], applying the same rigor to these applications as we do to other managed services is imperative. Striking a balance between eBPF’s benefits and system load is crucial, ensuring it enhances rather than hinders our operational efficiency. This tool enables Netflix to embrace eBPF’s potential.
Introducing bpftop
bpftop provides a dynamic real-time view of running eBPF programs. It displays the average execution runtime, events per second, and estimated total CPU % for each program. This tool minimizes overhead by enabling performance statistics only while it is active.
bpftop simplifies the performance optimization process for eBPF programs by enabling an efficient cycle of benchmarking, code refinement, and immediate feedback. Without bpftop, optimization efforts would require manual calculations, adding unnecessary complexity to the process. With bpftop, users can quickly establish a baseline, implement improvements, and verify enhancements, streamlining the process.
A standout feature of this tool is its ability to display the statistics in time series graphs. This approach can uncover patterns and trends that could be missed otherwise.
How it works
bpftop uses the BPF_ENABLE_STATS syscall command to enable global eBPF runtime statistics gathering, which is disabled by default to reduce performance overhead. It collects these statistics every second, calculating the average runtime, events per second, and estimated CPU utilization for each eBPF program within that sample period. This information is displayed in a top-like tabular format or a time series graph over a 10s moving window. Once bpftop terminates, it turns off the statistics-gathering function. The tool is written in Rust, leveraging the libbpf-rs and ratatui crates.
Getting started
Visit the project’s GitHub page to learn more about using the tool. We’ve open-sourced bpftop under the Apache 2 license and look forward to contributions from the community.
In this blog post, we’re excited to present Foundations, our foundational library for Rust services, now released as open source on GitHub. Foundations is a foundational Rust library, designed to help scale programs for distributed, production-grade systems. It enables engineers to concentrate on the core business logic of their services, rather than the intricacies of production operation setups.
Originally developed as part of our Oxy proxy framework, Foundations has evolved to serve a wider range of applications. For those interested in exploring its technical capabilities, we recommend consulting the library’s API documentation. Additionally, this post will cover the motivations behind Foundations’ creation and provide a concise summary of its key features. Stay with us to learn more about how Foundations can support your Rust projects.
What is Foundations?
In software development, seemingly minor tasks can become complex when scaled up. This complexity is particularly evident when comparing the deployment of services on server hardware globally to running a program on a personal laptop.
The key question is: what fundamentally changes when transitioning from a simple laptop-based prototype to a full-fledged service in a production environment? Through our experience in developing numerous services, we’ve identified several critical differences:
Observability: locally, developers have access to various tools for monitoring and debugging. However, these tools are not as accessible or practical when dealing with thousands of software instances running on remote servers.
Configuration: local prototypes often use basic, sometimes hardcoded, configurations. This approach is impractical in production, where changes require a more flexible and dynamic configuration system. Hardcoded settings are cumbersome, and command-line options, while common, don’t always suit complex hierarchical configurations or align with the “Configuration as Code” paradigm.
Security: services in production face a myriad of security challenges, exposed to diverse threats from external sources. Basic security hardening becomes a necessity.
Addressing these distinctions, Foundations emerges as a comprehensive library, offering solutions to these challenges. Derived from our Oxy proxy framework, Foundations brings the tried-and-tested functionality of Oxy to a broader range of Rust-based applications at Cloudflare.
Foundations was developed with these guiding principles:
High modularity: recognizing that many services predate Foundations, we designed it to be modular. Teams can adopt individual components at their own pace, facilitating a smooth transition.
API ergonomics: a top priority for us is user-friendly library interaction. Foundations leverages Rust’s procedural macros to offer an intuitive, well-documented API, aiming for minimal friction in usage.
Simplified setup and configuration: our goal is for engineers to spend minimal time on setup. Foundations is designed to be ‘plug and play’, with essential functions working immediately and adjustable settings for fine-tuning. We understand that this focus on ease of setup over extreme flexibility might be debatable, as it implies a trade-off. Unlike other libraries that cater to a wide range of environments with potentially verbose setup requirements, Foundations is tailored for specific, production-tested environments and workflows. This doesn’t restrict Foundations’ adaptability to other settings, but we approach this with compile-time features to manage setup workflows, rather than a complex setup API.
Next, let’s delve into the components Foundations offers. To better illustrate the functionality that Foundations provides we will refer to the example web server from Foundations’ source code repository.
Telemetry
In any production system, observability, which we refer to as telemetry, plays an essential role. Generally, three primary types of telemetry are adequate for most service needs:
Logging: this involves recording arbitrary textual information, which can be enhanced with tags or structured fields. It’s particularly useful for documenting operational errors that aren’t critical to the service.
Tracing: this method offers a detailed timing breakdown of various service components. It’s invaluable for identifying performance bottlenecks and investigating issues related to timing.
Metrics: these are quantitative data points about the service, crucial for monitoring the overall health and performance of the system.
Foundations integrates an API that encompasses all these telemetry aspects, consolidating them into a unified package for ease of use.
Tracing
Foundations’ tracing API shares similarities with tokio/tracing, employing a comparable approach with implicit context propagation, instrumentation macros, and futures wrapping:
However, Foundations distinguishes itself in a few key ways:
Simplified API: we’ve streamlined the setup process for tracing, aiming for a more minimalistic approach compared to tokio/tracing.
Enhanced trace sampling flexibility: Foundations allows for selective override of the sampling ratio in specific code branches. This feature is particularly useful for detailed performance bug investigations, enabling a balance between global trace sampling for overall performance monitoring and targeted sampling for specific accounts, connections, or requests.
Distributed trace stitching: our API supports the integration of trace data from multiple services, contributing to a comprehensive view of the entire pipeline. This functionality includes fine-tuned control over sampling ratios, allowing upstream services to dictate the sampling of specific traffic flows in downstream services.
Trace forking capability: addressing the challenge of long-lasting connections with numerous multiplexed requests, Foundations introduces trace forking. This feature enables each request within a connection to have its own trace, linked to the parent connection trace. This method significantly simplifies the analysis and improves performance, particularly for connections handling thousands of requests.
We regard telemetry as a vital component of our software, not merely an optional add-on. As such, we believe in rigorous testing of this feature, considering it our primary tool for monitoring software operations. Consequently, Foundations includes an API and user-friendly macros to facilitate the collection and analysis of tracing data within tests, presenting it in a format conducive to assertions.
Logging
Foundations’ logging API shares its foundation with tokio/tracing and slog, but introduces several notable enhancements.
During our work on various services, we recognized the hierarchical nature of logging contextual information. For instance, in a scenario involving a connection, we might want to tag each log record with the connection ID and HTTP protocol version. Additionally, for requests served over this connection, it would be useful to attach the request URL to each log record, while still including connection-specific information.
Typically, achieving this would involve creating a new logger for each request, copying tags from the connection’s logger, and then manually passing this new logger throughout the relevant code. This method, however, is cumbersome, requiring explicit handling and storage of the logger object.
To streamline this process and prevent telemetry from obstructing business logic, we adopted a technique similar to tokio/tracing’s approach for tracing, applying it to logging. This method relies on future instrumentation machinery (tracing-rs documentation has a good explanation of the concept), allowing for implicit passing of the current logger. This enables us to “fork” logs for each request and use this forked log seamlessly within the current code scope, automatically propagating it down the call stack, including through asynchronous function calls:
 let conn_tele_ctx = TelemetryContext::current();

 let on_request = service_fn({
        let endpoint_name = Arc::clone(&endpoint_name);

        move |req| {
            let routes = Arc::clone(&routes);
            let endpoint_name = Arc::clone(&endpoint_name);

            // Each request gets independent log inherited from the connection log and separate
            // trace linked to the connection trace.
            conn_tele_ctx
                .with_forked_log()
                .with_forked_trace("request")
                .apply(async move { respond(endpoint_name, req, routes).await })
        }
});
In an effort to simplify the user experience, we merged all APIs related to context management into a single, implicitly available in each code scope, TelemetryContext object. This integration not only simplifies the process but also lays the groundwork for future advanced features. These features could blend tracing and logging information into a cohesive narrative by cross-referencing each other.
Like tracing, Foundations also offers a user-friendly API for testing service’s logging.
Metrics
Foundations incorporates the official Prometheus Rust client library for its metrics functionality, with a few enhancements for ease of use. One key addition is a procedural macro provided by Foundations, which simplifies the definition of new metrics with typed labels, reducing boilerplate code:
use foundations::telemetry::metrics::{metrics, Counter, Gauge};
use std::sync::Arc;

#[metrics]
pub(crate) mod http_server {
    /// Number of active client connections.
    pub fn active_connections(endpoint_name: &Arc<String>) -> Gauge;

    /// Number of failed client connections.
    pub fn failed_connections_total(endpoint_name: &Arc<String>) -> Counter;

    /// Number of HTTP requests.
    pub fn requests_total(endpoint_name: &Arc<String>) -> Counter;

    /// Number of failed requests.
    pub fn requests_failed_total(endpoint_name: &Arc<String>, status_code: u16) -> Counter;
}
In addition to this, we have refined the approach to metrics collection and structuring. Foundations offers a streamlined, user-friendly API for both these tasks, focusing on simplicity and minimalism.
Memory profiling
Recognizing the efficiency of jemalloc for long-lived services, Foundations includes a feature for enabling jemalloc memory allocation. A notable aspect of jemalloc is its memory profiling capability. Foundations packages this functionality into a straightforward and safe Rust API, making it accessible and easy to integrate.
Telemetry server
Foundations comes equipped with a built-in, customizable telemetry server endpoint. This server automatically handles a range of functions including health checks, metric collection, and memory profiling requests.
Security
A vital component of Foundations is its robust and ergonomic API for seccomp, a Linux kernel feature for syscall sandboxing. This feature enables the setting up of hooks for syscalls used by an application, allowing actions like blocking or logging. Seccomp acts as a formidable line of defense, offering an additional layer of security against threats like arbitrary code execution.
Foundations provides a simple way to define lists of all allowed syscalls, also allowing a composition of multiple lists (in addition, Foundations ships predefined lists for common use cases):
Foundations simplifies the management of service settings and command-line argument parsing. Services built on Foundations typically use YAML files for configuration. We advocate for a design where every service comes with a default configuration that’s functional right off the bat. This philosophy is embedded in Foundations’ settings functionality.
In practice, applications define their settings and defaults using Rust structures and enums. Foundations then transforms Rust documentation comments into configuration annotations. This integration allows the CLI interface to generate a default, fully annotated YAML configuration files. As a result, service users can quickly and easily understand the service settings:
use foundations::settings::collections::Map;
use foundations::settings::net::SocketAddr;
use foundations::settings::settings;
use foundations::telemetry::settings::TelemetrySettings;

#[settings]
pub(crate) struct HttpServerSettings {
    /// Telemetry settings.
    pub(crate) telemetry: TelemetrySettings,
    /// HTTP endpoints configuration.
    #[serde(default = "HttpServerSettings::default_endpoints")]
    pub(crate) endpoints: Map<String, EndpointSettings>,
}

impl HttpServerSettings {
    fn default_endpoints() -> Map<String, EndpointSettings> {
        let mut endpoint = EndpointSettings::default();

        endpoint.routes.insert(
            "/hello".into(),
            ResponseSettings {
                status_code: 200,
                response: "World".into(),
            },
        );

        endpoint.routes.insert(
            "/foo".into(),
            ResponseSettings {
                status_code: 403,
                response: "bar".into(),
            },
        );

        [("Example endpoint".into(), endpoint)]
            .into_iter()
            .collect()
    }
}

#[settings]
pub(crate) struct EndpointSettings {
    /// Address of the endpoint.
    pub(crate) addr: SocketAddr,
    /// Endoint's URL path routes.
    pub(crate) routes: Map<String, ResponseSettings>,
}

#[settings]
pub(crate) struct ResponseSettings {
    /// Status code of the route's response.
    pub(crate) status_code: u16,
    /// Content of the route's response.
    pub(crate) response: String,
}
The settings definition above automatically generates the following default configuration YAML file:
---
# Telemetry settings.
telemetry:
  # Distributed tracing settings
  tracing:
    # Enables tracing.
    enabled: true
    # The address of the Jaeger Thrift (UDP) agent.
    jaeger_tracing_server_addr: "127.0.0.1:6831"
    # Overrides the bind address for the reporter API.
    # By default, the reporter API is only exposed on the loopback
    # interface. This won't work in environments where the
    # Jaeger agent is on another host (for example, Docker).
    # Must have the same address family as `jaeger_tracing_server_addr`.
    jaeger_reporter_bind_addr: ~
    # Sampling ratio.
    #
    # This can be any fractional value between `0.0` and `1.0`.
    # Where `1.0` means "sample everything", and `0.0` means "don't sample anything".
    sampling_ratio: 1.0
  # Logging settings.
  logging:
    # Specifies log output.
    output: terminal
    # The format to use for log messages.
    format: text
    # Set the logging verbosity level.
    verbosity: INFO
    # A list of field keys to redact when emitting logs.
    #
    # This might be useful to hide certain fields in production logs as they may
    # contain sensitive information, but allow them in testing environment.
    redact_keys: []
  # Metrics settings.
  metrics:
    # How the metrics service identifier defined in `ServiceInfo` is used
    # for this service.
    service_name_format: metric_prefix
    # Whether to report optional metrics in the telemetry server.
    report_optional: false
  # Server settings.
  server:
    # Enables telemetry server
    enabled: true
    # Telemetry server address.
    addr: "127.0.0.1:0"
# HTTP endpoints configuration.
endpoints:
  Example endpoint:
    # Address of the endpoint.
    addr: "127.0.0.1:0"
    # Endoint's URL path routes.
    routes:
      /hello:
        # Status code of the route's response.
        status_code: 200
        # Content of the route's response.
        response: World
      /foo:
        # Status code of the route's response.
        status_code: 403
        # Content of the route's response.
        response: bar
Refer to the example web server and documentation for settings and CLI API for more comprehensive examples of how settings can be defined and used with Foundations-provided CLI API.
Wrapping Up
At Cloudflare, we greatly value the contributions of the open source community and are eager to reciprocate by sharing our work. Foundations has been instrumental in reducing our development friction, and we hope it can do the same for others. We welcome external contributions to Foundations, aiming to integrate diverse experiences into the project for the benefit of all.
If you’re interested in working on projects like Foundations, consider joining our team — we’re hiring!
The Rust programming language was created by Mozilla Research in 2010 to be “a programming language empowering everyone to build reliable and efficient(fast) software”[1]. If you are a beginner level SDE or a DevOps engineer or a decision maker in your organization looking to adopt Rust for your specific use, you will find this blog helpful to get started with Rust on AWS. We will begin by explaining why Rust has gained a huge traction over programming languages like C, C++, Java, Python, and Go. We will then talk about why AWS is one of the best platforms for Rust. Finally, we will provide an example of how you can quickly run a Rust program using AWS Lambda function.
Why Rust?
Rust is an efficient and reliable programming language that addresses performance, reliability, and productivity all at once. It distinguishes itself from its peers by boasting memory safety and thread safety without a need for garbage collector.
Historically, C and C++ have held the title of being the most performant programming languages; however, their speeds have often come with a significant cost to their safety and maintainability. The biggest threat in using such languages range from corruption of valid data to the execution of arbitrary code. The frequency of these issues is even more obvious when you notice that from 2007 to 2019, 70 percent of all vulnerabilities addressed by Microsoft through security updates pertain to memory safety [2]. Languages like Java have come a long way in mitigating such vulnerabilities using garbage collector, however this has come with significant performance bottleneck. Rust seeks to marry performance and safety using its novel borrow-checker, which is a type of static analysis tool that can help check for errors in code such as null-pointer dereferences, data races, etc.
There are other ways programs may access invalid memory. Iterating through an array, for example, requires the iterator to know how many elements are in the array to create a stopping condition. Furthermore, without checking array out of bounds, how would an accessor method be sure it is not accessing an index that does not exist? Here, safety comes with a performance overhead. Typically, the safety benefits of languages like Java are worth the performance overhead. However, for situations where safety and speed are both an absolute necessity, developers may choose to run their mission critical applications in Rust. Here, Rust can be viewed as a memory-safe, fast, low-resource programming language that requires no runtime. This makes Rust also suitable to run on embedded or low-resource device applications.
Rust brings polished tooling, a robust package manager (Cargo), and perhaps most importantly – a fast-growing and passionate community of developers. As Rust gains in popularity, so does the number of high-profile organizations adopting it (including AWS!) for critical applications where performance and safety are top concerns. Did you know that Amazon S3 leverages Rust to attempt to return responses with single-digit millisecond latency? To name a few, AWS product components written in Rust include Amazon CloudFront, Amazon EC2, and AWS Lambda among others.
There are many great resources to learn Rust. Most Rust developers start with the official Rust book, which is available for free online.
Rust matters to AWS for two main reasons. First, our customers are choosing to use Rust for their mission critical workloads and adoption is growing, therefore it becomes imperative that AWS provides the best tools possible to run Rust on AWS. In the next section, I will provide an example to show how easy it is to interact with AWS services using Rust runtime on AWS Lambda.
Additionally, it is important that we are creating high performant, safe infrastructure and services for our customers to run their business critical workloads on AWS. In 2018, AWS first launched its open source microVM technology Firecracker written completely in Rust. Since then, AWS has delivered over two dozen open source projects developed in Rust. For instance, AWS uses Firecracker to run AWS Lambda and AWS Fargate. Today, AWS Lambda processes trillions of executions for hundreds of thousands of active customers every month. Its ability to fire up AWS Lambda or AWS Fargate in less than 125ms attributes to blazing fast speed of Rust. AWS also developed and launched Bottlerocket, a Linux-based open source container OS purpose built for running containers. Veeva Systems a leader in cloud based software for the life sciences industry runs a variety of microservices on Bottleneck securely, with enhanced resource efficiency, and decreased management overhead, thanks to Rust.
Here at AWS, our product development teams have leveraged Rust to deliver more than a dozen services. Besides services such as Amazon Simple Storage Service (Amazon S3), AWS developers uses Rust as the language of choice to develop product components for Amazon Elastic Compute Cloud (Amazon EC2), Amazon CloudFront, Amazon Route 53, and more. Our Amazon EC2 team uses Rust for new AWS Nitro System components, including sensitive applications such as Nitro Enclaves.
Not only is AWS using Rust for improving their product response times, we are actively contributing to and supporting Rust and the open source ecosystem around it. AWS employs a number of core open source contributors to the Rust project and popular Rust libraries like tokio, used for writing asynchronous applications with Rust. According to Marc Brooker, Distinguished Engineer and Vice President of Database and AI at AWS, “Hiring engineers to work directly on Rust allows us to improve it in ways that matter to us and to our customers, and help grow the overall Rust community.” AWS is an active member on the Board of Directors for the Rust Foundation and have generously donated infrastructure and technology services to the Rust Foundation. You can read more about how AWS is helping the Rust community here.
Getting Started with Rust on AWS
This demonstration will walk you through creating your first AWS Lambda + Rust App! We’ll bootstrap the development process by utilizing the AWS Serverless Application Model (SAM)—a tool designed for building, deploying, and managing serverless applications. AWS SAM streamlines the Rust development process by setting up AWS’s official Rust Lambda Runtime, Cargo Lambda. This runtime offers a specialized build tool command for direct deployment to AWS. Additionally, AWS SAM integrates both Amazon DynamoDB table and an Amazon API Gateway endpoint. The provided example serves as a foundational template for leveraging the AWS Rust SDK with Amazon DynamoDB.
4. Name the project (for demo: “rust-ddb-example-app“)
5. Now navigate into the newly created directory with the SAM application code and execute sam build && sam deploy --guided.
a. Accept prompts with “y” or defaults.
6. After deployment concludes, record the Amazon CloudFormation “PutApi” output URL. (i.e https://a1b2c3d4e5f6.execute-api.us-west-2.amazonaws.com/Prod/)
7. Add an element to your table. (For the demo the id of our element will be foo and the payload will be bar). (e.g curl -X PUT <PutApi URL>/foo -d "bar")
8. Validate the addition via the AWS Console’s DynamoDB. Locate the table named after your AWS SAM app and verify the new item. You can do this by going to the AWS Console, clicking DynamoDB, then Tables, and then Explore Items.
What Next?
This is a great starting point on your journey with Rust on AWS. For taking your development journey to the next level consider:
Explore More Rust on AWS: AWS provides a plethora of examples and documentation. Explore the AWS Rust GitHub Repository for more intricate use cases and examples.
Join a Rust Workshop: AWS often hosts workshops and webinars on various topics. Keep an eye on the AWS Events Page for an upcoming Rust-focused session.
Deepen Your Rust Knowledge: If you’re new to Rust or want to delve deeper, the Rust Book is an excellent resource. We also highly recommend watching the videos on the Cargo Lambda documentation page.
Engage with the Community: The Rust community is vibrant and welcoming. Join forums, attend meetups, and participate in discussions to grow your network and knowledge. Become a member of Rust Foundation to collaborate with other members of the community.
Contribute to make Rust even better: Report on bugs or fix them, write documentation, and add new features. Here is how.
Conclusion
For those of us living in the safety net confines of an interpreter, Rust changes how we can still execute safely in a compiler generated world. Most importantly, Rust brings to the table blazing fast speed and performance without compromises to the security and stability of the system. It is a language of choice in embedded-systems programming, mission critical systems, blockchain and crypto development, and has found its place in 3D video gaming as well.
Rust on AWS is a game changer in that it makes it easy for developers to run code without having the need to setup extensive infrastructure to run it. It serves as an excellent backend service with zero administration. AWS Lambda‘s in-built Rust support further exemplifies AWS’s commitment to accommodating popularity of this language. In addition, the popularity of Rust has mandated an inbuilt handler be added to AWS Lambda for further support of Rust.
For the eighth year in a row, Rust has topped the chart as “the most desired programming language” in Stack Overflow’s annual developer survey. And with more than 80% of developers reporting that they’d like to use the language again next year, you have to wonder how a language created less than 20 years ago has stolen the hearts of developers around the world.
In this article, we’ll look at the history of Rust, what it’s commonly used for, why developers love it so much, and some resources to help you start learning one of the top fastest growing languages on GitHub.
So, what is the Rust programming language?
Rust’s print macro displaying the output “Hello, World!”
Originally intended to serve as a safer alternative to C and C++, Rust is a systems programming language that has gained significant popularity among developers thanks to its emphasis on safety, performance, and productivity. Rust is a statically typed language, so variable and expression types are determined and checked at compile time, which helps enhance memory safety and error detection, resulting in more reliable builds.
In 2006, the software developer, Graydon Hoare, started Rust as a personal project while he was working at Mozilla. According to an interview with MIT Technology Review, the inspiration for Rust came from a broken elevator in Hoare’s apartment building. The software for the lift operation system had crashed and Hoare understood that issues like this usually came from problems with how a program uses memory.
Quite often, the software for these types of devices is written in C or C++, but these languages require significant memory management, which can lead to errors that would cause the system to crash. So, Hoare set to work on figuring out how to create a programming language that could be both compact and memory bug-free.
He later showed the project to a manager—which led to Mozilla sponsoring it in 2009 as part of a longer-term effort to incorporate the language into the development of an experimental browser engine. In 2010, Mozilla Research officially announced the Rust project and released the source code to the public as an open-source project. After several years of development, Rust reached a stable and mature state—and in May 2015, Rust 1.0 was released. This milestone signaled that Rust was ready for production and provided a foundation for developers to build upon.
Since the 1.0 release, Rust has exploded in popularity and adoption, with top applications, such as Microsoft Windows, utilizing Rust to rewrite core libraries with its memory-safe code. Outside of the tech giants, Rust also has a vibrant community of developers, or “Rustaceans,” that are dedicated to making the Rust experience an active and collaborative one.
Meet Ferris, the unofficial mascot for Rust!
According to a recent survey by SlashData, there are roughly 2.8 million Rust developers worldwide in 2023, a number that has nearly tripled over the past two years. With plenty of active forums, documentation, and a supportive community for developers of all skill levels, it’s perhaps unsurprising that Rust keeps topping the most-desired language lists.
What makes Rust special?
So, what are some of Rust’s key features that make it so attractive to developers?
In simple terms, Rust solves some of developers’ most frustrating memory management problems commonly associated with C and C++, but that’s not its only shining capability. One of GitHub’s staff software engineers, Jason Orendorff, who co-authored a book on programming with Rust, said about the language:
“To me, what’s great about Rust is that it’s both fast AND reliable,” according to Orendorff. “It lets me write multi-headed programs that run on 16 cores and keep them readable, maintainable, and crash-free. It also lets me write very low-level algorithms requiring control over memory layout and pull in a crate that makes HTTPS requests super simple. It’s the combination of these features that makes Rust so unique.”
Building on that, here’s a few more of its well-loved characteristics and features:
Concurrency. Rust has built-in support for concurrent programming through its ownership system which enforces strict rules for data access, and its borrowing model, which prevents data races by allowing controlled, simultaneous access. This ensures that multiple threads can work on shared data without introducing memory-related issues.
No garbage collection. Unlike some programming languages, Rust does not employ garbage collection. Instead, its ownership and borrowing rules manage memory, which helps empower developers to have precise control over memory allocation and deallocation for efficient resource management.
Cargo Package Manager. Rust’s built-in package manager, Cargo, streamlines project management, dependency tracking, and building, which helps contribute to efficient and organized development workflows. But this doesn’t make it clear just how bonkers the Cargo ecosystem is. According to Orendorff, “My team takes advantage of high-quality open source packages for hashing, serialization, multithreading, data structures, compression, and a lot more. These are performance-critical libraries. Without some of these, our project to rethink code search on GitHub wouldn’t have been possible.” And here’s a fun fact: Rust was actually the first systems programming language to have a standard package manager, and, as a result, the Rust ecosystem is incredibly robust.
Zero-cost abstractions. This feature allows developers to write high-level code abstractions and features without introducing any runtime performance overhead.
Pattern matching. This powerful language feature enables developers to concisely and effectively match complex data structures against specific patterns to extract and handle different cases or scenarios in a clean and readable manner.
Type inference. This feature allows Rust’s compiler to automatically detect an expression based on context while you code. “Many programming languages have some type inference,” Orendorff said. “C# and C++ have some, Rust has a little more, and languages like Haskell, Scala, and ML have even more.”
fn main() {
    break rust;
}
Run this code for an inside joke among Rust developers 😆
What is Rust commonly used for?
Thanks to its direct access to both hardware and memory, Rust is well suited for embedded systems and bare-metal development. And since it’s a general purpose language, it can also be used for a variety of applications.
Let’s explore a few key use cases:
Using Rust to build performance-critical backend systems
Performance-critical backend systems are software components or services that handle tasks that require high-speed processing, low-latency responses, and efficient resource utilization—and Rust’s performance, thread safety, and error handling make it an excellent choice for developing these types of systems. In fact, we use Rust to build some of these systems at GitHub. For example, the backend of our code search feature is written in Rust (and you can read more about the development of GitHub’s newest code search with Rust, too).
Using Rust to develop operating systems
Rust was originally created to solve an operating system issue (remember the elevator problem?)—so, unsurprisingly, it’s often used to build operating systems, kernels, device drivers, or other low-level components where control over memory and performance is crucial. Redox, a Unix-like operating system, was written in Rust, which contributes to its most crucial feature: its security. “Fuchsia is another example that was built at Google,” Orendorff said. “If you have a Google Nest smart speaker, it’s likely running Fuchsia.”
Rust for operating system-adjacent code
Rust is also well-suited for writing code that performs tasks that closely interact with the operating system. For example, the Codespaces team at GitHub is leveraging Rust to enhance the speed of starting up the virtual disk within GitHub Codespaces and optimize the utilization of Azure storage. Coursera also employs Rust in its online grading system, as it operates within Docker and needs a language that compiles to machine code with minimal dependencies.
Using Rust for web development
Rust is increasingly being used for web development—especially on the server side. The async programming model and performance characteristics of Rust make it fitting for building high-performance web servers, APIs, and backend services. Plus, there’s been an influx of web frameworks for Rust, like Rocket, that can help folks get started with writing secure web applications. The emergence of these frameworks underscores Rust’s position as a mature language, and also helps increase the support for folks looking to use Rust in front or backend work.
Using Rust for crypto and blockchain development
Rust’s speed, memory management, and security all contribute to its involvement with cryptocurrency and blockchain technologies. For example, Polkadot, which is designed to enable the interoperability and interaction between multiple blockchains to share information and assets in a secure and decentralized manner, utilizes Rust to build its core infrastructure. Polkadot’s runtime logic, which governs the behavior and rules of the blockchain, is also written in Rust. Check out this repository, awesome-blockchain-rust, for some useful components for building your own blockchain applications with Rust.
Using Rust to build CLI tools
Rust’s compilation to efficient machine code and its expressive syntax make it a strong choice for building command line tools and applications. Plus, writing a command line app is a great way to learn and get comfortable with Rust. Take a look at this comprehensive guide on how to build your own CLI application with Rust in 15 minutes!
Using Rust for embedded systems and IoT development
Rust’s minimal runtime and control over memory layout makes it incredibly useful for developing embedded systems and Internet of Things (IoT) devices. Its ability to prevent memory-related bugs, manage concurrency, and generate small, efficient binaries caters to IoT’s security, real-time, and efficiency needs.
Why developers love Rust
While its user base for Rust isn’t nearly as large as Java or Python, Rust continues to compete with the big hitters in most-admired lists across the internet. There’s even a full website composed of developer’s praises for Rust.
But why exactly is Rust so admired by developers? If you boil it down to just a handful of reasons why developers love Rust so much, they’d have to be the language’s speed, safety, and performance.
Moreover, Rust is continuing to evolve and grow with new frameworks, tools, and resources. You can keep tabs on contributions to the language in the awesome-rust repository, which hosts an impressive list of Rust code and resources.
The bottom line: Admiring Rust isn’t just about adopting a language—it’s embracing a mindset that prioritizes innovation without compromising on the core tenets of stability and security.
How to get started with Rust
We know, there’s plenty of resources to sharpen your Rust skills peppered throughout this article—but we have another pro tip for you: take Rust for a test drive with GitHub Copilot. As your AI-powered pair programmer, GitHub Copilot can help you learn and refine the basics of Rust as you go with tailored code suggestions.
Here’s a developer advocate at GitHub experimenting with Rust for the first time with GitHub Copilot. And to all of our seasoned Rustaceans out there, what do you think? Was the suggestion correct?
If you’re ready to begin your coding journey with Rust, GitHub Copilot can jumpstart your progress—all without the need to study documentation for hours at a time.
A clear sign of maturing for any new programming language or environment is how easy and efficient debugging them is. Programming, like any other complex task, involves various challenges and potential pitfalls. Logic errors, off-by-ones, null pointer dereferences, and memory leaks are some examples of things that can make software developers desperate if they can't pinpoint and fix these issues quickly as part of their workflows and tools.
WebAssembly (Wasm) is a binary instruction format designed to be a portable and efficient target for the compilation of high-level languages like Rust, C, C++, and others. In recent years, it has gained significant traction for building high-performance applications in web and serverless environments.
Using tools like Wrangler, our command-line tool for building with Cloudflare developer products, makes streaming real-time logs from our applications running remotely easy. Still, to be honest, debugging Rust and Wasm with Cloudflare Workers involves a lot of the good old time-consuming and nerve-wracking printf'ing strategy.
What if there’s a better way? This blog is about enabling and using Wasm core dumps and how you can easily debug Rust in Cloudflare Workers.
What are core dumps?
In computing, a core dump consists of the recorded state of the working memory of a computer program at a specific time, generally when the program has crashed or otherwise terminated abnormally. They also add things like the processor registers, stack pointer, program counter, and other information that may be relevant to fully understanding why the program crashed.
In most cases, depending on the system’s configuration, core dumps are usually initiated by the operating system in response to a program crash. You can then use a debugger like gdb to examine what happened and hopefully determine the cause of a crash. gdb allows you to run the executable to try to replicate the crash in a more controlled environment, inspecting the variables, and much more. The Windows' equivalent of a core dump is a minidump. Other mature languages that are interpreted, like Python, or languages that run inside a virtual machine, like Java, also have their ways of generating core dumps for post-mortem analysis.
Core dumps are particularly useful for post-mortem debugging, determining the conditions that lead to a failure after it has occurred.
WebAssembly core dumps
WebAssembly has had a proposal for implementing core dumps in discussion for a while. It's a work-in-progress experimental specification, but it provides basic support for the main ideas of post-mortem debugging, including using the DWARF (debugging with attributed record formats) debug format, the same that Linux and gdb use. Some of the most popular Wasm runtimes, like Wasmtime and Wasmer, have experimental flags that you can enable and start playing with Wasm core dumps today.
If you run Wasmtime or Wasmer with the flag:
--coredump-on-trap=/path/to/coredump/file
The core dump file will be emitted at that location path if a crash happens. You can then use tools like wasmgdb to inspect the file and debug the crash.
But let's dig into how the core dumps are generated in WebAssembly, and what’s inside them.
How are Wasm core dumps generated
(and what’s inside them)
When WebAssembly terminates execution due to abnormal behavior, we say that it entered a trap. With Rust, examples of operations that can trap are accessing out-of-bounds addresses or a division by zero arithmetic call. You can read about the security model of WebAssembly to learn more about traps.
The core dump specification plugs into the trap workflow. When WebAssembly crashes and enters a trap, core dumping support kicks in and starts unwinding the call stack gathering debugging information. For each frame in the stack, it collects the function parameters and the values stored in locals and in the stack, along with binary offsets that help us map to exact locations in the source code. Finally, it snapshots the memory and captures information like the tables and the global variables.
DWARF is used by many mature languages like C, C++, Rust, Java, or Go. By emitting DWARF information into the binary at compile time a debugger can provide information such as the source name and the line number where the exception occurred, function and argument names, and more. Without DWARF, the core dumps would be just pure assembly code without any contextual information or metadata related to the source code that generated it before compilation, and they would be much harder to debug.
WebAssembly uses a (lighter) version of DWARF that maps functions, or a module and local variables, to their names in the source code (you can read about the WebAssembly name section for more information), and naturally core dumps use this information.
All this information for debugging is then bundled together and saved to the file, the core dump file.
A thread is a custom section called corestack. A corestack section contains the thread name and a vector (or array) of frames. Each frame contains the function index in the WebAssembly module (funcidx), the code offset relative to the function's start (codeoffset), the list of locals, and the list of values in the stack.
Values are defined as follows:
value ::= 0x01       => ∅
        | 0x7F n:i32 => n
        | 0x7E n:i64 => n
        | 0x7D n:f32 => n
        | 0x7C n:f64 => n
At the time of this writing these are the possible numbers types in a value. Again, we wanted to describe the basics; you should track the full specification to get more detail or find information about future changes. WebAssembly core dump support is in its early stages of specification and implementation, things will get better, things might change.
This is all great news. Unfortunately, however, the Cloudflare Workers runtime doesn’t support WebAssembly core dumps yet. There is no technical impediment to adding this feature to workerd; after all, it's based on V8, but since it powers a critical part of our production infrastructure and products, we tend to be conservative when it comes to adding specifications or standards that are still considered experimental and still going through the definitions phase.
So, how do we get core Wasm dumps in Cloudflare Workers today?
Polyfilling
Polyfilling means using userland code to provide modern functionality in older environments that do not natively support it. Polyfills are widely popular in the JavaScript community and the browser environment; they've been used extensively to address issues where browser vendors still didn't catch up with the latest standards, or when they implement the same features in different ways, or address cases where old browsers can never support a new standard.
Meet wasm-coredump-rewriter, a tool that you can use to rewrite a Wasm module and inject the core dump runtime functionality in the binary. This runtime code will catch most traps (exceptions in host functions are not yet catched and memory violation not by default) and generate a standard core dump file. To some degree, this is similar to how Binaryen's Asyncifyworks.
Let’s look at code and see how this works. He’s some simple pseudo code:
export function entry(v1, v2) {
    return addTwo(v1, v2)
}

function addTwo(v1, v2) {
  res = v1 + v2;
  throw "something went wrong";

  return res
}
An imaginary compiler could take that source and generate the following Wasm binary code:
entry() is the Wasm function exported to the host. In an environment like the browser, JavaScript (being the host) can call entry().
Irrelevant parts of the code have been snipped for brevity, but this is what the Wasm code will look like after wasm-coredump-rewriter rewrites it:
  (func $entry (type 0) (param i32 i32) (result i32)
    ...
    local.get 0
    local.get 1
    call $addTwo ;; see the addTwo function bellow
    global.get 2 ;; is unwinding?
    if  ;; label = @1
      i32.const x ;; code offset
      i32.const 0 ;; function index
      i32.const 2 ;; local_count
      call $coredump/start_frame
      local.get 0
      call $coredump/add_i32_local
      local.get 1
      call $coredump/add_i32_local
      ...
      call $coredump/write_coredump
      unreachable
    end)

  (func $addTwo (type 0) (param i32 i32) (result i32)
    local.get 0
    local.get 1
    i32.add
    ;; the unreachable instruction was here before
    call $coredump/unreachable_shim
    i32.const 1 ;; funcidx
    i32.const 2 ;; local_count
    call $coredump/start_frame
    local.get 0
    call $coredump/add_i32_local
    local.get 1
    call $coredump/add_i32_local
    ...
    return)

  (export "entry" (func $entry))
As you can see, a few things changed:
The (unreachable) instruction in addTwo() was replaced by a call to $coredump/unreachable_shim which starts the unwinding process. Then, the location and debugging data is captured, and the function returns normally to the entry() caller.
Code has been added after the addTwo() call instruction in entry() that detects if we have an unwinding process in progress or not. If we do, then it also captures the local debugging data, writes the core dump file and then, finally, moves to the unconditional trap unreachable.
In short, we unwind until the host function entry() gets destroyed by calling unreachable.
Let’s go over the runtime functions that we inject for more clarity, stay with us:
$coredump/start_frame(funcidx, local_count) starts a new frame in the coredump.
$coredump/add_*_local(value) captures the values of function arguments and in locals (currently capturing values from the stack isn’t implemented.)
$coredump/write_coredump is used at the end and writes the core dump in memory. We take advantage of the first 1 KiB of the Wasm linear memory, which is unused, to store our core dump.
A diagram is worth a thousand words:
Wait, what’s this about the first 1 KiB of the memory being unused, you ask? Well, it turns out that most WebAssembly linters and tools, including Emscripten and WebAssembly’s LLVM don’t use the first 1 KiB of memory. Rust and Zig also use LLVM, but they changed the default. This isn’t pretty, but the hugely popular Asyncify polyfill relies on the same trick, so there’s reasonable support until we find a better way.
But we digress, let’s continue. After the crash, the host, typically JavaScript in the browser, can now catch the exception and extract the core dump from the Wasm instance’s memory:
If you're curious about the actual details of the core dump implementation, you can find the source code here. It was written in AssemblyScript, a TypeScript-like language for WebAssembly.
This is how we use the polyfilling technique to implement Wasm core dumps when the runtime doesn’t support them yet. Interestingly, some Wasm runtimes, being optimizing compilers, are likely to make debugging more difficult because function arguments, locals, or functions themselves can be optimized away. Polyfilling or rewriting the binary could actually preserve more source-level information for debugging.
You might be asking what about performance? We did some testing and found that the impact is negligible; the cost-benefit of being able to debug our crashes is positive. Also, you can easily turn wasm core dumps on or off for specific builds or environments; deciding when you need them is up to you.
Debugging from a core dump
We now know how to generate a core dump, but how do we use it to diagnose and debug a software crash?
Similarly to gdb (GNU Project Debugger) on Linux, wasmgdb is the tool you can use to parse and make sense of core dumps in WebAssembly; it understands the file structure, uses DWARF to provide naming and contextual information, and offers interactive commands to navigate the data. To exemplify how it works, wasmgdb has a demo of a Rust application that deliberately crashes; we will use it.
Let's imagine that our Wasm program crashed, wrote a core dump file, and we want to debug it.
When you fire wasmgdb, you enter a REPL (Read-Eval-Print Loop) interface, and you can start typing commands. The tool tries to mimic the gdb command syntax; you can find the list here.
Let's examine the backtrace using the bt command:
wasmgdb> bt
#18     000137 as __rust_start_panic () at library/panic_abort/src/lib.rs
#17     000129 as rust_panic () at library/std/src/panicking.rs
#16     000128 as rust_panic_with_hook () at library/std/src/panicking.rs
#15     000117 as {closure#0} () at library/std/src/panicking.rs
#14     000116 as __rust_end_short_backtrace<std::panicking::begin_panic_handler::{closure_env#0}, !> () at library/std/src/sys_common/backtrace.rs
#13     000123 as begin_panic_handler () at library/std/src/panicking.rs
#12     000194 as panic_fmt () at library/core/src/panicking.rs
#11     000198 as panic () at library/core/src/panicking.rs
#10     000012 as calculate (value=0x03000000) at src/main.rs
#9      000011 as process_thing (thing=0x2cff0f00) at src/main.rs
#8      000010 as main () at src/main.rs
#7      000008 as call_once<fn(), ()> (???=0x01000000, ???=0x00000000) at /rustc/b833ad56f46a0bbe0e8729512812a161e7dae28a/library/core/src/ops/function.rs
#6      000020 as __rust_begin_short_backtrace<fn(), ()> (f=0x01000000) at /rustc/b833ad56f46a0bbe0e8729512812a161e7dae28a/library/std/src/sys_common/backtrace.rs
#5      000016 as {closure#0}<()> () at /rustc/b833ad56f46a0bbe0e8729512812a161e7dae28a/library/std/src/rt.rs
#4      000077 as lang_start_internal () at library/std/src/rt.rs
#3      000015 as lang_start<()> (main=0x01000000, argc=0x00000000, argv=0x00000000, sigpipe=0x00620000) at /rustc/b833ad56f46a0bbe0e8729512812a161e7dae28a/library/std/src/rt.rs
#2      000013 as __original_main () at <directory not found>/<file not found>
#1      000005 as _start () at <directory not found>/<file not found>
#0      000264 as _start.command_export at <no location>
Each line represents a frame from the program's call stack; see frame #3:
#3 000015 as lang_start<()> (main=0x01000000, argc=0x00000000, argv=0x00000000, sigpipe=0x00620000) at /rustc/b833ad56f46a0bbe0e8729512812a161e7dae28a/library/std/src/rt.rs
You can read the funcidx, function name, arguments names and values and source location are all present. Let's select frame #9 now and inspect the locals, which include the function arguments:
wasmgdb> f 9
000011 as process_thing (thing=0x2cff0f00) at src/main.rs
wasmgdb> info locals
thing: *MyThing = 0xfff1c
Let’s use the p command to inspect the content of the thing argument:
wasmgdb> p (*thing)
thing (0xfff2c): MyThing = {
    value (0xfff2c): usize = 0x00000003
}
You can also use the p command to inspect the value of the variable, which can be useful for nested structures:
wasmgdb> p (*thing)->value
value (0xfff2c): usize = 0x00000003
And you can use p to inspect memory addresses. Let’s point at 0xfff2c, the start of the MyThing structure, and inspect:
wasmgdb> p (MyThing) 0xfff2c
0xfff2c (0xfff2c): MyThing = {
    value (0xfff2c): usize = 0x00000003
}
All this information in every step of the stack is very helpful to determine the cause of a crash. In our test case, if you look at frame #10, we triggered an integer overflow. Once you get comfortable walking through wasmgdb and using its commands to inspect the data, debugging core dumps will be another powerful skill under your belt.
Tidying up everything in Cloudflare Workers
We learned about core dumps and how they work, and we know how to make Cloudflare Workers generate them using the wasm-coredump-rewriter polyfill, but how does all this work in practice end to end?
We've been dogfooding the technique described in this blog at Cloudflare for a while now. Wasm core dumps have been invaluable in helping us debug Rust-based services running on top of Cloudflare Workers like D1, Privacy Edge, AMP, or Constellation.
Today we're open-sourcing the Wasm Coredump Service and enabling anyone to deploy it. This service collects the Wasm core dumps originating from your projects and applications when they crash, parses them, prints an exception with the stack information in the logs, and can optionally store the full core dump in a file in an R2 bucket (which you can then use with wasmgdb) or send the exception to Sentry.
We use a service binding to facilitate the communication between your application Worker and the Coredump service Worker. A Service binding allows you to send HTTP requests to another Worker without those requests going over the Internet, thus avoiding network latency or having to deal with authentication. Here’s a diagram of how it works:
Using it is as simple as npm/yarn installing @cloudflare/wasm-coredump, configuring a few options, and then adding a few lines of code to your other applications running in Cloudflare Workers, in the exception handling logic:
The ../build/worker/shim.mjs import comes from the worker-build tool, from the workers-rs packages and is automatically generated when wrangler builds your Rust-based Cloudflare Workers project. If the Wasm throws an exception, we catch it, extract the core dump from memory, and send it to our Core dump service.
You might have noticed that we race the workers-rsshim.fetch() entry point with another Promise to generate a timeout exception if the Rust code doesn't respond earlier. This is because currently, wasm-bindgen, which generates the glue between the JavaScript and Rust land, used by workers-rs, has an issue where a Promise might not be rejected if Rust panics asynchronously (leading to the Worker runtime killing the worker with “Error: The script will never generate a response”.). This can block the wasm-coredump code and make the core dump generation flaky.
We are working to improve this, but in the meantime, make sure to adjust timeoutSecs to something slightly bigger than the typical response time of your application.
Here’s an example of a Wasm core dump exception in Sentry:
It's worth mentioning one corner case of this debugging technique and the solution: sometimes your codebase is so big that adding core dump and DWARF debugging information might result in a Wasm binary that is too big to fit in a Cloudflare Worker. Well, worry not; we have a solution for that too.
Fortunately the DWARF for WebAssembly specification also supports external DWARF files. To make this work, we have a tool called debuginfo-split that you can add to the build command in the wrangler.toml configuration:
What this does is it strips the debugging information from the Wasm binary, and writes it to a new separate file called debug-{UUID}.wasm. You then need to upload this file to the same R2 bucket used by the Wasm Coredump Service (you can automate this as part of your CI or build scripts). The same UUID is also injected into the main Wasm binary; this allows us to correlate the Wasm binary with its corresponding DWARF debugging information. Problem solved.
Binaries without DWARF information can be significantly smaller. Here’s our example:
4.5 MiB
debug-63372dbe-41e6-447d-9c2e-e37b98e4c656.wasm
313 KiB
build/worker/index.wasm
Final words
We hope you enjoyed reading this blog as much as we did writing it and that it can help you take your Wasm debugging journeys, using Cloudflare Workers or not, to another level.
Note that while the examples used here were around using Rust and WebAssembly because that's a common pattern, you can use the same techniques if you're compiling WebAssembly from other languages like C or C++.
Also, note that the WebAssembly core dump standard is a hot topic, and its implementations and adoption are evolving quickly. We will continue improving the wasm-coredump-rewriter, debuginfo-split, and wasmgdb tools and the wasm-coredump service. More and more runtimes, including V8, will eventually support core dumps natively, thus eliminating the need to use polyfills, and the tooling, in general, will get better; that's a certainty. For now, we present you with a solution that works today, and we have strong incentives to keep supporting it.
As usual, you can talk to us on our Developers Discord or the Community forum or open issues or PRs in our GitHub repositories; the team will be listening.
In this post, we will take you through the advancements we've made in our machine learning capabilities. We'll describe the technical strategies that have enabled us to expand the number of machine learning features and models, all while substantially reducing the processing time for each HTTP request on our network. Let's begin.
Background
For a comprehensive understanding of our evolved approach, it's important to grasp the context within which our machine learning detections operate. Cloudflare, on average, serves over 46 million HTTP requests per second, surging to more than 63 million requests per second during peak times.
Machine learning detection plays a crucial role in ensuring the security and integrity of this vast network. In fact, it classifies the largest volume of requests among all our detection mechanisms, providing the final Bot Score decision for over 72% of all HTTP requests. Going beyond, we run several machine learning models in shadow mode for every HTTP request.
At the heart of our machine learning infrastructure lies our reliable ally, CatBoost. It enables ultra low-latency model inference and ensures high-quality predictions to detect novel threats such as stopping bots targeting our customers' mobile apps. However, it's worth noting that machine learning model inference is just one component of the overall latency equation. Other critical components include machine learning feature extraction and preparation. In our quest for optimal performance, we've continuously optimized each aspect contributing to the overall latency of our system.
Initially, our machine learning models relied on single-request features, such as presence or value of certain headers. However, given the ease of spoofing these attributes, we evolved our approach. We turned to inter-request features that leverage aggregated information across multiple dimensions of a request in a sliding time window. For example, we now consider factors like the number of unique user agents associated with certain request attributes.
The extraction and preparation of inter-request features were handled by Gagarin, a Go-based feature serving platform we developed. As a request arrived at Cloudflare, we extracted dimension keys from the request attributes. We then looked up the corresponding machine learning features in the multi-layered cache. If the desired machine learning features were not found in the cache, a memcached "get" request was made to Gagarin to fetch those. Then machine learning features were plugged into CatBoost models to produce detections, which were then surfaced to the customers via Firewall and Workers fields and internally through our logging pipeline to ClickHouse. This allowed our data scientists to run further experiments, producing more features and models.
Previous system design for serving machine learning features over Unix socket using Gagarin.
Initially, Gagarin exhibited decent latency, with a median latency around 200 microseconds to serve all machine learning features for given keys. However, as our system evolved and we introduced more features and dimension keys, coupled with increased traffic, the cache hit ratio began to wane. The median latency had increased to 500 microseconds and during peak times, the latency worsened significantly, with the p99 latency soaring to roughly 10 milliseconds. Gagarin underwent extensive low-level tuning, optimization, profiling, and benchmarking. Despite these efforts, we encountered the limits of inter-process communication (IPC) using Unix Domain Socket (UDS), among other challenges, explored below.
Problem definition
In summary, the previous solution had its drawbacks, including:
High tail latency: during the peak time, a portion of requests experienced increased latency caused by CPU contention on the Unix socket and Lua garbage collector.
Suboptimal resource utilization: CPU and RAM utilization was not optimized to the full potential, leaving less resources for other services running on the server.
Machine learning features availability: decreased due to memcached timeouts, which resulted in a higher likelihood of false positives or false negatives for a subset of the requests.
Scalability constraints: as we added more machine learning features, we approached the scalability limit of our infrastructure.
Equipped with a comprehensive understanding of the challenges and armed with quantifiable metrics, we ventured into the next phase: seeking a more efficient way to fetch and serve machine learning features.
Exploring solutions
In our quest for more efficient methods of fetching and serving machine learning features, we evaluated several alternatives. The key approaches included:
Further optimizing Gagarin: as we pushed our Go-based memcached server to its limits, we encountered a lower bound on latency reductions. This arose from IPC over UDS synchronization overhead and multiple data copies, the serialization/deserialization overheads, as well as the inherent latency of garbage collector and the performance of hashmap lookups in Go.
Considering Quicksilver: we contemplated using Quicksilver, but the volume and update frequency of machine learning features posed capacity concerns and potential negative impacts on other use cases. Moreover, it uses a Unix socket with the memcached protocol, reproducing the same limitations previously encountered.
Increasing multi-layered cache size: we investigated expanding cache size to accommodate tens of millions of dimension keys. However, the associated memory consumption, due to duplication of these keys and their machine learning features across worker threads, rendered this approach untenable.
Sharding the Unix socket: we considered sharding the Unix socket to alleviate contention and improve performance. Despite showing potential, this approach only partially solved the problem and introduced more system complexity.
Switching to RPC: we explored the option of using RPC for communication between our front line server and Gagarin. However, since RPC still requires some form of communication bus (such as TCP, UDP, or UDS), it would not significantly change the performance compared to the memcached protocol over UDS, which was already simple and minimalistic.
After considering these approaches, we shifted our focus towards investigating alternative Inter-Process Communication (IPC) mechanisms.
IPC mechanisms
Adopting a first principles design approach, we questioned: "What is the most efficient low-level method for data transfer between two processes provided by the operating system?" Our goal was to find a solution that would enable the direct serving of machine learning features from memory for corresponding HTTP requests. By eliminating the need to traverse the Unix socket, we aimed to reduce CPU contention, improve latency, and minimize data copying.
To identify the most efficient IPC mechanism, we evaluated various options available within the Linux ecosystem. We used ipc-bench, an open-source benchmarking tool specifically designed for this purpose, to measure the latencies of different IPC methods in our test environment. The measurements were based on sending one million 1,024-byte messages forth and back (i.e., ping pong) between two processes.
IPC method
Avg duration, μs
Avg throughput, msg/s
eventfd (bi-directional)
9.456
105,533
TCP sockets
8.74
114,143
Unix domain sockets
5.609
177,573
FIFOs (named pipes)
5.432
183,388
Pipe
4.733
210,369
Message Queue
4.396
226,421
Unix Signals
2.45
404,844
Shared Memory
0.598
1,616,014
Memory-Mapped Files
0.503
1,908,613
Based on our evaluation, we found that Unix sockets, while taking care of synchronization, were not the fastest IPC method available. The two fastest IPC mechanisms were shared memory and memory-mapped files. Both approaches offered similar performance, with the former using a specific tmpfs volume in /dev/shm and dedicated system calls, while the latter could be stored in any volume, including tmpfs or HDD/SDD.
Missing ingredients
In light of these findings, we decided to employ memory-mapped files as the IPC mechanism for serving machine learning features. This choice promised reduced latency, decreased CPU contention, and minimal data copying. However, it did not inherently offer data synchronization capabilities like Unix sockets. Unlike Unix sockets, memory-mapped files are simply files in a Linux volume that can be mapped into memory of the process. This sparked several critical questions:
How could we efficiently fetch an array of hundreds of float features for given dimension keys when dealing with a file?
How could we ensure safe, concurrent and frequent updates for tens of millions of keys?
How could we avert the CPU contention previously encountered with Unix sockets?
How could we effectively support the addition of more dimensions and features in the future?
To address these challenges we needed to further evolve this new approach by adding a few key ingredients to the recipe.
Augmenting the Idea
To realize our vision of memory-mapped files as a method for serving machine learning features, we needed to employ several key strategies, touching upon aspects like data synchronization, data structure, and deserialization.
Wait-free synchronization
When dealing with concurrent data, ensuring safe, concurrent, and frequent updates is paramount. Traditional locks are often not the most efficient solution, especially when dealing with high concurrency environments. Here's a rundown on three different synchronization techniques:
With-lock synchronization: a common approach using mechanisms like mutexes or spinlocks. It ensures only one thread can access the resource at a given time, but can suffer from contention, blocking, and priority inversion, just as evident with Unix sockets.
Lock-free synchronization: this non-blocking approach employs atomic operations to ensure at least one thread always progresses. It eliminates traditional locks but requires careful handling of edge cases and race conditions.
Wait-free synchronization: a more advanced technique that guarantees every thread makes progress and completes its operation without being blocked by other threads. It provides stronger progress guarantees compared to lock-free synchronization, ensuring that each thread completes its operation within a finite number of steps.
We store the synchronization state, which coordinates access to these data copies, in a third memory-mapped file, referred to as "state". This file contains an atomic 64-bit integer, which represents an InstanceVersionand a pair of additional atomic 32-bit variables, tracking the number of active readers for each data copy. The InstanceVersion consists of the currently active data file index (1 bit), the data size (39 bits, accommodating data sizes up to 549 GB), and a data checksum (24 bits).
Zero-copy deserialization
To efficiently store and fetch machine learning features, we needed to address the challenge of deserialization latency. Here, zero-copy deserialization provides an answer. This technique reduces the time and memory required to access and use data by directly referencing bytes in the serialized form.
We turned to rkyv, a zero-copy deserialization framework in Rust, to help us with this task. rkyv implements total zero-copy deserialization, meaning no data is copied during deserialization and no work is done to deserialize data. It achieves this by structuring its encoded representation to match the in-memory representation of the source type.
One of the key features of rkyv that our solution relies on is its ability to access HashMap data structures in a zero-copy fashion. This is a unique capability among Rust serialization libraries and one of the main reasons we chose rkyv for our implementation. It also has a vibrant Discord community, eager to offer best-practice advice and accommodate feature requests.
Leveraging the benefits of memory-mapped files, wait-free synchronization and zero-copy deserialization, we've crafted a unique and powerful tool for managing high-performance, concurrent data access between processes. We've packaged these concepts into a Rust crate named mmap-sync, which we're thrilled to open-source for the wider community.
At the core of the mmap-sync package is a structure named Synchronizer. It offers an avenue to read and write any data expressible as a Rust struct. Users simply have to implement or derive a specific Rust trait surrounding struct definition – a task requiring just a single line of code. The Synchronizer presents an elegantly simple interface, equipped with "write" and "read" methods.
impl Synchronizer {
    /// Write a given `entity` into the next available memory mapped file.
    pub fn write<T>(&mut self, entity: &T, grace_duration: Duration) -> Result<(usize, bool), SynchronizerError> {
        …
    }

    /// Reads and returns `entity` struct from mapped memory wrapped in `ReadResult`
    pub fn read<T>(&mut self) -> Result<ReadResult<T>, SynchronizerError> {
        …
    }
}

/// FeaturesMetadata stores features along with their metadata
#[derive(Archive, Deserialize, Serialize, Debug, PartialEq)]
#[archive_attr(derive(CheckBytes))]
pub struct FeaturesMetadata {
    /// Features version
    pub version: u32,
    /// Features creation Unix timestamp
    pub created_at: u32,
    /// Features represented by vector of hash maps
    pub features: Vec<HashMap<u64, Vec<f32>>>,
}
A read operation through the Synchronizer performs zero-copy deserialization and returns a "guarded" Result encapsulating a reference to the Rust struct using RAII design pattern. This operation also increments the atomic counter of active readers using the struct. Once the Result is out of scope, the Synchronizer decrements the number of readers.
The synchronization mechanism used in mmap-sync is not only "lock-free" but also "wait-free". This ensures an upper bound on the number of steps an operation will take before it completes, thus providing a performance guarantee.
The data is stored in shared mapped memory, which allows the Synchronizer to “write” to it and “read” from it concurrently. This design makes mmap-sync a highly efficient and flexible tool for managing shared, concurrent data access.
Now, with an understanding of the underlying mechanics of mmap-sync, let's explore how this package plays a key role in the broader context of our Bot Management platform, particularly within the newly developed components: the bliss service and library.
System design overhaul
Transitioning from a Lua-based module that made memcached requests over Unix socket to Gagarin in Go to fetch machine learning features, our new design represents a significant evolution. This change pivots around the introduction of mmap-sync, our newly developed Rust package, laying the groundwork for a substantial performance upgrade. This development led to a comprehensive system redesign and introduced two new components that form the backbone of our Bots Liquidation Intelligent Security System – or BLISS, in short: the bliss service and the bliss library.
Bliss service
The blissservice operates as a Rust-based, multi-threaded sidecar daemon. It has been designed for optimal batch processing of vast data quantities and extensive I/O operations. Among its key functions, it fetches, parses, and stores machine learning features and dimensions for effortless data access and manipulation. This has been made possible through the incorporation of the Tokio event-driven platform, which allows for efficient, non-blocking I/O operations.
Bliss library
Operating as a single-threaded dynamic library, the bliss library seamlessly integrates into each worker thread using the Foreign Function Interface (FFI) via a Lua module. Optimized for minimal resource usage and ultra-low latency, this lightweight library performs tasks without the need for heavy I/O operations. It efficiently serves machine learning features and generates corresponding detections.
In addition to leveraging the mmap-sync package for efficient machine learning feature access, our new design includes several other performance enhancements:
Allocations-free operation: bliss library re-uses pre-allocated data structures and performs no heap allocations, only low-cost stack allocations. To enforce our zero-allocation policy, we run integration tests using the dhat heap profiler.
SIMD optimizations: wherever possible, the bliss library employs vectorized CPU instructions. For instance, AVX2 and SSE4 instruction sets are used to expedite hex-decoding of certain request attributes, enhancing speed by tenfold.
Compiler tuning: We compile both the bliss service and library with the following flags for superior performance:
Benchmarking & profiling: We use Criterion for benchmarking every major feature or component within bliss. Moreover, we are also able to use the Go pprof profiler on Criterion benchmarks to view flame graphs and more:
This comprehensive overhaul of our system has not only streamlined our operations but also has been instrumental in enhancing the overall performance of our Bot Management platform. Stay tuned to witness the remarkable changes brought about by this new architecture in the next section.
Rollout results
Our system redesign has brought some truly "blissful" dividends. Above all, our commitment to a seamless user experience and the trust of our customers have guided our innovations. We ensured that the transition to the new design was seamless, maintaining full backward compatibility, with no customer-reported false positives or negatives encountered. This is a testament to the robustness of the new system.
As the old adage goes, the proof of the pudding is in the eating. This couldn't be truer when examining the dramatic latency improvements achieved by the redesign. Our overall processing latency for HTTP requests at Cloudflare improved by an average of 12.5% compared to the previous system.
This improvement is even more significant in the Bot Management module, where latency improved by an average of 55.93%.
Bot Management module latency, in microseconds.
More specifically, our machine learning features fetch latency has improved by several orders of magnitude:
Latency metric
Before (μs)
After (μs)
Change
p50
532
9
-98.30% or x59
p99
9510
18
-99.81% or x528
p999
16000
29
-99.82% or x551
To truly grasp this impact, consider this: with Cloudflare’s average rate of 46 million requests per second, a saving of 523 microseconds per request equates to saving over 24,000 days or 65 years of processing time every single day!
In addition to latency improvements, we also reaped other benefits from the rollout:
Enhanced feature availability: thanks to eliminating Unix socket timeouts, machine learning feature availability is now a robust 100%, resulting in fewer false positives and negatives in detections.
Improved resource utilization: our system overhaul liberated resources equivalent to thousands of CPU cores and hundreds of gigabytes of RAM – a substantial enhancement of our server fleet's efficiency.
Code cleanup: another positive spin-off has been in our Lua and Go code. Thousands of lines of less performant and less memory-safe code have been weeded out, reducing technical debt.
Upscaled machine learning capabilities: last but certainly not least, we've significantly expanded our machine learning features, dimensions, and models. This upgrade empowers our machine learning inference to handle hundreds of machine learning features and dozens of dimensions and models.
Conclusion
In the wake of our redesign, we've constructed a powerful and efficient system that truly embodies the essence of 'bliss'. Harnessing the advantages of memory-mapped files, wait-free synchronization, allocation-free operations, and zero-copy deserialization, we've established a robust infrastructure that maintains peak performance while achieving remarkable reductions in latency. As we navigate towards the future, we're committed to leveraging this platform to further improve our Security machine learning products and cultivate innovative features. Additionally, we're excited to share parts of this technology through an open-sourced Rust package mmap-sync.
As we leap into the future, we are building upon our platform's impressive capabilities, exploring new avenues to amplify the power of machine learning. We are deploying a new machine learning model built on BLISS with select customers. If you are a Bot Management subscriber and want to test the new model, please reach out to your account team.
Separately, we are on the lookout for more Cloudflare customers who want to run their own machine learning models at the edge today. If you’re a developer considering making the switch to Workers for your application, sign up for our Constellation AI closed beta. If you’re a Bot Management customer and looking to run an already trained, lightweight model at the edge, we would love to hear from you. Let's embark on this path to bliss together.
Cloudflare executes an array of security checks on servers spread across our global network. These checks are designed to block attacks and prevent malicious or unwanted traffic from reaching our customers’ servers. But every check carries a cost – some amount of computation, and therefore some amount of time must be spent evaluating every request we process. As we deploy new protections, the amount of time spent executing security checks increases.
Latency is a key metric on which CDNs are evaluated. Just as we optimize network latency by provisioning servers in close proximity to end users, we also optimize processing latency – which is the time spent processing a request before serving a response from cache or passing the request forward to the customers’ servers. Due to the scale of our network and the diversity of use-cases we serve, our edge software is subject to demanding specifications, both in terms of throughput and latency.
Cloudflare's bot management module is one suite of security checks which executes during the hot path of request processing. This module calculates a variety of bot signals and integrates directly with our front line servers, allowing us to customize behavior based on those signals. This module evaluates every request for heuristics and behaviors indicative of bot traffic, and scores every request with several machine learning models.
To reduce processing latency, we've undertaken a project to rewrite our bot management technology, porting it from Lua to Rust, and applying a number of performance optimizations. This post focuses on optimizations applied to the machine-learning detections within the bot management module, which account for approximately 15% of the latency added by bot detection. By switching away from a garbage collected language, removing memory allocations, and optimizing our parsers, we reduce the P50 latency of the bot management module by 79μs – a 20% reduction.
Engineering for zero allocations
Writing software without memory allocation poses several challenges. Indeed, high-level programming languages often trade memory management for productivity, abstracting away the details of memory management. But, in those details, are a number of algorithms to find contiguous regions of free memory, handle fragmentation, and call into the kernel to request new memory pages. Garbage collected languages incur additional costs throughout program execution to track when memory can be freed, plus pauses in program execution while the garbage collector executes. But, when performance is a critical requirement, languages should be evaluated for their ability to meet performance constraints.
Stack allocation
One of the simplest ways to reduce memory allocations is to work with fixed-size buffers. Fixed-sized buffers can be placed on the stack, which eliminates the need to invoke heap allocation logic; the compiler simply reserves space in the current stack frame to hold local variables. Alternatively, the buffers can be heap-allocated outside the hot path (for example, at application startup), incurring a one-time cost.
Arrays can be stack allocated:
let mut buf = [0u8; BUFFER_SIZE];
Vectors can be created outside the hot path:
let mut buf = Vec::with_capacity(BUFFER_SIZE);
To demonstrate the performance difference, let's compare two implementations of a case-insensitive string equality check. The first will allocate a buffer for each invocation to store the lower-case version of the string. The second will use a buffer that has already been allocated for this purpose.
Allocate a new buffer for each iteration:
fn case_insensitive_equality_buffer_with_capacity(s: &str, pat: &str) -> bool {
	let mut buf = String::with_capacity(s.len());
	buf.extend(s.chars().map(|c| c.to_ascii_lowercase()));
	buf == pat
}
Re-use a buffer for each iteration, avoiding allocations:
Benchmarking the two code snippets, the first executes in ~40ns per iteration, the second in ~25ns. Changing only the memory allocation behavior, the second implementation is ~38% faster.
Choice of algorithms
Another strategy to reduce the number of memory allocations is to choose algorithms that operate on the data in-place and store any necessary state on the stack.
Returning to our string comparison function from above, let's rewrite it operate completely on the stack, and without copying data into a separate buffer:
In addition to being the shortest, this function is also the fastest. This function benchmarks at ~13ns/iter, which is just slightly slower than the 11ns used to execute eq_ignore_ascii_case from the standard library. And the standard library implementation similarly avoids buffer allocation through use of iterators.
Testing allocations
Automated testing of memory allocation on the critical path prevents accidental use of functions or libraries which allocate memory. dhat is a crate in the Rust ecosystem that supports such testing. By setting a new global allocator, dhat is able to count the number of allocations, as well as the number of bytes allocated on a given code path.
/// Assert that the hot path logic performs zero allocations.
#[test]
fn zero_allocations() {
	let _profiler = dhat::Profiler::builder().testing().build();

	// Execute hot-path logic here.

	// Assert that no allocations occurred.
	dhat::assert_eq!(stats.total_blocks, 0);
	dhat::assert_eq!(stats.total_bytes, 0);
}
It is important to note, dhat does have the limitation that it only detects allocations in Rust code. External libraries can still allocate memory without using the Rust allocator. FFI calls, such as those made to C, are one such place where memory allocations may slip past dhat's measurements.
Zero allocation decision trees
CatBoost is an open-source machine learning library used within the bot management module. The core logic of CatBoost is implemented in C++, and the library exposes bindings to a number of other languages – such as C and Rust. The Lua-based implementation of the bot management module relied on FFI calls to the C API to execute our models.
By removing memory allocations and implementing buffer re-use, we optimize the execution duration of the sample model included in the CatBoost repository by 10%. Our production models see gains up to 15%.
Optimize for single-document evaluation
By optimizing CatBoost to evaluate a single set of features at a time, we reduce memory allocations and reduce latency. The CatBoost API has several functions which are optimized for evaluating multiple documents at a time, but this API does not benefit our application where requests are evaluated in the order they are received, and delaying processing to coalesce batches is undesirable. To support evaluation of a variable number of documents, the CatBoost implementation allocates vectors and iterates over the input documents, writing them into the vectors.
TVector<TConstArrayRef<float>> floatFeaturesVec(docCount);
TVector<TConstArrayRef<int>> catFeaturesVec(docCount);
for (size_t i = 0; i < docCount; ++i) {
    if (floatFeaturesSize > 0) {
        floatFeaturesVec[i] = TConstArrayRef<float>(floatFeatures[i], floatFeaturesSize);
    }
    if (catFeaturesSize > 0) {
        catFeaturesVec[i] = TConstArrayRef<int>(catFeatures[i], catFeaturesSize);
    }
}
FULL_MODEL_PTR(modelHandle)->Calc(floatFeaturesVec, catFeaturesVec, TArrayRef<double>(result, resultSize));
To evaluate a single document, however, CatBoost only needs access to a reference to contiguous memory holding feature values. The above code can be replaced with the following:
Similar to the C++ implementation, the CatBoost Rust bindings also allocate vectors to support multi-document evaluation. For example, the bindings iterate over a vector of vectors, mapping it to a newly allocated vector of pointers:
let mut float_features_ptr = float_features
   .iter()
   .map(|x| x.as_ptr())
   .collect::<Vec<_>>();
But in the single-document case, we don't need the outer vector at all. We can simply pass the inner pointer value directly:
let float_features_ptr = float_features.as_ptr();
Reusing buffers
The previous API in the Rust bindings accepted owned Vecs as input. By taking ownership of a heap-allocated data structure, the function also takes responsibility for freeing the memory at the conclusion of its execution. This is undesirable as it forecloses the possibility of buffer reuse. Additionally, categorical features are passed as owned Strings, which prevents us from passing references to bytes in the original request. Instead, we must allocate a temporary String on the heap and copy bytes into it.
But, we also execute several models per request, and those models may use the same categorical features. Instead of calculating the hash for each separate model we execute, let's compute the hashes first and then pass them to each model that requires them:
By optimizing away unnecessary memory allocations in the bot management module, we reduced P50 latency from 388us to 309us (20%), and reduced P99 latency from 940us to 813us (14%). And, in many cases, the optimized code is shorter and easier to read than the unoptimized implementation.
These optimizations were targeted at model execution in the bot management module. To learn more about how we are porting bot management from Lua to Rust, check out this blog post.
A while ago we shared how we replaced NGINX with our in-house proxy, Pingora. We promised to share more technical details as well as our open sourcing plan. This blog post will be the first of a series that shares both the code libraries that power Pingora and the ideas behind them.
Today, we take a look at one of Pingora’s libraries: pingora-limits.
pingora-limits provides the functionality to count inflight events and estimate the rate of events over time. These functions are commonly used to protect infrastructure and services from being overwhelmed by certain types of malicious or misbehaving requests.
For example, when an origin server becomes slow or unresponsive, requests will accumulate on our servers, which adds pressure on both our servers and our customers’ servers. With this library, we are able to identify which origins have issues, so that action can be taken without affecting other traffic.
The problem can be abstracted in a very simple way. The input is a (never ending) stream of different types of events. At any point, the system should be able to tell the number of appearances (or the rate) of a certain type of event.
In a simple example, colors are used as the type of event. The following is one possible example of a sequence of events:
In this example, the system should report that “red” appears three times.
The corresponding algorithms are straightforward to design. One obvious answer is to use a hash table, where the keys are the colors and the values are their corresponding appearances. Whenever a new event appears, the algorithm looks up the hash table and increases the appearance counter. It is not hard to tell that this algorithm’s time complexity is O(1) (per event) and the space complexity O(n) where n is the number of the types of events.
How Pingora does it
The hash table solution is fine in common scenarios, but we believe there are a few things that can be improved.
We observe traffic to millions of different servers when the misbehaving ones are only a few at a given time. It seems a bit wasteful to require space (memory) that holds the counter for all the keys.
Concurrently updating the hash table (especially when adding new keys) requires a lock. This behavior potentially forces all concurrent event processing to go through our system serialized. In other words, when lock contention is severe, the lock slows down the system.
The motivation to improve the above algorithm is even stronger considering such algorithms need to be deployed at scale. This algorithm operates on tens of thousands of machines. It handles more than twenty million requests per second. The benefits of efficiency improvement can be significant.
pingora-limits adopts a different approach: count–min sketch (CM sketch) estimation. CM sketch estimates the counts of events in O(1) (per event) but only using O(log(n)) of space (polylogarithmic, to be precise, more details here). Because of the simplicity of this algorithm, which we will discuss in a bit, it can be implemented without locks. Therefore, pingora-limits runs much faster and more efficiently compared to the hash table approach discussed earlier.
CM sketch
The idea of a CM sketch is similar to a Bloom filter. The mathematical details of the CM sketch can be found in this paper. In this section, we will just illustrate how it works.
A CM sketch data structure takes two parameters, H: number of hashes (rows) and N number of counters (columns) per hash (row). The rows and columns form a matrix. The space they take is H*N. Each row has its own independent hash function (hash_i()).
For this example, we use H=3 and N=4:
0
0
0
0
0
0
0
0
0
0
0
0
When an event, "red", arrives, it is counted by every row independently. Each row will use its own hashing function ( hash_i(“red”) ) to choose a column. The counter of the column is increased without worrying about collisions (see the end of this section).
The table below illustrates a possible state of the matrix after a single “red” event:
0
1
0
0
0
0
1
0
1
0
0
0
Then, let’s assume the event "blue" arrives, and we assume it collides with "red" at row 2: both hash to the third slot:
1
1
0
0
0
0
2
0
1
0
0
1
Let’s say after another series of events, “blue, red, red, red, blue, red”, So far the algorithm observed 5 “red”s and 3 “blue”s in total. Following the algorithm, the estimator eventually becomes:
3
5
0
0
0
0
8
0
5
0
0
3
Now, let’s see how the matrix reports the occurrence of each event. In order to retrieve the count of keys, the estimator just returns the minimal value of all the columns to which that key belongs. So the count of red is min(5, 8, 5) = 5 and blue is min(3, 8, 3) = 3.
This algorithm chooses the cells with the least collisions (via the min() operations). Therefore, collisions between events in single cells are acceptable because as long as there are collision free cells for a given type of event, the counting for that event is accurate.
The estimator can overestimate when two (or more) keys collide on all slots. Assuming there are only two keys, the probability of their total collision is 1/ N^H (1/64 in this example). On the other hand, it never underestimates because it never loses count of any events.
Practical implementation
Because the algorithm only requires hashing, array index and counter increment, it can be implemented in a few lines of code and lock-free.
The following is a code snippet of how it is implemented in Rust.
pub struct Estimator {
    estimator: Box<[(Box<[AtomicIsize]>, RandomState)]>,
}

impl Estimator {
    /// Increment `key` by the value given. Return the new estimated value as a result.
    pub fn incr<T: Hash>(&self, key: T, value: isize) -> isize {
        let mut min = isize::MAX;
        for (slot, hasher) in self.estimator.iter() {
            let hash = hash(&key, hasher) as usize;
            let counter = &slot[hash % slot.len()];
            let current = counter.fetch_add(value, Ordering::Relaxed);
            min = std::cmp::min(min, current + value);
        }
        min
    }
}
Performance
We compare the design above with the two hash table based approaches.
naive: Mutex<HashMap<u32, usize>>. This approach references the simple hash table approach mentioned above. This design requires a lock on every operation.
optimized: DashMap<u32, AtomicUsize>. DashMap leverages multiple hash tables in order to shard the keys to reduce contentions across different keys. We also use atomic counters here so that counting existing keys won't need a write lock.
We have two test cases, one that is single threaded and another that is multi-threaded. In both cases, we have one million keys. We generate 100 million events from the keys. The keys are uniformly distributed among the events.
The results below are performed on Debian VM running on M1 MacBook Pro.
Speed Per event (the incr() function above) timing, lower is better:
pingora-limits
naive
optimized
Single thread
10ns
51ns
43ns
Eight threads
212ns
1505ns
212ns
In the single thread case, where there is no lock contention, our approach is 5x faster than the naive one and 4x faster than the optimized one. With multiple threads, there is a high amount of contention. Our approach is similar to the optimized version. Both are 7x faster than the naive one. The reason the performance of pingora-limits and the optimized hash table are similar is because in both approaches the hot path is just updating the atomic counter.
Memory consumption Lower is better. The numbers are collected only from the single threaded test cases for simplicity.
peak memory bytes
total allocations
total allocated bytes
pingora-limits
26,184
9
26,184
naive
53,477,392
20
71,303,260
optimized
36,211,208
491
71,307,722
Pingora-limits at peak requires 1/2000 of the memory compared to the naive one and 1/1300 of the memory of the optimized one.
From the data above, pingora-limits is both CPU and memory efficient.
The estimator provided by Pingora-limits is a biased estimator because it is possible for it to overestimate the appearance of events.
In the case of accurate counting, where false positives are absolutely unacceptable, pingora-limits can still be very useful. It can work as a first stage filter where only the events beyond a certain threshold are fed to a hash table to perform accurate counting. In this case, the majority of low frequency event types are filtered out by the filter so that the hash table also consumes little memory without losing any accuracy.
How it is used in production
In production, pingora uses this library in a few places. The most common one is the connection limit feature. When our servers try to establish too many connections to a single origin server, in order to protect the server and our infrastructure from becoming overloaded, this feature will start rejecting new requests with 503 errors.
In this feature every incoming request increases a counter, shared by all other requests with the same customer ID, server IP and the server hostname. When the request finishes, the counter decreases accordingly. If the value of the counter is beyond a certain threshold, the request is rejected with a 503 error response. In our production environment we choose the parameters of the library so that a theoretical collision chance between two unrelated customers is about 1 / 2 ^ 52. Additionally, the rejection threshold is significantly higher than what a healthy customer’s traffic would reach. Therefore, even if multiple customers’ counters collide, it is not likely that the overestimated value would reach the threshold. So a false positive on the connection limit is not likely to happen.
Conclusion
Pingora-limits crate is available now on GitHub. Both the core functionality and the performance benchmark performed above can be found there.
In this blog post, we introduced pingora-limits, a library that counts events efficiently. We explained the core idea, which is based on a probabilistic data structure. We also showed through a performance benchmark that the pingora-limits implementation is fast and very efficient for memory consumption.
Not only that, but we will continue introducing and open sourcing Pingora components and libraries because we believe that sharing the idea behind the code is equally important as sharing the code itself.
Interested in joining us to help build a better Internet? Our engineering teams are hiring.
At Cloudflare, we are building proxy applications on top of Oxy that must be able to handle a huge amount of traffic. Besides high performance requirements, the applications must also be resilient against crashes or reloads. As the framework evolves, the complexity also increases. While migrating WARP to support soft-unicast (Cloudflare servers don’t own IPs anymore), we needed to add different functionalities to our proxy framework. Those additions increased not only the code size but also resource usage and states required to be preserved between process upgrades.
To address those issues, we opted to split a big proxy process into smaller, specialized services. Following the Unix philosophy, each service should have a single responsibility, and it must do it well. In this blog post, we will talk about how our proxy interacts with three different services – Splicer (which pipes data between sockets), Bumblebee (which upgrades an IP flow to a TCP socket), and Fish (which handles layer 3 egress using soft-unicast IPs). Those three services help us to improve system reliability and efficiency as we migrated WARP to support soft-unicast.
Splicer
Most transmission tunnels in our proxy forward packets without making any modifications. In other words, given two sockets, the proxy just relays the data between them: read from one socket and write to the other. This is a common pattern within Cloudflare, and we reimplement very similar functionality in separate projects. These projects often have their own tweaks for buffering, flushing, and terminating connections, but they also have to coordinate long-running proxy tasks with their process restart or upgrade handling, too.
Turning this into a service allows other applications to send a long-running proxying task to Splicer. The applications pass the two sockets to Splicer and they will not need to worry about keeping the connection alive when restart. After finishing the task, Splicer will return the two original sockets and the original metadata attached to the request, so the original application can inspect the final state of the sockets – for example using TCP_INFO – and finalize audit logging if required.
Bumblebee
Many of Cloudflare’s on-ramps are IP-based (layer 3) but most of our services operate on TCP or UDP sockets (layer 4). To handle TCP termination, we want to create a kernel TCP socket from IP packets received from the client (and we can later forward this socket and an upstream socket to Splicer to proxy data between the eyeball and origin). Bumblebee performs the upgrades by spawning a thread in an anonymous network namespace with unshare syscall, NAT-ing the IP packets, and using a tun device there to perform TCP three-way handshakes to a listener. You can find a more detailed write-up on how we upgrade an IP flows to a TCP stream here.
In short, other services just need to pass a socket carrying the IP flow, and Bumblebee will upgrade it to a TCP socket, no user-space TCP stack involved! After the socket is created, Bumblebee will return the socket to the application requesting the upgrade. Again, the proxy can restart without breaking the connection as Bumblebee pipes the IP socket while Splicer handles the TCP ones.
Fish
Fish forwards IP packets using soft-unicast IP space without upgrading them to layer 4 sockets. We previously implemented packet forwarding on shared IP space using iptables and conntrack. However, IP/port mapping management is not simple when you have many possible IPs to egress from and variable port assignments. Conntrack is highly configurable, but applying configuration through iptables rules requires careful coordination and debugging iptables execution can be challenging. Plus, relying on configuration when sending a packet through the network stack results in arcane failure modes when conntrack is unable to rewrite a packet to the exact IP or port range specified.
Fish attempts to overcome this problem by rewriting the packets and configuring conntrack using the netlink protocol. Put differently, a proxy application sends a socket containing IP packets from the client, together with the desired soft-unicast IP and port range, to Fish. Then, Fish will ensure to forward those packets to their destination. The client’s choice of IP address does not matter; Fish ensures that egressed IP packets have a unique five-tuple within the root network namespace and performs the necessary packet rewriting to maintain this isolation. Fish’s internal state is also survived across restarts.
The Unix philosophy, manifest
To sum up what we are having so far: instead of adding the functionalities directly to the proxy application, we create smaller and reusable services. It becomes possible to understand the failure cases present in a smaller system and design it to exhibit reliable behavior. Then if we can remove the subsystems of a larger system, we can apply this logic to those subsystems. By focusing on making the smaller service work correctly, we improve the whole system’s reliability and development agility.
Although those three services’ business logics are different, you can notice what they do in common: receive sockets, or file descriptors, from other applications to allow them to restart. Those services can be restarted without dropping the connection too. Let’s take a look at how graceful restart and file descriptor passing work in our cases.
File descriptor passing
We use Unix Domain Sockets for interprocess communication. This is a common pattern for inter-process communication. Besides sending raw data, unix sockets also allow passing file descriptors between different processes. This is essential for our architecture as well as graceful restarts.
There are two main ways to transfer a file descriptor: using pid_getfd syscall or SCM_RIGHTS. The latter is the better choice for us here as the use cases gear toward the proxy application “giving” the sockets instead of the microservices “taking” them. Moreover, the first method would require special permission and a way for the proxy to signal which file descriptor to take.
Currently we have our own internal library named hot-potato to pass the file descriptors around as we use stable Rust in production. If you are fine with using nightly Rust, you may want to consider the unix_socket_ancillary_data feature. The linked blog post above about SCM_RIGHTS also explains how that can be implemented. Still, we also want to add some “interesting” details you may want to know before using your SCM_RIGHTS in production:
There is a maximum number of file descriptors you can pass per message The limit is defined by the constant SCM_MAX_FD in the kernel. This is set to 253 since kernel version 2.6.38
Getting the peer credentials of a socket may be quite useful for observability in multi-tenant settings
A SCM_RIGHTS ancillary data forms a message boundary.
It is possible to send any file descriptors, not only sockets We use this trick together with memfd_create to get around the maximum buffer size without implementing something like length-encoded frames. This also makes zero-copy message passing possible.
Graceful restart
We explored the general strategy for graceful restart in “Oxy: the journey of graceful restarts” blog. Let’s dive into how we leverage tokio and file descriptor passing to migrate all important states in the old process to the new one. We can terminate the old process almost instantly without leaving any connection behind.
Passing states and file descriptors
Applications like NGINX can be reloaded with no downtime. However, if there are pending requests then there will be lingering processes that handle those connections before they terminate. This is not ideal for observability. It can also cause performance degradation when the old processes start building up after consecutive restarts.
In three micro-services in this blog post, we use the state-passing concept, where the pending requests will be paused and transferred to the new process. The new process will pick up both new requests and the old ones immediately on start. This method indeed requires a higher complexity than keeping the old process running. At a high level, we have the following extra steps when the application receives an upgrade request (usually SIGHUP): pause all tasks, wait until all tasks (in groups) are paused, and send them to the new process.
WaitGroup using JoinSet
Problem statement: we dynamically spawn different concurrent tasks, and each task can spawn new child tasks. We must wait for some of them to complete before continuing.
In other words, tasks can be managed as groups. In Go, waiting for a collection of tasks to complete is a solved problem with WaitGroup. We discussed a way to implement WaitGroup in Rust using channels in a previous blog. There also exist crates like waitgroup that simply use AtomicWaker. Another approach is using JoinSet, which may make the code more readable. Considering the below example, we group the requests using a JoinSet.
    let mut task_group = JoinSet::new();

    loop {
        // Receive the request from a listener
        let Some(request) = listener.recv().await else {
            println!("There is no more request");
            break;
        };
        // Spawn a task that will process request.
        // This returns immediately
        task_group.spawn(process_request(request));
    }

    // Wait for all requests to be completed before continue
    while task_group.join_next().await.is_some() {}
However, an obvious problem with this is if we receive a lot of requests then the JoinSet will need to keep the results for all of them. Let’s change the code to clean up the JoinSet as the application processes new requests, so we have lower memory pressure
    loop {
        tokio::select! {
            biased; // This is optional

            // Clean up the JoinSet as we go
            // Note: checking for is_empty is important 😉
            _task_result = task_group.join_next(), if !task_group.is_empty() => {}

            req = listener.recv() => {
                let Some(request) = req else {
                    println!("There is no more request");
                    break;
                };
                task_group.spawn(process_request(request));
            }
        }
    }

    while task_group.join_next().await.is_some() {}
Cancellation
We want to pass the pending requests to the new process as soon as possible once the upgrade signal is received. This requires us to pause all requests we are processing. In other terms, to be able to implement graceful restart, we need to implement graceful shutdown. The official tokio tutorial already covered how this can be achieved by using channels. Of course, we must guarantee the tasks we are pausing are cancellation-safe. The paused results will be collected into the JoinSet, and we just need to pass them to the new process using file descriptor passing.
For example, in Bumblebee, a paused state will include the environment’s file descriptors, client socket, and the socket proxying IP flow. We also need to transfer the current NAT table to the new process, which could be larger than the socket buffer. So the NAT table state is encoded into an anonymous file descriptor, and we just need to pass the file descriptor to the new process.
Conclusion
We considered how a complex proxy app can be divided into smaller components. Those components can run as new processes, allowing different life-times. Still, this type of architecture does incur additional costs: distributed tracing and inter-process communication. However, the costs are acceptable nonetheless considering the performance, maintainability, and reliability improvements. In the upcoming blog posts, we will talk about different debug tricks we learned when working with a large codebase with complex service interactions using tools like strace and eBPF.
The collective thoughts of the interwebz
Manage Consent
To provide the best experiences, we use technologies like cookies to store and/or access device information. Consenting to these technologies will allow us to process data such as browsing behavior or unique IDs on this site. Not consenting or withdrawing consent, may adversely affect certain features and functions.
Functional
Always active
The technical storage or access is strictly necessary for the legitimate purpose of enabling the use of a specific service explicitly requested by the subscriber or user, or for the sole purpose of carrying out the transmission of a communication over an electronic communications network.
Preferences
The technical storage or access is necessary for the legitimate purpose of storing preferences that are not requested by the subscriber or user.
Statistics
The technical storage or access that is used exclusively for statistical purposes.The technical storage or access that is used exclusively for anonymous statistical purposes. Without a subpoena, voluntary compliance on the part of your Internet Service Provider, or additional records from a third party, information stored or retrieved for this purpose alone cannot usually be used to identify you.
Marketing
The technical storage or access is required to create user profiles to send advertising, or to track the user on a website or across several websites for similar marketing purposes.