Tag Archives: home monitoring

What’s Up, Home? – I created my first Zabbix 7.0 custom widget

Post Syndicated from Janne Pikkarainen original https://blog.zabbix.com/whats-up-home-i-created-my-first-zabbix-7-0-custom-widget/27668/

As Zabbix 7.0 will come with the new widget framework, allowing communication between different widgets on dashboards, of course, I had to try it out.

Creating the module

The blog post title is a bit of a clickbait in the sense that this example is just 1:1 from the Zabbix Summit 2023 custom widgets workshop session. I made some very, very minor modifications to the code, mainly just changing my name and so on to manifest.json files. Since the code itself was obtained from the workshop session, I’m not going to publish it, but this much I will tease:

{
   "manifest_version": 2.0,
   "id": "whatsuphome",
   "type": "widget",
   "name": "What's up, home?",
   "namespace": "WMHostNav",
   "version": "1.0",
   "author": "Janne Pikkarainen",
   "description": "Custom host filtering widget for my home monitoring purposes",
   "widget": {
       "js_class": "WidgetWMHostNav",
       "out": [
           {
               "type": "_hostids"
           }
       ]
   },
   "assets": {
       "js": [
           "class.widget.js"
       ],
       "css": [
           "widget.css"
       ]
   }
}

Beginning with Zabbix 7.0, you can create your own custom widgets with JavaScript & PHP, and easily make other widgets on the dashboard to react to clicks you made on some other widget. The manifest.json file in the root of your custom module can describe what kind of info your widget will broadcast to other dashboard widgets, or what kind of info it will be receiving and obeying. Other than that, the custom widget only has a 2.6-kilobyte JavaScript file and a 587-byte CSS file. Modules are placed under /usr/share/zabbix/modules.

Next, just like in older versions of Zabbix, to activate your module you just go to Administration->Modules and click on Scan modules. And, there you have it.

Then, in your widgets, you can enable the dynamic reactions to other widgets or dashboard query changes like this:

Great! But what will it do?

I now have a new way of filtering the visible alerts. The custom widget on the left lists my host groups and hosts that belong to them.

Observe what happens when I click on the Electricity usage button:

I’m not limited to only selecting one host at a time, I can click on multiple hosts. Now see what happens if I also choose Lunch menus from my hosts.

The possibilities are endless

This example is just a simple read-only example. But, as Alexei mentioned to me after my speech at the Zabbix Summit 2023, this new framework could be used for controlling stuff, too. When I have time, I’ll try to run custom scripts and do other write operations through Zabbix API and this new framework.

Having a proper control panel for switching on/off the lights, music, and other things would be really cool, and now it certainly is possible. The future of the Zabbix user interface is really exciting thanks to new custom widgets.

This post was originally published on the author’s page.

The post What’s Up, Home? – I created my first Zabbix 7.0 custom widget appeared first on Zabbix Blog.

What’s Up, Home? – Time to start to use Zabbix 7.0 (at home)

Post Syndicated from Janne Pikkarainen original https://blog.zabbix.com/whats-up-home-time-to-start-to-use-zabbix-7-0-at-home/27610/

Since I will have some real use for Zabbix 7.0 when it comes out, I figured out that maybe it’s time to switch my What’s up, home? main instance to run on Zabbix 7.0beta1.

Actually, I first upgraded to Zabbix 7.0alpha9 early yesterday, but then 7.0beta1 got released later in the evening before I had time to play around with alpha9.

Anyway, now my Raspberry Pi 4 is running the latest and greatest version of Zabbix. A possible bumpy ride ahead, but I’m ready!

First impressions

The upgrade process itself went smoothly, just like with the stable releases. All my data, dashboards, triggers, and other rules are still in place.

Developers tell you that the new 7.0 will be much faster under the hood due to migrating to threads and asynchronous polling, among other changes. It ain’t just market speak, as this is my Zabbix instance before and after the upgrade. I don’t think that I need to annotate the graphs to show the point when I did the upgrade. The part that’s still hovering around 20% is my ICMP ping pollers. Other than that, in my humble home setup, everything is now pretty much idle.

Looking at my Raspberry Pi dashboard, not much has changed, and anyway, my Raspberry Pi is running many other things than Zabbix, too.

Here’s CPU:

Memory:

Disk I/O utilization:

Temperature:

From single item view to gauges

To try out the new gauge widget, I threw in a few of them showing some temperatures. The widget is very configurable.

Interactive manual host/event actions

In addition to being actually useful in production, the new interactive host/event actions are fun to play with. You can provide parameters to your scripts via dropdown or a free text field. Here’s a dropdown example. Well, a mockup, because my Python script is currently just a Hello world always returning that it changed the light color. Anyway, will modify my existing lights on/off script to handle colors, too.

So, if in scripts I click on Advanced Configuration, I get to adjust the input type and dropdown options.

… which gives me this:

Now, when I click on Change home office light color, I get to see:

And after choosing any of the colors, I get:

Easy! Just pass {MANUALINPUT} macro for your script as a parameter and it works. Like this:

Will definitely be helpful in serious business applications, as your on-call guys could, for example, trigger any Ansible playbooks through Zabbix to investigate and/or fix something just by clicking on an alert.

DNS monitoring gone overkill

With the new and improved net.dns.get Zabbix agent item key, you can query no less than 73 different DNS record types. To visualize this, your DNS monitoring could look this wild. No, whatsuphome.fi doesn’t give you back answers for nearly all of the query types but at least Zabbix tries.

Next page:

So if there’s something really deep you want to know about your DNS, Zabbix now supports it.

… and much more!

I’ll have lots of poking to do, including creating my custom widgets. But, from now on, bye-bye Zabbix 6.4. Here at What’s up, home?, it’s now time to move on. Oh, and by the way, Grafana also continues working just fine with Zabbix 7.0beta1, or at least I haven’t seen any broken dashboards yet.

This post was originally published on the author’s page.

The post What’s Up, Home? – Time to start to use Zabbix 7.0 (at home) appeared first on Zabbix Blog.

What’s Up, Home? – Monitor your ad blocker with Zabbix

Post Syndicated from Janne Pikkarainen original https://blog.zabbix.com/whats-up-home-monitor-your-ad-blocker-with-zabbix/26912/

Can you monitor your ad blocker with Zabbix? Of course, you can!

API defines it all

My home Asus router is running on Asuswrt-Merlin firmware, and with that, I have AdGuard Home ad blocker.

As AdGuard Home has an API, monitoring it with Zabbix is trivial.

Communicate with the API

Communicating with AdGuard Home API is easy: pass it Authorisation: Basic XXXXXXXXXXXX header, where XXXXXXXXXX is just a Base64 hash of your AdGuard username and password. You can generate that Base64 snippet with for example

echo -n "myuser:mypassword" | base64

Next, in Zabbix, create a new HTTP Agent type item, and point it to your AdGuard Home instance.

Create some items

You’ll get the info back as JSON, so next you can create some dependent items and start monitoring. I only added

  • Total number of DNS requests
  • Blocked # of DNS requests
  • Redirects to safe search
  • Parental advisory stuff
  • Average request processing time

For the dependent items, you’ll then just do some JSONPath processing.

Add triggers

Next, I added a few triggers to alert me if AdGuard starts to run slower than usual.

Add service

Finally, I added AdGuard as a new business service, so I’ll get an SLA for it.

And that’s it! From now on I’ll know more about how well my home router ad-blocker is working. (Well, it also has a Skynet firewall which probably filters stuff before AdGuard Home, but that’s another story….)

This post was originally published on the author’s page.

The post What’s Up, Home? – Monitor your ad blocker with Zabbix appeared first on Zabbix Blog.

What’s Up, Home? – How to secure your (home) monitoring

Post Syndicated from Janne Pikkarainen original https://blog.zabbix.com/whats-up-home-how-to-secure-your-home-monitoring/26241/

As my home monitoring experiment has become such a celebrity and as it has so much going on, I’m trying to make sure I won’t ever lose its configuration and data, no matter what would happen. Here are some tips and reminders for you, too.

In the IT world, so much can go wrong. Hardware can die, files can become corrupt, malware can hit you, hackers can breach your systems, buggy software updates can cause havoc, you can fat-finger some commands or click on the wrong place and remove data… the list is endless. Here are some ways I’m attempting to protect my home monitoring environment.

Keep software updated

First things first. In today’s malicious world, it’s mandatory that you keep your software updated. With Linux and Zabbix, you don’t have an excuse to skip the updates. Updating your systems is fast and trouble-free. In small environments like home, even major Zabbix upgrades are fast as the database is not very big, so the database migrations that in a corporate environment can take time, will go through in minutes if not faster.

Remember to backup

Keep your backups in good shape. In my case, I do take backups with BackupPC and monitor my backups with Zabbix.

But I don’t trust one environment. What if my BackupPC says Kaboom? A nightly cron job also copies backup archives from my Raspberry Pi to my Mac, which in turn mirrors the backups to my iCloud. And, there’s one more cloud service I’m using for all my backups but not mentioning it here by name.

Test your backups

As long as you have not verified that your backups do actually work, you do not have a working backup. Have a virtual machine into which you can try to restore your backups. See if they work. Test them periodically, either manually or figure out an automated way to do that. 

In the case of Zabbix, you can make your primary Zabbix monitor your test environment, and make Zabbix alert if your restore environment Zabbix suddenly starts responding back something else than the regular login page, or if the restore environment database doesn’t come back with some query response you would expect.

Setup a HA cluster

As any hardware can die, it’s not a bad idea to set up a HA cluster. Last winter I was preparing for potential electricity blackouts here in Finland and did setup my laptop to be a secondary node for my Zabbix. This setup has been working very well.

Use strong passwords

Even if it would only be your sandbox environment where you do test new stuff, please remember to use strong passwords. An evil actor can attempt to breach more targets in your network through a single point of failure.

Use ssh keys

Instead of username + password combination, use ssh keys for ssh authentication. Keys are immune to brute-force attempts and with tuning, ssh keys can also be allowed to only connect from specific IPs and run only specific commands. You know how in your ~/.ssh/authorized_keys the lines do start with something like 

ssh-rsa aZfgT12b(....

but if you modify it to be 

command="/usr/bin/rsync" ssh-rsa aZfgT12b(....

well, then only rsync would be allowed.

Or, for IP address limitation

from="123.123.123.123" ssh-rsa aZfgT12b(....

Of course, these can be combined:

from="123.123.123.123" command="/usr/bin/rsync" ssh-rsa aZfgT12b(....

Obviously, this grants you much more security than traditional logins.

Use HashiCorp Vault

OK, I admit I’m not doing this at home as it would be overkill for my few logins. But, in a larger environment with absolutely critical safety requirements, use HashiCorp Vault for protecting your credentials. Zabbix has native support for it.

Monitor your logs

Setup a centralized log server — it can be your Zabbix server environment, too — and make sure you monitor the logs. My Zabbix gets all my logs, but wouldn’t be a bad idea to use more advanced log monitoring tools, too. Since I already do have ElastiFlow running at home, at some point I might start utilizing Elasticsearch for the logs. Not doing it much yet.

Use chkrootkit, AIDE, others

Tools like AIDE or chkrootkit can help you detect an intrusion. Set them to run in your cron and get alerted in case of any anomalies. Maybe I’ll one day integrate Zabbix with these tools.

Firewall your environment, use VPN

Don’t allow direct access from the Internet to your Zabbix, or your database, or anything really. In my case, my Asus router allows setting up OpenVPN connections, so that’s what I use. Whilst on the go, I just connect to OpenVPN on my phone and do whatever I need remotely through that.

Anything else?

Did I miss something? Let me know in the comments.

This post was originally published on the author’s page.

The post What’s Up, Home? – How to secure your (home) monitoring appeared first on Zabbix Blog.

What’s Up, Home? – 7 things to beware of if you monitor your home

Post Syndicated from Janne Pikkarainen original https://blog.zabbix.com/whats-up-home-7-things-to-beware-of-if-you-monitor-your-home/26035/

When reading this blog, you could easily think that everything is smooth sailing all the time. No. When you monitor your home IoT — or frankly, just USE your home IoT — you have plenty of small details to watch out for. I list them for you, so you don’t have to find them out the hard way like I’ve done over this 1+ year of journey.

1. The status is not what it seems

This is especially true with the IoT devices operating on 433 MHz radio frequency. Your home smart hub sends the signal like a radio station hoping for your IoT device to catch it, and to my understanding, it does not get a reply back from the device. If anything is interfering with the signal, your device will miss the signal and thus your home smart hub will be showing the wrong status.

So, you will need to either get rid of these devices and replace them with devices that use a two-way communication protocol such as ZigBee or if that’s not possible, to set up extra monitoring to try to guess if the command your home smart hub sent actually went through. Did you attempt to power on/off a smart power socket connected to a radiator? Keep an eye on the smart temperature meter and react soon if the temperature does not start to rise after the power socket got powered on, or so.

2. Battery-low messages can be deceiving

Two of my Philips Hue motion sensors have been complaining about low battery status for about six months now, but they are still operating just fine. I’ll let you know when I finally have to replace the batteries on them. 

On the contrary, the batteries on some 433 MHz frequency Telldus thermometers can just die without too much warning. For them, your monitoring need to react fast if the values are not coming in. To make things more complicated, not TOO fast though, as sometimes these thermometers can hibernate for some time before reporting new values; possibly when there’s no change in temperature, they will enter some power save mode or something. I don’t know.

3. Bluetooth devices and 2.4 GHz Wi-Fi can interfere with each other

Even though my devices do not use 2.4 GHz Wi-Fi too much, I have some devices like Sonos smart speaker where it’s a must. So, for example, when playing music through that speaker, it’s possible that my Raspberry Pi 4 cannot hear the RuuviTag environmental sensor very reliably. It did help somewhat when I found out that on my Asus router, it was possible to enable some kind of “Bluetooth coexistence” mode, but it’s not a 100% solution for my issue.

4. Make sure any helper components are really up

Along with Zabbix and Grafana, my Raspberry Pi 4 runs Home Assistant to harvest some values about my iPhone and so on. It runs as a Docker image and generally is stable, but sometimes it just stops working. I have an automatic daily restart of that Docker image and so far that has been a relatively good way to keep the image running.

5. APIs can and will change

Monitoring something over some API? Or through web scenarios? Rest assured that your joy won’t last forever. This is IT, and things just won’t remain the same. SOMETHING is guaranteed to change every now and then and the more your monitoring relies on 3rd party things, the less you can trust that your monitoring just would keep on working. No, it’s likely you will need to alter things every now and then.

6. Monitor your monitoring

Even though Raspberry Pi 4 and Zabbix are very reliable and are very unlikely to cause you any trouble, of course, they can fail, or more likely something else will not be like it should. Your home router or Internet connection can die. Electricity can go down. Hardware can die. If you want to be really sure, monitor your monitoring from outside somehow. Have a separate monitoring running on the cloud somehow. 

In our case, the electricity and ISP are very reliable, and Cozify smart home hub has a nice feature where the Cozify cloud will text me if the hub loses connectivity — that’s usually a good indication that either the ISP or power went down. Also, I’m about to roll out a small cron job on this site which would check if my Zabbix has updated a test file in a while. If not, it would indicate my Zabbix would be down or otherwise unreachable, so then whatsuphome.fi could e-mail me.

7. You will get paranoid

With more knowledge comes more pain. With some devices, you’ll start to think that they are going to break soon. As an example, the freezer I keep referring to — sometimes it has short periods of time when its temperature for some reason rises a bit and then it goes down again. I don’t know if that has something to do with the fact that our freezer is one of those which does not form ice everywhere so it’s maintenance-free, or if that’s something else, but we keep observing spikes like this about once a week.

I have been working at Forcepoint since 2014 and have learnt not to trust the technology. — Janne Pikkarainen

This post was originally published on the author’s page.

The post What’s Up, Home? – 7 things to beware of if you monitor your home appeared first on Zabbix Blog.

Monitoring your cat’s health with Zabbix and the Litter Robot 3

Post Syndicated from Nathan Liefting original https://blog.zabbix.com/monitoring-your-cats-health-with-zabbix-and-the-litter-robot-3/22413/

In this blog post, you will learn how to set up monitoring for your Litter Robot 3. There’s some amazing community scripts already available to connect to the Litter Robot through a selfmade API, which we’ll be using in combination with some Python scripts and Zabbix.


Introduction

Technology is everywhere. On the streets, in our offices and even in our houses. This also means that many people have ‘smart’ lighting, fridges, cameras and a lot more. Personally, I have avoided these home automations for a long time, deeming them time-consuming. But, I think any IT Engineer sometimes feels there is a need to build and automate more and more. Thus, my house has also had a bit of smart home make-over and I’ve started setting up Zabbix at home to monitor everything ‘smart’.

One of the things I cannot live without in our house is our smart litterbox. It keeps the litterbox clean and the smell in the house nice, as well as it provides some very useful insights into my cats ‘potty’ behaviour. One of my cats “Jerry” has some issues with Feline Urinary Tract Disease (FLUTD). This has led Jerry to have some odd litterbox usage, which in his case can be fatal if not treated early on.

So, let’s bring Zabbix into the mix! Even though the Litter Robot has an app where I can see the usage, I want to be able to receive alerts from Zabbix if the Litter Robot usage goes over a certain threshold. Alerting me early on if issues might be arising again. Let’s set things up.

How to

Setting up the script

To make this all possible, we will need to get some information from our Litter Robot or Litter Robots if we have more than one in our account. There’s no official documented API available for the Litter Robot, but there is a way to get information from the device by connecting to the Whisker services. To make things easy for us, we’ll be using a community-made Python library to set up the connection and execute some functions:

https://github.com/natekspencer/pylitterbot

This library contains a number of functions that we can utilize to get information from the Litterbox, but also to make changes to it:

  • refresh()
  • start_cleaning()
  • reset_settings()
  • set_panel_lockout()
  • set_night_light()
  • set_power_status()
  • set_sleep_mode()
  • set_wait_time()
  • set_name()
  • reset_waste_drawer()
  • get_activity_history()
  • get_insight()

Utilizing this library we’ve made some scripts available at the Github page below.

https://github.com/OpensourceICTSolutions/zabbix-litterrobot

Login to your Zabbix environment and install the Python library to your Zabbix server or proxy first with:

pip install pylitterbot

Next, execute the following command to download the scripts and put them in the right location.

mkdir /usr/lib/zabbix/
mkdir /usr/lib/zabbix/litterrobot/
cd /usr/lib/zabbix/litterrobot/

wget https://raw.githubusercontent.com/OpensourceICTSolutions/zabbix-litterrobot/main/litterrobot_get_robots.py
wget https://raw.githubusercontent.com/OpensourceICTSolutions/zabbix-litterrobot/main/litterrobot_get_insights.py
wget https://raw.githubusercontent.com/OpensourceICTSolutions/zabbix-litterrobot/main/litterrobot_get_activity.py

These scripts will have to be executed by Zabbix server’s (or proxy’s) local Zabbix agent, and thus we’ll also have to download the correct UserParameter files.

cd /etc/zabbix/zabbix_agent2.d/
or
cd /etc/zabbix/zabbix_agentd.d/

wget https://raw.githubusercontent.com/OpensourceICTSolutions/zabbix-litterrobot/main/litterrobot_userparams.conf

Then, we have to make sure that the Zabbix agent will be able to use these new parameters by enabling unsafe user parameter option (since there is an @ in the username). Edit /etc/zabbix/zabbix_agent2.conf or /etc/zabbix/zabbix_agentd.conf and add the following:

UnsafeUserParameters=1

Then we restart the agent with the following command:

systemctl restart zabbix-agent
or
systemctl restart zabbix-agent2

Setting up Zabbix

With the scripts in place and the Zabbix agent ready to execute them, we can set up our monitoring in the Zabbix frontend. To do this, we will have to download and import the template. You can find the 6.2 version template here: https://github.com/OpensourceICTSolutions/zabbix-litterrobot/blob/main/zabbix_litterrobot_python_template.yaml

After downloading the template, import it into Zabbix.

Create a new host for your Litter Robot:

Then make sure to add your username and password as macros:

The result

The result is that we can now find all of our important information about the Litter Robot 3 in Zabbix:

Not only that, after we have an idea of how many times per day our cat(s) usually go to the toilet we can start to use the triggers:

There’s a message for when the drawer is full, but also a Warning and High trigger for when there are more than 12 or 15 cycles respectively. This is a default set for my two cats, your cats might have different potty behavior – update your macros accordingly.

As well as create some useful graphs:

Conclusion

Our pets are a big part of our life and sometimes it can be hard to communicate with them. Cats are very likely to hide their feelings, but one of the telling signs something is wrong with them is the number of times they visit the litterbox. Jerry has had a hard time, but our Litter Robot has helped us and our veterinary keep an eye on him to get ahead of his FLUTD. Using Zabbix we can keep Jerry out of surgery as much as possible.

And keep both (Midna on the left, Jerry on the right) of them racing through the house and enjoying all of their 9 lives.

I hope you enjoyed reading this blog post and if you have any questions or need help configuring anything in your Zabbix setup feel free to contact me and the team at Opensource ICT Solutions. We build a ton of cool integrations like this and much more!

Nathan Liefting

https://oicts.com

A close up of a logo Description automatically generated

What’s Up, Home? – Living Inside an Audio Bubble

Post Syndicated from Janne Pikkarainen original https://blog.zabbix.com/whats-up-home-living-inside-an-audio-bubble/22541/

Can you monitor your Bluetooth headset usage hours with Zabbix? Of course, you can!

By day, I earn living by being a monitoring tech lead in a global cyber security company. By night, I monitor my home with Zabbix and Grafana and do some weird experiments with them. Welcome to my weekly blog about how I monitor my home.

I adjust and tweak myself with the power of music. Finding out the root cause for a severe outage or just fixing some less severe error becomes much more epic if I listen to Hans Zimmer’s music. Trance, drum ‘n bass, demoscene music, and retro gaming music keep me afloat if I have something simple, repetitive things to do. For some reason I write each and every of these home monitoring entries with the soundtrack from the latest Batman movie playing background, and so forth.

My music listening habits, the online meetings at work, and the fact that I mostly work from home, just like my wife, means that I use my Valco headphones several hours a day. Valco claims that their headset can provide about 40 hours runtime with a single charge, and that kind of must be true as I only charge the headset on Sundays for them to be ready for a new week on Monday morning.

But how much do I really use my Valcos? Zabbix to the rescue!

Mac to Valco, Mac to Valco, please respond

As I use my headset mostly with a MacBook, I needed to find out how to get the connection status info from macOS command line. I am sure there are more sophisticated ways of doing this, but the sledgehammer method I used is good enough for my home use.

On macOS, system_profiler command gives you back tons of data, one of the elements being the Bluetooth devices. Sure enough, my Valco headset is visible there, and so is the connection status.

Now that I have the data available, I could send all this text output to Zabbix and use Zabbix item pre-processing. This morning (yes, I created this whole thing only two-three hours ago) I did something else though.

You know, while I was testing if my attempt works in real-time, I created a terrible shell one-liner, which I now also use with Zabbix.

system_profiler SPBluetoothDataType 2>/dev/null | grep -A10 “Valcoitus Bass:” | grep “Connected:” | cut -d ‘:’ -f2 | xargs -I ‘{}’ zabbix_sender -z my.zabbix.server -s “Zabbix server” -k valco.connected -o ‘{}’

Beautiful? No. Does it work? Yes. If I remove the zabbix_sender part, this is what happens: it returns “Yes” or “No”, indicating if my headphones are connected or not.

In other words, theoretically, this tells if my headset is powered on and if I am using them. In practice, I could of course have forgotten to turn the headset off, but that really does not happen.

My MacBook now runs the one-liner every minute via a cron job, so my Zabbix receives the data in near-enough real-time.

Zabbix time!

All my efforts and the zabbix_sender command are no good if I don’t do something on the Zabbix side, too.

With zabbix_sender, you need to set up a Zabbix trapper item on Zabbix. It’s really not rocket science, check this out:

But wait! My shell responded back “Yes” or “No”, but the Type of information is set to numeric. Am I stupid? Careless? No. There’s also some preprocessing involved.

I changed the values to be numeric so I can get fancier with Grafana later on; with numeric data, I can get better statistics about how much I actually do use my headphones and get really creative.

Does it work?

Of course, it does. Here are some latest data:

… and here’s a graph:

I will tell you next week how many hours I have spent inside my active noise-cancelling bubble. Probably too many, any ear doctor would tell me.

I have been working at Forcepoint since 2014 and without music, would be way less productive. — Janne Pikkarainen

This post was originally published on the author’s LinkedIn account.

The post What’s Up, Home? – Living Inside an Audio Bubble appeared first on Zabbix Blog.

What’s Up, Home? – Time to Get Sirious

Post Syndicated from Janne Pikkarainen original https://blog.zabbix.com/whats-up-home-time-to-get-sirious/22400/

Can you integrate Zabbix with Siri? Of course, you can! By day, I am a monitoring tech lead in a global cyber security company. By night, I monitor my home with Zabbix & Grafana and do some weird experiments with them. Welcome to my weekly blog about the home project.

I have lost count of exactly when, but a couple of major iOS/macOS versions ago Apple’s Siri gained the Shortcuts application. It allows you to automate all kinds of stuff and do some drag-and-drop ‘programming’.

What do I use it for? You guessed it right — I integrate Shortcuts with Zabbix API.

Setting up the Zabbix side

For my home Zabbix environment, I do not have any complex access rights set. So, setting up the API token for Shortcuts to consume was almost a one-click operation. In Zabbix, I went to User settings → API tokens → Create API token and let it do its stuff.

Creating a new shortcut

Now that I have the API token in place, next we need to create the shortcut. That’s not too much work though — run the Shortcuts application and create a new shortcut. What the shortcut below does is:

  • calls Zabbix API and requests our fridge temperature
  • parses the value and appends “degrees Celsius” to it
  • returns the value

Yes, that’s all of it. Drag ‘n drop a couple of elements and assign some values. Done.

Time to get Sirious

Ok, so we have our shortcut in place. What happens if I now ask Siri to check beer temperature? This happens.

The result is actually our refrigerator temperature, the beer thing was just to make this more interesting. But, as you can see, integrating Zabbix with Siri or vice versa is not too hard.

Any real-world use cases for this, other than the geek factor? I don’t know. It might be handy to request the latest alerts or similar from Siri if I’m driving my car and I get to hear that something’s wrong at work.

I have been working at Forcepoint since 2014 and I confess I actually use Siri for some basic work stuff, too. — Janne Pikkarainen

This post was originally published on the author’s LinkedIn account.

The post What’s Up, Home? – Time to Get Sirious appeared first on Zabbix Blog.

What’s Up, Home? – Say Cheese!

Post Syndicated from Janne Pikkarainen original https://blog.zabbix.com/whats-up-home-say-cheese/22181/

Can you take screenshots of the websites you monitor with Zabbix? Of course, you can! By day, I earn my living by being a monitoring tech lead in a global cyber security company. By night, I monitor my home. Welcome to my weekly blog about how I monitor my home with Zabbix & Grafana and do some weird experiments with them.

Proper full-stack monitoring does cover everything from the device’s physical status to what the end-user sees. However, often even with website monitoring, web admins only rely on all kinds of run-time data; operating system load, hardware health, service response times, and logs. If your site has some rarely occurring technical issue, you might not have any idea what the site looks like when the error happens. Is your site looking really wrong or is maybe just a panel or two misbehaving during some issue?

Zabbix & Selenium to the rescue!

Get your Selenium

No, even if this post is meant to provide some food for thought, I am not speaking about the selenium your metabolism needs. Instead, I am speaking about a web-test framework that allows you to automate web browsers by using Java, Python, or several other languages it supports. It’s probably most useful for web browser & website developers so they can be sure that their sites look OK on all major browsers and so forth, but why not utilize that with your monitoring, too?

With a really short Python script (or whatever language) you can spawn a headless instance of whatever browser you want and ask it to do stuff for you. In the horribly simple example above, the script can be called like

selenium_screenshot.py blog.zabbix.com

and it then saves the screenshot under /usr/share/zabbix/assets/webtest-screenshots/ directory which is accessible by my home Zabbix & Grafana.

Now, where did I put that script?

What I actually use this for at home is that whenever some lunch restaurants publish their new menus, my Zabbix grabs a screenshot of the lunch menus and I can then spy the menus without a need to go to sites by myself.

As I do not want to show the more exact locations of the places I visit, in this example I’ll show you how to screenshot the blog.zabbix.com site instead.

Hooking the script to Zabbix is easy; just add the script to Zabbix via its Administration –> Scripts, and add it as a script you can call via Actions, and if you so want, also put it as a manual action so you can call the script manually any time you want through Zabbix contextual menus.

Then just add a trigger that snaps a screenshot whenever your web test is failing.

Say cheese!

Now that we have our screenshot mechanism in place, this is how it looks through Zabbix URL widget:

… and this is how it looks when embedded to Grafana with its Text panel, HTML content type and a simple <img> tag:

What’s this useful for?

Lots of stuff. From now on, you too can easily embed a screenshot of your monitored website within your monitoring environment. Put some more panels to that dashboard showing the active alerts, graphs, run-time data, and logs, and you can have a very comprehensive full stack monitoring in place.

Or make your screenshot script more intelligent (I recommend that anyway), and make it save the files with date stamp info in filenames, so you can have a nice little time machine inside Grafana and its time picker.

Selenium can also give you many more other details, such as performance data or the URLs which were called during the page load. I’m sure that’s useful, too.

I have been working at Forcepoint since 2014 and never get tired of getting a more clear view of the status of the stuff I monitor. — Janne Pikkarainen

The post What’s Up, Home? – Say Cheese! appeared first on Zabbix Blog.

What’s Up, Home? – The Relaxing Breeze

Post Syndicated from Janne Pikkarainen original https://blog.zabbix.com/whats-up-home-the-relaxing-breeze/22031/

Can you monitor a home air conditioner with Zabbix? Of course, you can! By day, I am a monitoring tech lead in a global cyber security company. By night, I monitor my home. Welcome to my weekly blog about how I monitor my home with Zabbix & Grafana and do some weird experiments.

At the moment I was writing this blog post, the summer — and thus maybe the heat wave season — was only approaching. For the past two summers, our home has been a hot place to be. Enough is enough, so that day we got an air conditioner. It’s not a very high-end model, but these things currently come with built-in Wi-Fi.

Wouldn’t it be cool to monitor that with Zabbix? Yes.

Wi-Fi, do you read me?

Getting the air conditioner connected to our Wi-Fi was as easy as the manual promised: press the Health button eight times in a row and wait until the air conditioner says “be-be-be-be-be-beep”. Sure enough, that happened, and moments later the AC Freedom app I installed on my iPhone started to show this.

For a normal person, this would be more than enough. For me, this was only the beginning and the next step would be adding the thing to Zabbix.

Encountering headwind

Checking the first things first — no, Zabbix does not seem to support this AC out of the box. No worries, that is not the end of the world, it just slightly slows things down, and also makes things a bit more interesting.

Now that the AC was connected to our Wi-Fi, I first went to check out some data about the AC from the Wi-Fi admin interface. It revealed to me that the device contains network hardware by Broadlink in it. Ah-ha! Search engine, here I come!

Moments later, I found out Broadlink Air Conditioners to Mqtt.

Okay, MQTT it is. That’s a lightweight protocol designed for IoT device communication, and I had absolutely no clue how that worked, as this was the first time I got to use it. It would blow if this step proved to be too cumbersome.

Luckily, thanks to open source and 2022, getting it to run was not that hard.

It’s nearly summer, welcome mosquitos

The aforementioned Broadlink AC to MQTT quickly raised my confidence, as it immediately found my new device. Yes, I can do this!

… that’s nice, but how to use this any further? I could not see any MQTT messages anywhere.

Soon enough I realized I need to install an MQTT message broker to catch the messages and I found Eclipse Mosquitto.

An apt install mosquitto mosquitto-clients and some config file guessing later my jaw dropped, as I saw this:

Wow, that’s a wind-wind situation. It returns sane values! My next step was then to find out if I can somehow access those URL-like paths with Zabbix.

With Zabbix, MQTT is just a breeze

I remembered from some ancient Zabbix Summit that Zabbix 5.x gained Modbus/MQTT support. My Raspberry Pi 4 is running Zabbix 6.0.4, so certainly that part should be covered.

In the end, getting MQTT to run with Zabbix was almost too easy. Zabbix agent 2 has native MQTT support with its mqtt.get active check, so I tried to add an item like this:

And, as this is Zabbix, of course, it works:

Yay! From now on, my home Zabbix can alert me about the AC as well and generate some fancy graphs.

What’s next?

As I’ve got the AC unit recently and this is just the beginning, I still have more things to add later.

  • Add some “Yikes! It’s too hot!” triggers
  • Create a Grafana dashboard
  • Try out if I can adjust the air conditioner settings using Zabbix

Anyway, in the end, this certainly was easier than I expected.

I have been working at Forcepoint since 2014 and monitoring has never been cooler. — Janne Pikkarainen

The post What’s Up, Home? – The Relaxing Breeze appeared first on Zabbix Blog.

What’s Up, Home? – Remotely Useful

Post Syndicated from Janne Pikkarainen original https://blog.zabbix.com/whats-up-home-remotely-useful/21719/

Can you integrate Zabbix with a remote control? Of course, you can! Does that make any sense? Maybe. Welcome to my weekly blog about how I monitor my home with Zabbix & Grafana and how I do weird experiments with my setup.

By day, I do monitoring for living in a global cyber security company. By night, I monitor my home. This week I have been mostly doing remote work… gaining physical remote access… okay, my puns are not even remotely funny, but please keep reading to find out how I integrated my Zabbix with remote control.

Adding a new remote to Cozify

First things first! I found a spare smart remote control. These devices are handy — not based on infrared but operate on 433 MHz range, so there is no need to point exactly towards some device, instead, the device works everywhere in the Cozify hub range, which spans even to our backyard. In Cozify, I can create the actions that happen whenever I push a button: turn on/off one or multiple lights, change the active scene to something else, pretty much everything I can do in Cozify.

For a normal person, the functionality provided by Cozify would be more than sufficient. Me? I only use Cozify as a bridge between the remote control and Zabbix to do something Completely Else.
So, let’s fire up my iPhone Cozify app and add the remote first.

Connecting to Zabbix

Now that I have my remote added to Cozify, the next thing is to add it to Zabbix. The way I have implemented this is that a set of Python scripts is polling Cozify, and one of the scripts is polling for devices that have REMOTE_CONTROL capability. Of course, my newly added Zabbix remote has that capability, and sure enough, here it is:

In other words, I pressed button number two when the Unix time was 1652242931624. That’s nice to know, but what to do with this info?

Going Freestyler

20+ years ago… wait, what, 20+ years ago really… yes, over twenty years ago Bomfunk MC’s released their Freestyler song and its music video where a guy controls his surroundings with remote control. Well, he uses an MP3 player for control, but still, that’s a remote control for sure.

Take a nostalgia trip down the lane and marvel at the beauty that is some Finnish subway stations and then get back to our scheduled program.


My newfangled Zabbix remote is now just a dummy device for Cozify and for Zabbix it does not carry the Freestyler powers yet, but let’s see what happens when we apply some additional love.

Adding additional value

Thanks to the power of Zabbix value mapping I can transform the button numbers into something more meaningful. Let’s first add some values on the Value mapping tab:

See? That’s totally useful. Imagine I would be cooking dinner and my wife would be walking the dog / doing some gardening and I would like to let her know the dinner is ready: sending her a message over Signal or walking to our backyard would be soooooo much work if I can just press #1 on my remote instead. How lazy can you go? Very, although I suspect I am not going to use this in real life. But you never know!
To use these value mappings, I next applied the new value mapping to Zabbix remote item:

Suddenly, the latest data makes much more sense:

It deserves its own dashboard

So, at this point, we have the data collected and transformed into a human-readable form. Great! To make this all more consumable, there’s still some more work to do.

First, I created a simple Grafana dashboard with only a single panel in it:

Ain’t that beautiful?

It also deserves its own alerting

It would not be perfect without alerting, so let’s create a trigger!

… and an action…

… and behold, Zabbix can inform about the button presses to any configured media, in this case, e-mail. Of course, instead/in addition to messaging, a trigger could as well run any script, which means endless possibilities.

Cozify devs, yo!

Currently, there’s an ugly delay before Zabbix reacts due to the fact that my scripts are polling Cozify. It would be fantastic if Cozify could nudge my Zabbix via SNMP traps, or if I even could configure a central log server in Cozify’s setting to make it send its logs to my Zabbix server in real-time; that would turn my home monitoring into a real-time thing instead of polling happening every five minutes, as Zabbix could just follow the log and react to events accordingly.

Would you like fries with that?

Sure, this is just dumb play. But let’s stop for a minute and think about actual real-world usage scenarios where it might actually be useful to combine physical buttons with Zabbix, albeit I admit even these use cases might be weird:

  • The Refill button in a pub table would alert the waiter that table X needs more beer
  • In a factory/warehouse, physical buttons could be used to mark problematic areas during a physical inspection. Is any engine not running? A gauge showing funny values? Press a button near it, Zabbix gets an alert, and an engineer can visit the site
  • Use it as a stopwatch to measure how long you have been working; one button would mean “Start working”, another “Stop working”

Cozify supports more than just remote controls: battery-powered smart wall switches you can install without being an electrician, smart keyfobs, and smart dimmers, so there would be definitely more areas to explore in this physical interaction space. And, I talk about Cozify all the time as that’s what I have, but I’m sure your similar smart hub could do the same as well.

Anyway, I’ve just demonstrated to you how Zabbix could be used for limited instant messaging or customer service. That’s some serious flexibility.

I have been working at Forcepoint since 2014 and never get tired of inventing new ways to communicate with Zabbix. — Janne Pikkarainen

The post What’s Up, Home? – Remotely Useful appeared first on Zabbix Blog.

What’s Up, Home? – Razor-sharp Thinking

Post Syndicated from Janne Pikkarainen original https://blog.zabbix.com/whats-up-home-razor-sharp-thinking/21507/

Can you monitor a Philips OneBlade shaver with Zabbix? Of course, you can! But why do that and how to monitor a dumb device with zero IoT capabilities?

Welcome to my weekly blog: I get my bread and butter by being a monitoring tech lead in a global cyber security company, but I monitor my home for fun with Zabbix & Grafana and do some weird experiments.

Staying Alive

We all know how the battery-operated shavers, toothbrushes and similar devices sound very energetic and trustworthy immediately after you have charged their battery to full. Over time (over not so long time) they start to sound tired, but technically you can still use them. Or, you think you can still use them, but instead, they will betray you and die in the middle of the operation. Zabbix to the rescue!

Sing to me, bad boy

To get an idea about the battery runtime left, I needed to somehow capture the sound frequency and analyze it. The recording part was easy — after I had charged my razor to full level, I did leave it running and recorded the sound with my iPhone Voice Memos.

But how to get the sound frequency? This is the part where the audio engineers of the world can laugh at me in unison.

At first, I tried with Audacity as traditionally it has done all the tricks I possibly need to do with audio. Unfortunately, I could not find a way to accomplish my dream with it, and even if I would have, I fear I would have to manually do something with it, instead of the automated fashion I’m wishing for.

I could see all kinds of frequencies with Audacity, but was not able to isolate the humming sound of Philips OneBlade, at least not to a format I could use with Zabbix. Yes, Audacity has macros and some functionality remotely from the command line, but I interrupted my attempts with it. If you can do stuff like this with Audacity, drop me a note, I’m definitely interested!

Here come the numbers

Then, after a bit of searching, I found out aubiopitch. It analyzes the sample and returns a proper heckton of numbers back to you.

Those are not GPS coordinates or lottery numbers. That’s a timestamp in seconds and the sound frequency in Hz. And, just by peeking at the file manually, I found out that the values around 100, plus-minus something, were constantly present in the file. Yes, my brains have developed a very good pattern matching algorithm when it comes to log files, as that’s what I have been staring at for the last 20+ years.

As my 30+ minutes sample contained over 300,000 lines of these numbers, I did not want to bother my poor little home Zabbix with this kind of data volume for my initial analysis. I hate spreadsheet programs, especially with data that spans to hundreds of thousands of rows or more, so how to analyze my data? I possibly could have utilized Grafana’s CSV plugin, but to make things more interesting (for me, anyway), I called to my old friend gnuplot instead. Well, a friend in a sense that I know that it exists and that I occasionally used it two decades ago for simple plotting.

There it is, my big long needle in a haystack! Among some other environmental sounds, aubiopitch did recognize the Philips soundtrack as well! What if I filter out those higher frequencies? Or at least attempt to, my gnuplot-fu is not strong.

Yes, there it is, the upper line steadily coming down. After my first recording, it looks like that with a full battery the captured frequency starts from about 115 Hz, and everything goes well until about 93 Hz, but if I would start to shave around that time, I would better be quick, as I would only have two to three minutes left before the frequency quickly spirals down.

Production show-stoppers

This thing is not in “production” yet, because

  • I need to do more recordings to see if I get similar frequencies each time
  • I need to fiddle with iPhone Shortcuts to make this as automated as possible.

Anyway, I did start building a preliminary Zabbix template with some macros already filled in…

… and I have a connection established between my dear Siri and Zabbix, too; this will be a topic for another blog entry in the future.

I am hoping that I could get Siri to upload the Voice Memo automatically to my Zabbix Raspberry Pi, which then would immediately analyze the data with aubiopitch maybe with a simple incron hook, and Zabbix would parse the values. That part is yet to be implemented, but I am getting there. It’s just numbers, and in the end, I will just point Zabbix to a simple text file to gather its numbers or make zabbix_sender to send in the values. Been there, done that.

I have been working at Forcepoint since 2014 and for this post to happen I needed to use some razor-sharp thinking. — Janne Pikkarainen

The post What’s Up, Home? – Razor-sharp Thinking appeared first on Zabbix Blog.

What’s Up, Home? Welcome to my Zabbixverse

Post Syndicated from Janne Pikkarainen original https://blog.zabbix.com/whats-up-home-welcome-to-my-zabbixverse/21353/

By day, I am a monitoring technical lead in a global cyber security company. By night, I monitor my home with Zabbix and Grafana in very creative ways. But what has Zabbix to do with Blender 3D software or virtual reality? Read on.

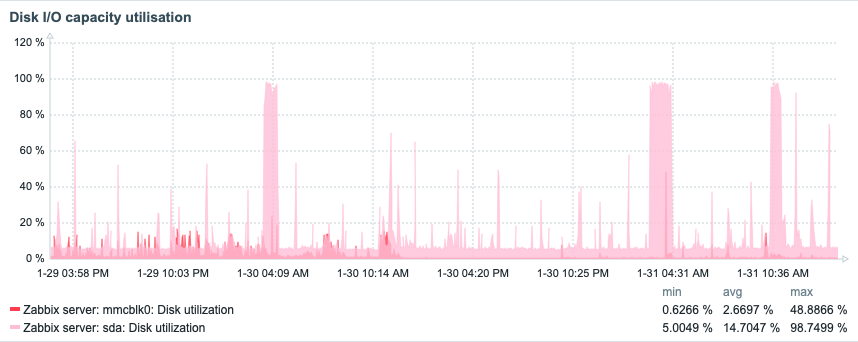
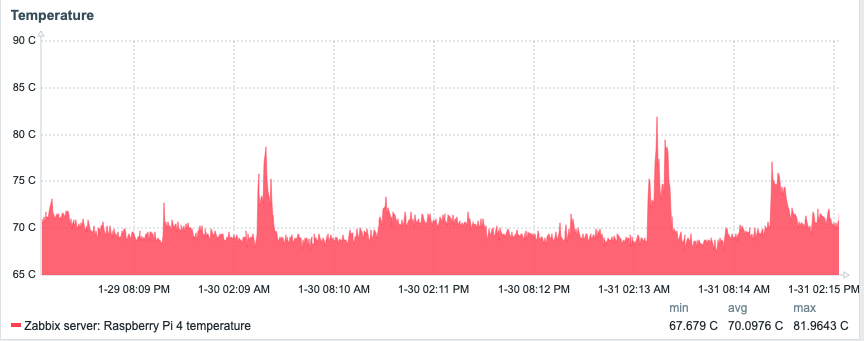
Full-stack monitoring is an old concept — in the IT world, it means your service is monitored all the way from physical level (data center environmental status like temperature or smoke detection, power, network connectivity, hardware status…) to operating system status, to your application status, enriched with all kinds of data such as application logs or end-to-end testing performance. Zabbix has very mature support for that, but how about… full house monitoring in 3D and, possibly, in virtual reality?

Slow down, what are you talking about?

The catacombs of my heart do have a place for 3D modeling. I am not a talented 3D artist, not by a long shot, but I have flirted with 3D apps since Amiga 500 and it’s Real 3D 1.4, then later with Amiga 1200 a legally purchased Tornado 3D, and not so legally downloaded Lightwave. With Linux, so after 1999 for me, I have used POV-Ray about 20 years ago, and as Blender went open source a long time ago, I have tried it out every now and then.

So, in theory, I can do 3D. In practice, it’s the “Hmm, I wonder what happens if I press this button” approach I use.

Not so slow, get to the point, please

Okay. There are several reasons why I am doing this whole home monitoring thing.

  1. I have been doing IT monitoring for 20+ years, so really, there is not much new for me. Don’t get that wrong — boring is GOOD when it comes to business monitoring. Your business does count on it, and it’s perfect that whatever you need to monitor, you can do it reliably and easily. But for me, it does not challenge my brain or get my creative juices flowing. Monitoring the 3D world sure does.
  2. With my home Zabbix & Grafana, I can get as wild and childish as I ever want. Of course, not so much at work. (Though I admit that at work I did set up an easter egg Grafana dashboard called OnlyFans — it is literally showing how the cooling fans of our servers and other devices are doing).
  3. I want to give y’all new ideas and motivation to take your monitoring to the next level.
  4. I want to help raise Zabbix as a product to a whole new level from traditional IT monitoring to monitoring the environment we all live in — anyway, the future of monitoring will more and more be in the real world, too
2D or not 2D, that is the question

For traditional IT monitoring, 2D interface and 2D alerts are OK, maybe apart from physical rack location visualization, where it definitely helps if a sysadmin can locate a malfunctioning server easily from a picture.

For the Real World monitoring, it is a different story. I’m sure an electrician would appreciate if the alert would contain pictures or animations visualizing the exact location of whatever was broken. The same for plumbers, guards, whoever needs to get to fix something in huge buildings, fast.

Let’s get to it

Now that you know my motivation, let’s finally get started!

In my case, leaping Zabbix from 2D to 3D meant just a bunch of easy steps:

  1. Model my home in Sweet Home 3D; it’s very easy to use and definitely easier for my back than my wife requesting “could we try out how the sofa would look like over there…?”
  2. Import the Sweet Home 3D object to Blender
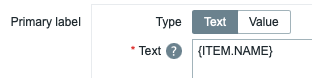
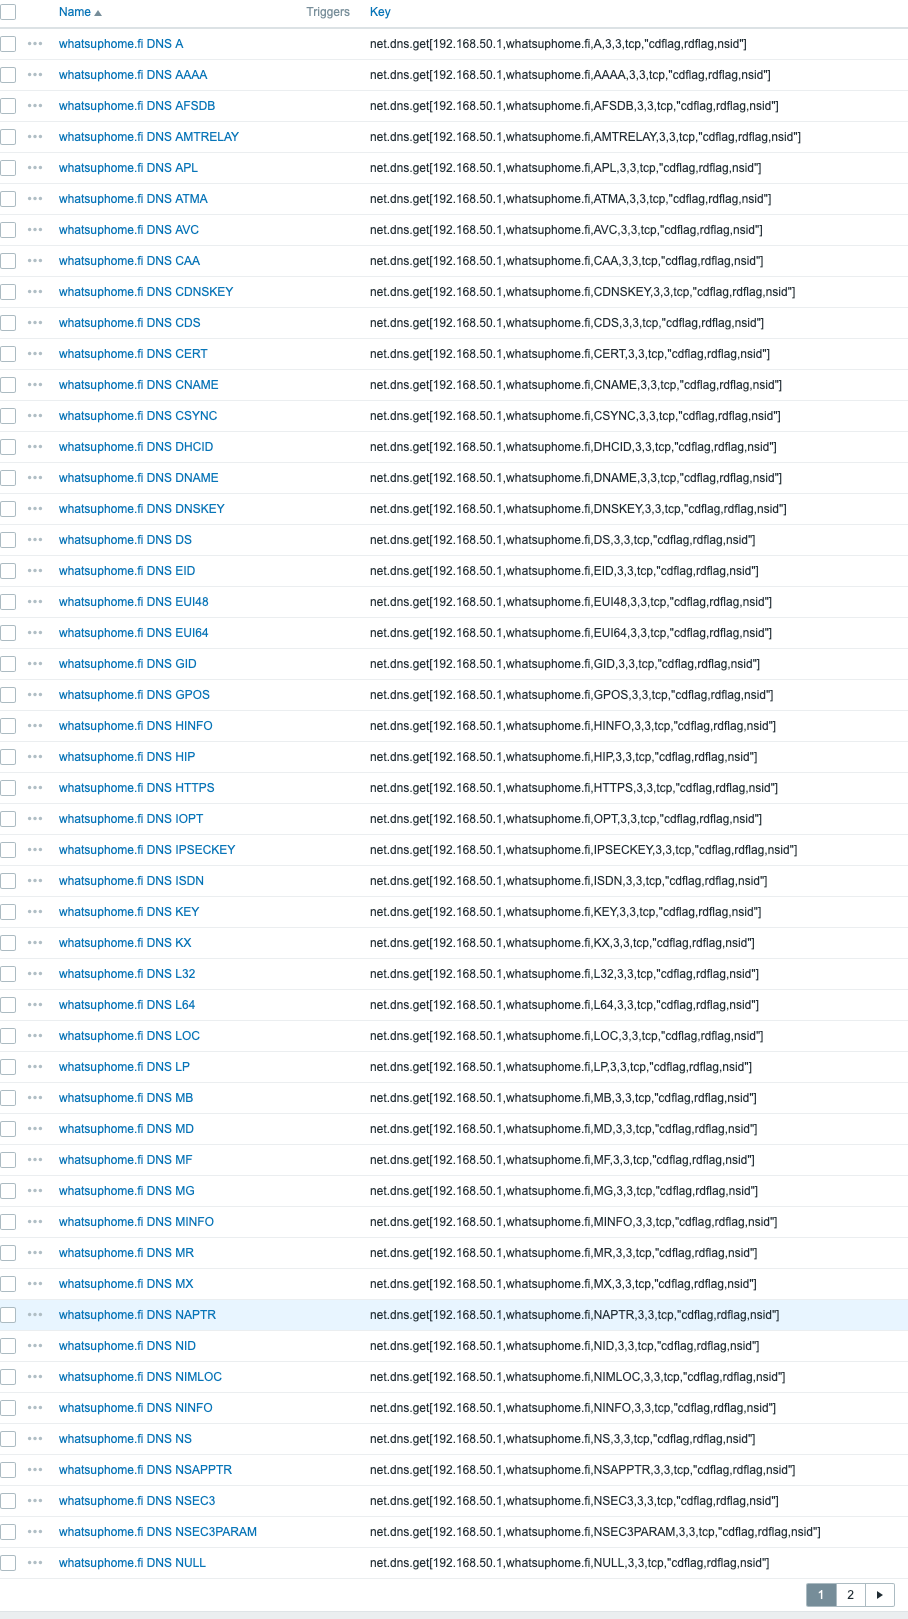
  3. In Blender, relabel the interesting objects to match with the names in Zabbix
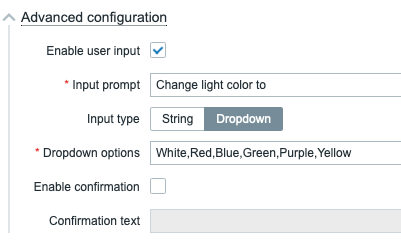
  4. Hook Zabbix and Blender together with Python and Blender Python API, so Zabbix can change the alerting object somehow for its properties — change material, change color, add a glow effect, make it fire/smoke/explode, whatever
  5. Ask Blender Python API to export the rendered results as PNG images and as X3D files
Home sweet home

Sweet Home 3D is a relatively easy-to-use home modeling application. It’s free, and already contains a generous bunch of furniture, and with a small sum, you’ll get access to many, many more items.

After a few moments, I had my home modeled in Sweet Home 3D.


Next, I exported the file to .obj format, recognized by Blender.

Will it blend?

In Blender, I created a new scene, removed the meme-worthy default cube, and imported the Sweet Home 3D model to Blender.

Oh wow, it worked! Next, I needed to label the interesting items, such as our living room TV to match the names in Zabbix.

You modeled your home. Great! But does this Zabbix —> Blender integration work?

Yes, it does. Here is my first “let’s throw in some random objects into a Blender scene and try to manipulate it from Zabbix” attempt before any Sweet Home 3D business.

Fancy? No. Meaningful? Yes. There’s a lot going on in here.

  1. Through Python, Zabbix was able to modify a Blender scene and change some colors to red.
  2. Blender rendered the scene in its headless server mode (without GUI), and saved the resulting PNG still frame.
  3. The script ran by Zabbix did copy the image to be available for Zabbix UI (in my case, I created /assets/3d/ directory which contains everything relevant to this experiment).
  4. Zabbix URL widget is showing the image.

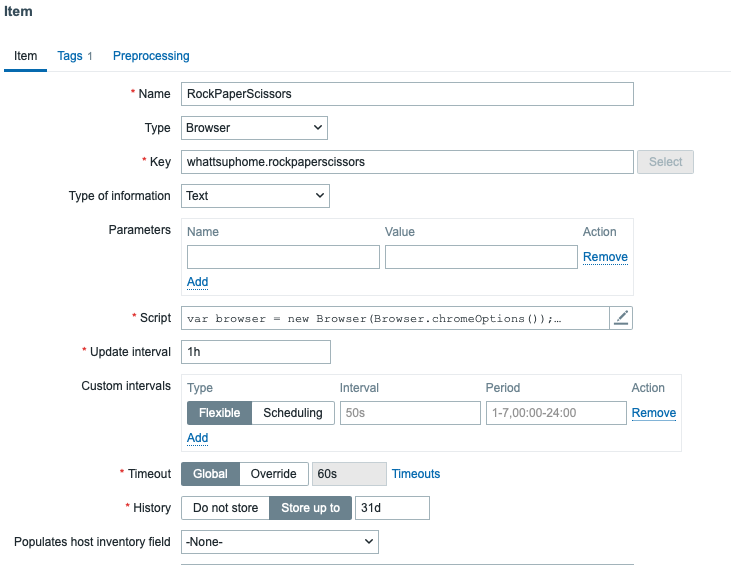
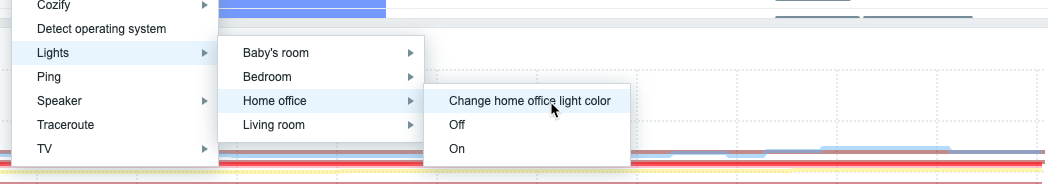
My Zabbix is now consulting Blender for every severity >=Average trigger, and I can also run the rendering manually any time I want.

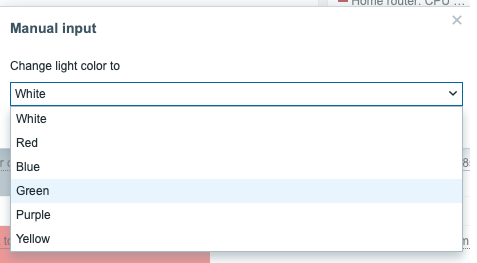
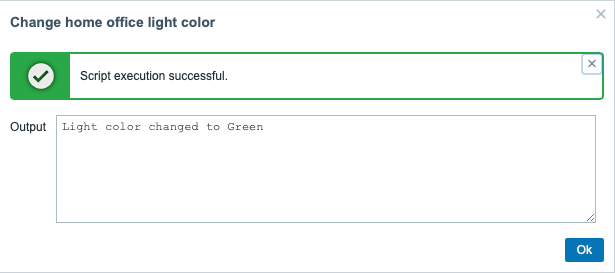
First, here’s the manual refresh.


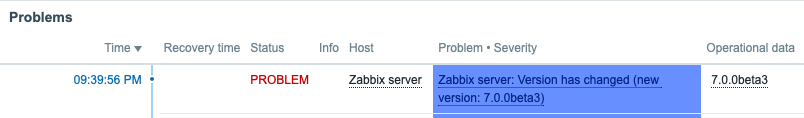
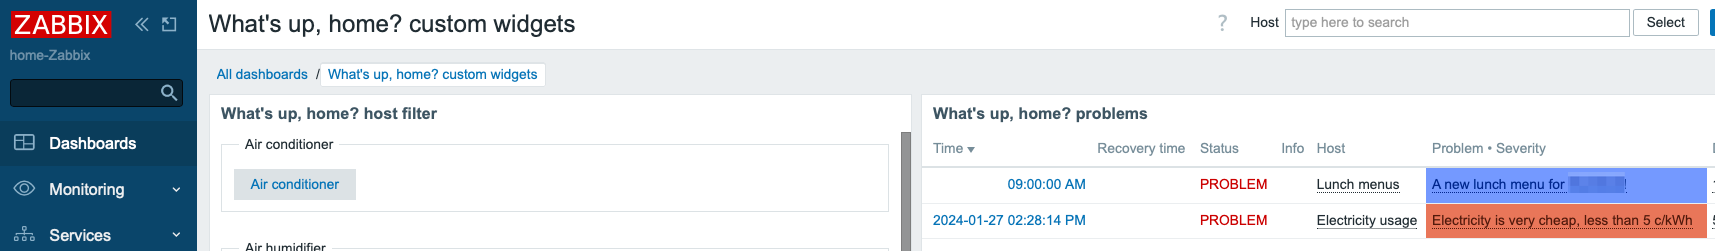
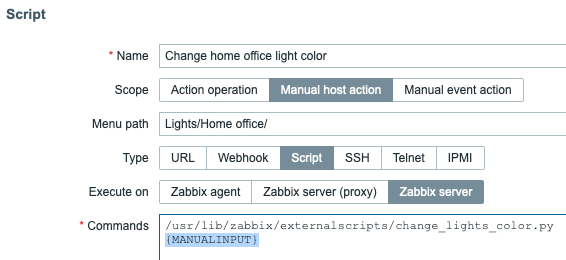
Next, here is the trigger:


Static image result

Here is a static PNG image rendering result by Blender Eevee rendering engine. Like gaming engines, Eevee cuts some corners when it comes to accuracy, but with a powerful GPU it can do wonders in real-time or at least in near-real-time.

The “I am not a 3D artist” part will hit you now hard. Cover your eyes, this will hurt. Here’s the Eevee rendering result.

 That green color? No, our home is not like that. I just tried to make this thing look more futuristic, perhaps Matrix-like… but now it looks like… well… like I would have used a 3D program. The red Rudolph the Rednose Reindeer nose-like thing? I imagined it would be a neatly glowing red sphere along with the TV glowing, indicating an alert with our TV. Fail for the visual part, but at least the alert logic works! And don’t ask why the TV looks so strange.

But you get the point. Imagine if a warehouse/factory/whatever monitoring center would see something like this in their alerts. No more cryptic “Power socket S1F1A255DU not working” alerts, instead, the alert would pinpoint the alert in a visual way.

There was supposed to be an earth-shattering VR! Where’s the VR?

Mark Zuckerberg, be very afraid with your Metaverse, as Zabbixverse will rule the world. Among many other formats, Blender can export its scenes to X3D format. It’s one of the virtual world formats our web browsers do support, and dead simple to embed inside Zabbix/Grafana. Blender would support WebGL, too, but getting X3D to run only needed the use of <x3d> tag, so for my experiment, it was super easy.

The video looks crappy because I have not done any texture/light work yet, but the concept works! In the video, it is me controlling the movement.

In my understanding, X3D/WebGL supports VR headsets, too, so in theory you could be observing the status of whatever physical facility you monitor through your VR headset.

Of course, this works in Grafana, too.

How much does this cost to implement?

It’s free! I mean, Zabbix is free, Python is free and Blender is free, and open source. If you have some 3D blueprints of your facility in a format Blender can support — it supports plenty — you’re all set! Have an engineer or two or ten for doing the 3D scene labeling work, and pretty soon you will see you are doing your monitoring in 3D world.

What are the limitations?

The new/resolved alerts are not updated to the scene in real-time. For PNG files that does not matter much, as those are static and Zabbix can update those as often as needed, but for the interactive X3D files it’s a shame that for now the scene will only be updated whenever you refresh the page, or Zabbix does it for you. I need to learn if I can update X3D properties in real-time instead of a forced page load.

Coming up next week: monitoring Philips OneBlade

Next week I will show you how I monitor a Philips OneBlade shaver for its estimated runtime left. The device does not have any IoT functionality, so how do I monitor it? Tune in to this blog next week at the same Zabbix time.

I have been working at Forcepoint since 2014 and never get bored of inventing new ways to visualize data.

The post What’s Up, Home? Welcome to my Zabbixverse appeared first on Zabbix Blog.

What’s Up, Home? – Observe!

Post Syndicated from Janne Pikkarainen original https://blog.zabbix.com/whats-up-home-observe/21201/

By day, I monitor a global cyber security company for a living. By night, I monitor my home with Zabbix and Grafana. In this weekly blog series, I’m sharing my weird experiments and new ideas on how to utilize monitoring.

On Easter, we were not at home but doing Easter stuff, that week I did not implement any major functionality to my home monitoring environment. But while I’m brewing new weird features, here are some bits and pieces of what I have learned about my home, and not shown here earlier.

I’m watching you, TV

We have one of those ‘smart’ TVs, just like about every recent TV happens to be. The one we have is a Samsung 2021 model. And, of course, I monitor it.

On the last two-day graph above, value 1.0 means that our TV is awake and responding to ICMP ping. During the annotated short spikes the TV does not have its screen on, but it is just silently awake and doing something with the network — may be checking for firmware updates or sending telemetry?

Anyway, it is definitely doing that many times per day. I will need to snoop more closely on what the heck it is doing.

A longer period of responding to ping indicates that we are actually watching the TV (or me playing PS5).

Garage, or not to garage?

That time, when I was writing this blog post, the spring has finally come, so we were doing some spring cleaning at home; no need for heavy winter jackets to be in our hallway closet anymore and so forth. For some items, my wife wondered what would be the humidity percentage in our garage.

Zabbix & Grafana to the rescue! The graph below shows the humidity levels of our living room and garage.

So, our garage definitely is a more humid place, and for now, some humidity-sensitive items were left inside our house instead of the garage.

Don’t get lost, get a map

This part is very much of a work in progress and is lacking the majority of the IoT devices we have, but I am also building a visual network map of my home environment. The map below uses the traditional Zabbix network map, but if I manage to pull a rabbit or two out of my hat, during the upcoming weeks you will see something Completely Else. Stay tuned!

Next week I will show you a definitely very weird target to monitor if I just manage to figure out how to do it.

There’s an app for that

But what if I am not at home? Sure, for any serious situations like a freezer temperature rapidly rising my Zabbix will e-mail me, but what if I just want to browse around? Using the web interface via iPhone could be done but is definitely not very convenient, so I am using ZBX Viewer app for iPhone instead. It’s handy, it’s free and it works.

I have been working at Forcepoint since 2014 and never get bored of staying up to date about the status of my house. — Janne Pikkarainen

* Please note that this blog post was originally written in April and some events mentioned do not correspond to the actual date at the time of publication.

The post What’s Up, Home? – Observe! appeared first on Zabbix Blog.

What’s Up, Home? – Don’t Forget the Facial Cream

Post Syndicated from Janne Pikkarainen original https://blog.zabbix.com/whats-up-home-dont-forget-the-facial-cream/21063/

Can you monitor the regular use of facial cream with Zabbix? Of course, you can! Here’s how. This same method could be very useful for monitoring if the elderly remember to take their meds or so.

What the heck?

A little background story. My forehead has a tendency for dry skin, so I should be using facial cream daily. Of course, as a man, I can guarantee you that 100% of the days I remember to use the cream, I apply it, so in practice, this means about 40-50% hit ratio.

As lately I have been adding more monitored targets to my home Zabbix, one night my wife probably thought she was being snarky or funny when she said “One monitor I could happily receive data about would be how often you remember to use your facial cream.

A monitoring nerd does not take such ideas lightly.

Howdy door sensor, would you like to do some work?

I found a spare magnetic door sensor and a handy box where to store the cream.

You can see where this is going. This totally beautiful prototype of my Facial Cream Smart Storage Box is now deployed to test. If I open or close the box, the door sensor status changes, thus the facial cream mercy countdown timer resets.

How does it work? And does it really work?

Cozify smart IoT hub is keeping an eye on the magnetic door sensor’s last status change. And look, that awesome brown tape does not bother the magnets at all, Cozify reported the status as changed.

Now that I got the Cozify part working, my Zabbix can then receive the last change time as in Unix time.

On my Grafana, there’s now this absolutely gorgeous new panel, converting the Unix time to the “How long ago the last event happened?” indicator.

So the dashboard part is now working. But that is not all we need to do.

Alerting and escalation

Dashboards and monitoring are not useful at all if proper alerts are not being sent out. I now have this new alert trigger action rule in place.

In other words, if I forget to apply the facial cream, I have a one-hour time window to apply it, or otherwise, the alert gets escalated to my wife.

Will this method work? Is my prototype box reliable? I will tell you next time.

I have been working at Forcepoint since 2014 and never get tired of finding out new areas to monitor. — Janne Pikkarainen

The post What’s Up, Home? – Don’t Forget the Facial Cream appeared first on Zabbix Blog.

What’s Up, Home? – Use the Zabbix, Luke

Post Syndicated from Janne Pikkarainen original https://blog.zabbix.com/whats-up-home-use-the-zabbix-luke/20953/

Welcome to my weekly blog about how I monitor my home with Zabbix. Like Batman, I have a casual day job as a monitoring tech lead, and by night I tinker around with my home Zabbix. (Except that Batman does not do monitoring, or who knows.)

Anyone using Zabbix knows how it can gather data from just about anywhere, and it can send its alerts to just about anything — pager systems like PagerDuty or OpsGenie, ticketing systems like Jira, e-mail, SMS, etc. Integrating with those takes minutes, is officially supported, very well documented, and would not make sense at home. But, what if at home I would like to show any possible alerts in a completely different way?

Zabbix, meet Star Wars

So, if I want to integrate my Zabbix with a screen saver, how would that work? And how long would that take? Is it even possible?

My friend, in the case of the good old xscreensaver you have many, many options. For its text-based screen saver modules, you can feed it a text file, or an URL from where it downloads the text to show on the screen. Making xscreensaver contents dynamic is easy.

For Zabbix, to make it send its alerts as text, you have many options. At least:

  1. Configure an action that runs whatever command to save the alert to a text file; even echo would do
  2. Let your Other System fetch the alerts over Zabbix API
  3. Let your Other System fetch the alerts directly from the Zabbix database
  4. Send out your alerts as e-mails and let your Other System parse those e-mails
  5. Configure a new custom media type to do something
  6. Use Zabbix real-time export functionality
Internals of my xscreensaver showcase

For this exercise, I decided to use the sixth option: Zabbix real-time export functionality.

What’s that, you ask?

It makes Zabbix save history, trends and/or triggers to JSON files, which any 3rd party program can then parse and utilize. Enabling it happens in practice by commenting out three lines in the Zabbix server config file, altering the path where you want the JSON files to be created, deciding the maximum size of the created files, and what kind of events you want to export. Restart the Zabbix server process, done.

My Zabbix is now running on Raspberry Pi 4. Then, I have a FreeBSD laptop for anything nerdy I want to do, and the FreeBSD laptop has xscreensaver for this demonstration.

So, my FreeBSD laptop does rsync the JSON files from Zabbix server every minute, extracts the event host name and trigger name using jq, and saves the output to text file. Surround that with header and footer text files, and you are done.

Now every time I don’t touch my FreeBSD laptop in a while, it turns on its screensaver and shows me the recent Zabbix alerts. Zabbix, meet Star Wars.

For now, the alert format shown on scroller is not perfect, but it works and took three or four lines of bash in total to accomplish. That’s easy, and in total took maybe 15 minutes to implement to its current stage.

Other news about my home monitoring project
  • My facial cream usage monitoring is going great! I have not missed applying my facial cream even once — I mean, I have received alerts from Zabbix, but each and every time I have then proceeded to apply the cream and my wife has received zero alerts so far. Good boy, me! (Read more about this project next week!)
  • As the trains stopping at our station are not always reliable (they can be either very late or canceled), I now have a live map showing the real-time status of the trains we are interested in. This part actually does not have anything to do with Zabbix at the moment, it’s Grafana and its GraphQL plugin querying data from an official train traffic open data system.
  • Zabbix 6.0 gained a new official weather template, so I now have a local weather dashboard as well provided by Zabbix.
  • I made a “home status shown as emojis” dashboard to make monitoring fun(?) and interesting(?) for the whole family — now our home status can be observed from our living room TV easily.

Some screenshots are below:

I have been working at Forcepoint since 2014 and never get bored of showing the alerts in new ways. — Janne Pikkarainen

The post What’s Up, Home? – Use the Zabbix, Luke appeared first on Zabbix Blog.

What’s Up, Home? – Zabbix the Weatherman

Post Syndicated from Janne Pikkarainen original https://blog.zabbix.com/whats-up-home-zabbix-the-weatherman/20897/

This week, I advanced my project on multiple fronts, so welcome to this little smorgasbord of different topics. In my future posts, I will go deeper into each topic as my project goes forward.

Zabbix the weatherman

Let me begin with a monitoring blooper.

As Zabbix has very well-working forecast/prediction functions for your usual IT capacity trending, I tried what happens if I let it predict the outdoor temperature based on recent temperatures. On my first try, this did not go as I planned.

You see, currently, here in Finland the temperatures change a lot during a 24 hours period: from nightly -10C or below temperatures to maybe +5C to +10C during the day. As I asked Zabbix to predict the weather based only on one hour of data one day ago, this did not go as planned.

OK, clearly the one hour worth of data was too little. What if ask Zabbix to base its forecast on one week worth of data?

The prediction slightly improves — at least it won’t predict a nuclear winter anymore — but only slightly. Zabbix in its little mind has no idea that the weather could get warmer due to the springtime. Or, in case Zabbix was right, I’ll let you know in a week.

Average data for Joe Average

As my monitoring setup collects more data, one thing I can get out of it will be averages. What’s the average temperature? What’s the average for this and that?

Above shows the average data for the last 24 hours, and on my Grafana dashboard the values change dynamically based on the time period I choose on it.

Who wouldn’t need home SLA reports?

Everybody knows how The Suits love their reports. I have this mental image where I think during their mornings they are like

[x] coffee
[x] warm bread
[x] orange juice
[x] classical music
[x] latest reports

And oh dear, their morning is ruined if the [x] is missing from the last entry. Poor Suits.

Anyway, as the recent Zabbix 6.0 brought us revamped Business Services Monitoring, why not use it for home monitoring, too? This part includes very much work in progress, but I will show you the current results.

When I’m finished, each room will be configured as its own Business Service. For now, I only have entered the room names and some other stuff. There is only one room with some actual content, for now, and it’s our bedroom. What happens if I click on it?

I will get to see if the lights and temperature are OK, both from a technical standpoint and for their values. In case the status would not be OK, the root cause column would show me the reason why everything is not OK — though I would not need to click my way this far, the data would be shown on the previous page already.

As for SLAs (Service Level Agreement, for example, if you promise that your service will be available 99.9% of the time, it better be or your customer will be a sad panda and yell at you), those are also a work in progress. Zabbix can be let to generate daily/weekly/whatever SLA reports for any of the configured Business Services. I have yet to build them, but I have one for my home router already.

Come on, it’s sunny, let’s go out, Zabbix!

True story: this morning my wife asked that could I add pollen monitoring to Zabbix. My non-technical wife is getting excited about home monitoring, too! (I think she’s only pretending. Still AWESOME!)
I still need to add pollen monitoring — the data is available as open data — but I initialized The Great Outdoors Monitoring in two other areas.

Where’s my train?

Just before creating this post, I proved to myself that I can show live train data on Grafana. I sure got a screenful, as I have not played around with GraphQL too much, and for now, I got way more trains than I planned to get, and the data contains extra fields I need to filter out with Grafana’s Organise Fields. Still, connection established! Wooooo!

What’s for lunch?

Only added one lunch restaurant for now, but in theory, I will receive an alert whenever the restaurant posts its new weekly lunch menu. Zabbix is configured to be a good netizen though and it will only try to fetch the menu every one hour on Monday morning, no point to poll them all week, so let’s see how this will work.

That’s all for now. See you next week!

I have been working at Forcepoint since 2014 and I am a walking monitoring unit. — Janne Pikkarainen

* Please note, that this blog post was originally written a few months ago, in early Spring, and the temperature records do not correspond to the actual weather at the time of publication.

The post What’s Up, Home? – Zabbix the Weatherman appeared first on Zabbix Blog.