Tag Archives: social

Improving Customer Satisfaction and Experience with Zabbix

Post Syndicated from Michael Kammer original https://blog.zabbix.com/improving-customer-satisfaction-and-experience-with-zabbix/31692/

No matter what business you’re in, there is one universal truth – your success or failure depends on customer satisfaction and trust. And when your IT systems fail, it’s your customers who pay the price. Being unable to place an order due to unexpected downtime (which can cost a large organization as much as $9,000 per minute) or having their credit card data compromised in a preventable security breach (which costs the average organization nearly $5 million) will force even your most loyal customers to go somewhere else.

Monitoring with Zabbix doesn’t just keep your infrastructure safe, it keeps your reputation safe and makes sure that your customers continue to be your customers. It does this by guaranteeing the performance, reliability, and security of your digital services – while also supporting better customer service and continuous improvement. Keep reading to see how it’s possible.

Say goodbye to downtime

Your customers are looking to meet their needs quickly and effectively. Unexpected service disruptions cause them to feel neglected and force them to look elsewhere for solutions.
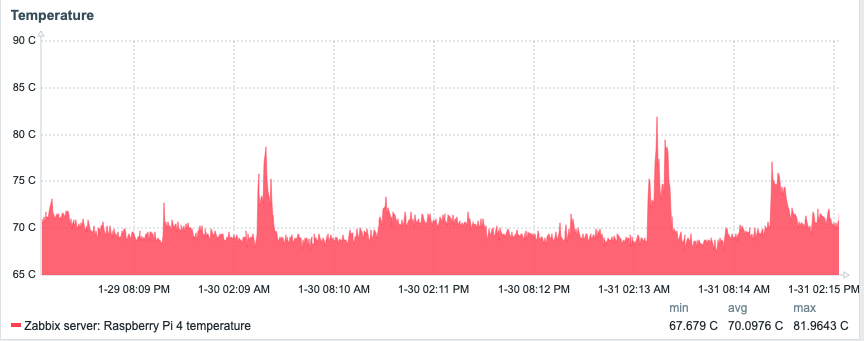
Monitoring your infrastructure with Zabbix can effectively eliminate downtime through proactive issue detection, which locates anomalies and performance issues like high CPU usage, packet loss, and latency in real time – before they have a chance to make life harder for customers.

If an issue does occur, Zabbix’s predictive alerting capabilities let your tech teams know about anything that could potentially impact an application or service, which lets them meet SLAs and provide a better, more reliable customer experience with fewer service disruptions, which in turns leads to higher levels of trust and satisfaction.

Outperform your competitors

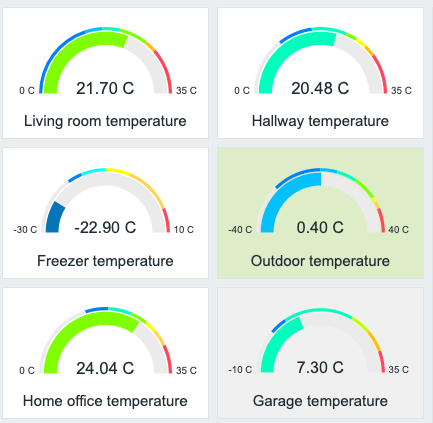
No matter how good your products or services happen to be, you still need to provide smooth and fast online user experience if you want repeat use and positive reviews. Monitoring with Zabbix optimizes network traffic by helping you to identify bandwidth bottlenecks or misconfigured devices with a single glance at a dashboard, allowing better traffic management and a better online experience for customers.

It also improves response times, which allows you to be confident that your applications and services remain responsive. This is especially important for real-time services like video conferencing, e-commerce, or customer support.

Turn good customer service into outstanding customer service

What turns a casual, one-time user into a repeat customer? In most cases, it all comes down to making that user feel seen, informed, and supported. Zabbix helps you maintain consistent system performance, and nothing builds trust like stability.

With a bit of configuration and the help of IT service management tools like ServiceNow, Zabbix can provide clear, easy-to-access logs and metrics that help your customer service reps better understand your customers and the process of serving them, including:

• Customer satisfaction (CSAT)
• Preferred communication channel
• Average ticket count
• Average response time
• Average ticket resolution time
• Ticket resolution rate
• Ticket backlog
• Interactions per ticket

With this information, your team will be able to communicate proactively when issues happen, giving customers accurate information about the issue and the expected resolution time.

Keep your customers safe from cyber threats

The consequences of a data breach are deep and far-reaching, and they include financial losses, reputational damage, legal troubles, regulatory fines, and a loss of customer trust. Despite a greater emphasis on data security, hackers are constantly finding new ways to gain access to valuable corporate data and credentials by combining next-generation AI technologies with long-established tools.

Monitoring with Zabbix gives IT and security teams the visibility and early warning systems they need to spot and react to potential threats. Zabbix continuously monitors systems, networks, and applications for predefined thresholds and anomalies, identifying possible network intrusions or misconfigurations and notifying the relevant security stakeholders.

On top of that, Zabbix can monitor any existing security tools your team runs, tracking antivirus software, firewalls, IDS/IPS tools, and endpoint protection solutions to make sure they are functioning properly and running the latest versions. It can also integrate with SIEM systems (like Splunk, ELK, or Wazuh) as well as custom scripts in order to provide extended security analytics.

Meet (and exceed) your SLAs

Service Level Agreements (SLAs) are a framework for managing the expectations of both customers and businesses. They define agreed-on standards of service, but tracking them is more than just a way to measure compliance – it’s a tool that you can use to improve your overall service delivery and operations.

With Zabbix, you can monitor any quantifiable metric that’s relevant to your SLAs, such as system uptime/downtime, response time, the availability of web services, databases, or network devices, transaction success and failure rates, and much more. In addition, Zabbix can use real-time data and built-in SLA calculation to automatically calculate current SLA compliance and send an alert if an SLA is at risk of being breached, by using triggers based on thresholds.

If you’d rather track the metrics on your own, no problem – by using Zabbix dashboards, you can visualize SLA compliance in real-time, with the dashboards showing availability percentages, event timelines, and breach summaries, while giving you easy-to-understand views of service health. The result is better products and services that are aligned with customer expectations.

Build a continuous improvement culture

When it’s time to roll out a new feature or upgrade, you naturally want to have ALL the necessary data at your fingertips. Monitoring usage patterns and performance metrics with Zabbix not only gives you advanced visualizations (forecasting, capacity planning insights, etc.) but can also highlight cases where data analysis led to tangible improvements.

Want more input from customers and users? Zabbix can make sure that the improvements to your product are community-driven by giving you the data you need to run regular user surveys and forums to gather product feedback. It can even help you publish a public roadmap with transparent prioritization based on community input.

Conclusion

Customer satisfaction is about a lot more than just good service – it’s also about consistency, reliability, and transparency. Zabbix empowers businesses to deliver all three by providing a comprehensive, proactive, and scalable monitoring solution.

That’s why customers in verticals as diverse as aerospace and education turn to Zabbix to keep them informed about what’s working – and what isn’t. By integrating Zabbix into your IT operations, you’re not just improving system performance – you’re actively investing in customer satisfaction and loyalty.

Find out more about what Zabbix can do for you and your customers by taking a look at real-world case studies from companies like yours.

The post Improving Customer Satisfaction and Experience with Zabbix appeared first on Zabbix Blog.

What’s Up, Home? – Zabbix Plays Rock-Paper-Scissors

Post Syndicated from Janne Pikkarainen original https://blog.zabbix.com/whats-up-home-zabbix-plays-rock-paper-scissors/29310/

Zabbix 7.0 is so fast that in a small environment such as What’s up, home? it gets bored. Very bored.

What does Zabbix do when it gets bored? It uses its new Selenium-based Browser item type and plays some Rock-Paper-Scissors against this blog site.

But how does that work?

The idea is simple. My website hosts a very simple PHP script which returns back a random value of “Rock”, “Paper” or “Scissors”. Likewise, my Zabbix Selenium test picks up a random word out of those. Then, the Selenium test checks both answers and gets back the result.

So, in all seriousness, this blog post demonstrates you how the new Browser item type can react to different responses.

Backend code

Here’s the PHP script in all its g(l)ory:

<html>

<head>

<title>Whatsuphome.fi :: rock-paper-scissors</title>

</head>

<body>

<p>

<?php

$choices = ["Rock", "Scissors", "Paper"];

$random_choice = $choices[array_rand($choices)];

echo $random_choice;

?>

</p>

</body>

</html>

Nothing to call home about in that script: array with three choices, pick a random choice, print the result, done.

Zabbix side

I created a new Browser type item like this:

… and here’s the script part I just hammered in, so there might or might not be bugs. I really did not test this very thoroughly.

var browser = new Browser(Browser.chromeOptions());

const moves = ["Rock", "Scissors", "Paper"];

const zabbixMove = moves[Math.floor(Math.random() * moves.length)];

try {

browser.navigate("https://whatsuphome.fi/rps.php");

var opponentMove = browser.findElement("xpath", "//p").getText();

if (zabbixMove === opponentMove) {

var winner = "Draw";

}

else if (

(zabbixMove === "Rock" && opponentMove === "Scissors") ||

(zabbixMove === "Scissors" && opponentMove === "Paper") ||

(zabbixMove === "Paper" && opponentMove === "Rock")

) {

var winner="Zabbix";

}

else {

var winner="Opponent";

}

}

finally {

return ("Winner is " + winner + ". Zabbix move was " + zabbixMove + " and opponent move was " + opponentMove);

}

That’s it! From now on my Zabbix will play the game once per hour, although for this blog post I did manually click the Execute now button a few times. Again, here’s the same screenshot that was also in the beginning of this blog post.

Happy gaming!

The post What’s Up, Home? – Zabbix Plays Rock-Paper-Scissors appeared first on Zabbix Blog.

Open Source: The Option for a Connected and Collaborative World

Post Syndicated from Luciano Alves original https://blog.zabbix.com/open-source-the-option-for-a-connected-and-collaborative-world/29237/

In my previous article, where we explored the TCO and ROI of open-source software, I raised topics that sparked substantive discussions, new research, and renewed insights. It is undeniable that we live in an era where collaboration and connectivity go beyond trends. They represent the foundation of current technology, especially in a world based on APIs.

In this context, open-source software stands out and positions itself as a logical and natural choice for companies and organizations (both public and private) that seek innovation, flexibility, security, and agility. Over the last two decades, the technology sector has validated this direction. Recently, the Open Source Program Office (OSPO) appeared in Gartner’s Hype Cycle for Emerging Technologies report, reinforcing its relevance and emerging as a maturing trend within 2 to 5 years.

Open Source in Gartner’s Hype Cycle

Gartner’s Hype Cycle for Emerging Technologies is a well-known tool for illustrating the phases of maturity, adoption, and impact of new technologies. In the current cycle, the Open Source Program Office (OSPO) appears as an emerging technology with the potential for corporate transformation in the coming years.

This highlights that it is not only a viable alternative to proprietary software, but an engine of innovation within organizations. The OSPO is, essentially, an internal structure in companies dedicated to promoting and managing the use of open-source software, ensuring compliance and governance.

With the strengthening of these structures, organizations not only maximize the benefits of open source but also foster a culture of continuous innovation and active collaboration with communities, whether through service contracts, participation in working groups, or even funding new functionalities.

A Natural Strategic Choice

Experience shows that open source is a strategic path for organizations aiming to thrive in an increasingly interconnected and competitive market. The transparency, flexibility, and scalability offered by such solutions surpass the limitations of proprietary solutions, facilitating a more adaptable and agile adoption.

Additionally, the collaborative approach of this model aligns with today’s reality, where knowledge sharing and co-creation are essential for technological development within organizations. Companies like Google, Microsoft, and Red Hat have already recognized this reality and invest in their own Open Source Program Offices. These initiatives not only underline the commitment to open innovation but also highlight tangible benefits in terms of efficiency, cost reduction, and speed in the development of innovations.

The Future is Open Source

The inclusion of OSPO in Gartner’s Hype Cycle indicates that companies that have not yet embarked on this journey need to reconsider their strategies. In an environment where constant adaptation and innovation are essential for growth and efficiency, open source has ceased to be optional and has become a necessity. As adoption expands across various sectors and applications, companies that build a solid framework for evaluating and maximizing the benefits of these technologies will be in a privileged position to lead their markets.

At Zabbix, we understand the importance of open source not just as a technological solution, but as a philosophy aimed at democratizing technology, fostering continuous innovation, and cultivating a culture of collaboration—a vision that OSPOs have been solidifying in companies across multiple industries. The discussion about the Total Cost of Ownership (TCO) and Return on Investment (ROI) in open-source solutions is just the starting point.

Tools like Zabbix prove that this is an effective strategy for monitoring and maintaining critical environments. Open source is, and will continue to be, the driving force behind the innovations that will transform the way companies sustain their businesses and interact with customers and users. The future is already open source, and the time to embrace this transformation is now.

The post Open Source: The Option for a Connected and Collaborative World appeared first on Zabbix Blog.

Първо пътуване с електронен билет в Пловдив

Post Syndicated from Йовко Ламбрев original https://yovko.net/e-tickets-plovdiv/

Първата четвърт на 21-ви век почти отминава, но… вече и в Пловдив става възможно човек да си купи електронен билет за градския транспорт и да го използва. Проверено и потвърдено! Е, засега само по един маршрут – автобус 25.

Скрийншоти от приложението MPass с електронен билет за пътуване в Пловдив

Приложението MPass е семпло, изглежда доста добре и е лесно за ползване, което е важно. След регистрацията си купих билет за еднократно пътуване срещу 1 лев, който платих с дебитна карта (Revolut) без никакви проблеми. Изненадата беше, че е валиден до края на денонощието (по-точно в рамките на работното време на градския транспорт), но в интерес на истината това е разписано зад бутон Детайли на всеки билет. Там пише също и че трябва да е купен поне минута, преди да се качим на автобуса и да се опитаме да го валидираме. Та не си купувайте билети за следващия ден – няма да можете да ги ползвате.

На същото място пише, че валидирането на билета става като поставите смартфона си, с QR-кода на билета на разстояние около една педя (10-15cm) под валидатора. Това е полезна информация, защото QR-кода очевидно следва да се сканира оптично, а на самия валидатор не личи къде му е сензора. Логично е да отдолу, но ако телефонът е поставен твърде близо, разчитането на QR-кода няма да се получи. Аз успях от втори опит, виждайки светлината на скенера върху дисплея на телефона си, която подсказа колко да го отдалеча и как да го поставя. Не бях прочел това предварително като купувах билета, а шофьорът, разбира се, не знаеше – само промърмори, че не разбирал от електронни неща. Всъщност не е и негова работа, но в първоначалния период на въвеждане на нова система е добре да има някоя табелка, стрелкичка, пиктограма… за всички ще е по-лесно. У нас продължава да е в сила методологията „Оправяй се!“.

След валидиране на устройството в автобуса билетът се маркира с червена лентичка с надпис "За контрол".

И още една особеност. С един акаунт човек може да се логне на няколко устройства (вкл. в браузър) – аз си купих билета, докато бях в офиса на компютъра си, а не през мобилното приложение. Билетът обаче остава в браузъра/устройството, с което е купен, а аз възнамерявах да го ползвам от смартфона си (в автобуса). Няма драма, билетът може да се премести (само веднъж!) – с допълнителна стъпка, която изисква човек да има достъп до електронната си поща, където да получи и използва един код. Иначе и това е лесно и бързо.

С две думи, нещата засега изглеждат доста обещаващо. Остава всичко това да стане възможно и във всички останали линии и автобуси от пловдивския градски транспорт. И разбира се, този град да се сдобие с обществен транспорт, на който да може да се разчита.

Първо пътуване с електронен билет в Пловдив

Post Syndicated from Йовко Ламбрев original https://yovko.net/e-tickets-plovdiv/

Първо пътуване с електронен билет в Пловдив

Първата четвърт на 21-ви век почти отминава, но… вече и в Пловдив става възможно човек да си купи електронен билет за градския транспорт и да го използва. Проверено и потвърдено! Е, засега само по един маршрут – автобус 25.

Приложението MPass е семпло, изглежда доста добре и е лесно за ползване, което е важно. След регистрацията си купих билет за еднократно пътуване срещу 1 лев, който платих с дебитна карта (Revolut) без никакви проблеми. Изненадата беше, че е валиден до края на денонощието (по-точно в рамките на работното време на градския транспорт), но в интерес на истината това е разписано зад бутон Детайли на всеки билет. Там пише също и че трябва да е купен поне минута, преди да се качим на автобуса и да се опитаме да го валидираме. Та не си купувайте билети oт днес за следващия ден – ще „изветреят“ преди да ги използвате.

На същото място пише, че валидирането на билета става като поставите смартфона си с QR-кода на билета на разстояние 10-15cm (около една педя) под валидатора. Това е полезно знание, защото QR-кода очевидно трябва да се сканира оптично, а на самия валидатор не личи къде му е сензора. Логично е да отдолу, но ако телефонът е поставен твърде близо, разчитането на QR-кода няма да се получи. Аз успях от втори опит, виждайки светлината на скенера върху дисплея на телефона си, която подсказа колко да го отдалеча и как да го поставя. Не бях прочел това предварително като купувах билета, а шофьорът, разбира се, не знаеше – само промърмори, че не разбирал от електронни неща. Всъщност не е и негова работа, но в първоначалния период на въвеждане на нова система е добре да има някоя табелка, стрелкичка, пиктограма… за всички ще е по-лесно. Но у нас продължава да е в сила методологията „Оправяй се!“.

След валидиране на устройството в автобуса, билетът се маркира с червена лентичка с надпис "За контрол".

И още една особеност. С един акаунт човек може да се логне на няколко устройства (вкл. в браузър) – аз си купих билета, докато бях в офиса на компютъра си, а не през мобилното приложение. Билетът обаче остава в браузъра/устройството, с което е купен, а аз възнамерявах да го ползвам от смартфона си (в автобуса). Няма драма, билетът може да се премести (макар и само веднъж!) – с допълнителна стъпка, която изисква човек да има достъп до електронната си поща, където да получи един код. Иначе и това е лесно и бързо.

С две думи, нещата засега изглеждат доста обещаващо. Остава всичко това да стане възможно и в останалите линии и автобуси от пловдивския градски транспорт. Да се появят и по-удобни варианти на билети. И разбира се, този град да се сдобие с обществен транспорт, на който да може да се разчита.

P. S. Възможно е и да не се ползва приложението, а да се плати директно с карта (през валидатора), но понеже не съм редовен ползвател на градския транспорт, а и автобус 25 не е сред тези, които ползвам обичайно… не съм тествал тази опция.

За данните на градския транспорт на Пловдив в Google Maps

Post Syndicated from Йовко Ламбрев original https://yovko.net/plovdiv-google-maps/

За данните на градския транспорт на Пловдив в Google Maps

От лятото на 2019 г. в блога ми стои чернова, която така и не публикувах. Идеята ми зад въпросната статия беше да разкажа как се появи разписанието на градския транспорт на Пловдив в Google Maps. Но това сега няма никакво значение, защото от тази седмица там вече няма такива данни.

Съвсем кратка предистория: Преди вече пет години трима приятели предложихме на Община Пловдив да свършим необходимото, за да се появят маршрутите и разписанията на градския транспорт в Google Maps. Напълно безвъзмездно. Речено – сторено. Общината не трябваше да прави нищо друго, освен от време на време да ни уведомява за промените в маршрутите и разписанията, за да поддържаме нещата актуални и коректни. Това обаче не се случи. В началото на 2022 г. се уморихме да се борим с вятърни мелници и преустановихме поддръжката, като маркирахме, че данните не са актуални и няма да се обновяват.

Преди няколко дни човек от екипа на Google Transit (така се нарича услугата, която добавя информация за обществения транспорт в Maps) се свърза с мен да провери защо вече две години не сме актуализирали данните за Пловдив. Отговорих му, че за съжаление, няма как да го направим, тъй като разчитахме да получаваме тези данни от Община Пловдив, но се оказва, че всеки път трябва да им се молим за данните или да си ги събираме, както намерим за добре. Което определено не е начинът, по който трябва да се прави това. Нито може да гарантира нужната прецизност. Колегата от Google сподели, че разбира ситуацията, и ще преценят как да постъпят. След още два дни ми писа, че са взели решение да прекратят услугата за Пловдив.

Днес в Общинския съвет е имало дискусия по темата, провокирана от публикация в „Капитал“. Журналистите от медията писаха и преди година по темата и дори заедно прогнозирахме това развитие, но тишината откъм Община Пловдив си остана все така оглушителна.

Пиша това, защото сегашната ресорна кметица, г-жа Савина Петкова, е казала пред общинските съветници няколко изречения, които от стремеж към акуратност не мога да отмина без коментар. Позовавам се на публикации в регионалната преса, тъй като не съм присъствал лично.

Започвам с нейното твърдение, че градският транспорт на Пловдив има далеч по-важни проблеми, с което няма как да не се съглася. Аз самият съм се питал какви данни се опитваме да събираме и предоставяме на хората, когато ситуацията с обществения транспорт в града е толкова безобразна.

Вярно е и че общината никога не е имала договор с Google Maps. Просто защото няма как да има договор. Google не подписва такива. Платформата предоставя напълно безплатно възможността да визуализира данни за обществен или частен транспорт, ако те са предоставени от достоверен източник и в изисквания от тях формат. Иначе казано, Община Пловдив може сама да обобщава такива данни и да ги изпраща към Google. Това могат да правят и самите транспортни фирми. И има няколко в България, чиито разписания са в Google Maps, включително и БДЖ.

Проблемите тук са два. Първо, Google да се довери, че източникът на данни е достоверен. И второ, тези данни да бъдат в изисквания от тях формат – което не е задача с грандиозна трудност, но не е и тривиално начинание. През 2019 г. се наложи част от информацията да събираме от сканирани PDF-и, MS Word документи с вградени в тях таблици, които всъщност бяха растерни картинки. А данните за маршрутите, по които се движат автобусите, рисувахме точка по точка на ръка, защото „Организация и контрол по транспорта“ (ОКТ) разполагаше с GPS координати на спирките, но не и на пътя, по който автобусите се движат между тези спирки. Имаше още купчина технически засади, за които не подозирахме и в най-песимистичните си очаквания. Но някак ги разрешихме.

Иначе по темата защо Google все пак реши да публикува данни за Пловдив, това стана възможно, след като не общината, а ние, доброволците, се ангажирахме да съберем всичко и да го подредим. За да направим нещо полезно за града и гостите му. И защото ни е грижа за средата, в която живеем.

Община Пловдив потвърди с официално писмо пред Google, че ние ще вършим тази работа с подреждането и преобразуването на данните от нейно име.

За последвалите две години и половина, през които поддържахме данните живи, само веднъж получихме актуализация от общината. След двукратни мои настоявания пред тогавашния ресорен кмет Тодор Чонов, на които и до днес нямам отговор, в крайна сметка просто загубих търпение, обадих се на колегите в ОКТ по телефона и си изпросих нови данни. Те, между другото, винаги са откликвали, но така и никой не им възложи да изпращат промените, когато има такива, или примерно веднъж на три или дори шест месеца. Това щеше да е повече от достатъчно.

Не отговаря на истината обаче твърдението на г-жа Петкова, че данните, които са показвани досега от Google, са идвали от системата на „Индра“. Те не бяха особено полезни, защото в тях имаше грешки и ги получихме едва след като вече се бяхме преборили с дигитализацията на множество „хартиени данни“, които впрочем също бяха само частично полезни. Единственото улеснение на двата комплекта данни беше, че можехме да ги съпоставим и така да проследим къде се разминават, което помогна да отстраним някакво количество грешки.

Би било чудесно, ако системата на „Индра“ изобщо работеше и имаше как да интегрираме данните от нея за информация в реално време с Google. Това беше в плановете ни за бъдещето, когато градският транспорт на Пловдив евентуално щеше да има адекватна информационна система.

А приложението, което г-жа Петкова съжалява, че не е достатъчно популярно, е ето това. Моля, проследете линка и ще си отговорите сами защо „не е достатъчно популярно“. То работи (слава богу, нещо работи!), но е кошмарно остаряло и е адски неудобно за ползване, особено в движение и от мобилен телефон. Честно, г-жо Петкова, Вие колко пъти сте го ползвала?

И в заключение: искрено се надявам, че колегите от „Тикси“, които правят поредната за Пловдив нова система за управление на градския транспорт, ще имат добрата воля да предоставят отворено API или друг публично достъпен и документиран начин за интеграция с външни системи. Това ще позволи не само нова и по-лесна интеграция с Google Maps (защо не и в реално време този път?), но и създаването на други мобилни приложения и дигитални удобства за Пловдив. Защото ние още продължаваме да живеем в този град и да ни пука за него.

What’s Up, Home? – Monitor your new Selenium

Post Syndicated from Janne Pikkarainen original https://blog.zabbix.com/whats-up-home-monitor-your-new-selenium/28394/

As Zabbix got the new fantastic Selenium-based synthetic web tests, you will now have a new component to monitor. How do you monitor Selenium? With Zabbix, of course! If you are impatient, feel free to download my very bare-bones example template.

How to monitor Selenium?

That part is easy. Selenium server exposes you at <your-selenium-URL>/status, for example, http://my.selenium.server:4444/status — the data from there is coming back as JSON. Either grab it all via LLD, low-level discovery rules, or just cherry-pick a few values to follow. I cherry-picked a few values, as the status contains so many items I would not ever need. No, my Selenium is not going to test stuff through the Microsoft Edge browser, for example. Below is a short snippet from the status page output.

{
  "value": {
    "ready": true,
    "message": "Selenium Grid ready.",
    "nodes": [
      {
        "id": "e284925e-c341-41fc-8380-581ead4987b6",
        "uri": "http:\u002f\u002f0.0.0.0:4444",
        "maxSessions": 10,
        "osInfo": {
          "arch": "aarch64",
          "name": "Mac OS X",
          "version": "14.5"
        },
        "heartbeatPeriod": 60000,
        "availability": "UP",
        "version": "4.21.0 (revision 79ed462ef4)",
        "slots": [

First, confirm that your Selenium gives you back that status page. Done? Done. Next, move on and create a new Zabbix template.

Create a new Zabbix template

Go to Data Collection -> Templates -> Create template, give it a name, and assign it to any template groups you want.

Next, click on Macros tab, and enter there {$SELENIUM_URL} = your.selenium.server.address/status

Done. Now save your template and start adding items.

Add new items to the template

First, add a new HTTP agent type item for fetching the master data.

Next, just add any items you would like to pick from the long JSON output: as I’m only interested if Selenium is ready and what is the message it is returning, here is an example of how I grab the items. First, the one that checks if Selenium is ready (true/false).

… and get that with item pre-processing by using JSONPath and Boolean to decimal, so you get numeric values for graphs and so on.

The end result

After this, you are already monitoring your new Selenium to make sure that it is feeling well.

Now go and add your Selenium to monitoring, too! Add some triggers and visualize it for yourself by using some of the new fancy widgets we have in Zabbix 7.0!

This post was originally published on the author’s page.

The post What’s Up, Home? – Monitor your new Selenium appeared first on Zabbix Blog.

What’s Up, Home? – Welcome, Zabbix 7.0beta3

Post Syndicated from Janne Pikkarainen original https://blog.zabbix.com/whats-up-home-welcome-zabbix-7-0beta3/27988/

When Zabbix 7.0beta3 got released, I immediately updated my What’s up, home? environment to run it. As usual, the update process was seamless and fast, going through everything in about a minute with my Raspberry Pi 4.

As I updated Zabbix maybe ten minutes ago, these are very real-time impressions of the new version.

The new honeycomb widget

This new honeycomb widget might be useful! Here’s my first try with it, illustrating the reachability status of my IoT devices.

The text shown on widget combs can be modified freely as in the widget advanced config you can put there any Zabbix macro you want.

… or if you are such an eternal child that I am, just put there some static text:

The widget supports the new widget communication framework, so whatever item you click there can then be notified by other widgets on the dashboards, to make the experience more interactive.

Versatile host navigator widget

There’s another new widget in town, and its name is Host Navigator. With it, you can create a widget that groups your hosts with any criteria by their host groups, or tag values, and it looks like this.

If you then add new widgets or modify the existing ones on your dashboard to receive events from the Host Navigator widget, the changes on other widgets will be reflected in real time. You can also group the items by using multiple rules, for example, first by severity and then by host group, as shown below.

Nice for quick browsing!

Many more improvements

Underneath there’s more going on, but these two were the most visible additions. Other than that, new icons, Zabbix can now execute trigger actions much faster than before (apparently previously there was ~4 seconds lag, now it’s capable of acting in about 100 milliseconds if I read the ticket right), PDF reporting and streaming to external systems are not experimental anymore.

Another solid release marching towards the final version of Zabbix 7.0. In my home environment, these beta versions have been perfectly stable for me.

This post was originally published on the author’s page.

The post What’s Up, Home? – Welcome, Zabbix 7.0beta3 appeared first on Zabbix Blog.

What’s Up, Home? – I created my first Zabbix 7.0 custom widget

Post Syndicated from Janne Pikkarainen original https://blog.zabbix.com/whats-up-home-i-created-my-first-zabbix-7-0-custom-widget/27668/

As Zabbix 7.0 will come with the new widget framework, allowing communication between different widgets on dashboards, of course, I had to try it out.

Creating the module

The blog post title is a bit of a clickbait in the sense that this example is just 1:1 from the Zabbix Summit 2023 custom widgets workshop session. I made some very, very minor modifications to the code, mainly just changing my name and so on to manifest.json files. Since the code itself was obtained from the workshop session, I’m not going to publish it, but this much I will tease:

{
   "manifest_version": 2.0,
   "id": "whatsuphome",
   "type": "widget",
   "name": "What's up, home?",
   "namespace": "WMHostNav",
   "version": "1.0",
   "author": "Janne Pikkarainen",
   "description": "Custom host filtering widget for my home monitoring purposes",
   "widget": {
       "js_class": "WidgetWMHostNav",
       "out": [
           {
               "type": "_hostids"
           }
       ]
   },
   "assets": {
       "js": [
           "class.widget.js"
       ],
       "css": [
           "widget.css"
       ]
   }
}

Beginning with Zabbix 7.0, you can create your own custom widgets with JavaScript & PHP, and easily make other widgets on the dashboard to react to clicks you made on some other widget. The manifest.json file in the root of your custom module can describe what kind of info your widget will broadcast to other dashboard widgets, or what kind of info it will be receiving and obeying. Other than that, the custom widget only has a 2.6-kilobyte JavaScript file and a 587-byte CSS file. Modules are placed under /usr/share/zabbix/modules.

Next, just like in older versions of Zabbix, to activate your module you just go to Administration->Modules and click on Scan modules. And, there you have it.

Then, in your widgets, you can enable the dynamic reactions to other widgets or dashboard query changes like this:

Great! But what will it do?

I now have a new way of filtering the visible alerts. The custom widget on the left lists my host groups and hosts that belong to them.

Observe what happens when I click on the Electricity usage button:

I’m not limited to only selecting one host at a time, I can click on multiple hosts. Now see what happens if I also choose Lunch menus from my hosts.

The possibilities are endless

This example is just a simple read-only example. But, as Alexei mentioned to me after my speech at the Zabbix Summit 2023, this new framework could be used for controlling stuff, too. When I have time, I’ll try to run custom scripts and do other write operations through Zabbix API and this new framework.

Having a proper control panel for switching on/off the lights, music, and other things would be really cool, and now it certainly is possible. The future of the Zabbix user interface is really exciting thanks to new custom widgets.

This post was originally published on the author’s page.

The post What’s Up, Home? – I created my first Zabbix 7.0 custom widget appeared first on Zabbix Blog.

What’s Up, Home? – Time to start to use Zabbix 7.0 (at home)

Post Syndicated from Janne Pikkarainen original https://blog.zabbix.com/whats-up-home-time-to-start-to-use-zabbix-7-0-at-home/27610/

Since I will have some real use for Zabbix 7.0 when it comes out, I figured out that maybe it’s time to switch my What’s up, home? main instance to run on Zabbix 7.0beta1.

Actually, I first upgraded to Zabbix 7.0alpha9 early yesterday, but then 7.0beta1 got released later in the evening before I had time to play around with alpha9.

Anyway, now my Raspberry Pi 4 is running the latest and greatest version of Zabbix. A possible bumpy ride ahead, but I’m ready!

First impressions

The upgrade process itself went smoothly, just like with the stable releases. All my data, dashboards, triggers, and other rules are still in place.

Developers tell you that the new 7.0 will be much faster under the hood due to migrating to threads and asynchronous polling, among other changes. It ain’t just market speak, as this is my Zabbix instance before and after the upgrade. I don’t think that I need to annotate the graphs to show the point when I did the upgrade. The part that’s still hovering around 20% is my ICMP ping pollers. Other than that, in my humble home setup, everything is now pretty much idle.

Looking at my Raspberry Pi dashboard, not much has changed, and anyway, my Raspberry Pi is running many other things than Zabbix, too.

Here’s CPU:

Memory:

Disk I/O utilization:

Temperature:

From single item view to gauges

To try out the new gauge widget, I threw in a few of them showing some temperatures. The widget is very configurable.

Interactive manual host/event actions

In addition to being actually useful in production, the new interactive host/event actions are fun to play with. You can provide parameters to your scripts via dropdown or a free text field. Here’s a dropdown example. Well, a mockup, because my Python script is currently just a Hello world always returning that it changed the light color. Anyway, will modify my existing lights on/off script to handle colors, too.

So, if in scripts I click on Advanced Configuration, I get to adjust the input type and dropdown options.

… which gives me this:

Now, when I click on Change home office light color, I get to see:

And after choosing any of the colors, I get:

Easy! Just pass {MANUALINPUT} macro for your script as a parameter and it works. Like this:

Will definitely be helpful in serious business applications, as your on-call guys could, for example, trigger any Ansible playbooks through Zabbix to investigate and/or fix something just by clicking on an alert.

DNS monitoring gone overkill

With the new and improved net.dns.get Zabbix agent item key, you can query no less than 73 different DNS record types. To visualize this, your DNS monitoring could look this wild. No, whatsuphome.fi doesn’t give you back answers for nearly all of the query types but at least Zabbix tries.

Next page:

So if there’s something really deep you want to know about your DNS, Zabbix now supports it.

… and much more!

I’ll have lots of poking to do, including creating my custom widgets. But, from now on, bye-bye Zabbix 6.4. Here at What’s up, home?, it’s now time to move on. Oh, and by the way, Grafana also continues working just fine with Zabbix 7.0beta1, or at least I haven’t seen any broken dashboards yet.

This post was originally published on the author’s page.

The post What’s Up, Home? – Time to start to use Zabbix 7.0 (at home) appeared first on Zabbix Blog.

What’s Up, Home? – Monitor your ad blocker with Zabbix

Post Syndicated from Janne Pikkarainen original https://blog.zabbix.com/whats-up-home-monitor-your-ad-blocker-with-zabbix/26912/

Can you monitor your ad blocker with Zabbix? Of course, you can!

API defines it all

My home Asus router is running on Asuswrt-Merlin firmware, and with that, I have AdGuard Home ad blocker.

As AdGuard Home has an API, monitoring it with Zabbix is trivial.

Communicate with the API

Communicating with AdGuard Home API is easy: pass it Authorisation: Basic XXXXXXXXXXXX header, where XXXXXXXXXX is just a Base64 hash of your AdGuard username and password. You can generate that Base64 snippet with for example

echo -n "myuser:mypassword" | base64

Next, in Zabbix, create a new HTTP Agent type item, and point it to your AdGuard Home instance.

Create some items

You’ll get the info back as JSON, so next you can create some dependent items and start monitoring. I only added

  • Total number of DNS requests
  • Blocked # of DNS requests
  • Redirects to safe search
  • Parental advisory stuff
  • Average request processing time

For the dependent items, you’ll then just do some JSONPath processing.

Add triggers

Next, I added a few triggers to alert me if AdGuard starts to run slower than usual.

Add service

Finally, I added AdGuard as a new business service, so I’ll get an SLA for it.

And that’s it! From now on I’ll know more about how well my home router ad-blocker is working. (Well, it also has a Skynet firewall which probably filters stuff before AdGuard Home, but that’s another story….)

This post was originally published on the author’s page.

The post What’s Up, Home? – Monitor your ad blocker with Zabbix appeared first on Zabbix Blog.

What’s Up, Home? – How to secure your (home) monitoring

Post Syndicated from Janne Pikkarainen original https://blog.zabbix.com/whats-up-home-how-to-secure-your-home-monitoring/26241/

As my home monitoring experiment has become such a celebrity and as it has so much going on, I’m trying to make sure I won’t ever lose its configuration and data, no matter what would happen. Here are some tips and reminders for you, too.

In the IT world, so much can go wrong. Hardware can die, files can become corrupt, malware can hit you, hackers can breach your systems, buggy software updates can cause havoc, you can fat-finger some commands or click on the wrong place and remove data… the list is endless. Here are some ways I’m attempting to protect my home monitoring environment.

Keep software updated

First things first. In today’s malicious world, it’s mandatory that you keep your software updated. With Linux and Zabbix, you don’t have an excuse to skip the updates. Updating your systems is fast and trouble-free. In small environments like home, even major Zabbix upgrades are fast as the database is not very big, so the database migrations that in a corporate environment can take time, will go through in minutes if not faster.

Remember to backup

Keep your backups in good shape. In my case, I do take backups with BackupPC and monitor my backups with Zabbix.

But I don’t trust one environment. What if my BackupPC says Kaboom? A nightly cron job also copies backup archives from my Raspberry Pi to my Mac, which in turn mirrors the backups to my iCloud. And, there’s one more cloud service I’m using for all my backups but not mentioning it here by name.

Test your backups

As long as you have not verified that your backups do actually work, you do not have a working backup. Have a virtual machine into which you can try to restore your backups. See if they work. Test them periodically, either manually or figure out an automated way to do that. 

In the case of Zabbix, you can make your primary Zabbix monitor your test environment, and make Zabbix alert if your restore environment Zabbix suddenly starts responding back something else than the regular login page, or if the restore environment database doesn’t come back with some query response you would expect.

Setup a HA cluster

As any hardware can die, it’s not a bad idea to set up a HA cluster. Last winter I was preparing for potential electricity blackouts here in Finland and did setup my laptop to be a secondary node for my Zabbix. This setup has been working very well.

Use strong passwords

Even if it would only be your sandbox environment where you do test new stuff, please remember to use strong passwords. An evil actor can attempt to breach more targets in your network through a single point of failure.

Use ssh keys

Instead of username + password combination, use ssh keys for ssh authentication. Keys are immune to brute-force attempts and with tuning, ssh keys can also be allowed to only connect from specific IPs and run only specific commands. You know how in your ~/.ssh/authorized_keys the lines do start with something like 

ssh-rsa aZfgT12b(....

but if you modify it to be 

command="/usr/bin/rsync" ssh-rsa aZfgT12b(....

well, then only rsync would be allowed.

Or, for IP address limitation

from="123.123.123.123" ssh-rsa aZfgT12b(....

Of course, these can be combined:

from="123.123.123.123" command="/usr/bin/rsync" ssh-rsa aZfgT12b(....

Obviously, this grants you much more security than traditional logins.

Use HashiCorp Vault

OK, I admit I’m not doing this at home as it would be overkill for my few logins. But, in a larger environment with absolutely critical safety requirements, use HashiCorp Vault for protecting your credentials. Zabbix has native support for it.

Monitor your logs

Setup a centralized log server — it can be your Zabbix server environment, too — and make sure you monitor the logs. My Zabbix gets all my logs, but wouldn’t be a bad idea to use more advanced log monitoring tools, too. Since I already do have ElastiFlow running at home, at some point I might start utilizing Elasticsearch for the logs. Not doing it much yet.

Use chkrootkit, AIDE, others

Tools like AIDE or chkrootkit can help you detect an intrusion. Set them to run in your cron and get alerted in case of any anomalies. Maybe I’ll one day integrate Zabbix with these tools.

Firewall your environment, use VPN

Don’t allow direct access from the Internet to your Zabbix, or your database, or anything really. In my case, my Asus router allows setting up OpenVPN connections, so that’s what I use. Whilst on the go, I just connect to OpenVPN on my phone and do whatever I need remotely through that.

Anything else?

Did I miss something? Let me know in the comments.

This post was originally published on the author’s page.

The post What’s Up, Home? – How to secure your (home) monitoring appeared first on Zabbix Blog.

What’s Up, Home? – Does your phone battery drain faster in summertime?

Post Syndicated from Janne Pikkarainen original https://blog.zabbix.com/whats-up-home-does-your-phone-battery-drain-faster-in-summertime/26084/

Can you verify if your phone battery drains faster during summer compared to other seasons with Zabbix? Of course, you can!

I have always felt that during summer my phone battery drains faster than during the darker seasons. This would only be logical, as during summer the phone display must be brighter than during the darker seasons. Additionally, during summer we also tend to be more outdoors, so instead of home Wi-Fi the phone is using mobile data. On the other hand, during winter time if you are outdoors, the cold weather might affect battery life as well.

But how severe is the drainage difference? Let’s check it out!

Analyzing the data

In June, my iPhone battery average level has been 51%

In April, it was around 67%.

In March, about 71%.

What does this prove?

Well, necessarily not much as this is not a very scientific method. However, my day-to-day phone usage does not vary much — if anything, during March/April the drainage should have been worse, as I have a tendency to participate in one daily afternoon meeting from outdoors; I’ll stroll around with our baby and get some fresh air whilst being online in the meeting. Now in June, I’ve been enjoying my summer holiday. But clearly, something is going on as the average percentage difference is such high. For my Apple Watch, the difference is there but not that significant.

Why am I not comparing the data with the iPhone activity? Heh — to prove my point with my earlier “Things that WILL go wrong when monitoring IoT devices” post; something has happened as my Home Assistant won’t provide that information anymore. The same happened with connection-type data. I’ll have to take a look at that someday, but lately, I’ve been busy as a bee with 1) the summer holiday and 2) preparing material for Zabbix Summit 2023.

Real-world applications for this kind of cherry-picking

Even though this post is very thin in its contents, I’m posting this as a hint for you on how you can utilize Zabbix in more serious monitoring targets in this way. Need to compare UPS battery depletion rate? Disk space usage rate? CPU usage? Concurrent connections? Whatever the data, many times it’s useful to stop for a moment and compare how things were (some time units) ago.

Yes, you can simply pick a longer time period in Zabbix time picker and see the data for one year or whatever, and most of the time it will show you a change in pattern, but if the changes are more subtle or the graph is very busy, sometimes zooming in to shorter time periods in history will show you something that you might otherwise miss.

For example, if I expand the time range for the battery usage, not only you’ll notice that the Home Assistant iCloud ride has been a bumpy one, but also the details do get lost when the time range is longer.

More ways to compare historical data

I didn’t build any new graphs or dashboards for this quick experiment, I merely used the time picker. In case one would need to have comparison data available at any time, using time shift and additional data sets would help you out. And, like many of us do, one way to dive deeper into data collected by Zabbix would be to analyze it in Grafana, but that’s a story for another day.

I have been working at Forcepoint since 2014 and I’m happy that my work won’t drain my personal battery. — Janne Pikkarainen

This post was originally published on the author’s page.

The post What’s Up, Home? – Does your phone battery drain faster in summertime? appeared first on Zabbix Blog.

What’s Up, Home? – 7 things to beware of if you monitor your home

Post Syndicated from Janne Pikkarainen original https://blog.zabbix.com/whats-up-home-7-things-to-beware-of-if-you-monitor-your-home/26035/

When reading this blog, you could easily think that everything is smooth sailing all the time. No. When you monitor your home IoT — or frankly, just USE your home IoT — you have plenty of small details to watch out for. I list them for you, so you don’t have to find them out the hard way like I’ve done over this 1+ year of journey.

1. The status is not what it seems

This is especially true with the IoT devices operating on 433 MHz radio frequency. Your home smart hub sends the signal like a radio station hoping for your IoT device to catch it, and to my understanding, it does not get a reply back from the device. If anything is interfering with the signal, your device will miss the signal and thus your home smart hub will be showing the wrong status.

So, you will need to either get rid of these devices and replace them with devices that use a two-way communication protocol such as ZigBee or if that’s not possible, to set up extra monitoring to try to guess if the command your home smart hub sent actually went through. Did you attempt to power on/off a smart power socket connected to a radiator? Keep an eye on the smart temperature meter and react soon if the temperature does not start to rise after the power socket got powered on, or so.

2. Battery-low messages can be deceiving

Two of my Philips Hue motion sensors have been complaining about low battery status for about six months now, but they are still operating just fine. I’ll let you know when I finally have to replace the batteries on them. 

On the contrary, the batteries on some 433 MHz frequency Telldus thermometers can just die without too much warning. For them, your monitoring need to react fast if the values are not coming in. To make things more complicated, not TOO fast though, as sometimes these thermometers can hibernate for some time before reporting new values; possibly when there’s no change in temperature, they will enter some power save mode or something. I don’t know.

3. Bluetooth devices and 2.4 GHz Wi-Fi can interfere with each other

Even though my devices do not use 2.4 GHz Wi-Fi too much, I have some devices like Sonos smart speaker where it’s a must. So, for example, when playing music through that speaker, it’s possible that my Raspberry Pi 4 cannot hear the RuuviTag environmental sensor very reliably. It did help somewhat when I found out that on my Asus router, it was possible to enable some kind of “Bluetooth coexistence” mode, but it’s not a 100% solution for my issue.

4. Make sure any helper components are really up

Along with Zabbix and Grafana, my Raspberry Pi 4 runs Home Assistant to harvest some values about my iPhone and so on. It runs as a Docker image and generally is stable, but sometimes it just stops working. I have an automatic daily restart of that Docker image and so far that has been a relatively good way to keep the image running.

5. APIs can and will change

Monitoring something over some API? Or through web scenarios? Rest assured that your joy won’t last forever. This is IT, and things just won’t remain the same. SOMETHING is guaranteed to change every now and then and the more your monitoring relies on 3rd party things, the less you can trust that your monitoring just would keep on working. No, it’s likely you will need to alter things every now and then.

6. Monitor your monitoring

Even though Raspberry Pi 4 and Zabbix are very reliable and are very unlikely to cause you any trouble, of course, they can fail, or more likely something else will not be like it should. Your home router or Internet connection can die. Electricity can go down. Hardware can die. If you want to be really sure, monitor your monitoring from outside somehow. Have a separate monitoring running on the cloud somehow. 

In our case, the electricity and ISP are very reliable, and Cozify smart home hub has a nice feature where the Cozify cloud will text me if the hub loses connectivity — that’s usually a good indication that either the ISP or power went down. Also, I’m about to roll out a small cron job on this site which would check if my Zabbix has updated a test file in a while. If not, it would indicate my Zabbix would be down or otherwise unreachable, so then whatsuphome.fi could e-mail me.

7. You will get paranoid

With more knowledge comes more pain. With some devices, you’ll start to think that they are going to break soon. As an example, the freezer I keep referring to — sometimes it has short periods of time when its temperature for some reason rises a bit and then it goes down again. I don’t know if that has something to do with the fact that our freezer is one of those which does not form ice everywhere so it’s maintenance-free, or if that’s something else, but we keep observing spikes like this about once a week.

I have been working at Forcepoint since 2014 and have learnt not to trust the technology. — Janne Pikkarainen

This post was originally published on the author’s page.

The post What’s Up, Home? – 7 things to beware of if you monitor your home appeared first on Zabbix Blog.

What’s Up, Home? – Can ChatGPT help set up monitoring a USB-connected printer with Zabbix?

Post Syndicated from Janne Pikkarainen original https://blog.zabbix.com/whats-up-home-can-chatgpt-help-set-up-monitoring-a-usb-connected-printer-with-zabbix/25980/

Can you monitor a USB-connected printer with Zabbix? Of course, you can! But can ChatGPT help set up the monitoring? Well… erm… maybe! By day, I am a Lead Site Reliability Engineer in a global cyber security company, Forcepoint. By night, I monitor my home with Zabbix & Grafana and do some weird experiments with them. Welcome to my blog about the project.

When it comes to printing, I am not laser-sharp. That’s simply because I have not printed anything in a long, long time, and even if I have, it’s been a printer maintained by Someone Else. Yes, I know how to add paper and how to do a ritual dance whilst printing to prevent the printer from doing an annoying paper jam. Yes, I have added some printer servers under Zabbix monitoring at the office. That’s about where my printer wisdom ends.

Nobody buys a printer anymore, except for us

It’s 2023, and nobody prints anymore, or that’s my personal impression. Well, that changed at our home as we enter another domain I understand 0% about. Occasionally my wife is making some clothes for our baby, me, and herself. For that, she’s printing out the source code… the CAD models… well… the blueprints for the clothes. I kid you not, the clothes schematics look so complicated to me and the text-based instructions so alien that I’m sure the instructions are not from this planet.

Anyway, my wife found a used HP LaserJet Pro MFP M28a for us for a steal. No, not a literal steal, but for 40 euros, which did sound cheap to me, so we bought it. Of course, normal human beings would just connect the printer to their laptop/desktop and be done with it. However, you know how this story continues.

Flirting with ChatGPT

I went to Zabbix integrations and was sure I would be able to easily find out how to monitor a USB-connected printer. I’ll just search and… what? Nothing? No worries! We have the community templates! I’ll just quickly grab a template from there…. the empty result set, AGAIN? Monitoring SNMP-enabled printers is a different story, for that Zabbix can suit you very well, but just try to find out something for USB-connected printers. I know I could probably monitor my printer by spying cups but I’m not sure if it could return the details I wanted.

With my experiments, I’m used to the fact that I cannot get direct answers to my monitoring needs using search engines, as I’m doing stuff that not too many have done. Even if they have, they might not have blogged about it. That’s ok, but as this was about printing which is a common topic, I decided to try out what happens if I try out ChatGPT. I did the tests with the free ChatGPT 3.5, the new ChatGPT 4 would probably be a different ride.

Here’s our lovely little chat.

Me: I have an HP LaserJet MFP M28a monochrome laser printer connected to USB. How do I get its remaining toner level through the command line on Ubuntu 22.04?

ChatGPT:  You can get the remaining toner level of your HP LaserJet MFP M28a monochrome laser printer through command line on Ubuntu 22.04 by following these steps:

  1. Install the “hplip” package by running the following command in the terminal:

sudo apt-get install hplip

  1. Once the installation is complete, run the following command to set up your printer:

sudo hp-setup -i

Follow the instructions provided by the setup wizard to configure your printer.

  1. After the printer is set up, run the following command to get the remaining toner level:

hp-systray -x

This will launch the HP Device Manager, which displays the toner level for your printer.

Alternatively, you can also run the following command to get the toner level directly in the terminal:

hp-levels -n

This will display the toner level in a percentage format.

Me: None of those worked as hp-levels and hp-systray require QT4 and D-Bus. Let’s use ipptool instead.

ChatGPT: Sure, we can use the ipptool command to get the remaining toner level of your HP LaserJet MFP M28a monochrome laser printer on Ubuntu 22.04.

Here are the steps to follow:

  1. Make sure your printer is connected to the computer and turned on.
  2. Open the terminal on your Ubuntu 22.04 machine.
  3. Run the following command to install the CUPS and IPP utilities:

sudo apt-get install cups-ipp-utils

  1. Run the following command to find the printer’s URI:

lpinfo -v

The output should contain a line with the URI of your printer, which will look something like this:

ipp://HP_LaserJet_MFP_M28a.local:631/ipp/print

  1. Run the following command to get the remaining toner level:

ipptool -t -v -H ipp://localhost:631/ipp/print -I /usr/share/cups/model/HP/hp-laserjet_pro_mfp_m26a.ppd get-printer-attributes.test | grep marker-levels

Replace “get-printer-attributes.test” with the actual name of the test file used by your printer.

  1. The output of the command should contain a line with the toner level, which will look something like this:

marker-levels: marker-high-levels=(100) marker-low-levels=(5) marker-names=(Black Cartridge) marker-current-levels=(30)

In this example, the toner level is 30%.

That’s it! This is how you can use the ipptool command to get the remaining toner level of your HP LaserJet MFP M28a monochrome laser printer on Ubuntu 22.04.

* * * 

The latest tip really did work, so we’re off to a very good start with ChatGPT! Next, I tried asking if it could create a Zabbix template for me, but even though it really tried, it did fail.

Adding printer to Zabbix

So, before continuing with the failed ChatGPT attempt, let’s add this printer to monitoring, as that’s the reason you are reading this blog anyway. I was very surprised about the detail level of the ipptool output: everything from supported paper sizes to printing options to other usual details, but then also some dynamic details like printer uptime.

I wanted to add those dynamic details, so I read through the output and added the details in the way you already know me doing:

  • I first added a cronjob that runs every minute 

    ipptool -t -v “ipp://HP%20LaserJet%20MFP%20M28a%20(7C69CB)%20(USB)._ipp._tcp.local/” – get-printer-attributes.test  >/tmp/hp-printer.txt

  • Zabbix then reads that text file to a master item, and with dependent items and item preprocessing cherry-picks the interesting details

In screenshots, like this.

Does it work?

Of course, it does, as this routine is what I’ve done so many times before in this blog. Here’s the result. And yes, the toner will likely run out soon — this is a used printer and it’s complaining about low toner level every time we print. An interesting experiment to see how many pages we can still print before it actually runs out of juice. For “0% left”, as also reported by other tools, the printer does an excellent job.

Back to ChatGPT we go

If I would copy-paste my complete chat with ChatGPT, this blog post would become ridiculously long. Communicating with ChatGPT was like with a hyper-active intern who proceeds to do SOMETHING only to realize moments later that whatever it did was completely else than what you asked for. Probably I’m just a sucky ChatGPT prompter.

To get you an idea of how ChatGPT failed, here’s a summary of how it failed:

  • It really attempted to create YAML-based template files for me.
  • Unfortunately, when attempting to import the templates to Zabbix, that part failed every time 
  • When I told the error messages to ChatGPT, it attempted to fix its errors, but in weird ways. Sometimes it changed the template in drastic ways, even if it was supposed to only add or modify a single line of it. Multiple times, it decided to change the format from YAML to XML unless I demanded it to stay on YAML

Here are a few snippets from the chat. Maybe at some point, I’ll throw in some money to try out ChatGPT 4.

… this went on and on until I gave up. In conclusion: this time ChatGPT nudged me in to correct direction to get the desired output about the printer info (although a sharp-eyed reader might notice I hinted it about the tool I’d like to use and how I might after all know more about printers than I pretended during this blog post…). Then, ChatGPT ran out of ink when it tried to generate the Zabbix templates. It’s scary advanced anyway, and someday I will try out the more advanced ChatGPT 4.

I have been working at Forcepoint since 2014 and luckily I don’t suffer about the empty paper syndrome very often. — Janne Pikkarainen

This post was originally published on the author’s page.

The post What’s Up, Home? – Can ChatGPT help set up monitoring a USB-connected printer with Zabbix? appeared first on Zabbix Blog.

What’s Up, Home? – Monitor your mobile data usage

Post Syndicated from Janne Pikkarainen original https://blog.zabbix.com/whats-up-home-monitor-your-mobile-data-usage/25856/

Can you monitor your mobile data usage with Zabbix? Of course, you can! By day, I am a Lead Site Reliability Engineer in a global cyber security company Forcepoint. By night, I monitor my home with Zabbix & Grafana Labs and do some weird experiments with them. Welcome to my blog about this project.

As it is Easter (the original blog post was published two months ago), this entry is a bit short but as I was remoting into my home systems over VPN and my phone, I got this blog post idea. 

When on the go, I tend to stay connected to my home network over VPN. Or rather, an iOS Shortcut pretty much runs OpenVPN home profile for me whenever I exit my home. 

My Zabbix collects statistics from my home router over SNMP, and as usual, the data includes per-port traffic statistics. VPN clients are shown as tunnel interfaces so Zabbix LLD picks them up nicely.

So, as a result, I get to see how much traffic my phone consumes whenever I’m using a mobile VPN. Here are seven-day example screenshots from ZBX Viewer mobile app. 

VPN connection bits sent.

VPN connection bits received

So, from this data I could get all the statistics I need. And, using my ElastiFlow setup, could likely see to where my phone has been connecting to most.

This post was originally published on the author’s page.

The post What’s Up, Home? – Monitor your mobile data usage appeared first on Zabbix Blog.

What’s Up, Home? – Monitor your iPhone & Apple Watch with Zabbix

Post Syndicated from Janne Pikkarainen original https://blog.zabbix.com/whats-up-home-monitor-your-iphone-amp-apple-watch-with-zabbix/25817/

I’m entering a whole new level of monitoring and “What’s up, home?” could now also be called “What’s up, me?”. Recently my colleague did hint to me about Home Assistant’s HomeKit Controller integration just to get my HomeKit-compatible Netatmo environmental monitoring device to get to return value back to Zabbix without my Siri kludge. One thing lead to another and now I’m monitoring my iPhone and Apple Watch — so, practically monitoring myself.

But how to get to this level? Let’s rewind a bit.

Home Assistant

Home Assistant is a nice home automation software. It is open source and provides many, many integrations for automating your home. I now have my Netatmo comfortably monitored through that…

Bye-bye, mobile app and my Siri kludge. This screenshot is from Home Assistant.

… but while exploring Home Assistant’s integrations, I came upon its iCloud integration. Oh boy. This takes my monitoring to a whole new level.

But how to get this data to Zabbix?

On Home Assistant, you can go to your account settings and create a Long-lived access token. With that, you then just pass the authorization bearer as part of your HTTP request and you are done. So, like this.

This way you’ll receive your Home Assistant data back in JSON format. As the output is really really really long, and I needed just a relatively small set of data for myself, I cherry-picked those using the above item as the master item and then created a bunch of dependent items.

… and here’s a single item so you get the idea.

Let’s create some dashboards

Now that I have my data in Zabbix, it’s time to create some dashboards. Fascinating that I can now truly monitor my iPhone and Apple Watch like this.

I also created a Grafana dashboard.

Observations

This has been now running for roughly a day for me. Already some observations:

  • While driving, at traffic lights I tried to see what would happen if I disable the Bluetooth connection between my car and my iDevices. My status was reported as Cycling instead of Automotive for the rest of the trip. Hmm.
  • Not all the data will be updated in real-time, but there’s a significant lag. Also, it seems I might need to VPN to my home so the data would be updated sooner while I’m not at home.
  • iPhone’s custom focus modes are not updated to Home Assistant. During the sleep focus mode, the focus mode was reported as On, but for any other mode I tried it only shows Off. Shame, I would have loved to start tracking things like how long it takes for me to put our baby to sleep or how much of the time I’m spending with this blog. That has to wait for now.

But anyway, this thing just opened a whole new Pandora’s box for me to explore. 

This post was originally published on the author’s page.

What’s Up, Home? – Is it raining?

Post Syndicated from Janne Pikkarainen original https://blog.zabbix.com/whats-up-home-is-it-raining/25713/

Can you create a proper weather dashboard with Zabbix? Of course, you can! By day, I am a Lead Site Reliability Engineer in a global cyber security company. By night, I monitor my home with Zabbix & Grafana and do some weird experiments with them.

Since Zabbix 6.0 has provided you an official OpenWeatherMap template. It gives you all the standard weather details: temperature, humidity, and so on, for any location you’d like to observe.

However, by default, Zabbix does not come with a weather map template. Can we add one? Probably. I say probably because it looks like the free OpenWeatherMap account I created might not have enough credentials to show the layers. Still, let’s give this a try!

(And before you ask why I did not just add another custom geomap provider under Zabbix Administration –> General –> Geographical maps — I wanted to have these layer toggles for clouds etc, and that requires custom JavaScript)

Getting OpenWeatherMap account

Just go to the OpenWeatherMap site and create an account for yourself. Soon enough, you’ll get an API key you are supposed to use.

Embedding OpenWeatherMap to Zabbix UI

I found leaflet-openweathermap and even though it’s abandoned, the demo that comes with it seems to work just fine. Embedding that to Zabbix was not that of a big deal.

  • Clone the git project for yourself
  • Copy the example somewhere where you can serve it, I did put it on my Zabbix server under /assets/openweathermap/ directory
  • Load that map in an empty tab to verify you see it works for you
  • With the default App ID that is bundled with the map the layers do work, but it would not be cool to use the author’s API key as stated in the code
  • Change the AppID to one you have received … well, at this point it stopped working for me, but if you really need it, OpenWeatherMap is not that expensive

Then you can add it to Zabbix just by inserting a new URL widget and pointing that to your location.

How does it look like?

Here we go! And, as another idea for you, with the URL widget, you can embed any camera input to your dashboard, too, some hints in part 21 of this blog I don’t want to show you our own camera footage, so I added Lauttasaari, Helsinki location — that is where Forcepoint has its office.

Now that’s a weather dashboard for you.

Get alerted

OpenWeatherMap would also support alerts about severe weather conditions, but another option would be to find out your local weather data from your nearest provider and use their open data for this; in Finland for example, Finnish Meteorological Institute has its own open data for one to use. Then just add those to Zabbix via HTTP Agent item type for example much like I did in part 32 of this blog, and you’re done.

I have been working at Forcepoint since 2014 and as you know by now, I have this never-ending drive for monitoring. — Janne Pikkarainen

This post was originally published on the author’s page.

What’s Up, Home? – Let’s hit the road!

Post Syndicated from Janne Pikkarainen original https://blog.zabbix.com/whats-up-home-lets-hit-the-road/25693/

Can you monitor how much you drive your car, even if your car wouldn’t have any way to report back to Zabbix? Of course, you can! By day, I am a Lead Site Reliability Engineer in a global cyber security company. By night, I monitor my home with Zabbix & Grafana and do some weird experiments with them. Welcome to my blog about the project.

Some forewords: Now that our baby girl is over six months old, she has developed some kind of sleeping pattern. It means she goes to bed very early in the evening, around 6pm. Or, I go to the bedroom with her and wait for her to sleep steadily before I exit the bedroom without her noticing. It means I have lots of time to think, and also to play around with apps like iPhone Shortcuts. I have previously done a few Siri & Zabbix experiments and this will be one more.

I did do this shortcut only two days ago and have not actually driven yet, but I verified that the shortcut itself works when I go into my car and start it up. Also, as I don’t want to give out the exact location where we live, for this blog post I faked our car to be located in Santa Claus Village, Rovaniemi.

Let’s get started.

What are you planning?

Even though I already know very well how much I drive — there’s the odometer in our car, a fuel app in my iPhone shows how many liters per month I refuel, and so on, this data is still something that would contribute to my dear single pane of glass, like your company probably wants to have.

My Siri Shortcut is simple: whenever I go to my car and my iPhone connects to car Bluetooth, it’s a clear data point that I’m probably going somewhere, so the shortcut gets my current location and saves its coordinates to a text file in my iCloud.

Next, just like in my previous Siri examples, a Zabbix Agent on my MacBook keeps an eye on this text file, very much like in my FlightGear integration example, Zabbix will then populate the coordinates in Zabbix inventory for my car host. This way, I can project the car location to the Geomap widget.

Let’s create the shortcut

Here’s the shortcut in all its simplicity.

About that Append to Text File… why appending instead of overwriting, I’ll tell you a story some other day.

Why Desktop Directory? I’ll tell you a story some other day.

Next up, Zabbix

On the Zabbix side of the house, the story is like so many times in my posts: read the text file, and using dependent items create the longitude and latitude items.

Wait! You saved it on your Desktop but now it’s in /tmp? I’ll tell you a story about this kludge some other day… or immediately after this caption.

It was easier to get macOS Zabbix Agent to get to read /tmp instead of your home directory, as the security is in the way, so a cronjob syncs the file once per minute to /tmp. Not only that but because in iOS Shortcuts the Append to a text file was the only way I got the shortcut to run without it asking for permission to run, my cronjob is actually like this:

* * * * * /usr/bin/tail -n1 /Users/jaba/Desktop/car_location.txt >/tmp/car_location.txt

Beautiful? No, but due to reasons I had to do this, and at least it works.

Anyway, then the longitude/latitude-dependent items just use some regular expressions.

Beautiful? No, but it works.

Does it work?

Of course, it does! See for yourself.

Here’s the latest data…

… and here’s the Geomap.

But wait! How does this track your kilometers?

Heh, you got me. It does not. One easy way would be to use Get distance block in iOS Shortcuts. It actually works — you get to choose that yes I will be driving, give me the kilometers. Whenever I do that, I would need a text file containing just one line (which would contain the old location), and getting to that point without your iPhone asking anything ever is not so simple, so for now I gave up.

So, the next part of this will be to use some API and make my Zabbix calculate the distances. That would be cooler anyway, but I’ll find time for that next time. Anyway, from now on Zabbix will know the locations where I have started our car, so the data will be collected from today. I know there are limitations in this implementation, such as that if I start the car and just drive to some place and back without ever stopping the engine, that won’t really give me any results, but this is better than nothing.

I have been working at Forcepoint since 2014 and as you know by now, I have this never-ending drive for monitoring. — Janne Pikkarainen

This post was originally published on the author’s page.

What’s Up, Home? – Monitor your website visitor rate

Post Syndicated from Janne Pikkarainen original https://blog.zabbix.com/whats-up-home-monitor-your-website-visitor-rate/25660/

Can you monitor your website visitor rate with Zabbix? Of course, you can! By day, I am a lead site reliability engineer in a global cyber security company. By night, I monitor my home with Zabbix & Grafana and do some weird experiments with them.

I have this website hosted in a domain hotel, and among other features, the admin panel has some standard website access log analyzers (such as awstats) available for me to see the activity of this site. That’s cool, but also boringly easy, and requires me to log in to that admin panel instead of me using my trusted single pane of glass that is Zabbix.

Let’s connect to site logs

If I log in to my site over ssh/sftp, my home directory has a preconfigured access_logs directory. Like the name says, it contains the website access logs in the usual format you would expect it to be:

35.166.xxx.xxx – – [26/Jan/2023:04:24:37 +0200] “GET / HTTP/1.1” 200 10055 “http://whatsuphome.fi” “Mozilla/5.0 (X11; Linux x86_64) AppleWebKit/537.36 (KHTML, like Gecko) Chrome/83.0.4103.97 Safari/537.36”

That’s great, but how to monitor that in real time with Zabbix? Let’s use sshfs — it’s like NFS or CIFS, but allows you to mount stuff over ssh. On my dear Raspberry Pi 4, which runs my Zabbix, running

sudo mkdir /var/log/whatsuphome && sudo chown zabbix /var/log/whatsuphome

sudo sshfs -o allow_other mywhatsuphomeaccount@myhotelname:access_logs /var/log/whatsuphome

did mount my remote server access_logs directory perfectly fine.

Time for monitoring

Now that we have our log file, the rest is very straightforward and standard log file monitoring. First, let’s add a master item that reads the log.

Nothing too difficult yet.

Next, let’s add a dependent item that grabs the visitor IP address part from a log line.

… and some item preprocessing to grab only the IP

Items

Sorry about that ugly regular expression.

… after adding a few more items, here’s my template.

I’m currently not parsing the referrer, exact URL, or user-agent values, as for the most part those would just add unnecessary noise and load for my poor little home Zabbix.

Dashboard time!

So, finally, I created a dashboard showing the number of unique IP addresses & hits during the past 24 hours and some graphs. Now that I’ve not posted any posts in a while, welcome to Tumbleweedville!

It’s so silent in here that I can hear my own typing.

After publishing this post, I’ll wait for a while and then update the post with a new screenshot, so we’ll get to see the incredible visitor surge that will be counted in at least tens of new IP addresses.

Update #1 about 15 minutes after publishing the post

Clearly some movement in the access log needle!

Update #2 about 15 minutes after publishing the post

Almost 400 unique IP addresses already? Hello, dear readers and bots.

Update #3 about 15 minutes after publishing the post

Even though IP addresses are a bad way to measure the actual amount of visitors, roughly 400 unique new addresses after publishing my post are very good. Thanks, bots and readers!

This post was originally published on the author’s page.