On August 13, security researchers at Tel Aviv University disclosed a new HTTP/2 denial-of-service (DoS) vulnerability that they are calling MadeYouReset (CVE-2025-8671). This vulnerability exists in a limited number of unpatched HTTP/2 server implementations that do not sufficiently enforce restrictions on the number of times a client may send malformed frames. If you’re using Cloudflare for HTTP DDoS mitigation, you’re already protected from MadeYouReset.
Cloudflare was informed of this vulnerability in May through a coordinated disclosure process, and we were able to confirm that our systems were not susceptible, due in large part to the mitigations we put in place during Rapid Reset (CVE-2023-44487). MadeYouReset and Rapid Reset are two conceptually similar HTTP/2 protocol attacks that exploit a fundamental feature within the HTTP/2 specification: stream resets. In the HTTP/2 protocol, a “stream” represents an independent series of HTTP request/response pairs exchanged between the client and server within an HTTP/2 connection. The stream reset feature is intended to allow a client to initiate an HTTP request and subsequently cancel it before the server has delivered its response.
The vulnerability exploited by both MadeYouReset and Rapid Reset lies in the potential for malicious actors to abuse this stream reset mechanism. By repeatedly causing stream resets, attackers can overwhelm a server’s resources. While the server is attempting to process and respond to a multitude of requests, the rapid succession of resets forces it to expend computational effort on starting and then immediately discarding these operations. This can lead to resource exhaustion and impact the availability of the targeted server for legitimate users. The difference between MadeYouReset and Rapid Reset is that, instead of clients issuing stream resets directly, they instead trick servers into resetting streams by sending specially crafted malformed frames.
Fortunately, the MadeYouReset vulnerability only impacts a relatively small number of HTTP/2 implementations. In most major HTTP/2 implementations already in widespread use today, the proactive measures taken to counter Rapid Reset in 2023 have also provided substantial protection against MadeYouReset, limiting its potential impact and preventing a similarly disruptive event.
A note about Cloudflare’s Pingora and its users: Our open-sourced Pingora framework uses the popular Rust-language h2 library for its HTTP/2 support. Versions of h2 prior to 0.4.11 were potentially susceptible to MadeYouReset. Users of Pingora can patch their applications by updating their h2 crate version using the cargo update command. Pingora does not itself terminate inbound HTTP connections to Cloudflare’s network, meaning this vulnerability could not be exploited against Cloudflare’s infrastructure.
We would like to credit researchers Gal Bar Nahum, Anat Bremler-Barr, and Yaniv Harel of Tel Aviv University for discovering this vulnerability and thank them for their leadership in the coordinated disclosure process. Cloudflare always encourages security researchers to submit vulnerabilities like this to our HackerOne Bug Bounty program.
Network Analytics v2 is a fundamental redesign of the backend systems that provide real-time visibility into network layer traffic patterns for Magic Transit and Spectrum customers. In this blog post, we'll dive into the technical details behind this redesign and discuss some of the more interesting aspects of the new system.
To protect Cloudflare and our customers against Distributed Denial of Service (DDoS) attacks, we operate a sophisticated in-house DDoS detection and mitigation system called dosd. It takes samples of incoming packets, analyzes them for attacks, and then deploys mitigation rules to our global network which drop any packets matching specific attack fingerprints. For example, a simple network layer mitigation rule might say “drop UDP/53 packets containing responses to DNS ANY queries”.
In order to give our Magic Transit and Spectrum customers insight into the mitigation rules that we apply to their traffic, we introduced a new reporting system called "Network Analytics" back in 2020. Network Analytics is a data pipeline that analyzes raw packet samples from the Cloudflare global network. At a high level, the analysis process involves trying to match each packet sample against the list of mitigation rules that dosd has deployed, so that it can infer whether any particular packet sample was dropped due to a mitigation rule. Aggregated time-series data about these packet samples is then rolled up into one-minute buckets and inserted into a ClickHouse database for long-term storage. The Cloudflare dashboard queries this data using our public GraphQL APIs, and displays the data to customers using interactive visualizations.
What was wrong with v1?
This original implementation of Network Analytics delivered a ton of value to customers and has served us well. However, in the years since it was launched, we have continued to significantly improve our mitigation capabilities by adding entirely new mitigation systems like Advanced TCP Protection (otherwise known as flowtrackd) and Magic Firewall. The original version of Network Analytics only reports on mitigations created by dosd, which meant we had a reporting system that was showing incomplete information.
Adapting the original version of Network Analytics to work with Magic Firewall would have been relatively straightforward. Since firewall rules are “stateless”, we can tell whether a firewall rule matches a packet sample just by looking at the packet itself. That’s the same thing we were already doing to figure out whether packets match dosd mitigation rules.
However, despite our efforts, adapting Network Analytics to work with flowtrackd turned out to be an insurmountable problem. flowtrackd is “stateful”, meaning it determines whether a packet is part of a legitimate connection by tracking information about the other packets it has seen previously. The original Network Analytics design is incompatible with stateful systems like this, since that design made an assumption that the fate of a packet can be determined simply by looking at the bytes inside it.
Rethinking our approach
Rewriting a working system is not usually a good idea, but in this case it was necessary since the fundamental assumptions made by the old design were no longer true. When starting over with Network Analytics v2, it was clear to us that the new design not only needed to fix the deficiencies of the old design, it also had to be flexible enough to grow to support future products that we haven’t even thought of yet. To meet this high bar, we needed to really understand the core principles of network observability.
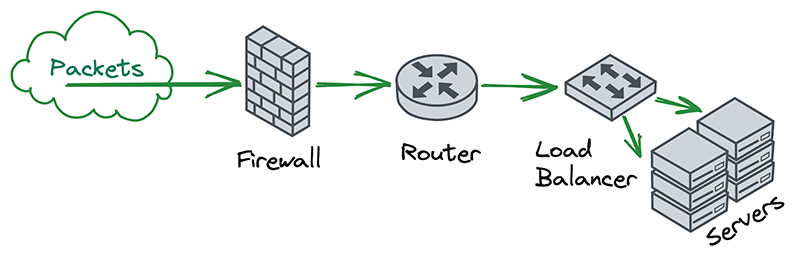
In the world of on-premise networks, packets typically chain through a series of appliances that each serve their own special purposes. For example, a packet may first pass through a firewall, then through a router, and then through a load balancer, before finally reaching the intended destination. The links in this chain can be thought of as independent “network functions”, each with some well-defined inputs and outputs.
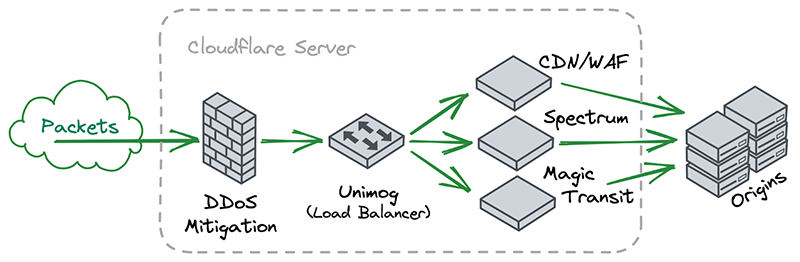
A key insight for us was that, if you squint a little, Cloudflare’s software architecture looks very similar to this. Each server receives packets and chains them through a series of independent and specialized software components that handle things like DDoS mitigation, firewalling, reverse proxying, etc.
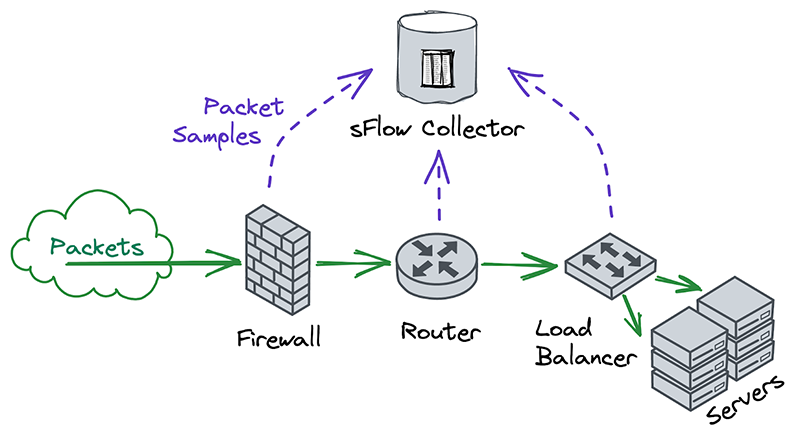
After noticing this similarity, we decided to explore how people with traditional networks monitor them. Universally, the answer is either Netflow or sFlow.
Nearly all on-premise hardware appliances can be configured to send a stream of Netflow or sFlow samples to a centralized flow collector. Traditional network operators tend to take these samples at many different points in the network, in order to monitor each device independently. This was different from our approach, which was to take packet samples only once, as soon as they entered the network and before performing any processing on them.
Another interesting thing we noticed was that Netflow and sFlow samples contain more than just information about packet contents. They also contain lots of metadata, such as the interface that packets entered and exited on, whether they were passed or dropped, which firewall or ACL rule they hit, and more. The metadata format is also extensible, so that devices can include information in their samples which might not make sense for other samples to contain. This flexibility allows flow collectors to offer rich reporting without necessarily having to understand the functions that each device performs on a network.
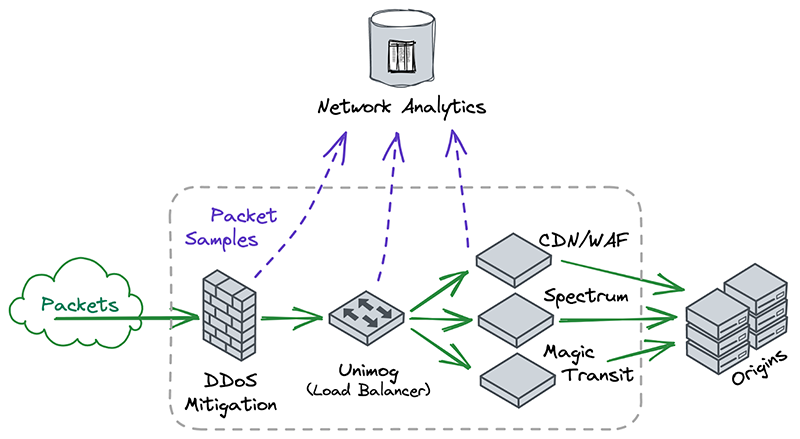
The more we thought about what kind of features and flexibility we wanted in an analytics system, the more we began to appreciate the elegance of traditional network monitoring. We realized that we could take advantage of the similarities between Cloudflare’s software architecture and “network functions” by having each software component emit its own packet samples with its own context-specific metadata attached.
Even though it seemed counterintuitive for our software to emit multiple streams of packet samples this way, we realized through taking inspiration from traditional network monitoring that doing so was exactly how we could build the extensible and future-proof observability that we needed.
Design & implementation
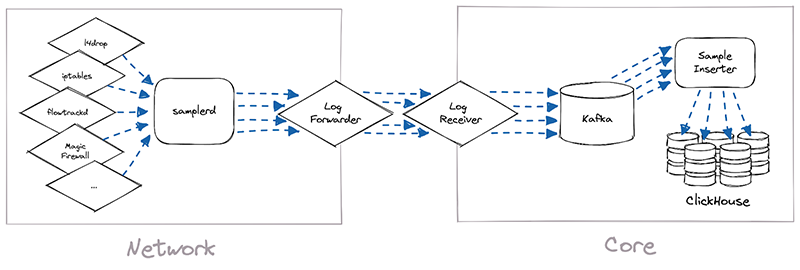
The implementation of Network Analytics v2 could be broken down into two separate pieces of work. First, we needed to build a new data pipeline that could receive packet samples from different sources, then normalize those samples and write them to long-term storage. We called this data pipeline samplerd – the “sampler daemon”.
The samplerd pipeline is relatively small and straightforward. It implements a few different interfaces that other software can use to send it metadata-rich packet samples. It then normalizes these samples and forwards them for postprocessing and insertion into a ClickHouse database.
The other, larger piece of work was to modify existing Cloudflare systems and make them send packet samples to samplerd. The rest of this post will cover a few interesting technical challenges that we had to overcome to adapt these systems to work with samplerd.
l4drop
The first system that incoming packets enter is our xdp daemon, called xdpd. In a few words, xdpd manages the installation of multiple XDP programs: a packet sampler, l4drop and L4LB. l4drop is where many types of attacks are mitigated. Mitigations done at this level are very cheap, because they happen so early in the network stack.
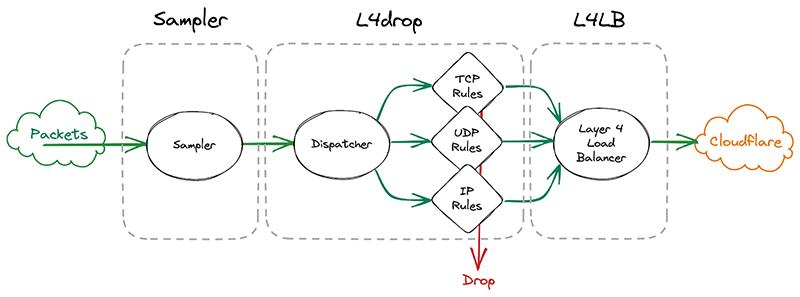
Before introducing samplerd, these XDP programs were organized like this:
An incoming packet goes through a sampler that will emit a packet sample for some packets. It then enters l4drop, a set of programs that will decide the fate of a particular packet. Finally, L4LB is in charge of layer 4 load balancing.
It’s critical that the samples are emitted even for packets that get dropped further down in the pipeline, because that provides visibility into what’s dropped. That’s useful both from a customer perspective to have a more comprehensive view in dashboards but also to continuously adapt our mitigations as attacks change.
In l4drop’s original configuration, a packet sample is emitted prior to the mitigation decision. Thus, that sample can’t record the mitigation action that’s taken on that particular packet.
samplerd wants packet samples to include the mitigation outcome and other metadata that indicates why a particular mitigation decision was taken. For instance, a packet may be dropped because it matched an attack mitigation signature. Or it may pass because it matched a rate limiting rule and it was under the threshold for that rule. All of this is valuable information that needs to be shown to customers.
Given this requirement, the first idea we had was to simply move the sampler after l4drop and have l4drop just mark the packet as “to be dropped”, along with metadata for the reason why. The sampler component would then have all the necessary details to emit a sample with the final fate of the packet and its associated metadata. After emitting the sample, the sampler would drop or pass the packet.
However, this requires copying all the metadata associated with the dropping decision for every single packet, whether it will be sampled or not. The cost of this copying proved prohibitive considering that every packet entering Cloudflare goes through the xdpd programs.
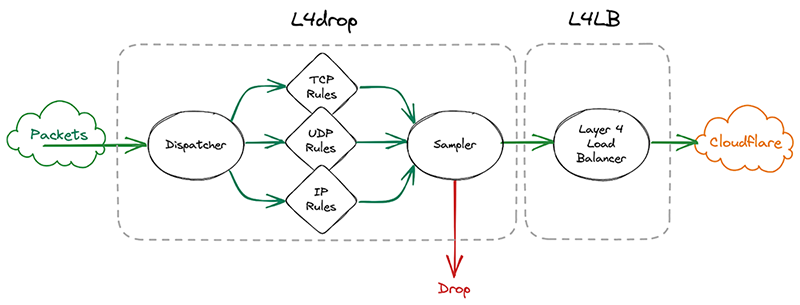
So we went back to the drawing board. What we actually need to know when making a sampling decision is whether we need to copy the metadata. We only need to copy the metadata if a particular packet will be sampled. That’s why it made sense to effectively split the sampler into two parts by sandwiching the programs that make the mitigation decision together. First, we make the mitigation decision, then we go through the mitigation decision programs. These programs can then decide to copy metadata only when a packet will be sampled. They will however always mark a packet with a DROP or PASS mark. Then the sampler will check the mark for sampling and the DROP/PASS mark. Based on those marks, they’ll build a sample if necessary and drop or pass the packet.
Given how tightly the sampler is now coupled with the rest of l4drop, it’s not a standalone part of xdpd anymore and the final result looks like this:
iptables
Another of our mitigation layers is iptables. We use it for some types of mitigations that we can’t perform in l4drop, like stateful connection tracking. iptables mitigations are organized as a list of rules that an incoming packet will be evaluated against. It’s also possible for a rule to jump to another rule when some conditions are met. Some of these rules will perform rate limiting, which will only drop packets beyond a certain threshold. For instance, we might drop all packets beyond a 10 packet-per-second threshold.
Prior to the introduction of samplerd, our typical rules would match on some characteristics of the packet – say, the IP and port – and make a decision whether to immediately drop or pass the packet.
To adapt our iptables rules to samplerd, we need to make them emit annotated samples, so that we can know why a decision was taken. To this end, one idea would be to just make the rules which drop packets also emit a nflog sample with a certain probability. One of the issues with that approach has to do with rate limiting rules. A packet may match such a rule, but the packet may be under the threshold and so that packet gets passed further down the line. That doesn’t work because we also want to sample those passed packets too, since it’s important for a customer to know what was passed and dropped by the rate limiter. But since a packet that passes the rate limiter may be dropped by further rules down the line, it’ll have multiple chances to be sampled, causing oversampling of some parts of the traffic. That would introduce statistical distortions in the sampled data.
To solve this, we can once again separate these steps like we did in l4drop, and make several sets of rules. First, the sampling decision is made by the first set of rules. Then, the pass-or-drop decision is made by the second set of rules. Finally, the sample can be emitted (if necessary), and then the packet can be passed or dropped by the third set of rules.
To communicate between rules we use Linux packet markings. For instance, a mark will be placed on a packet to signal that the packet will be sampled, and another mark will signify that the packet matched a particular rule and that it needs to be dropped.
For incoming packets, the rule in charge of the random sampling decision is evaluated first. Then the mitigation rules are evaluated next, in a specific order. When one of those rules decides to drop a packet, it jumps straight to the last set of rules, which will emit a sample if necessary before dropping. If no mitigation rule matches, eventually packets fall through to the last set of rules, where they will match a generic pass rule. That rule will emit a sample if necessary and pass the packet down the stack for further processing. By organizing rules in stages this way, we won’t ever double-sample packets.
ClickHouse & GraphQL
Once the samplerd daemon has the samples from the various mitigation systems, it does some light processing and ships those samples to be stored in ClickHouse. This inserter further enriches the metadata present in the sample, for instance by identifying the account associated with a particular destination IP. It also identifies ongoing attacks and adds a unique attack ID to each sample that is part of an attack.
We designed the inserters so that we’ll never need to change the data once it has been written, so that we can sustain high levels of insertion. Part of how we achieved this was by using ClickHouse’s MergeTree table engine. However, for improved performance, we have also used a less common ClickHouse table engine, called AggregatingMergeTree. Let’s dive into this using a simplified example.
Each packet sample is stored in a table that looks like the below:
Attack ID
Dest IP
Dest Port
…
Sample Interval (SI)
abcd
1.1.1.1
53
…
1000
abcd
1.0.0.1
53
…
1000
The sample interval is the number of packets that went through between two samples, as we are using ABR.
These tables are then queried through the GraphQL API, either directly or by the dashboard. This required us to build a view of all the samples for a particular attack, to identify (for example) a fixed destination IP. These attacks may span days or even weeks and so these queries could potentially be costly and slow. For instance, a naive query to know whether the attack “abcd” has a fixed destination port or IP may look like this:
SELECT if(uniq(dest_ip) == 1, any(dest_ip), NULL), if(uniq(dest_port) == 1, any(dest_port), NULL)
FROM samples
WHERE attack_id = ‘abcd’
In the above query, we ask ClickHouse for a lot more data than we should need. We only really want to know whether there is one value or multiple values, yet we ask for an estimation of the number of unique values. One way to know if all values are the same (for values that can be ordered) is to check whether the maximum value is equal to the minimum. So we could rewrite the above query as:
SELECT if(min(dest_ip) == max(dest_ip), any(dest_ip), NULL), if(min(dest_port) == max(dest_port), any(dest_port), NULL)
FROM samples
WHERE attack_id = ‘abcd’
And the good news is that storing the minimum or the maximum takes very little space, typically the size of the column itself, as opposed to keeping the state that uniq() might require. It’s also very easy to store and update as we insert. So to speed up that query, we have added a precomputed table with running minimum and maximum using the AggregatingMergeTree engine. This is the special ClickHouse table engine that can compute and store the result of an aggregate function on a particular key. In our case, we will use the attackID as the key to group on, like this:
Attack ID
min(Dest IP)
max(Dest IP)
min(Dest Port)
max(Dest Port)
…
sum(SI)
abcd
1.0.0.1
1.1.1.1
53
53
…
2000
Note: this can be generalized to many aggregating functions like sum(). The constraint on the function is that it gives the same result whether it’s given the whole set all at once or whether we apply the function to the value it returned on a subset and another value from the set.
Then the query that we run can be much quicker and simpler by querying our small aggregating table. In our experience, that table is roughly 0.002% of the original data size, although admittedly all columns of the original table are not present.
And we can use that to build a SQL view that would look like this for our example:
SELECT if(min_dest_ip == max_dest_ip, min_dest_ip, NULL), if(min_dest_port == max_dest_port, min_dest_port, NULL)
FROM aggregated_samples
WHERE attack_id = ‘abcd’
Attack ID
Dest IP
Dest Port
…
Σ
abcd
53
…
2000
Implementation detail: in practice, it is possible that a row in the aggregated table gets split on multiple partitions. In that case, we will have two rows for a particular attack ID. So in production we have to take the min or max of all the rows in the aggregating table. That’s usually only three to four rows, so it’s still much faster than going over potentially thousands of samples spanning multiple days. In practice, the query we use in production is thus closer to:
SELECT if(min(min_dest_ip) == max(max_dest_ip), min(min_dest_ip), NULL), if(min(min_dest_port) == max(max_dest_port), min(min_dest_port), NULL)
FROM aggregated_samples
WHERE attack_id = ‘abcd’
Takeaways
Rewriting Network Analytics was a bet that has paid off. Customers now have a more accurate and higher fidelity view of their network traffic. Internally, we can also now troubleshoot and fine tune our mitigation systems much more effectively. And as we develop and deploy new mitigation systems in the future, we are confident that we can adapt our reporting in order to support them.
Earlier today, April 25, 2023, researchers Pedro Umbelino at Bitsight and Marco Lux at Curesec published their discovery of CVE-2023-29552, a new DDoS reflection/amplification attack vector leveraging the SLP protocol. If you are a Cloudflare customer, your services are already protected from this new attack vector.
Service Location Protocol (SLP) is a “service discovery” protocol invented by Sun Microsystems in 1997. Like other service discovery protocols, it was designed to allow devices in a local area network to interact without prior knowledge of each other. SLP is a relatively obsolete protocol and has mostly been supplanted by more modern alternatives like UPnP, mDNS/Zeroconf, and WS-Discovery. Nevertheless, many commercial products still offer support for SLP.
Since SLP has no method for authentication, it should never be exposed to the public Internet. However, Umbelino and Lux have discovered that upwards of 35,000 Internet endpoints have their devices’ SLP service exposed and accessible to anyone. Additionally, they have discovered that the UDP version of this protocol has an amplification factor of up to 2,200x, which is the third largest discovered to-date.
Cloudflare expects the prevalence of SLP-based DDoS attacks to rise significantly in the coming weeks as malicious actors learn how to exploit this newly discovered attack vector.
Cloudflare customers are protected
If you are a Cloudflare customer, our automated DDoS protection system already protects your services from these SLP amplification attacks. To avoid being exploited to launch the attacks, if you are a network operator, you should ensure that you are not exposing the SLP protocol directly to the public Internet. You should consider blocking UDP port 427 via access control lists or other means. This port is rarely used on the public Internet, meaning it is relatively safe to block without impacting legitimate traffic. Cloudflare Magic Transit customers can use the Magic Firewall to craft and deploy such rules.
At Cloudflare, we’re used to being the fastest in the world. However, for approximately 30 minutes last December, Cloudflare was slow. Between 20:10 and 20:40 UTC on December 16, 2021, web requests served by Cloudflare were artificially delayed by up to five seconds before being processed. This post tells the story of how a missing shell option called “pipefail” slowed Cloudflare down.
Background
Before we can tell this story, we need to introduce you to some of its characters.
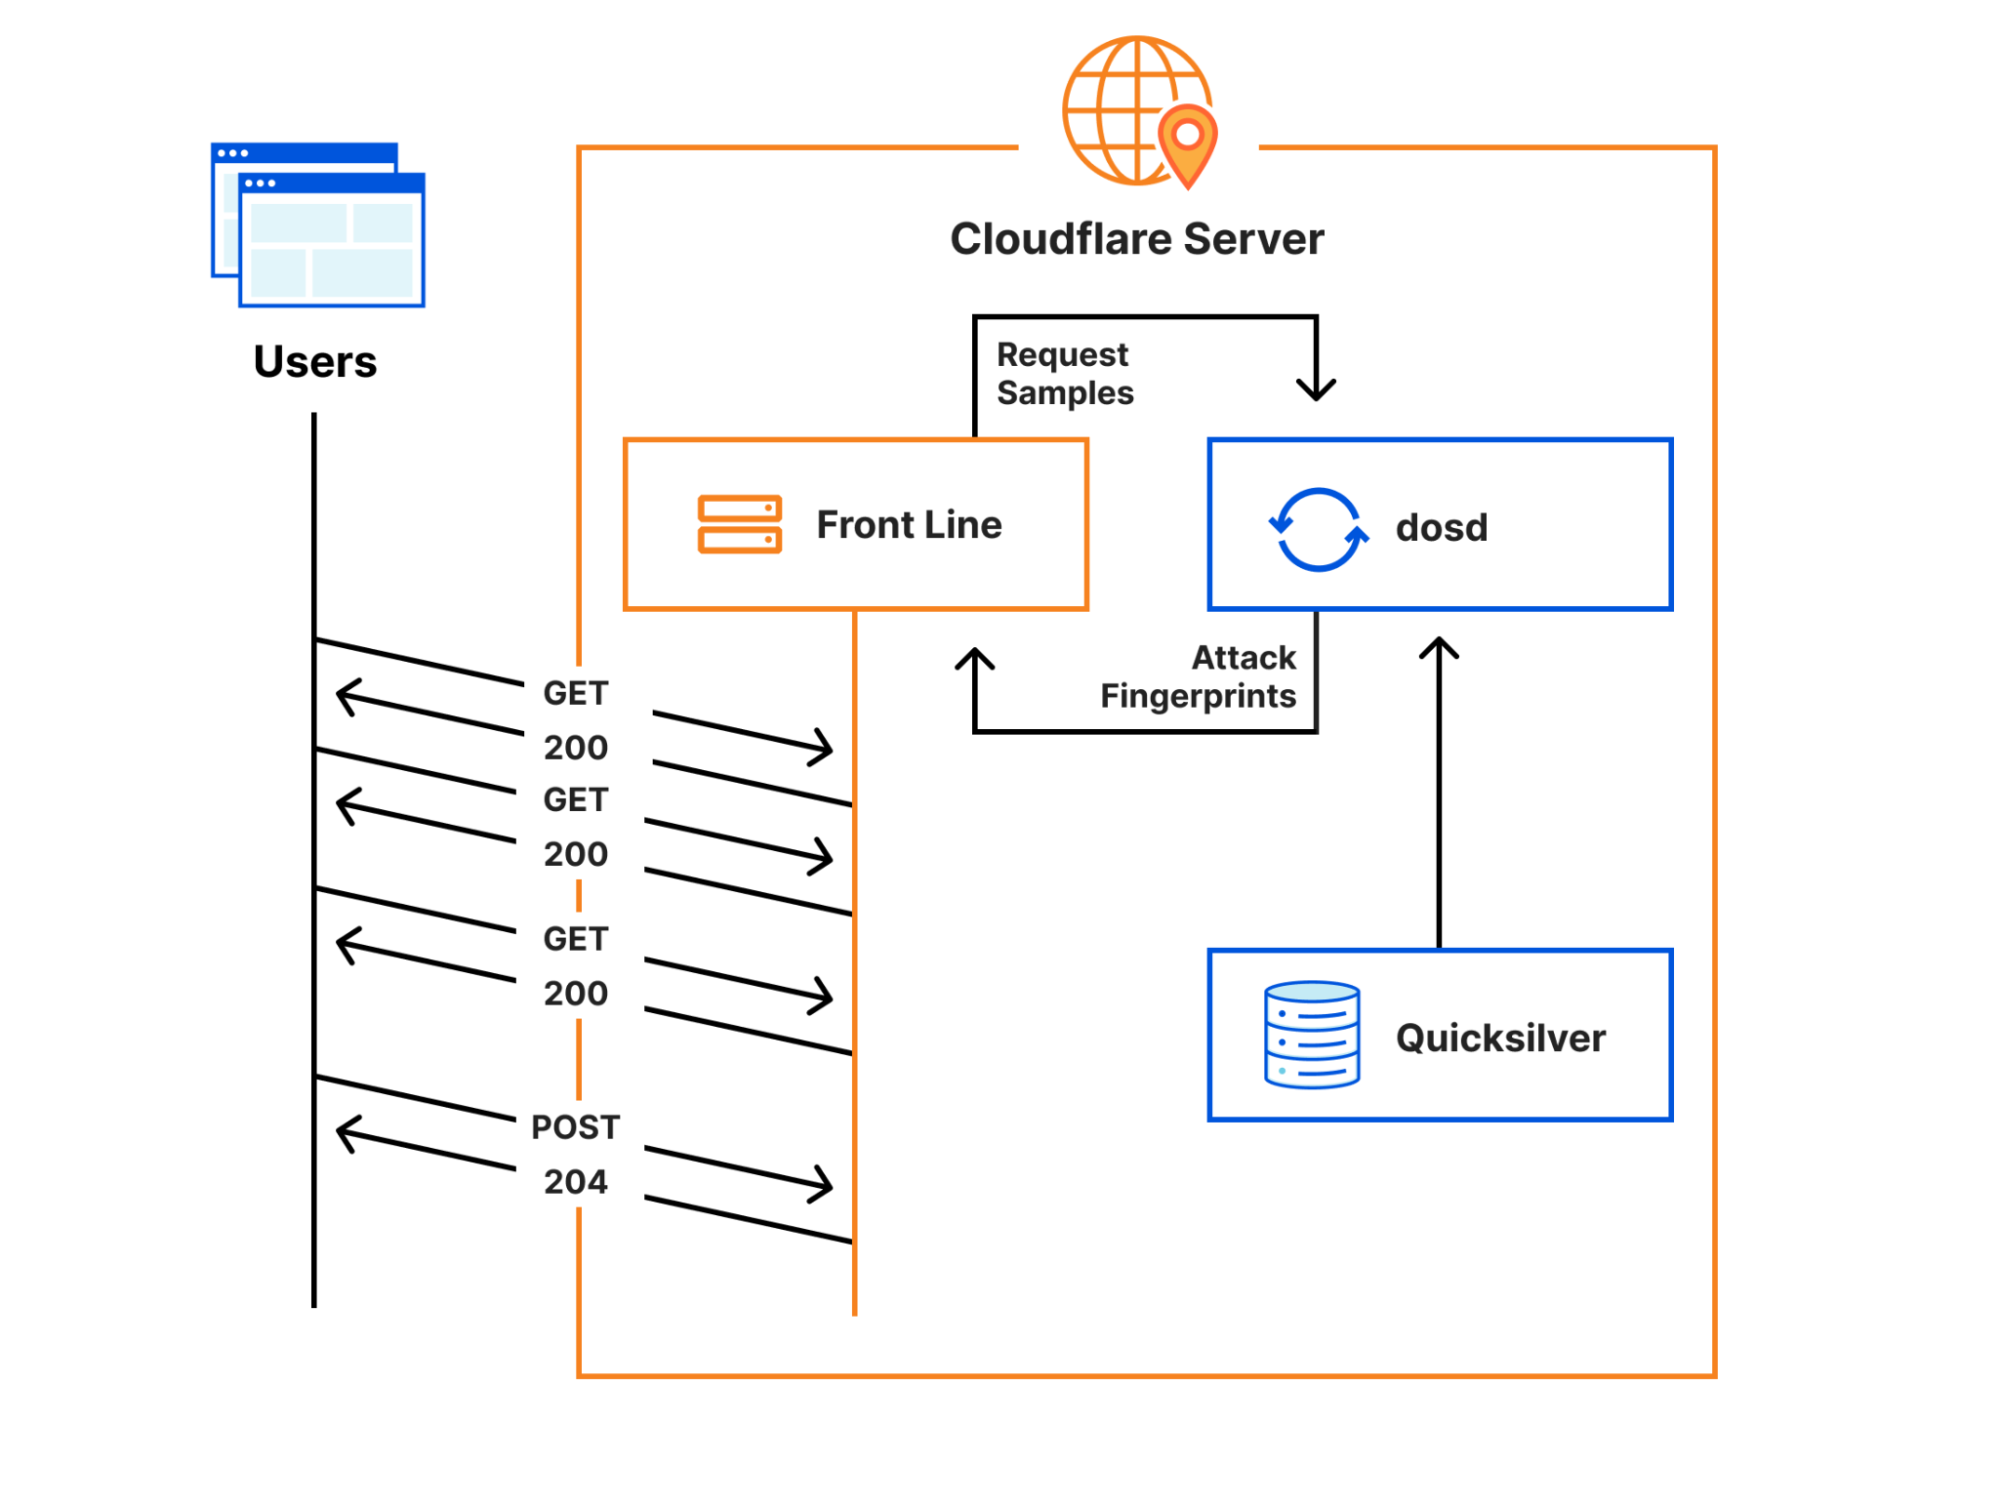
Cloudflare’s Front Line protects millions of users from some of the largest attacks ever recorded. This protection is orchestrated by a sidecar service called dosd, which analyzes traffic and looks for attacks. When dosd detects an attack, it provides Front Line with a list of attack fingerprints that describe how Front Line can match and block the attack traffic.
Instances of dosd run on every Cloudflare server, and they communicate with each other using a peer-to-peer mesh to identify malicious traffic patterns. This decentralized design allows dosd to perform analysis with much higher fidelity than is possible with a centralized system, but its scale also imposes some strict performance requirements. To meet these requirements, we need to provide dosd with very fast access to large amounts of configuration data, which naturally means that dosd depends on Quicksilver. Cloudflare developed Quicksilver to manage configuration data and replicate it around the world in milliseconds, allowing it to be accessed by services like dosd in microseconds.
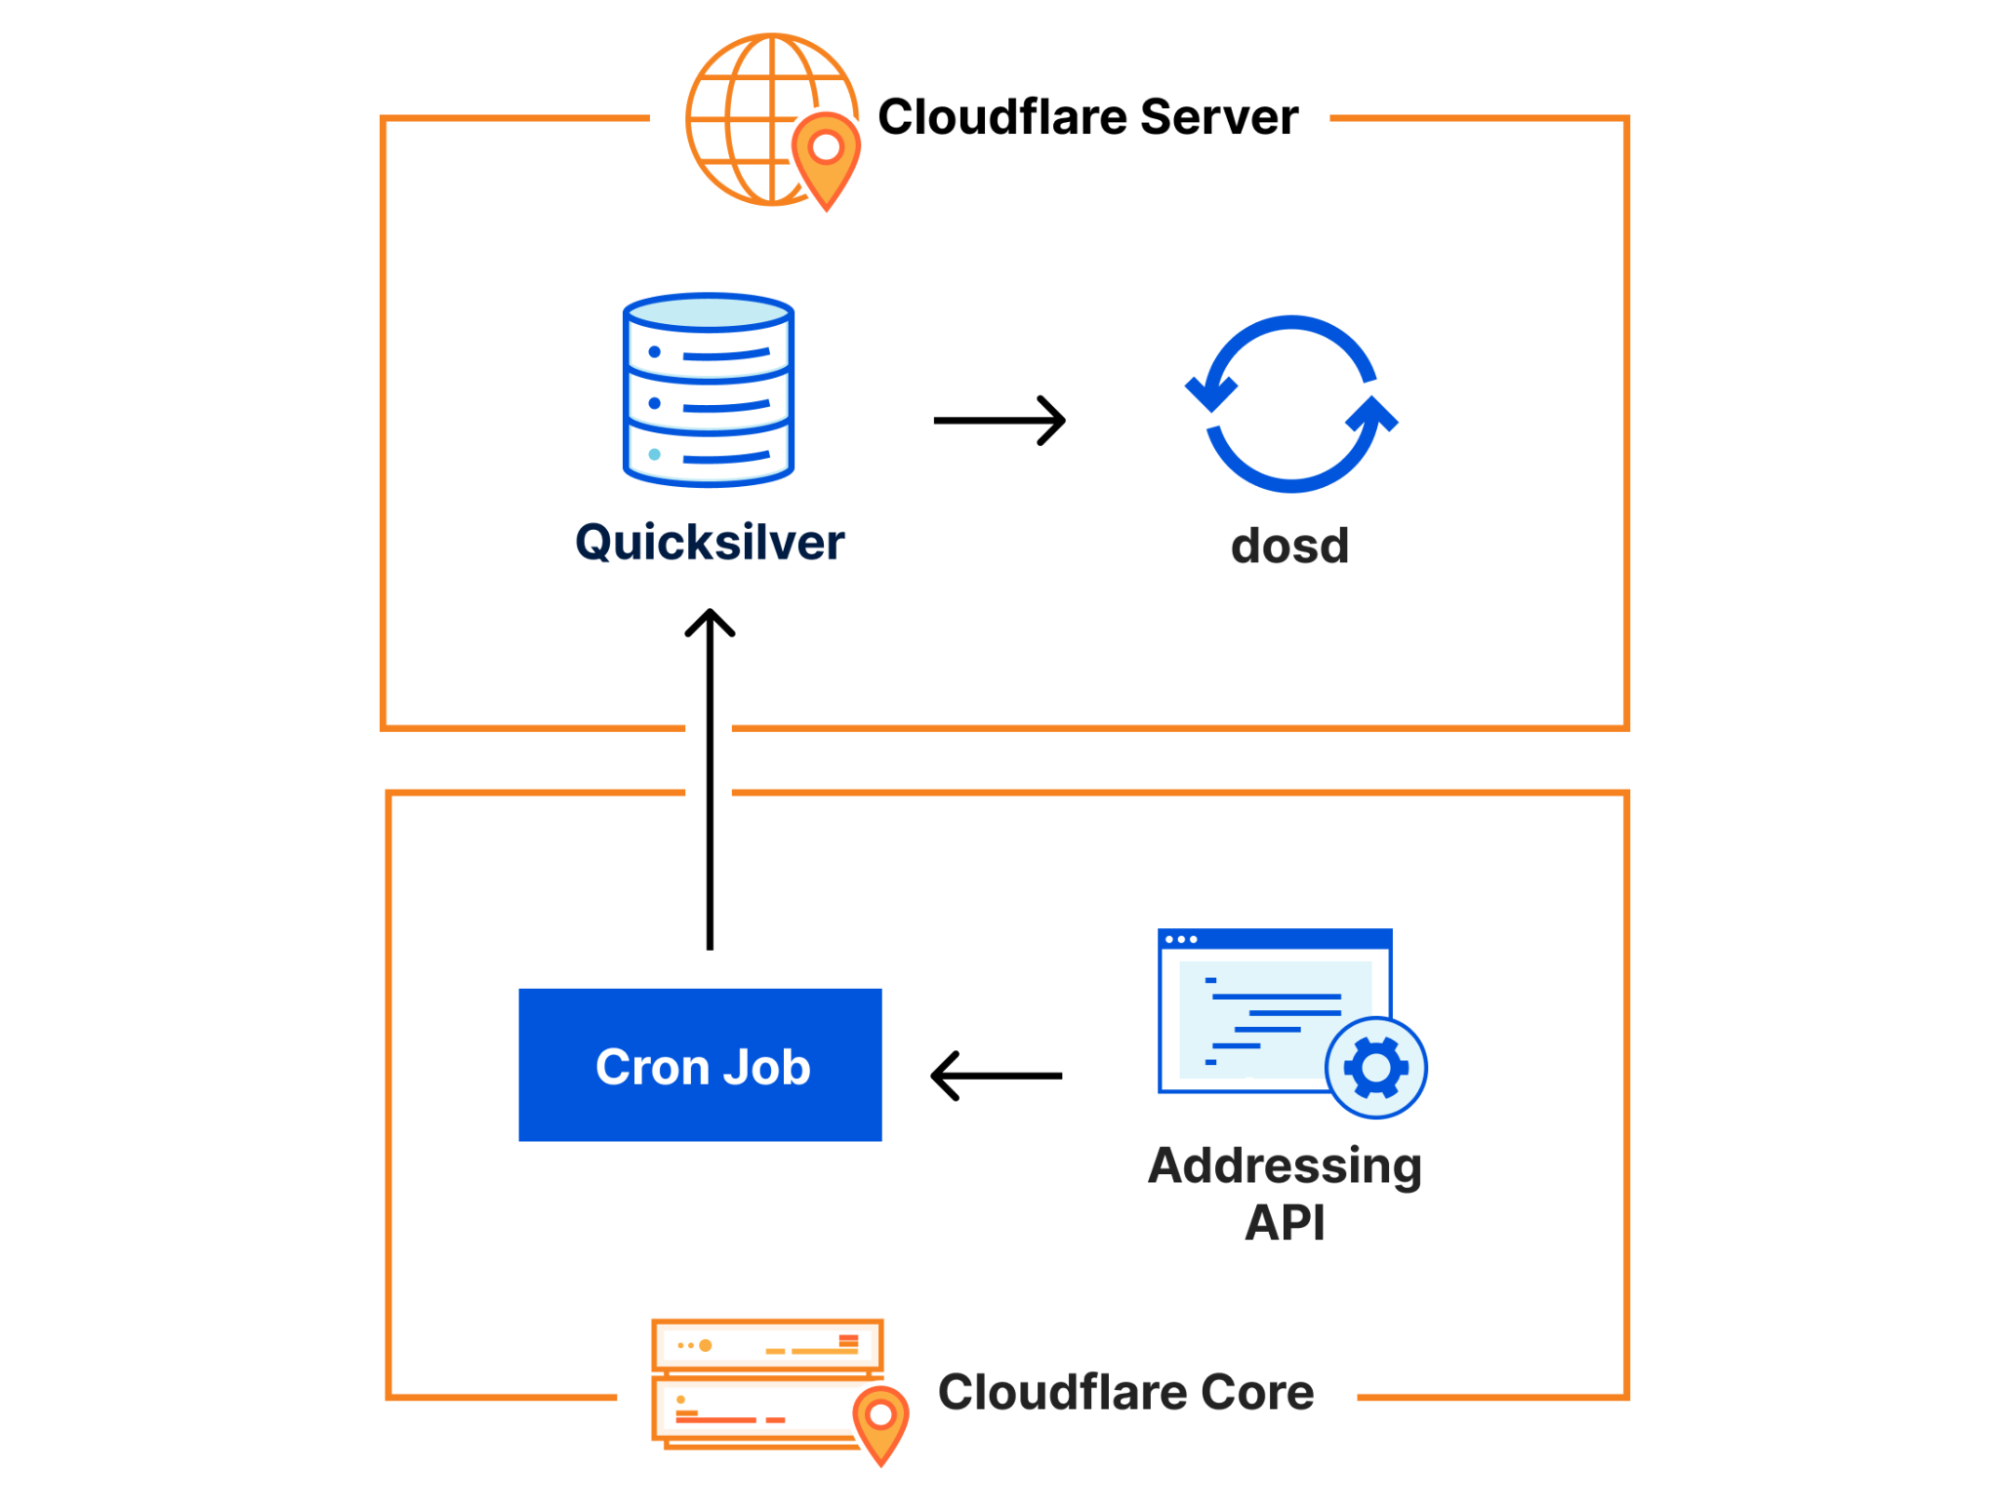
One piece of configuration data that dosd needs comes from the Addressing API, which is our authoritative IP address management service. The addressing data it provides is important because dosd uses it to understand what kind of traffic is expected on particular IPs. Since addressing data doesn’t change very frequently, we use a simple Kubernetes cron job to query it at 10 minutes past each hour and write it into Quicksilver, allowing it to be efficiently accessed by dosd.
With this context, let’s walk through the change we made on December 16 that ultimately led to the slowdown.
The Change
Approximately once a week, all of our Bug Fixes and Performance Improvements to the Front Line codebase are released to the network. On December 16, the Front Line team released a fix for a subtle bug in how the code handled compression in the presence of a Cache-Control: no-transform header. Unfortunately, the team realized pretty quickly that this fix actually broke some customers who had started depending on that buggy behavior, so the team decided to roll back the release and work with those customers to correct the issue.
Here’s a graph showing the progression of the rollback. While most releases and rollbacks are fully automated, this particular rollback needed to be performed manually due to its urgency. Since this was a manual rollback, SREs decided to perform it in two batches as a safety measure. The first batch went to our smaller tier 2 and 3 data centers, and the second batch went to our larger tier 1 data centers.
SREs started the first batch at 19:25 UTC, and it completed in about 30 minutes. Then, after verifying that there were no issues, they started the second batch at 20:10. That’s when the slowdown started.
The Slowdown
Within minutes of starting the second batch of rollbacks, alerts started firing. “Traffic levels are dropping.” “CPU utilization is dropping.” “A P0 incident has been automatically declared.” The timing could not be a coincidence. Somehow, a deployment of known-good code, which had been limited to a subset of the network and which had just been successfully performed 40 minutes earlier, appeared to be causing a global problem.
A P0 incident is an “all hands on deck” emergency, so dozens of Cloudflare engineers quickly began to assess impact to their services and test their theories about the root cause. The rollback was paused, but that did not fix the problem. Then, approximately 10 minutes after the start of the incident, my team – the DOS team – received a concerning alert: “dosd is not running on numerous servers.” Before that alert fired we had been investigating whether the slowdown was caused by an unmitigated attack, but this required our immediate attention.
Based on service logs, we were able to see that dosd was panicking because the customer addressing data in Quicksilver was corrupted in some way. Remember: the data in this Quicksilver key is important. Without it, dosd could not make correct choices anymore, so it refused to continue.
Once we realized that the addressing data was corrupted, we had to figure out how it was corrupted so that we could fix it. The answer turned out to be pretty obvious: the Quicksilver key was completely empty.
Following the old adage – “did you try restarting it?” – we decided to manually re-run the Kubernetes cron job that populates this key and see what happened. At 20:40 UTC, the cron job was manually triggered. Seconds after it completed, dosd started running again, and traffic levels began returning to normal. We confirmed that the Quicksilver key was no longer empty, and the incident was over.
The Aftermath
Despite fixing the problem, we still didn’t really understand what had just happened.
Why was the Quicksilver key empty?
It was urgent that we quickly figure out how an empty value was written into that Quicksilver key, because for all we knew, it could happen again at any moment.
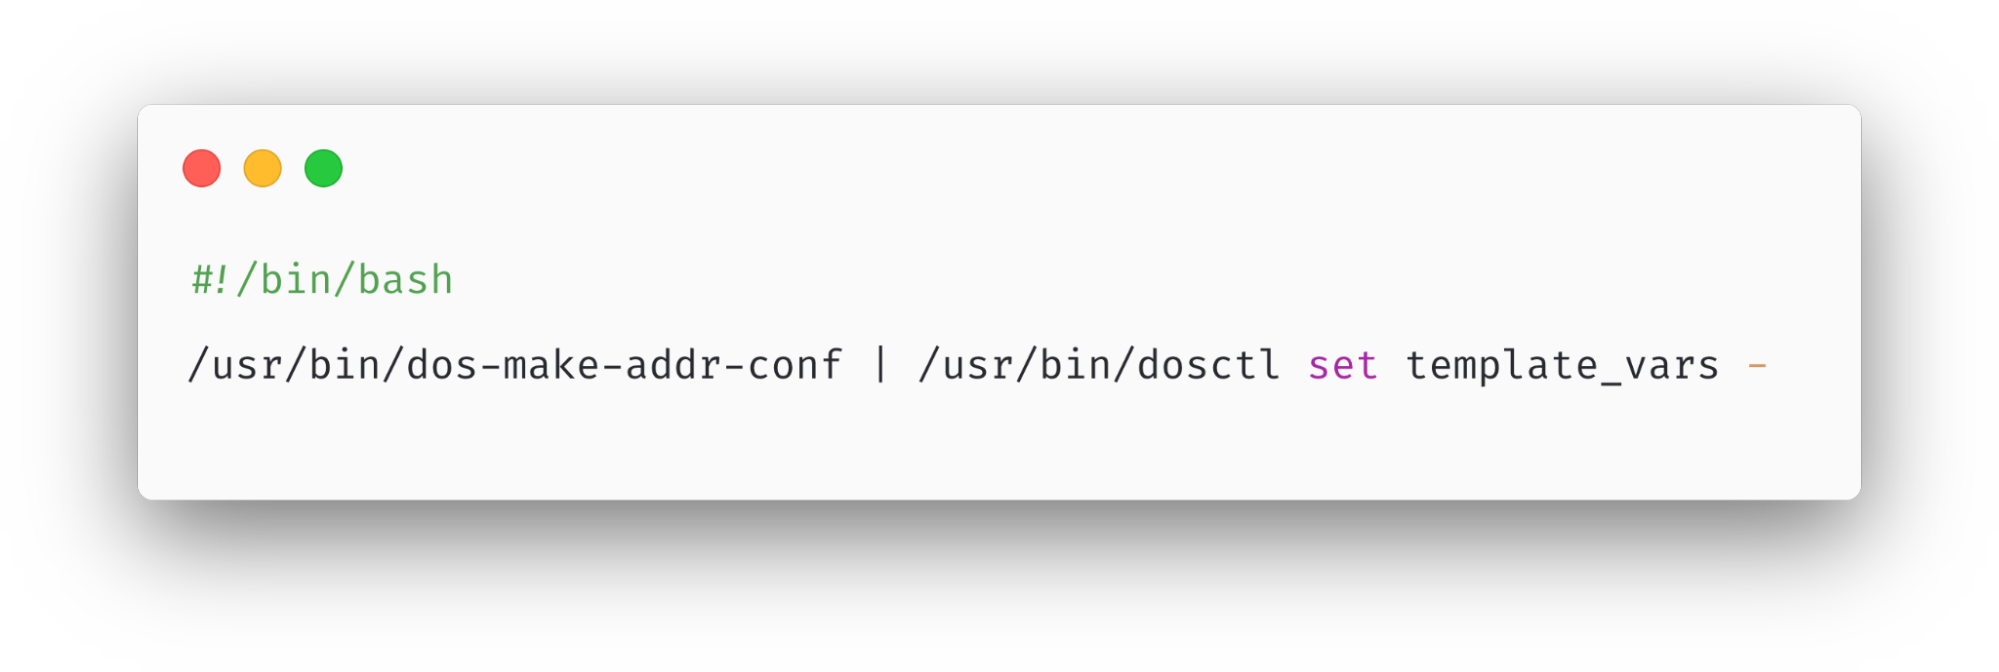
We started by looking at the Kubernetes cron job, which turned out to have a bug:
This cron job is implemented using a small Bash script. If you’re unfamiliar with Bash (particularly shell pipelining), here’s what it does:
First, the dos-make-addr-conf executable runs. Its job is to query the Addressing API for various bits of JSON data and serialize it into a Toml document. Afterward, that Toml is “piped” as input into the dosctl executable, whose job is to simply write it into a Quicksilver key called template_vars.
Can you spot the bug? Here’s a hint: what happens if dos-make-addr-conf fails for some reason and exits with a non-zero error code? It turns out that, by default, the shell pipeline ignores the error code and continues executing the next command! This means that the output of dos-make-addr-conf (which could be empty) gets unconditionally piped into dosctl and used as the value of the template_vars key, regardless of whether dos-make-addr-conf succeeded or failed.
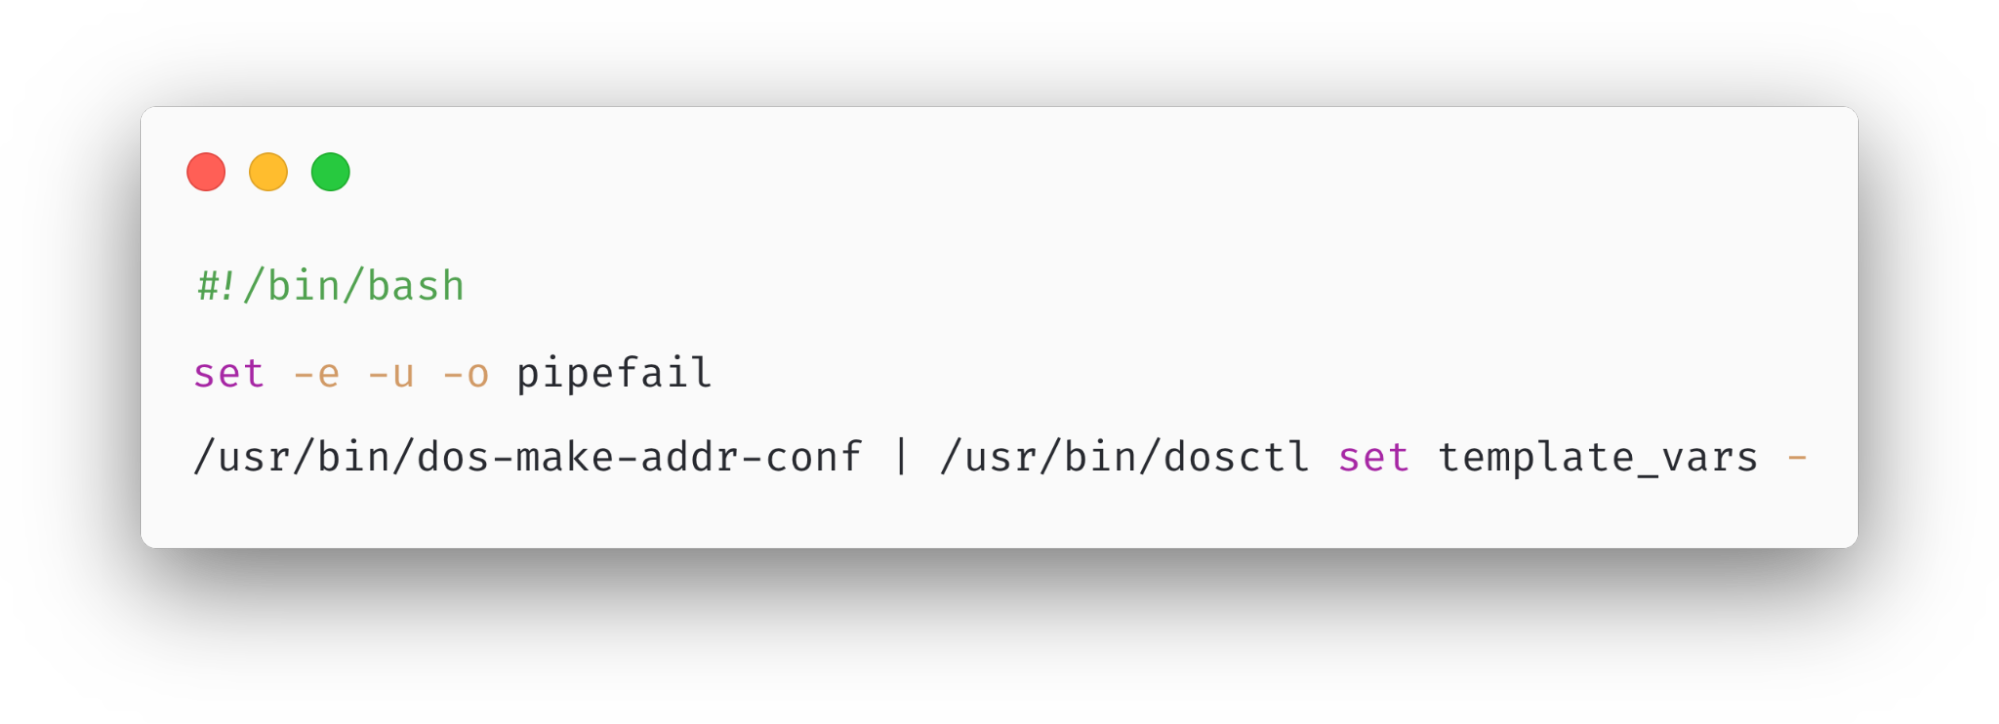
30 years ago, when the first users of Bourne shell were burned by this problem, a shell option called “pipefail” was introduced. Enabling this option changes the shell’s behavior so that, when any command in a pipeline series fails, the entire pipeline stops processing. However, this option is not enabled by default, so it’s widely recommended as best practice that all scripts should start by enabling this (and a few other) options.
Here’s the fixed version of that cron job:
This bug was particularly insidious because dosd actually did attempt to gracefully handle the case where this Quicksilver key contained invalid Toml. However, an empty string is a perfectly valid Toml document. If an error message had been accidentally written into this Quicksilver key instead of an empty string, then dosd would have rejected the update and continued to use the previous value.
Why did that cause the Front Line to slow down?
We had figured out how an empty key could be written into Quicksilver, and we were confident that it wouldn’t happen again. However, we still needed to untangle how that empty key caused such a severe incident.
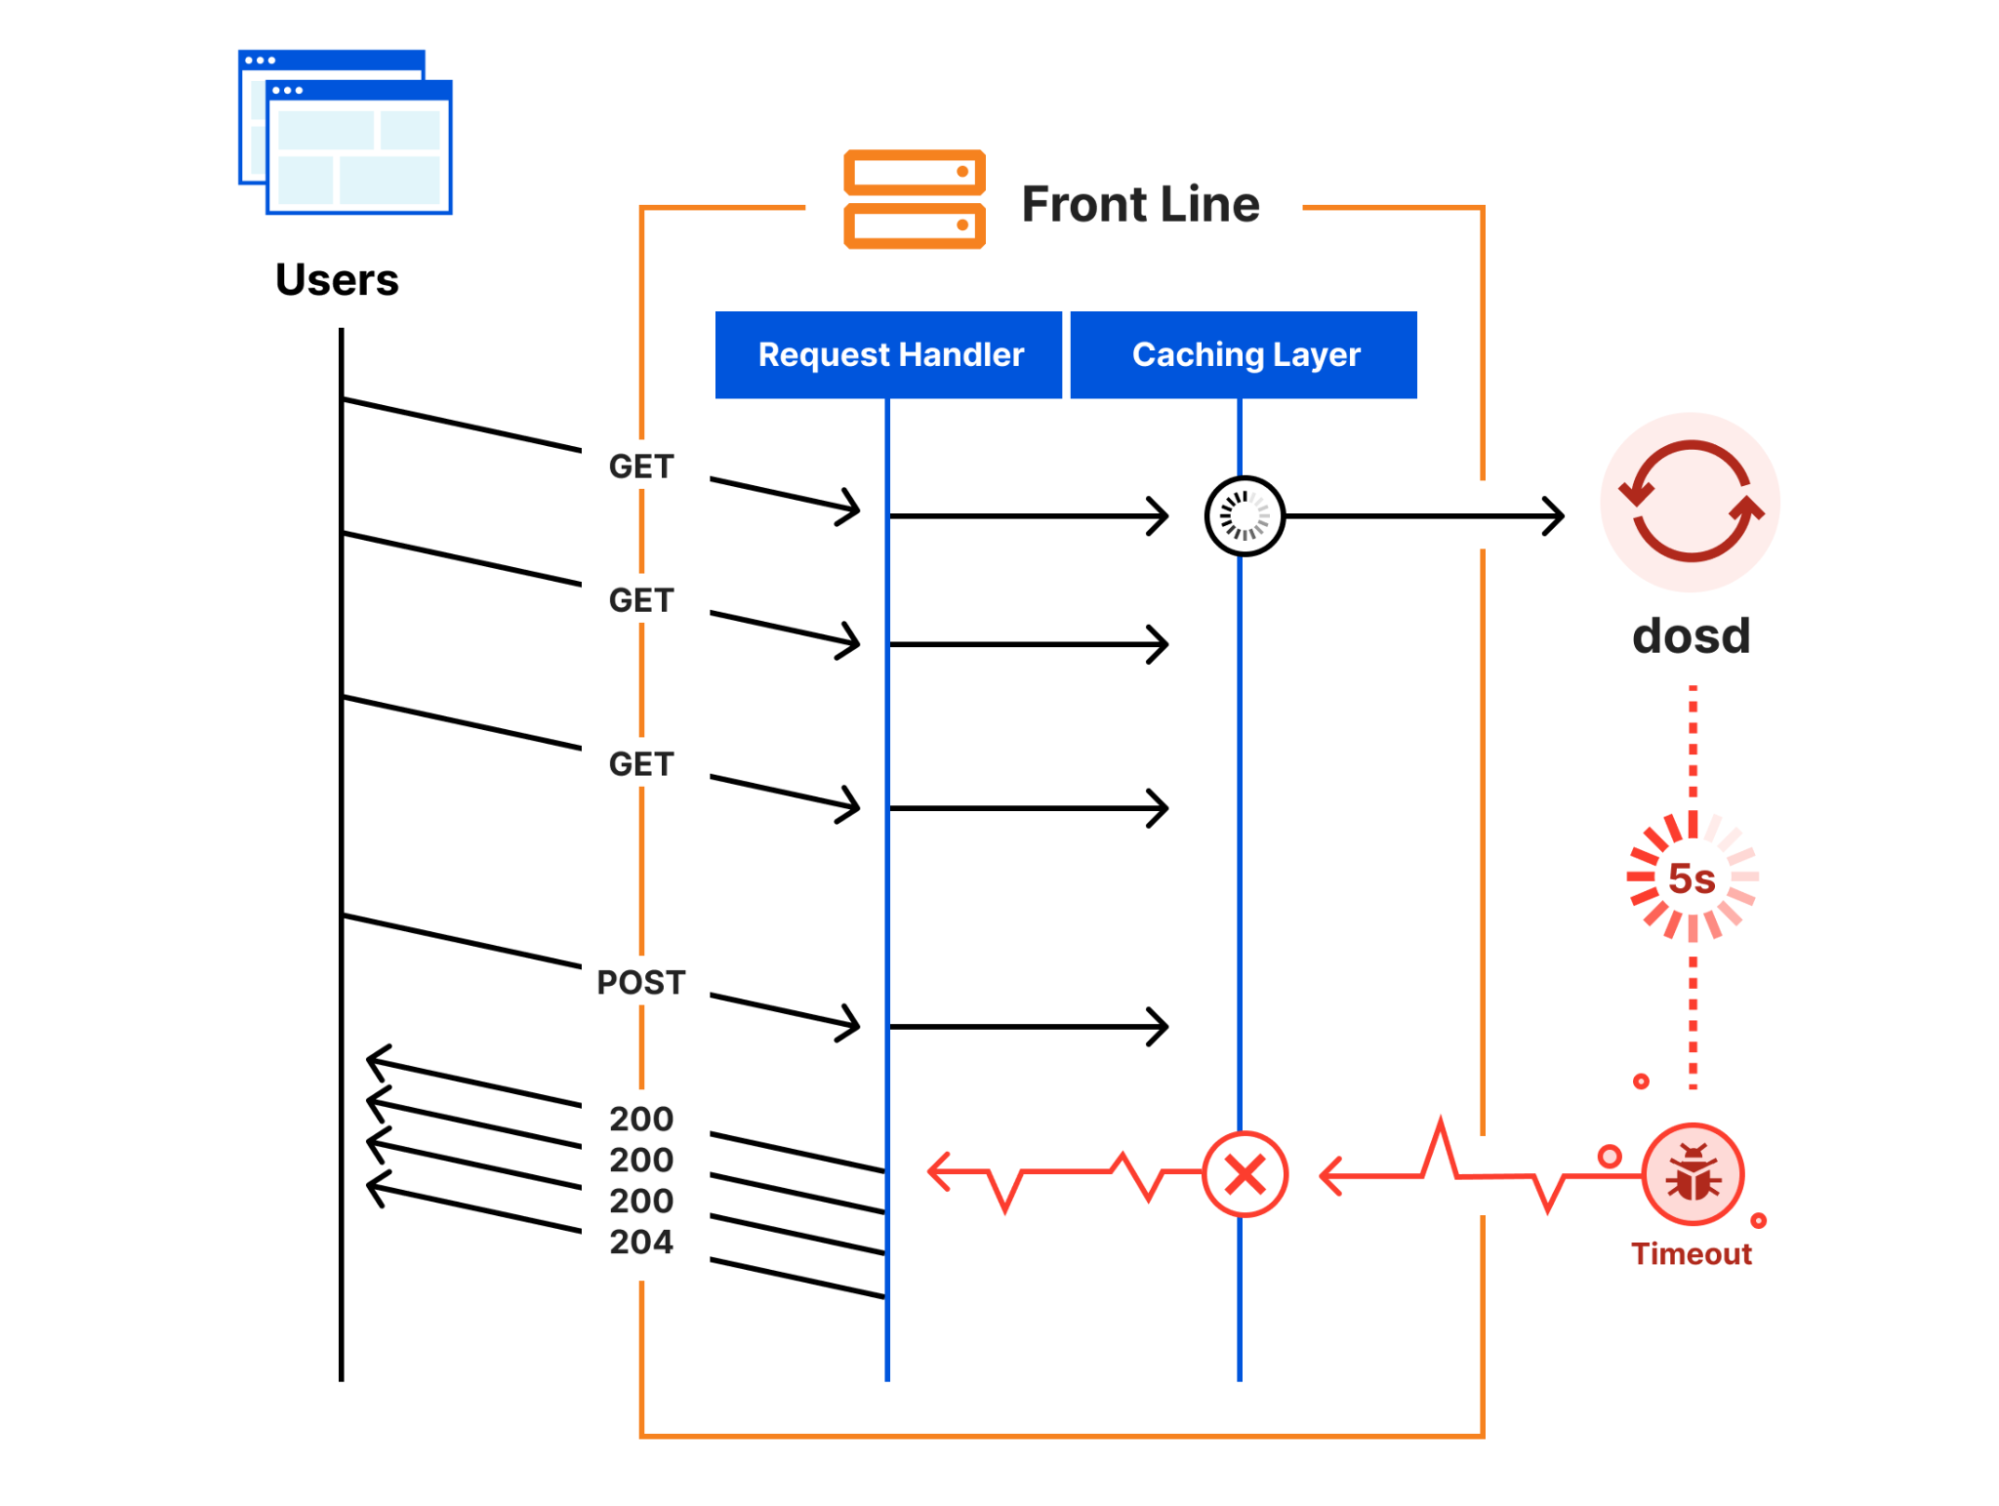
As I mentioned earlier, the Front Line relies on dosd to tell it how to mitigate attacks, but it doesn’t depend on dosd directly to serve requests. Instead, once every few seconds, the Front Line asynchronously asks dosd for new attack fingerprints and stores them in an in-memory cache. This cache is consulted while serving each request, and if dosd ever fails to provide fresh attack fingerprints, then the stale fingerprints will continue to be used instead. So how could this have caused the impact that we saw?
As part of the rollback process, the Front Line’s code needed to be reloaded. Reloading this code implicitly flushed the in-memory caches, including the attack fingerprint data from dosd. The next time that a request tried to consult with the cache, the caching layer realized that it had no attack fingerprints to return and a “cache miss” happened.
To handle a cache miss, the caching layer tried to reach out to dosd, and this is when the slowdown happened. While the caching layer was waiting for dosd to reply, it blocked all pending requests from progressing. Since dosd wasn’t running, the attempt eventually timed out after five seconds when the caching layer gave up. But in the meantime, each pending request was stuck waiting for the timeout to happen. Once it did, all the pending requests that were queued up over the five-second timeout period became unblocked and were finally allowed to progress. This cycle repeated over and over again every five seconds on every server until the dosd failure was resolved.
To trigger this slowdown, not only did dosd have to fail, but the Front Line’s in-memory cache had to also be flushed at the same time. If dosd had failed, but the Front Line’s cache had not been flushed, then the stale attack fingerprints would have remained in the cache and request processing would not have been impacted.
Why didn’t the first rollback cause this problem?
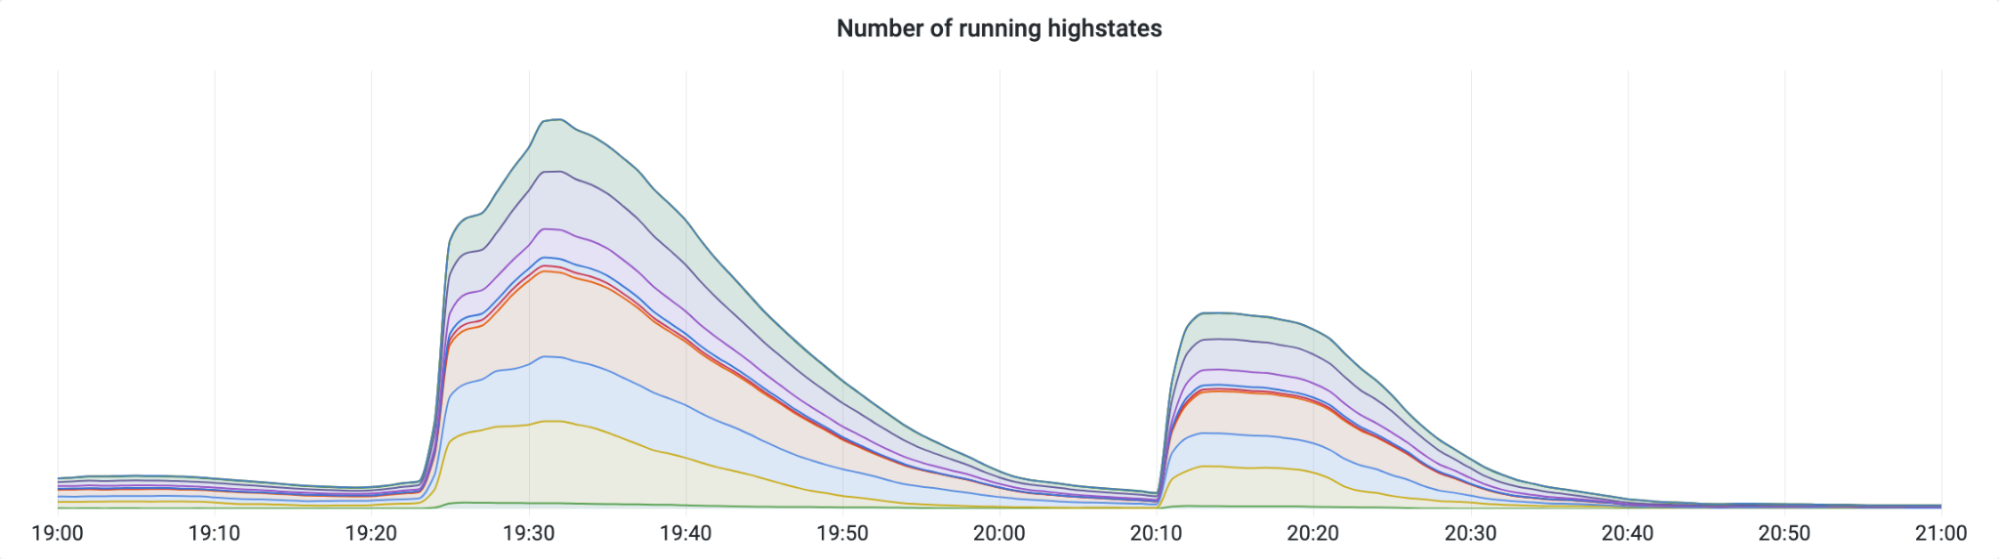
These two batches of rollbacks were performed by forcing servers to run a Salt highstate. When each batch was executed, thousands of servers began running highstates at the same time. The highstate process involves, among other things, contacting the Addressing API in order to retrieve various bits of customer addressing information.
The first rollback started at 19:25 UTC, and the second rollback started 45 minutes later at 20:10. Remember how I mentioned that our Kubernetes cron job only runs on the 10th minute of every hour? At 21:10 – exactly the time that our cron job started executing – thousands of servers also began to highstate, flooding the Addressing API with requests. All of these requests were queued up and eventually served, but it took the Addressing API a few minutes to work through the backlog. This delay was long enough to cause our cron job to time out, and, due to the “pipefail” bug, inadvertently clobber the Quicksilver key that it was responsible for updating.
To trigger the “pipefail” bug, not only did we have to flood the Addressing API with requests, we also had to do it at exactly 10 minutes after the hour. If SREs had started the second batch of rollbacks a few minutes earlier or later, this bug would have continued to lay dormant.
Lessons Learned
This was a unique incident where a chain of small or unlikely failures cascaded into a severe and painful outage that we deeply regret. In response, we have hardened each link in the chain:
A manual rollback inadvertently triggered the thundering herd problem, which overwhelmed the Addressing API. We have since significantly scaled out the Addressing API, so that it can handle high request rates if it ever again has to.
An error in a Kubernetes cron job caused invalid data to be written to Quicksilver. We have since made sure that, when this cron job fails, it is no longer possible for that failure to clobber the Quicksilver key.
dosd did not correctly handle all possible error conditions when loading configuration data from Quicksilver, causing it to fail. We have since taken these additional conditions into account where necessary, so that dosd will gracefully degrade in the face of corrupt Quicksilver data.
The Front Line had an unexpected dependency on dosd, which caused it to fail when dosd failed. We have since removed all such dependencies, and the Front Line will now gracefully survive dosd failures.
More broadly, this incident has served as an example to us of why code and systems must always be resilient to failure, no matter how unlikely that failure may seem.
Beginning in mid-February 2022, security researchers, network operators, and security vendors observed a spike in DDoS attacks sourced from UDP port 10074 targeting broadband access ISPs, financial institutions, logistics companies, and organizations in other vertical markets.
Upon further investigation, it was determined that the devices abused to launch these attacks are MiCollab and MiVoice Business Express collaboration systems produced by Mitel, which incorporate TP-240 VoIP- processing interface cards and supporting software; their primary function is to provide Internet-based site-to-site voice connectivity for PBX systems.
Approximately 2600 of these systems have been incorrectly provisioned so that an unauthenticated system test facility has been inadvertently exposed to the public Internet, allowing attackers to leverage these PBX VoIP gateways as DDoS reflectors/amplifiers.
Mitel is aware that these systems are being abused to facilitate high-pps (packets-per-second) DDoS attacks, and have been actively working with customers to remediate abusable devices with patched software that disables public access to the system test facility.
In this blog, we will further explore the observed activity, explain how the driver has been abused, and share recommended mitigation steps. This research was created cooperatively among a team of researchers from Akamai SIRT, Cloudflare, Lumen Black Lotus Labs, NETSCOUT ASERT, TELUS, Team Cymru, and The Shadowserver Foundation.
DDoS attacks in the wild
While spikes of network traffic associated with the vulnerable service were observed on January 8th and February 7,th 2022, we believe the first actual attacks leveraging the exploit began on February 18th.
Observed attacks were primarily predicated on packets-per-second, or throughput, and appeared to be UDP reflection/amplification attacks sourced from UDP/10074 that were mainly directed towards destination ports UDP/80 and UDP/443. The single largest observed attack of this type preceding this one was approximately 53 Mpps and 23 Gbps. The average packet size for that attack was approximately 60 bytes, with an attack duration of approximately 5 minutes. The amplified attack packets are not fragmented.
This particular attack vector differs from most UDP reflection/amplification attack methodologies in that the exposed system test facility can be abused to launch a sustained DDoS attack of up to 14 hours in duration by means of a single spoofed attack initiation packet, resulting in a record-setting packet amplification ratio of 4,294,967,296:1. A controlled test of this DDoS attack vector yielded more than 400 Mmpps of sustained DDoS attack traffic.
It should be noted that this single-packet attack initiation capability has the effect of precluding network operator traceback of the spoofed attack initiator traffic. This helps mask the attack traffic generation infrastructure, making it less likely that the attack origin can be traced compared with other UDP reflection/amplification DDoS attack vectors.
Abusing the tp240dvr driver
The abused service on affected Mitel systems is called tp240dvr (“TP-240 driver”) and appears to run as a software bridge to facilitate interactions with TDM/VoIP PCI interface cards. The service listens for commands on UDP/10074 and is not meant to be exposed to the Internet, as confirmed by the manufacturer of these devices. It is this exposure to the Internet that ultimately allows it to be abused.
The tp240dvr service exposes an unusual command that is designed to stress-test its clients in order to facilitate debugging and performance testing. This command can be abused to cause the tp240dvr service to send this stress-test to attack victims. The traffic consists of a high rate of short informative status update packets that can potentially overwhelm victims and cause the DDoS scenario.
This command can also be abused by attackers to launch very high-throughput attacks. Attackers can use specially-crafted commands to cause the tp240dvr service to send larger informative status update packets, significantly increasing the amplification ratio.
By extensively testing isolated virtual TP-240-based systems in a lab setting, researchers were able to cause these devices to generate massive amounts of traffic in response to comparatively small request payloads. We will cover this attack scenario in greater technical depth in the following sections.
Calculating the potential attack impact
As previously mentioned, amplification via this abusable test facility differs substantially from how it is accomplished with most other UDP reflection/amplification DDoS vectors. Typically, reflection/amplification attacks require the attacker to continuously transmit malicious payloads to abusable nodes for as long as they wish to attack the victim. In the case of TP-240 reflection/amplification, this continuous transmission is not necessary to launch high-impact DDoS attacks.
Instead, an attacker leveraging TP-240 reflection/amplification can launch a high-impact DDoS attack using a single packet. Examination of the tp240dvr binary reveals that, due to its design, an attacker can theoretically cause the service to emit 2,147,483,647 responses to a single malicious command. Each response generates two packets on the wire, leading to approximately 4,294,967,294 amplified attack packets being directed toward the attack victim.
For each response to a command, the first packet contains a counter that increments with each sent response. As the counter value increments, the size of this first packet will grow from 36 bytes to 45 bytes. The second packet contains diagnostic output from the function, which can be influenced by the attacker. By optimizing each initiator packet to maximize the size of the second packet, every command will result in amplified packets that are up to 1,184 bytes in length.
In theory, a single abusable node generating the upper limit of 4,294,967,294 packets at a rate of 80kpps would result in an attack duration of roughly 14 hours. Over the course of the attack, the “counter” packets alone would generate roughly 95.5GB of amplified attack traffic destined for the targeted network. The maximally-padded “diagnostic output” packets would account for an additional 2.5TB of attack traffic directed towards the target.
This would yield a sustained flood of just under 393mb/sec of attack traffic from a single reflector/amplifier, all resulting from a single spoofed attack initiator packet of only 1,119 bytes in length. This results in a nearly unimaginable amplification ratio of 2,200,288,816:1 — a multiplier of 220 billion percent, triggered by a single packet.
Upper boundaries of attack volume and simultaneity
The tp240dvr service processes commands using a single thread. This means they can only process a single command at a time, and thus can only be used to launch one attack at a time. In the example scenario presented above, during the 14 hours that the abused device would be attacking the target, it cannot be leveraged to attack any other target. This is somewhat unique in the context of DDoS reflection/amplification vectors.
Although this characteristic also causes the tp240dvr service to be unavailable to legitimate users, it is much preferable to having these devices be leveraged in parallel by multiple attackers — and leaving legitimate operators of these systems to wonder why their outbound Internet data capacity is being consumed at much higher rates.
Additionally, it appears these devices are on relatively low-powered hardware, in terms of their traffic-generation capabilities. On an Internet where 100/Gbps links, dozens of CPU cores, and multi-threading capabilities have become commonplace, we can all be thankful this abusable service is not found on top-of-the-line hardware platforms capable of individually generating millions of packets per second, and running with thousands of parallelized threads.
Lastly, it is also good news that of the tens of thousands of these devices, which have been purchased and deployed historically by governments, commercial enterprises, and other organizations worldwide, a relatively small number of them have been configured in a manner that leaves them in this abusable state, and of those, many have been properly secured and taken offline from an attacker’s perspective.
Collateral impact
The collateral impact of TP-240 reflection/amplification attacks is potentially significant for organizations with Internet-exposed Mitel MiCollab and MiVoice Business Express collaboration systems that are abused as DDoS reflectors/amplifiers.
This may include partial or full interruption of voice communications through these systems, as well as additional service disruption due to transit capacity consumption, state-table exhaustion of NATs, and stateful firewalls, etc.
Wholesale filtering of all UDP/10074-sourced traffic by network operators may potentially overblock legitimate Internet traffic, and is therefore contraindicated.
Recommended actions
TP-240 reflection/amplification DDoS attacks are sourced from UDP/10074 and destined for the UDP port of the attacker’s choice. This amplified attack traffic can be detected, classified, traced back, and safely mitigated using standard DDoS defense tools and techniques.
Flow telemetry and packet capture via open-source and commercial analysis systems can alert network operators and end customers of TP-240 reflection/amplification attacks.
Network access control lists (ACLs), flowspec, destination-based remotely triggered blackhole (D/RTBH), source-based remotely triggered blackhole (S/RTBH), and intelligent DDoS mitigation systems can be used to mitigate these attacks.
Network operators should perform reconnaissance to identify and facilitate remediation of abusable TP-240 reflectors/amplifiers on their networks and/or the networks of their customers. Operators of Mitel MiCollab and MiVoice Business Express collaboration systems should proactively contact Mitel in order to receive specific remediation instructions from the vendor.
Organizations with business-critical public-facing Internet properties should ensure that all relevant network infrastructure, architectural, and operational Best Current Practices (BCPs) have been implemented, including situationally specific network access policies that only permit Internet traffic via required IP protocols and ports. Internet access network traffic to/from internal organizational personnel should be isolated from Internet traffic to/from public-facing Internet properties, and served via separate upstream Internet transit links.
DDoS defenses for all public-facing Internet properties and supporting infrastructure should be implemented in a situationally appropriate manner, including periodic testing to ensure that any changes to the organization’s servers/services/applications are incorporated into its DDoS defense plan.
It is imperative that organizations operating mission-critical public-facing Internet properties and/or infrastructure ensure that all servers/services/application/datastores/infrastructure elements are protected against DDoS attack, and are included in periodic, realistic tests of the organization’s DDoS mitigation plan. Critical ancillary supporting services such as authoritative and recursive DNS servers must be included in this plan.
Network operators should implement ingress and egress source address validation in order to prevent attackers from initiating reflection/amplification DDoS attacks.
All potential DDoS attack mitigation measures described in this document MUST be tested and customized in a situationally appropriate manner prior to deployment on production networks.
Mitigating factors
Operators of Internet-exposed TP-240-based Mitel MiCollab and MiVoice Business Express collaboration systems can prevent abuse of their systems to launch DDoS attacks by blocking incoming Internet traffic destined for UDP/10074 via access control lists (ACLs), firewall rules, and other standard network access control policy enforcement mechanisms.
Mitel have provided patched software versions that prevent TP-240-equipped MiCollab and MiVoice Business Express collaboration systems from being abused as DDoS reflectors/amplifiers by preventing exposure of the service to the Internet. Mitel customers should contact the vendor for remediation instructions.
Collateral impact to abusable TP-240 reflectors/amplifiers can alert network operators and/or end-customers to remove affected systems from “demilitarized zone” (DMZ) networks or Internet Data Centers (IDCs), or to disable relevant UDP port-forwarding rules that allow specific UDP/10074 traffic sourced from the public Internet to reach these devices, thereby preventing them from being abused to launch reflection/amplification DDoS attacks.
The amplified attack traffic is not fragmented, so there is no additional attack component consisting of non-initial fragments, as is the case with many other UDP reflection/amplification DDoS vectors.
Implementation of ingress and egress source-address validation (SAV; also known as anti-spoofing) can prevent attackers from launching reflection/amplification DDoS attacks.
Conclusion
Unfortunately, many abusable services that should not be exposed to the public Internet are nevertheless left open for attackers to exploit. This scenario is yet another example of real-world deployments not adhering to vendor guidance. Vendors can prevent this situation by adopting “safe by default” postures on devices before shipping.
Reflection/amplification DDoS attacks would be impossible to launch if all network operators implemented ingress and egress source-address validation (SAV, also known as anti-spoofing). The ability to spoof the IP address(es) of the intended attack target(s) is required to launch such attacks. Service providers must continue to implement SAV in their own networks, and require that their downstream customers do so.
As is routinely the case with newer DDoS attack vectors, it appears that after an initial period of employment by advanced attackers with access to bespoke DDoS attack infrastructure, TP-240 reflection/amplification has been weaponized and added to the arsenals of so-called “booter/stresser” DDoS-for-hire services, placing it within the reach of the general attacker population.
Collaboration across the operational, research, and vendor communities is central to the continued viability of the Internet. The quick response to and ongoing remediation of this high-impact DDoS attack vector has only been possible as a result of such collaboration. Organizations with a vested interest in the stability and resiliency of the Internet should embrace and support cross-industry cooperative efforts as a core principle.
The combined efforts of the research and mitigation task force demonstrates that successful collaboration across industry peers to quickly remediate threats to availability and resiliency is not only possible, but is also increasingly critical for the continued viability of the global Internet.
In particular, the Mitigation Task Force would like to cite Mitel for their exemplary cooperation, rapid response, and ongoing participation in remediation efforts. Mitel quickly created and disseminated patched software, worked with their customers and partners to update affected systems, and supplied valuable expertise as the Task Force worked to formulate this document.
The collective thoughts of the interwebz
Manage Consent
To provide the best experiences, we use technologies like cookies to store and/or access device information. Consenting to these technologies will allow us to process data such as browsing behavior or unique IDs on this site. Not consenting or withdrawing consent, may adversely affect certain features and functions.
Functional
Always active
The technical storage or access is strictly necessary for the legitimate purpose of enabling the use of a specific service explicitly requested by the subscriber or user, or for the sole purpose of carrying out the transmission of a communication over an electronic communications network.
Preferences
The technical storage or access is necessary for the legitimate purpose of storing preferences that are not requested by the subscriber or user.
Statistics
The technical storage or access that is used exclusively for statistical purposes.The technical storage or access that is used exclusively for anonymous statistical purposes. Without a subpoena, voluntary compliance on the part of your Internet Service Provider, or additional records from a third party, information stored or retrieved for this purpose alone cannot usually be used to identify you.
Marketing
The technical storage or access is required to create user profiles to send advertising, or to track the user on a website or across several websites for similar marketing purposes.