Tag Archives: Post Mortem

Cloudflare outage on November 18, 2025

Post Syndicated from Matthew Prince original https://blog.cloudflare.com/18-november-2025-outage/

On 18 November 2025 at 11:20 UTC (all times in this blog are UTC), Cloudflare’s network began experiencing significant failures to deliver core network traffic. This showed up to Internet users trying to access our customers’ sites as an error page indicating a failure within Cloudflare’s network.


The issue was not caused, directly or indirectly, by a cyber attack or malicious activity of any kind. Instead, it was triggered by a change to one of our database systems’ permissions which caused the database to output multiple entries into a “feature file” used by our Bot Management system. That feature file, in turn, doubled in size. The larger-than-expected feature file was then propagated to all the machines that make up our network.

The software running on these machines to route traffic across our network reads this feature file to keep our Bot Management system up to date with ever changing threats. The software had a limit on the size of the feature file that was below its doubled size. That caused the software to fail.

After we initially wrongly suspected the symptoms we were seeing were caused by a hyper-scale DDoS attack, we correctly identified the core issue and were able to stop the propagation of the larger-than-expected feature file and replace it with an earlier version of the file. Core traffic was largely flowing as normal by 14:30. We worked over the next few hours to mitigate increased load on various parts of our network as traffic rushed back online. As of 17:06 all systems at Cloudflare were functioning as normal.

We are sorry for the impact to our customers and to the Internet in general. Given Cloudflare’s importance in the Internet ecosystem any outage of any of our systems is unacceptable. That there was a period of time where our network was not able to route traffic is deeply painful to every member of our team. We know we let you down today.

This post is an in-depth recount of exactly what happened and what systems and processes failed. It is also the beginning, though not the end, of what we plan to do in order to make sure an outage like this will not happen again.

The outage

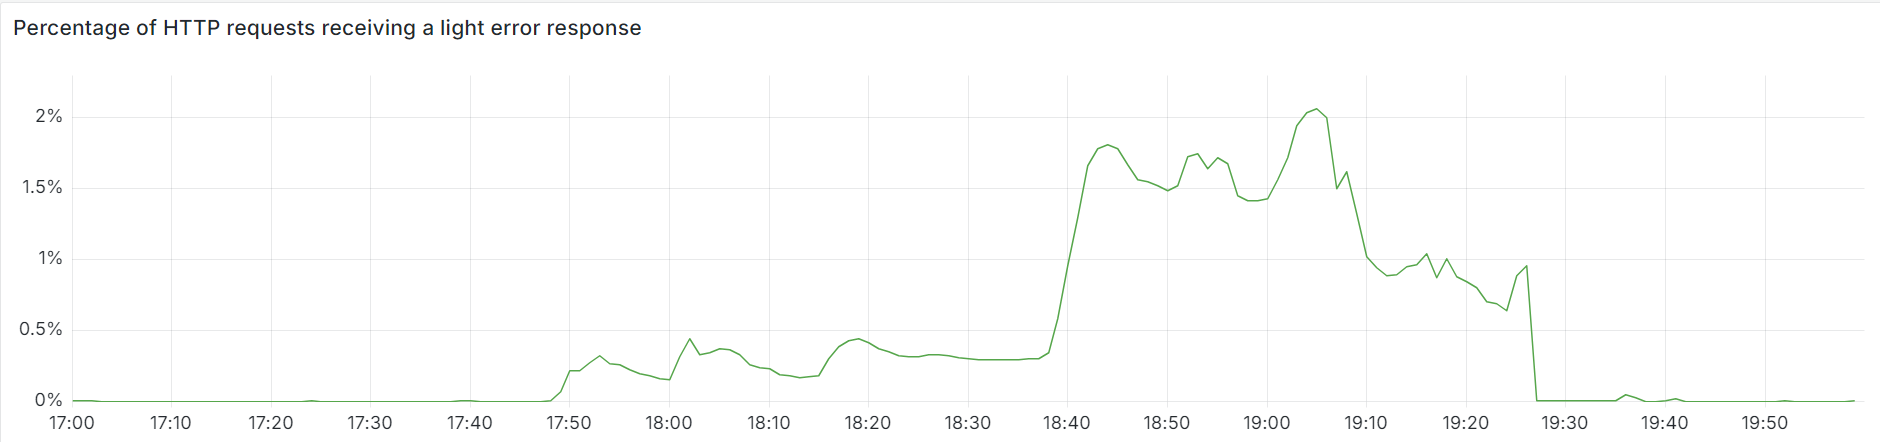
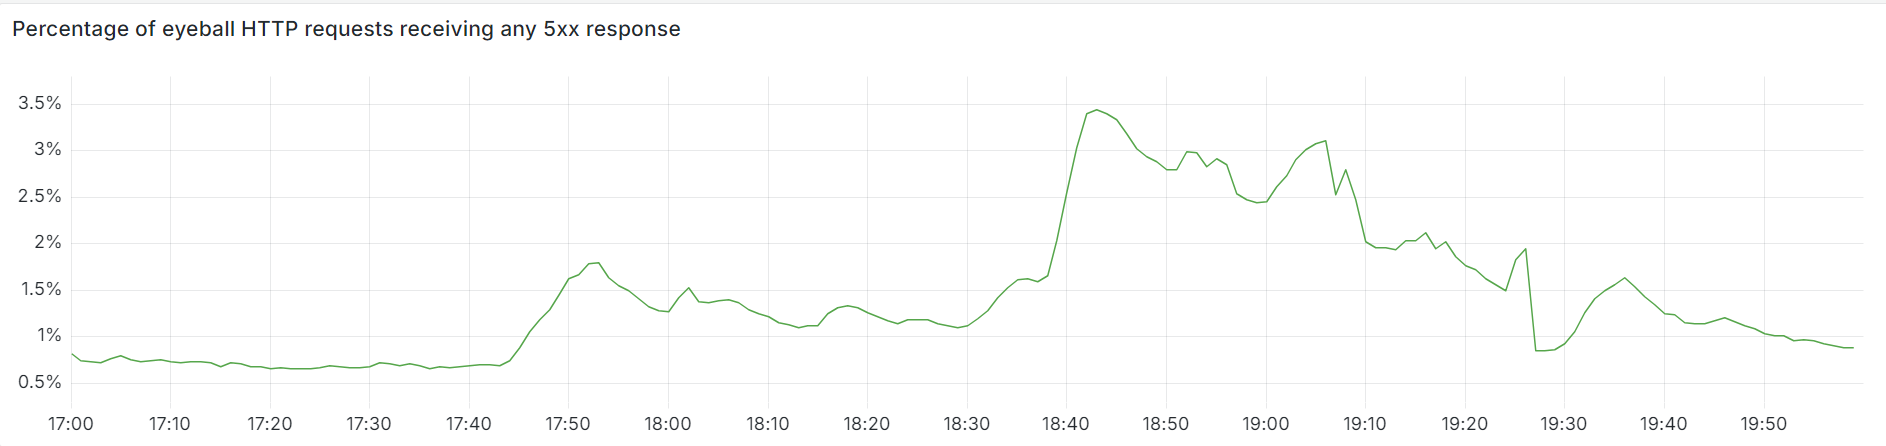
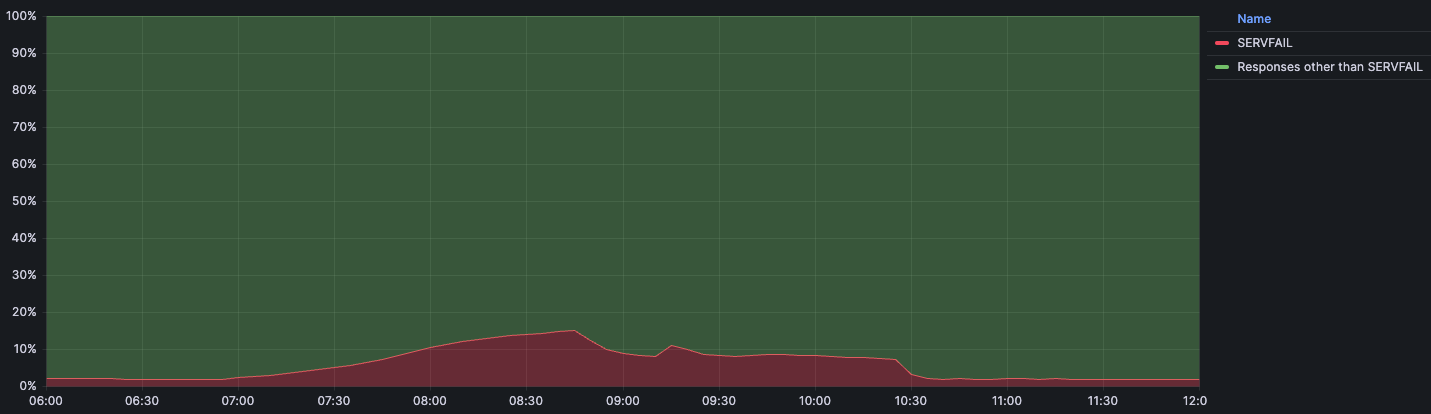
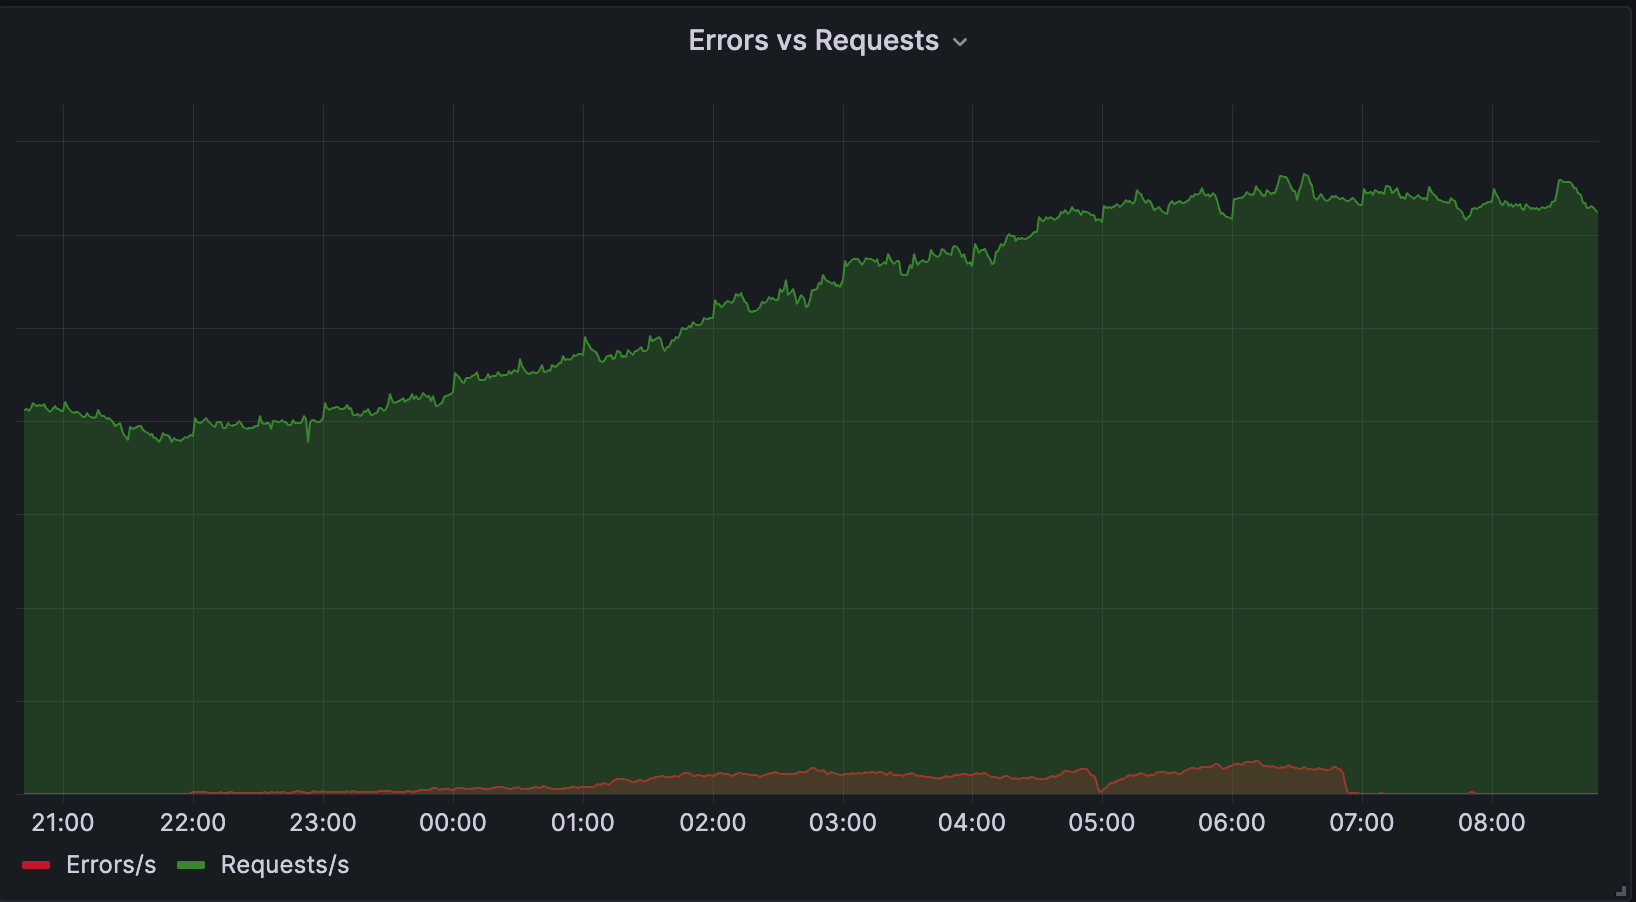
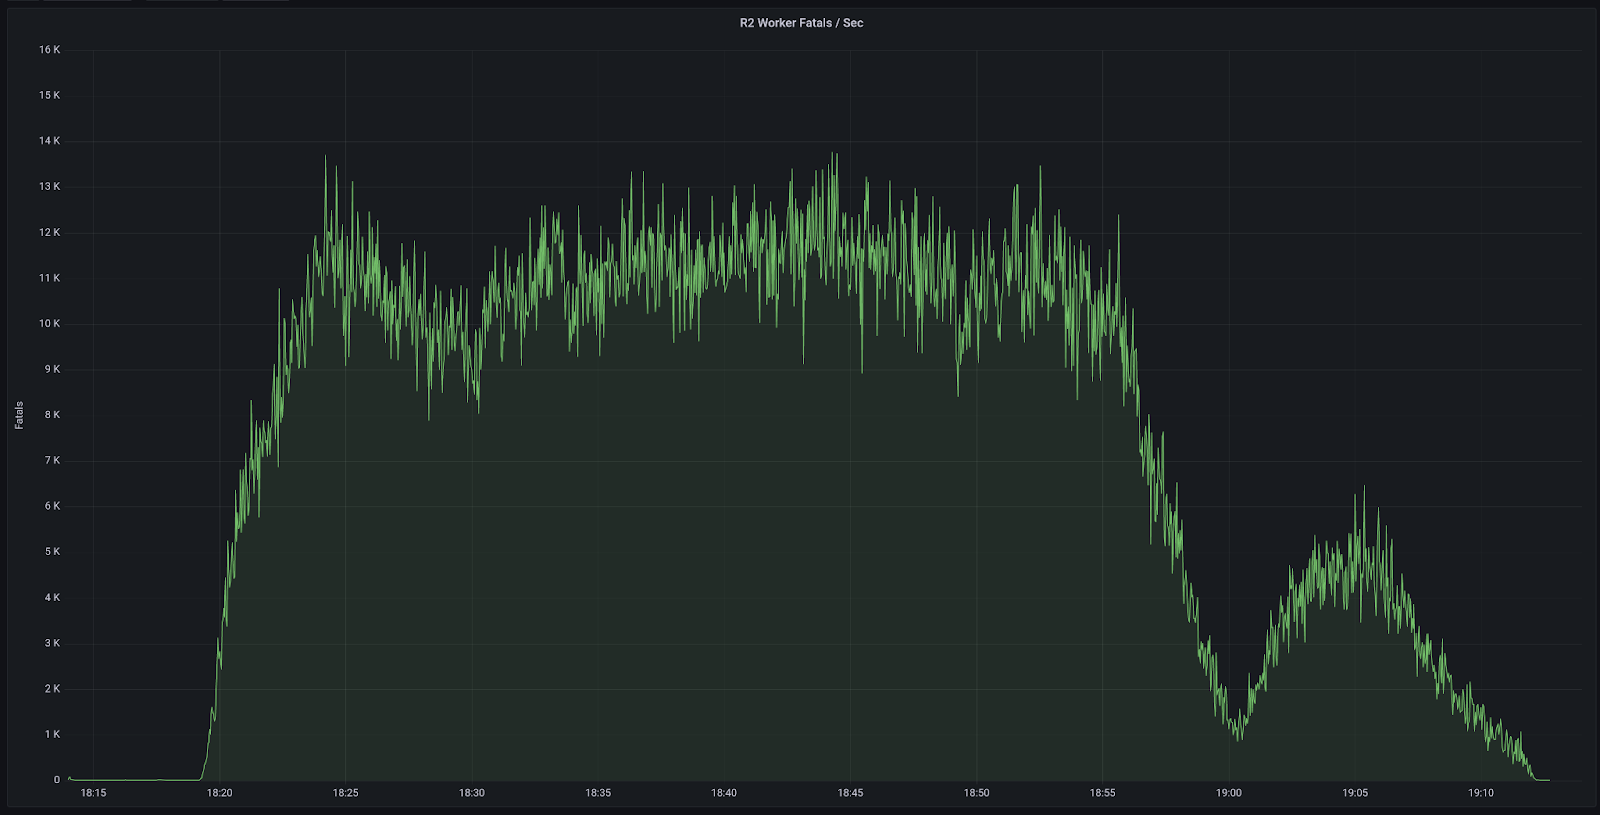
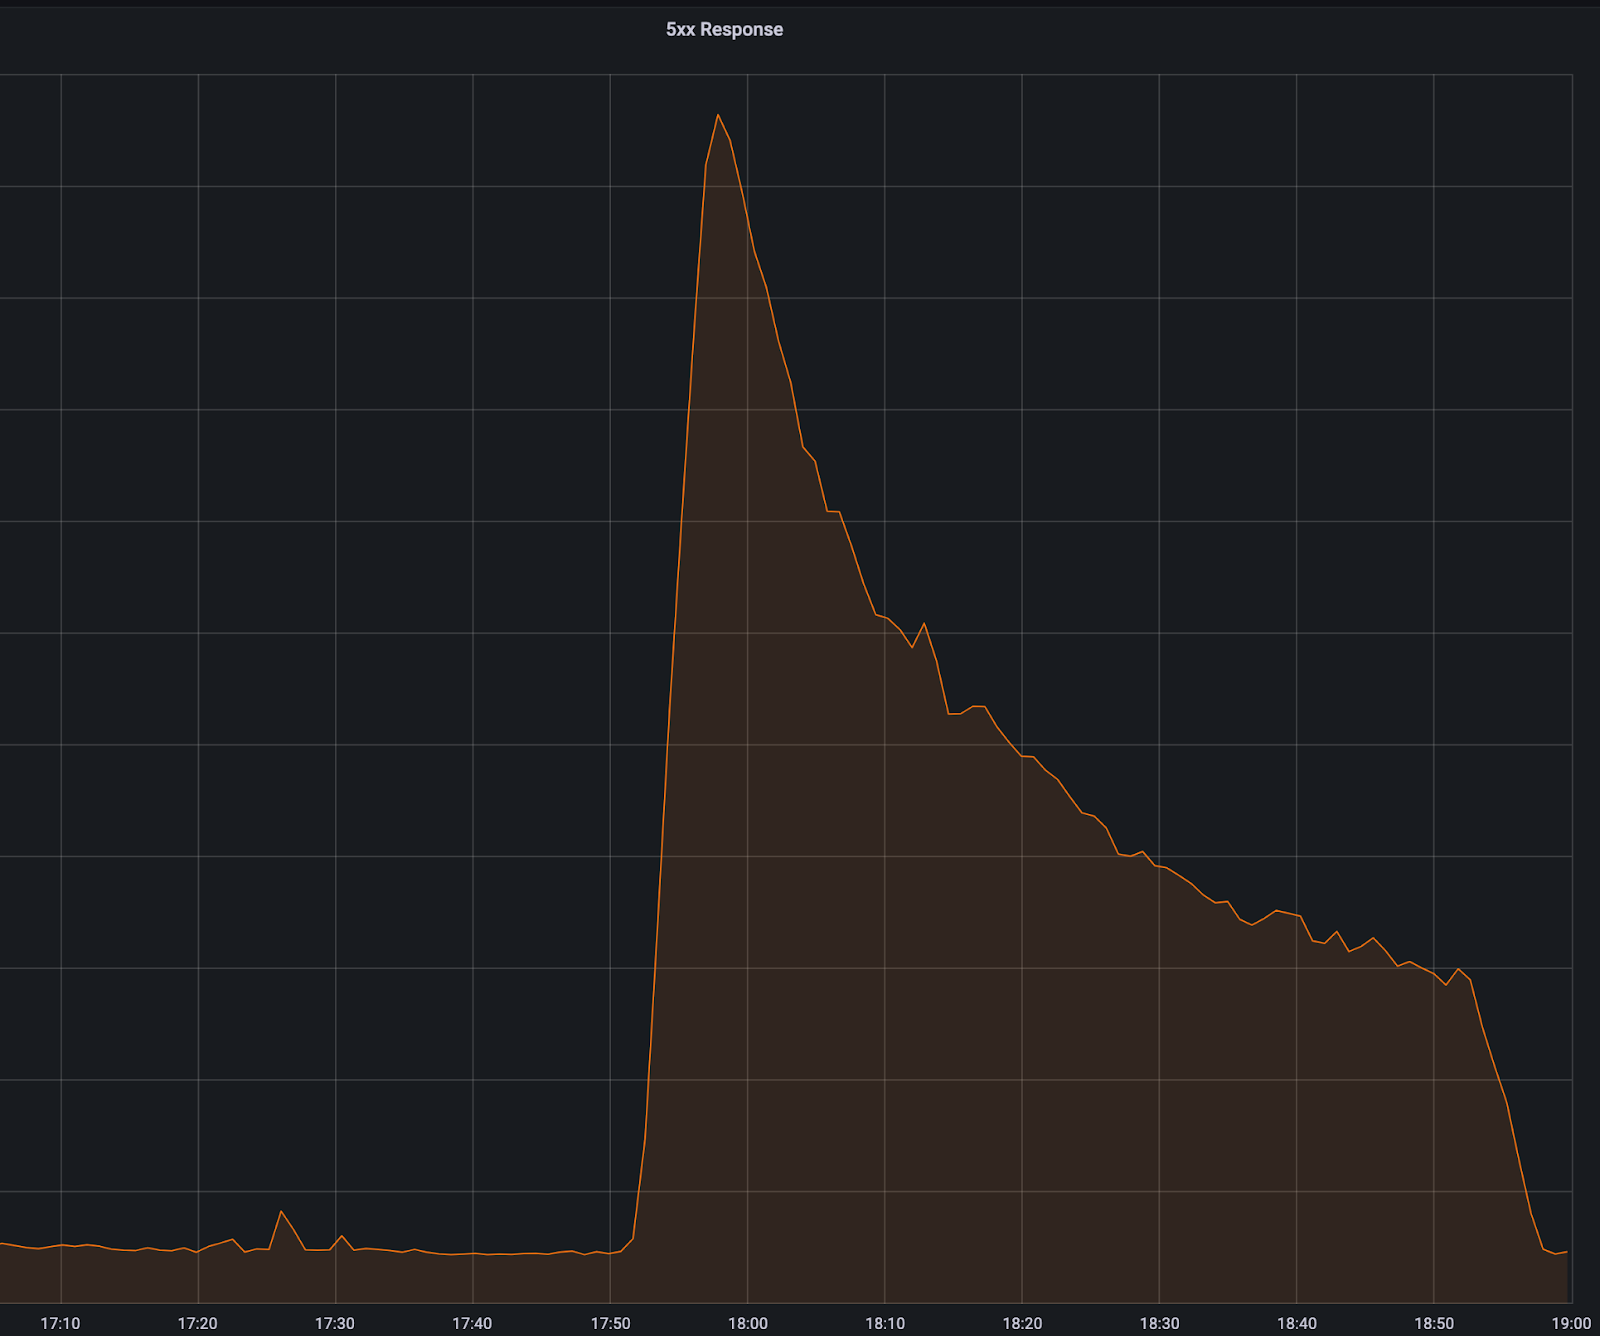
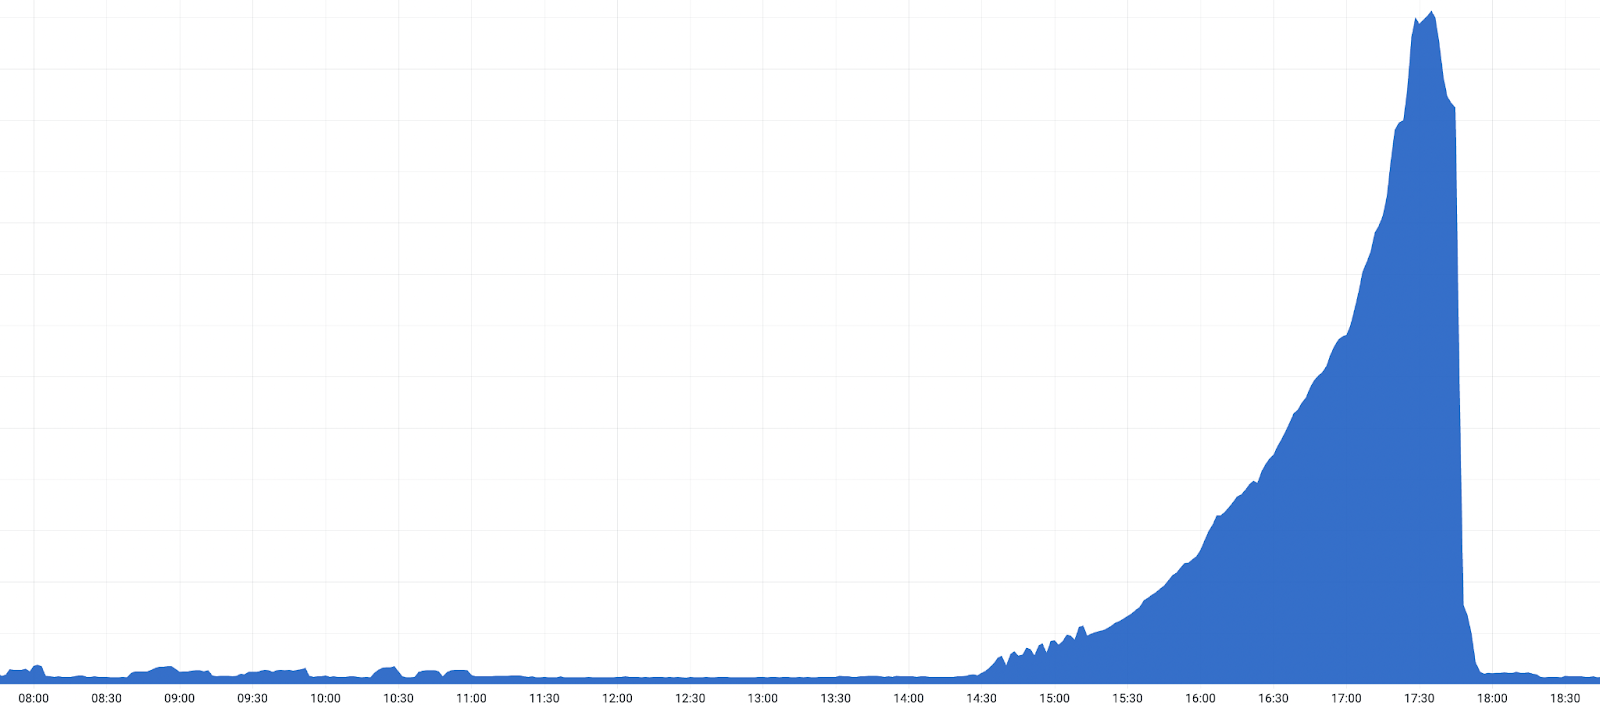
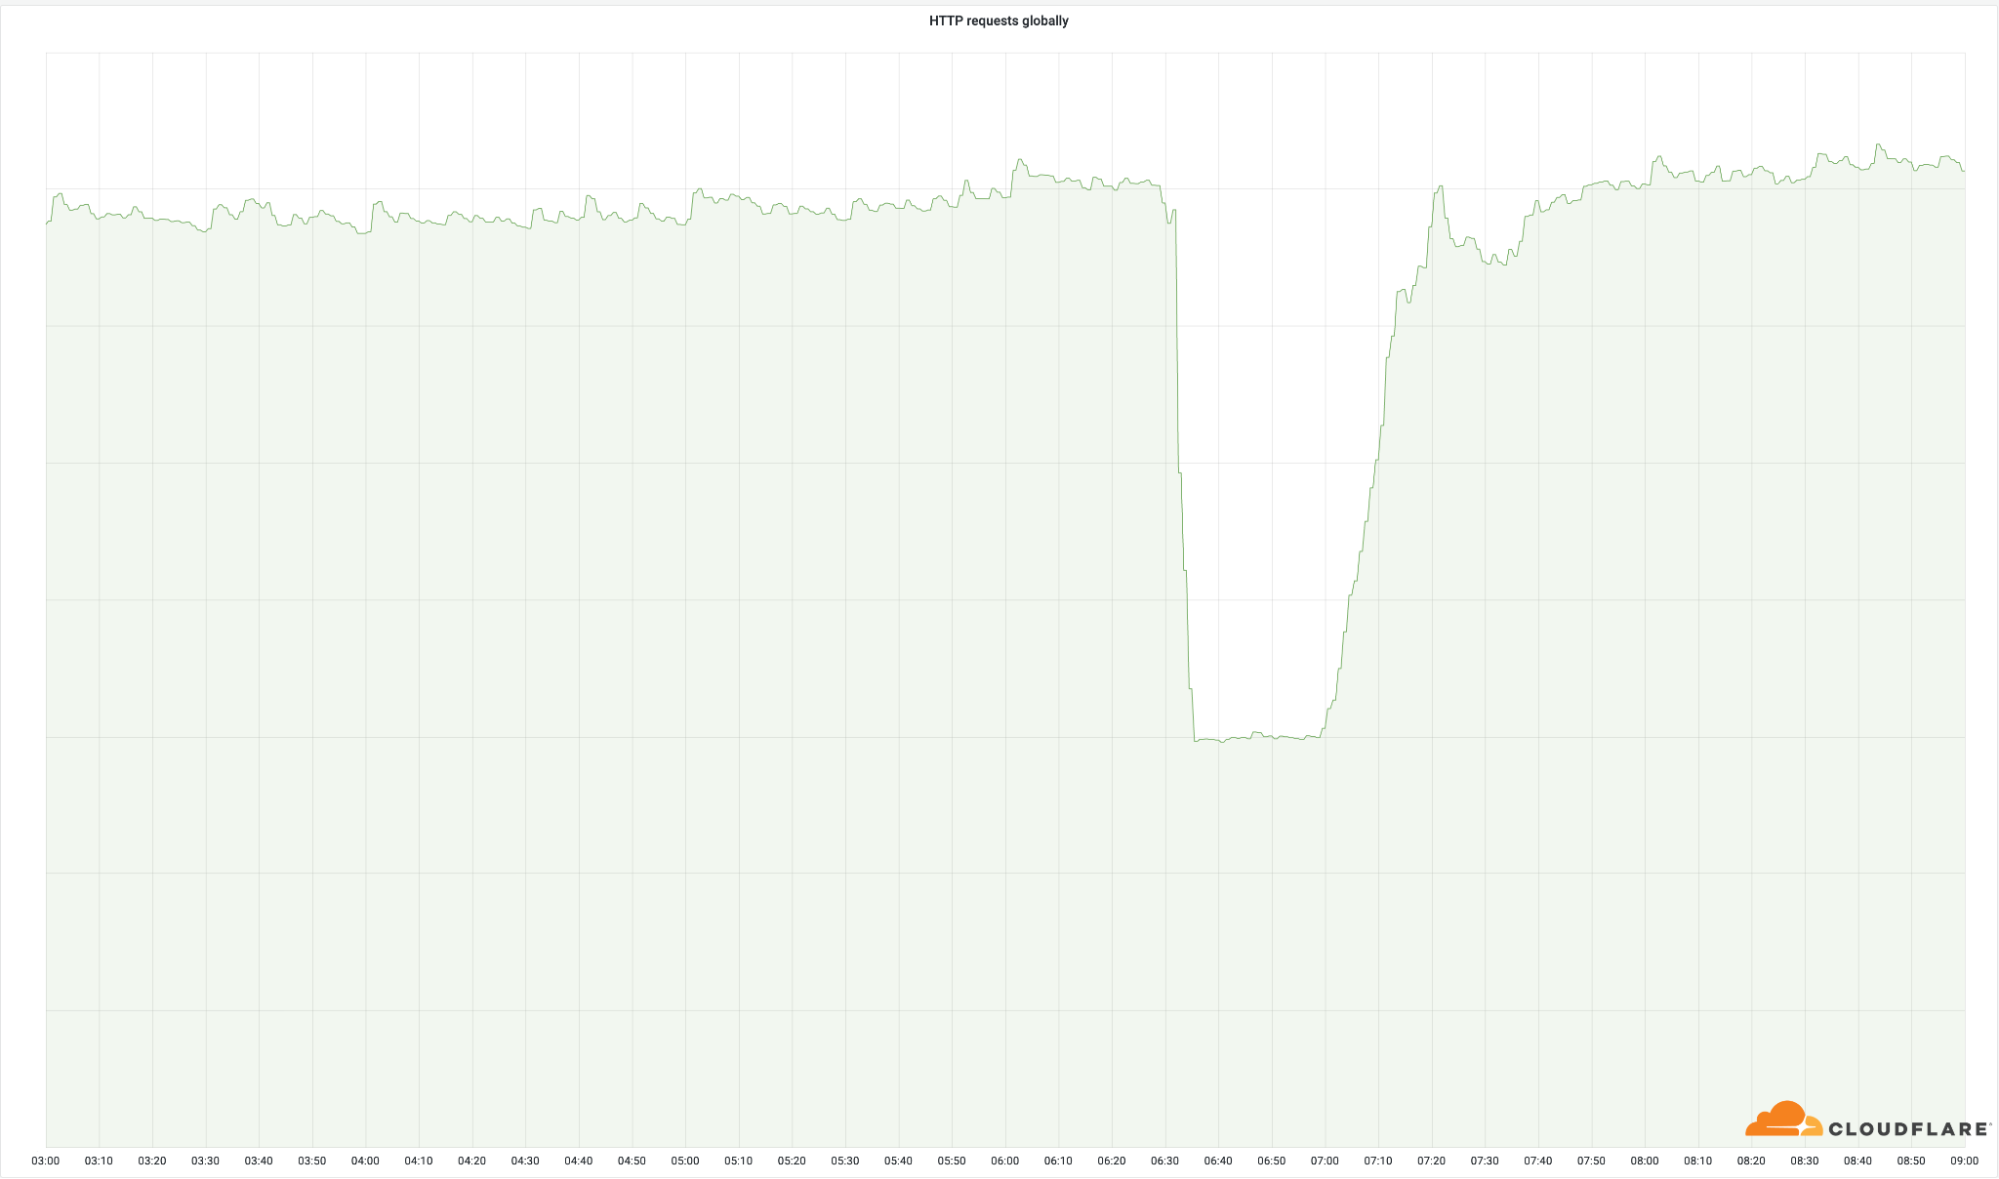
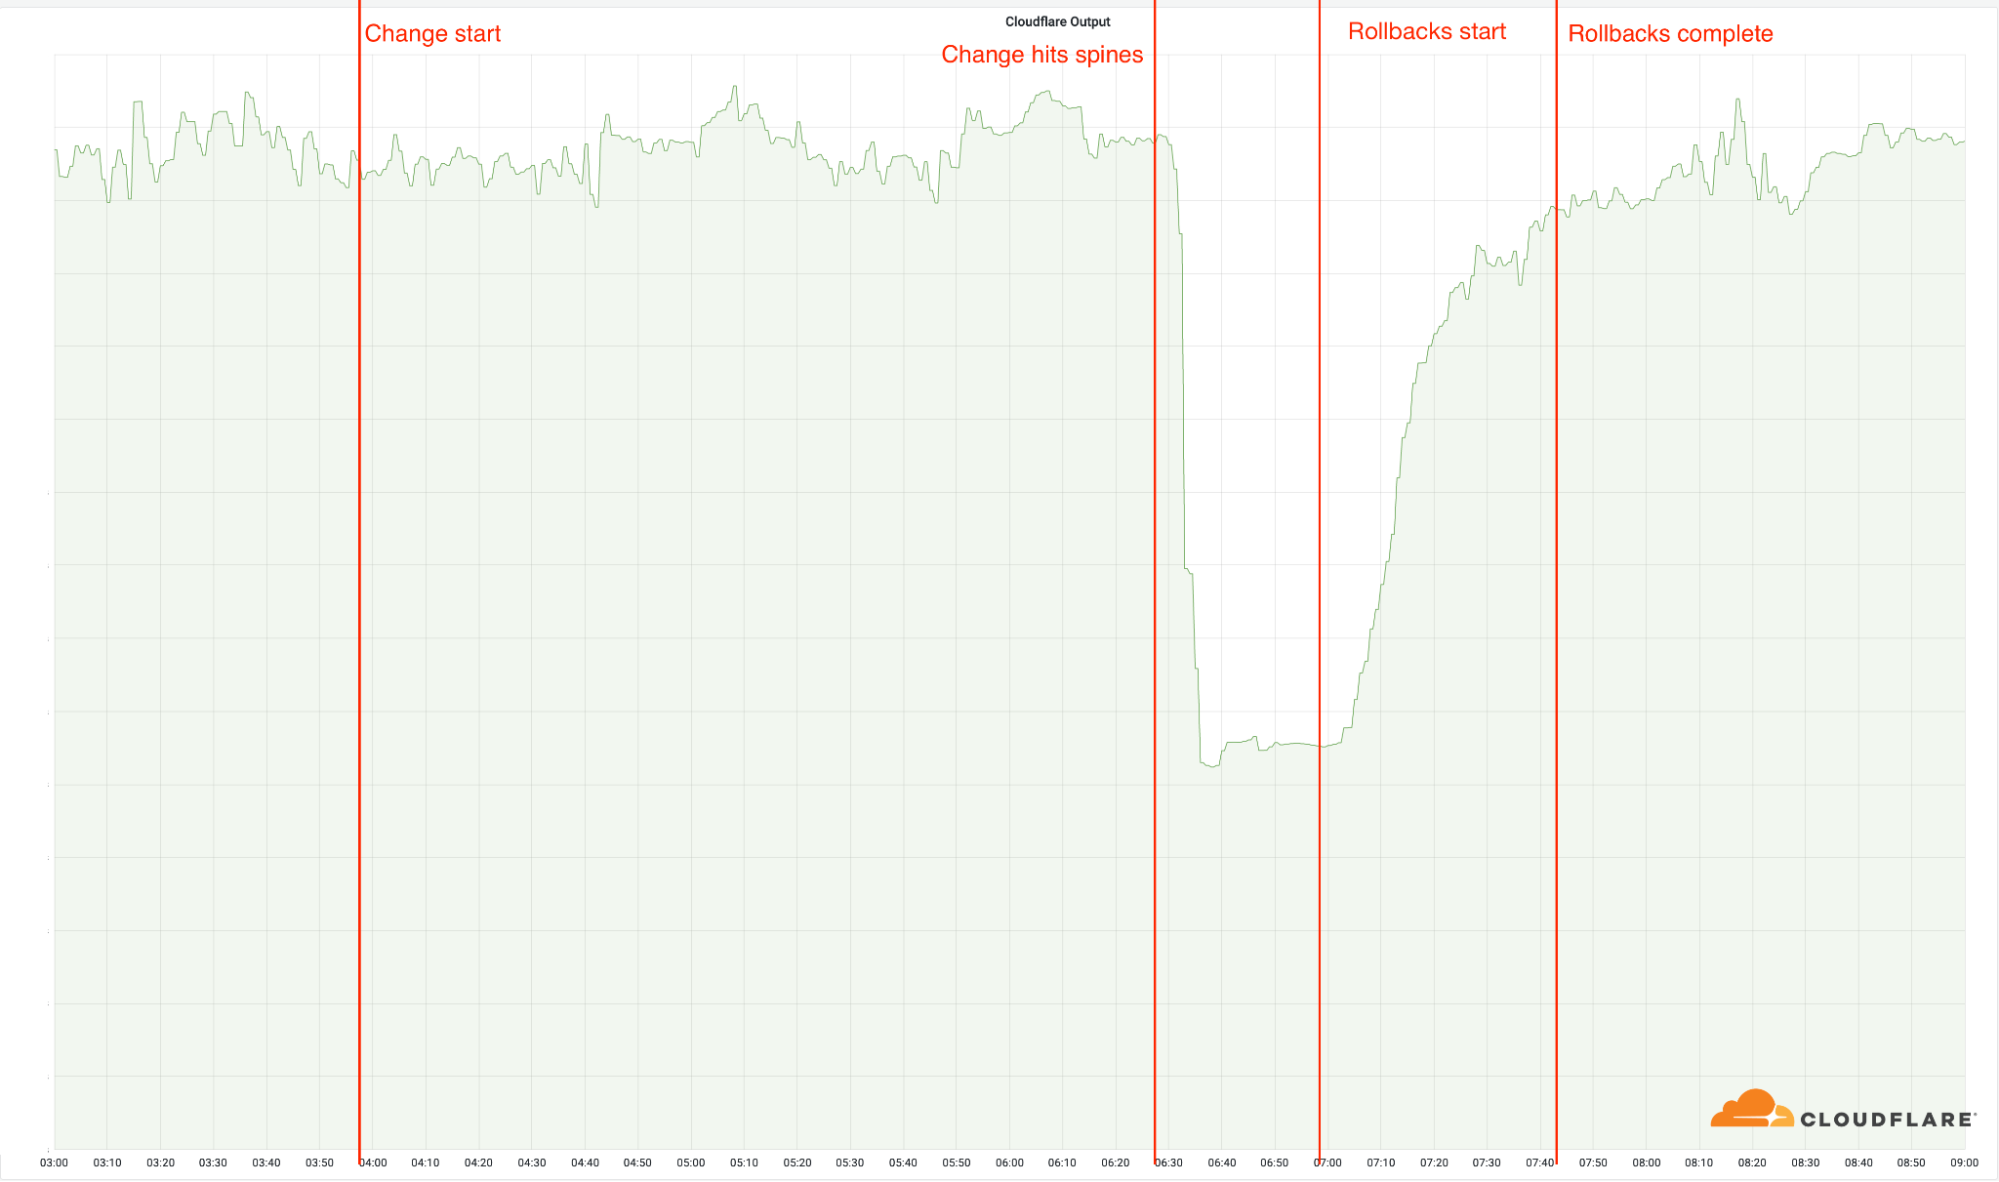
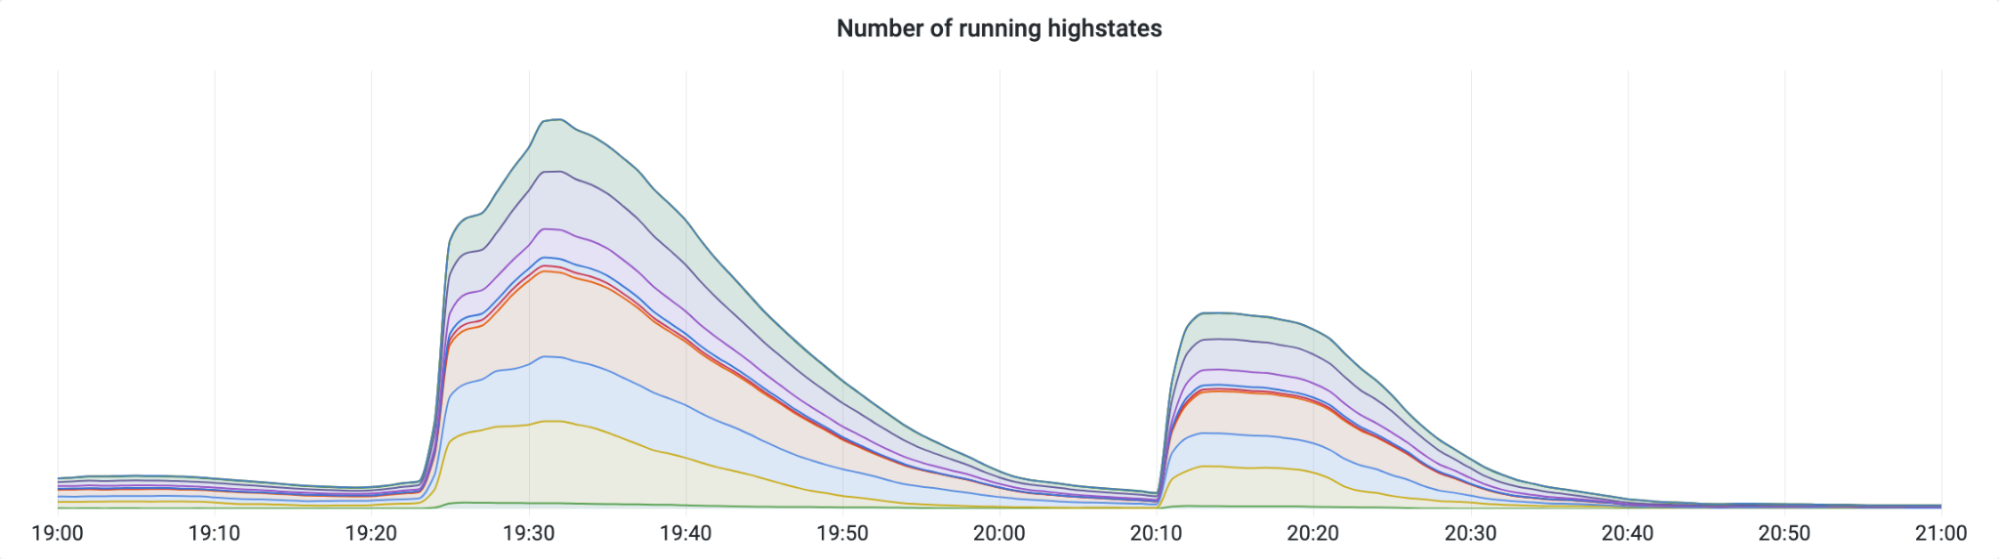
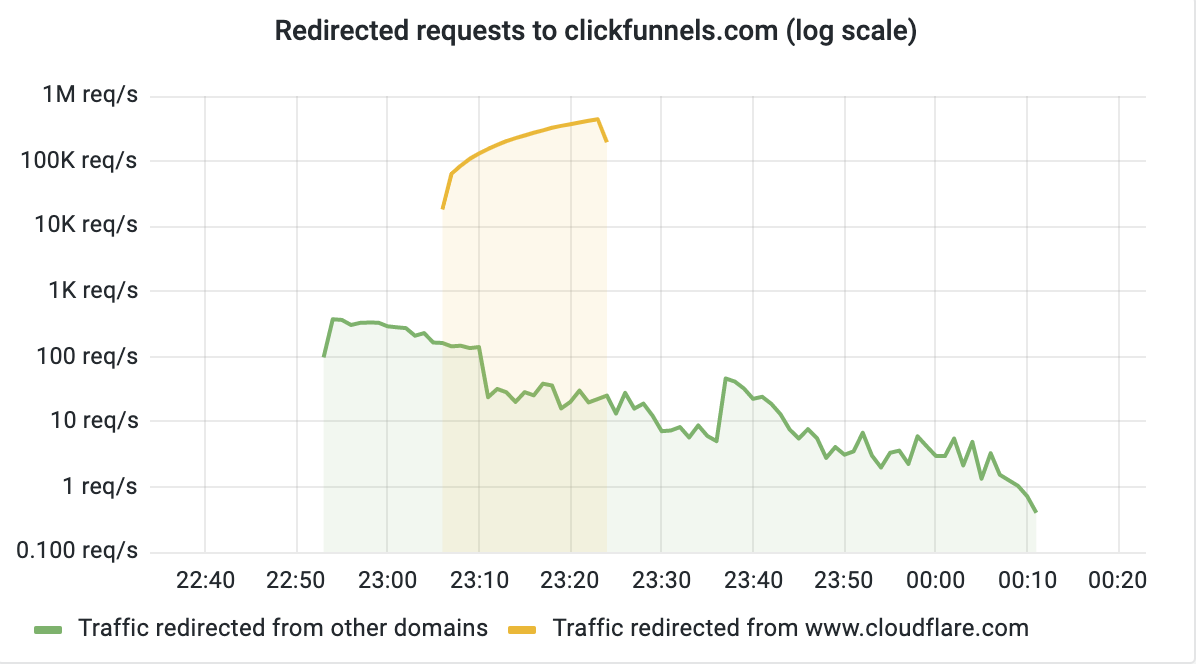
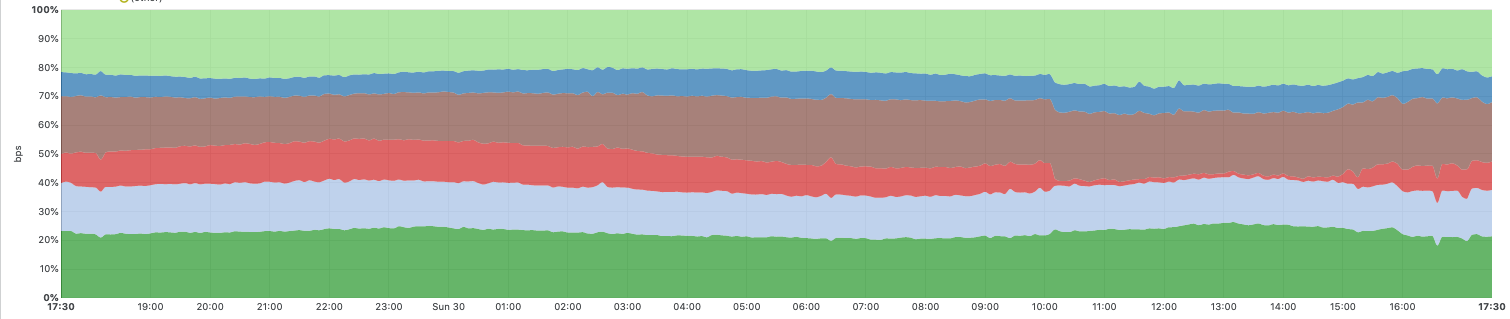
The chart below shows the volume of 5xx error HTTP status codes served by the Cloudflare network. Normally this should be very low, and it was right up until the start of the outage.


The volume prior to 11:20 is the expected baseline of 5xx errors observed across our network. The spike, and subsequent fluctuations, show our system failing due to loading the incorrect feature file. What’s notable is that our system would then recover for a period. This was very unusual behavior for an internal error.

The explanation was that the file was being generated every five minutes by a query running on a ClickHouse database cluster, which was being gradually updated to improve permissions management. Bad data was only generated if the query ran on a part of the cluster which had been updated. As a result, every five minutes there was a chance of either a good or a bad set of configuration files being generated and rapidly propagated across the network.

This fluctuation made it unclear what was happening as the entire system would recover and then fail again as sometimes good, sometimes bad configuration files were distributed to our network. Initially, this led us to believe this might be caused by an attack. Eventually, every ClickHouse node was generating the bad configuration file and the fluctuation stabilized in the failing state.

Errors continued until the underlying issue was identified and resolved starting at 14:30. We solved the problem by stopping the generation and propagation of the bad feature file and manually inserting a known good file into the feature file distribution queue. And then forcing a restart of our core proxy.

The remaining long tail in the chart above is our team restarting remaining services that had entered a bad state, with 5xx error code volume returning to normal at 17:06.

The following services were impacted:

Service / Product

Impact description

Core CDN and security services

HTTP 5xx status codes. The screenshot at the top of this post shows a typical error page delivered to end users.

Turnstile

Turnstile failed to load.

Workers KV

Workers KV returned a significantly elevated level of HTTP 5xx errors as requests to KV’s “front end” gateway failed due to the core proxy failing.

Dashboard

While the dashboard was mostly operational, most users were unable to log in due to Turnstile being unavailable on the login page.

Email Security

While email processing and delivery were unaffected, we observed a temporary loss of access to an IP reputation source which reduced spam-detection accuracy and prevented some new-domain-age detections from triggering, with no critical customer impact observed. We also saw failures in some Auto Move actions; all affected messages have been reviewed and remediated.

Access

Authentication failures were widespread for most users, beginning at the start of the incident and continuing until the rollback was initiated at 13:05. Any existing Access sessions were unaffected.

All failed authentication attempts resulted in an error page, meaning none of these users ever reached the target application while authentication was failing. Successful logins during this period were correctly logged during this incident. 

Any Access configuration updates attempted at that time would have either failed outright or propagated very slowly. All configuration updates are now recovered.

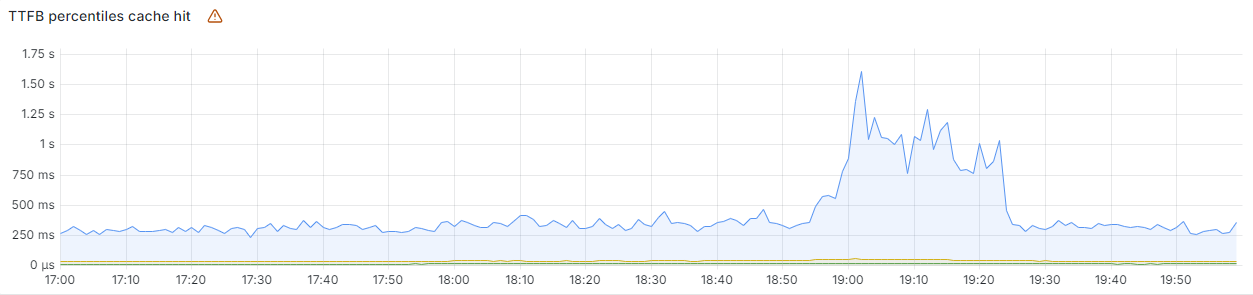
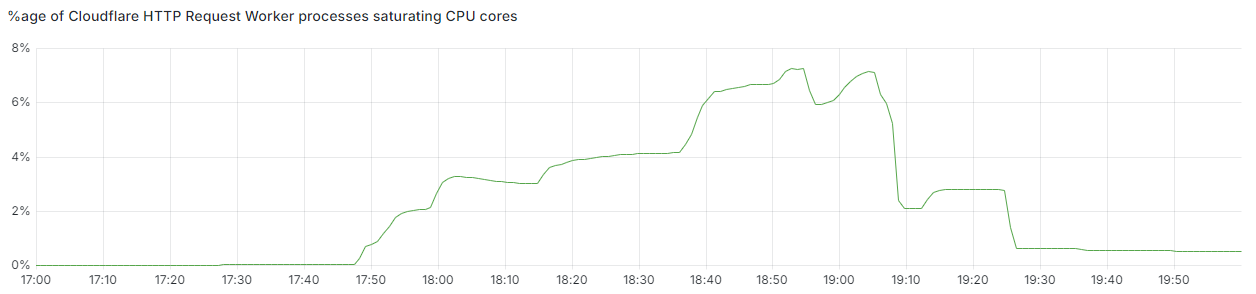
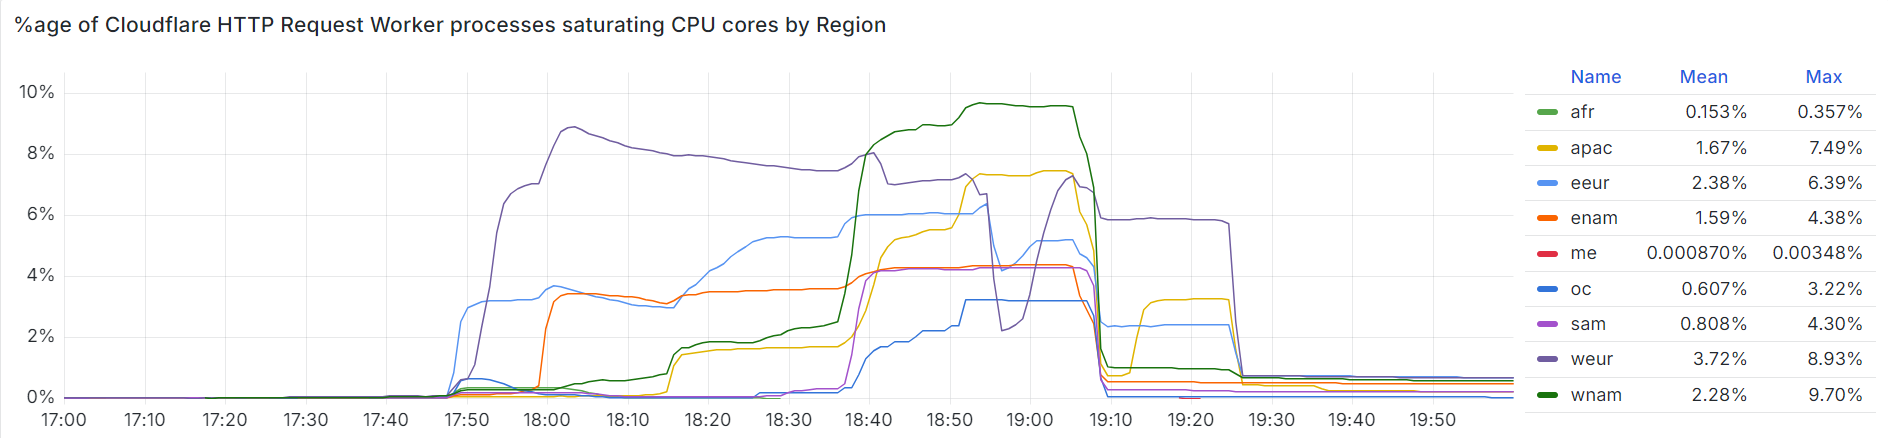
As well as returning HTTP 5xx errors, we observed significant increases in latency of responses from our CDN during the impact period. This was due to large amounts of CPU being consumed by our debugging and observability systems, which automatically enhance uncaught errors with additional debugging information.

How Cloudflare processes requests, and how this went wrong today

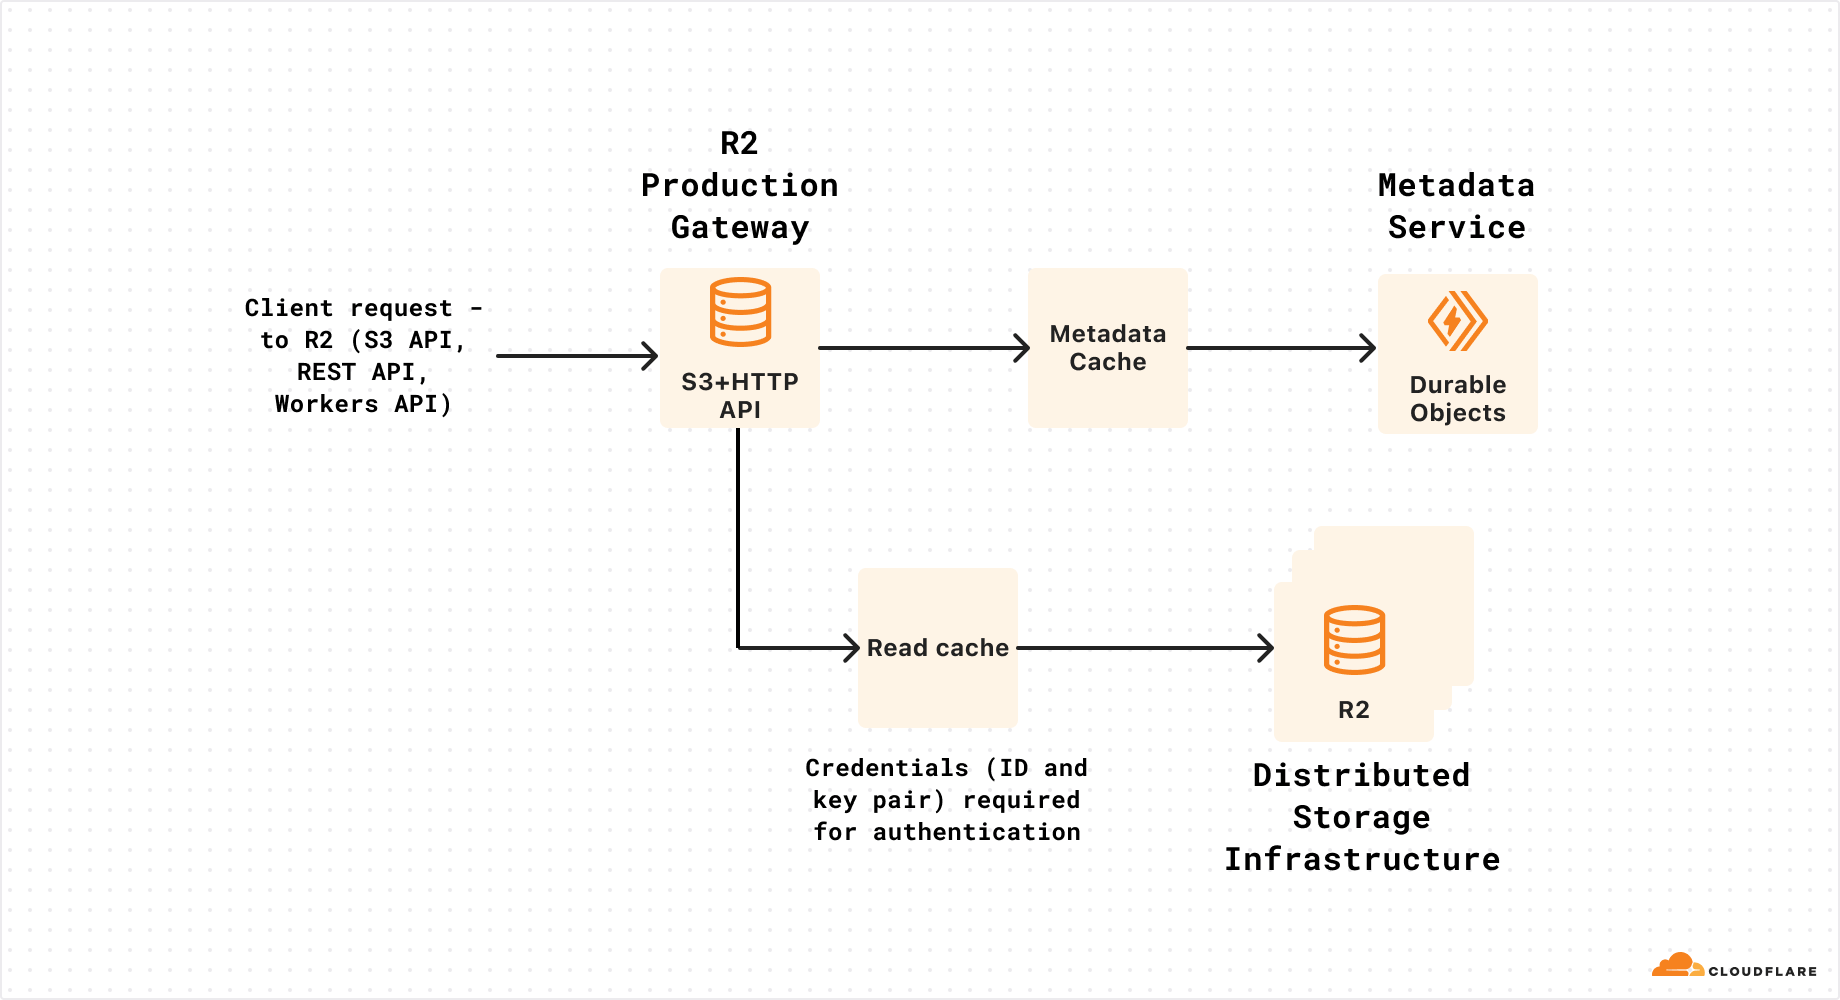
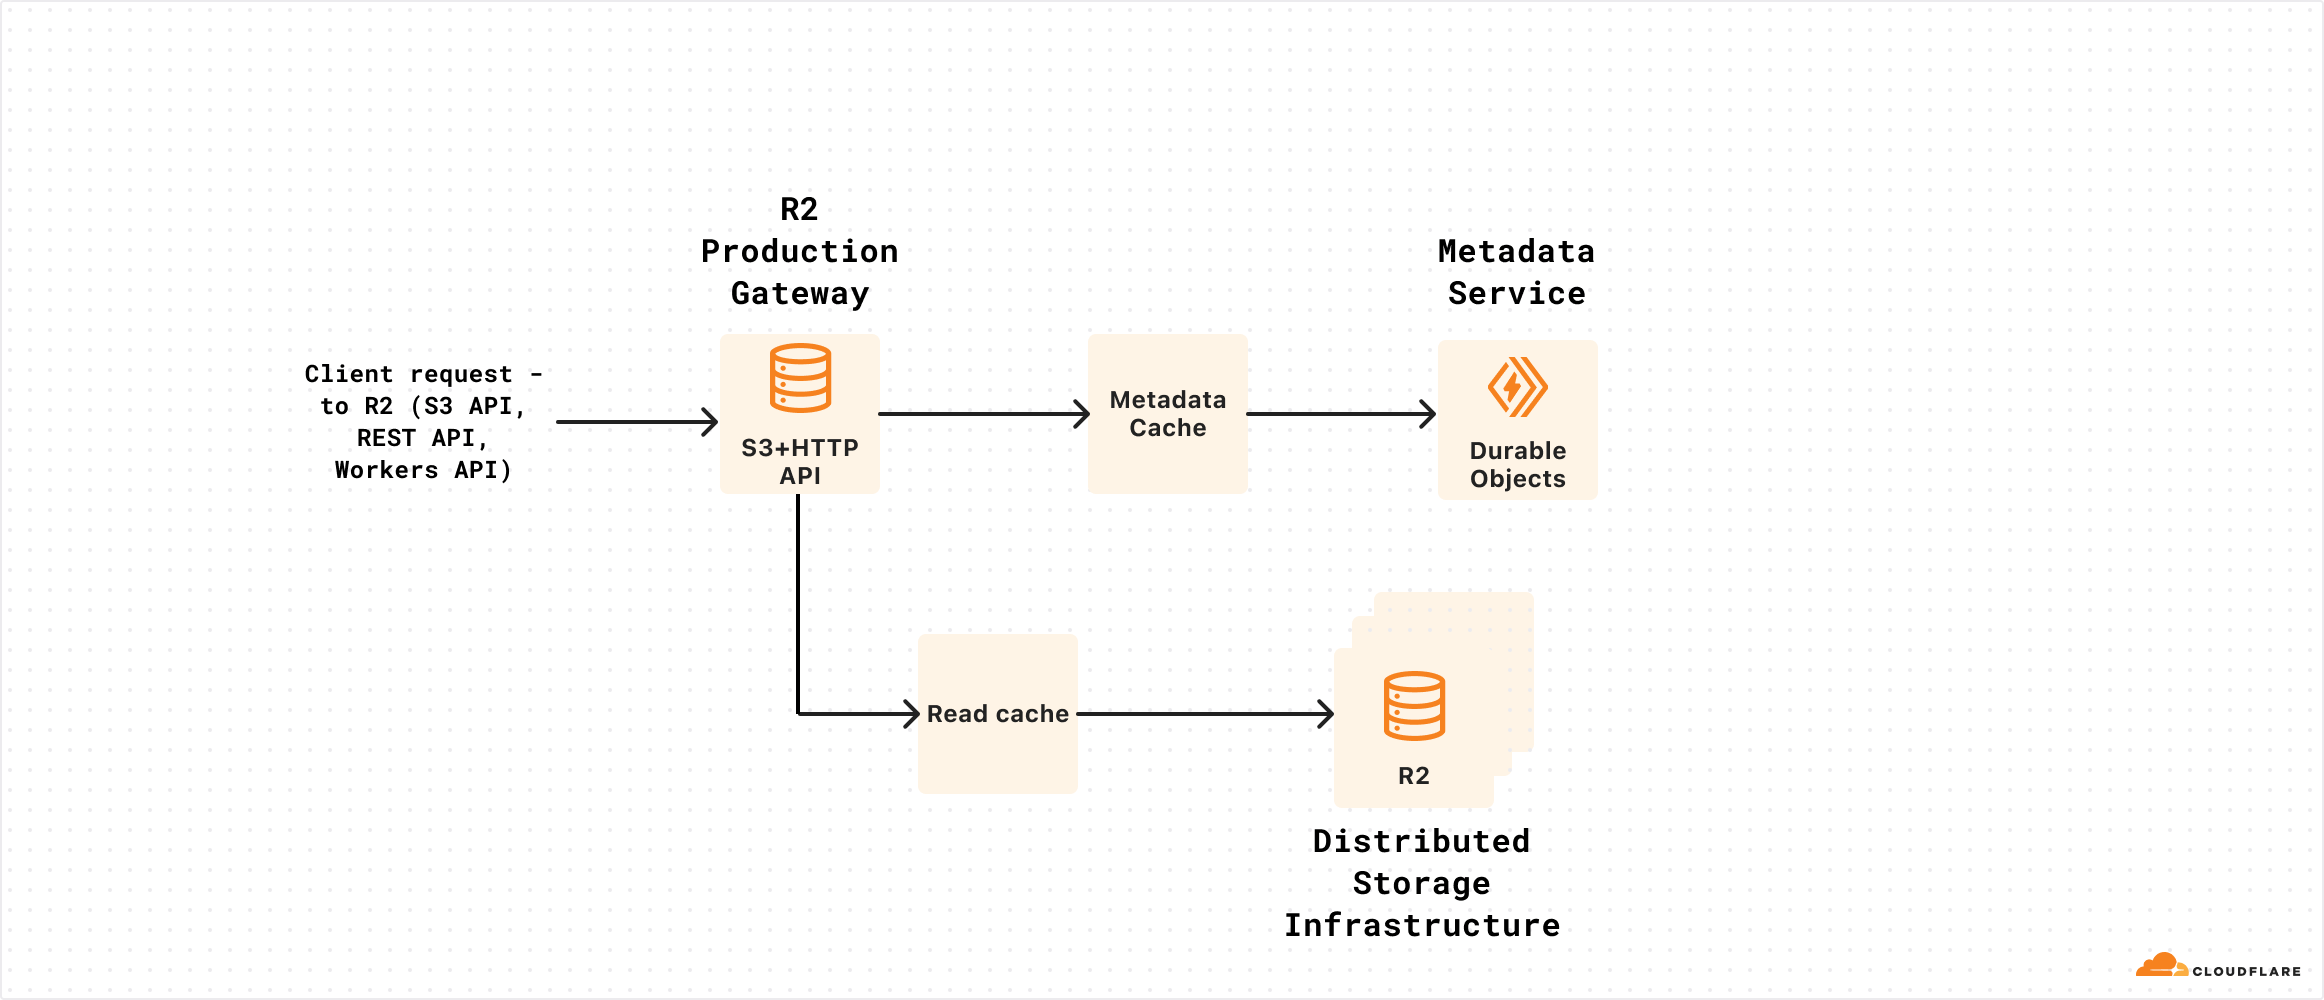
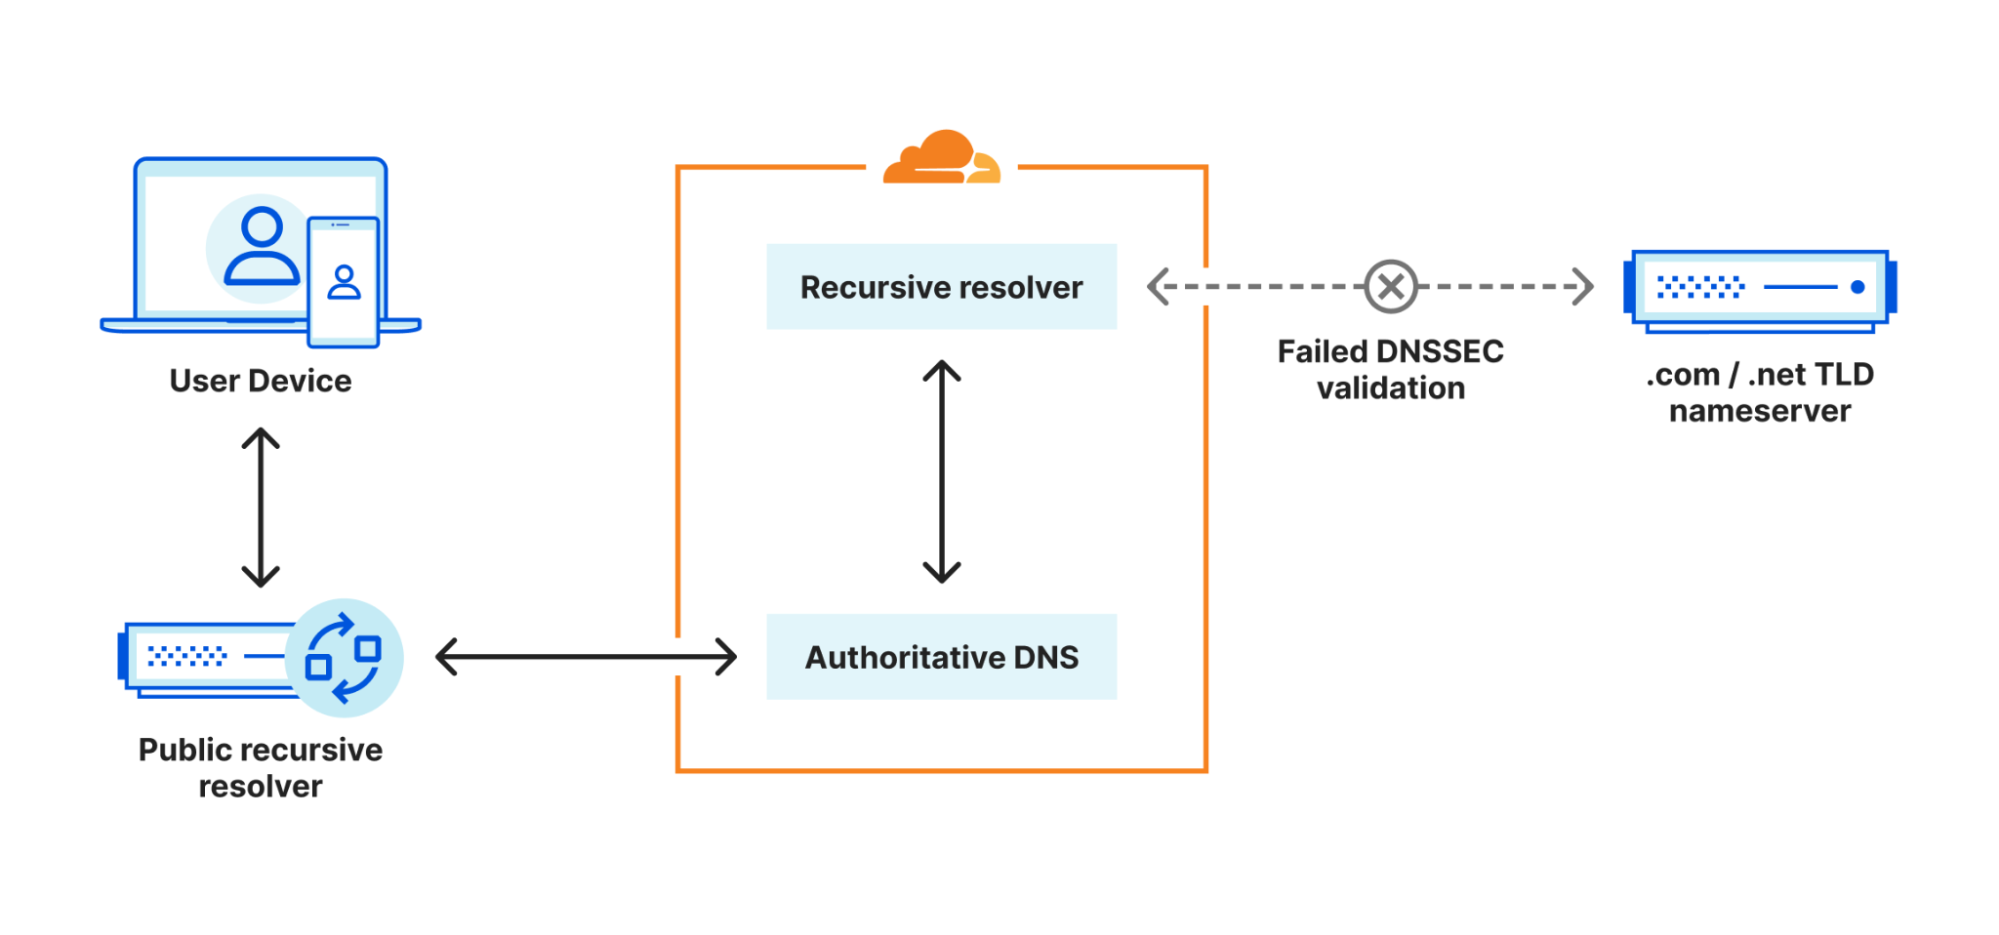
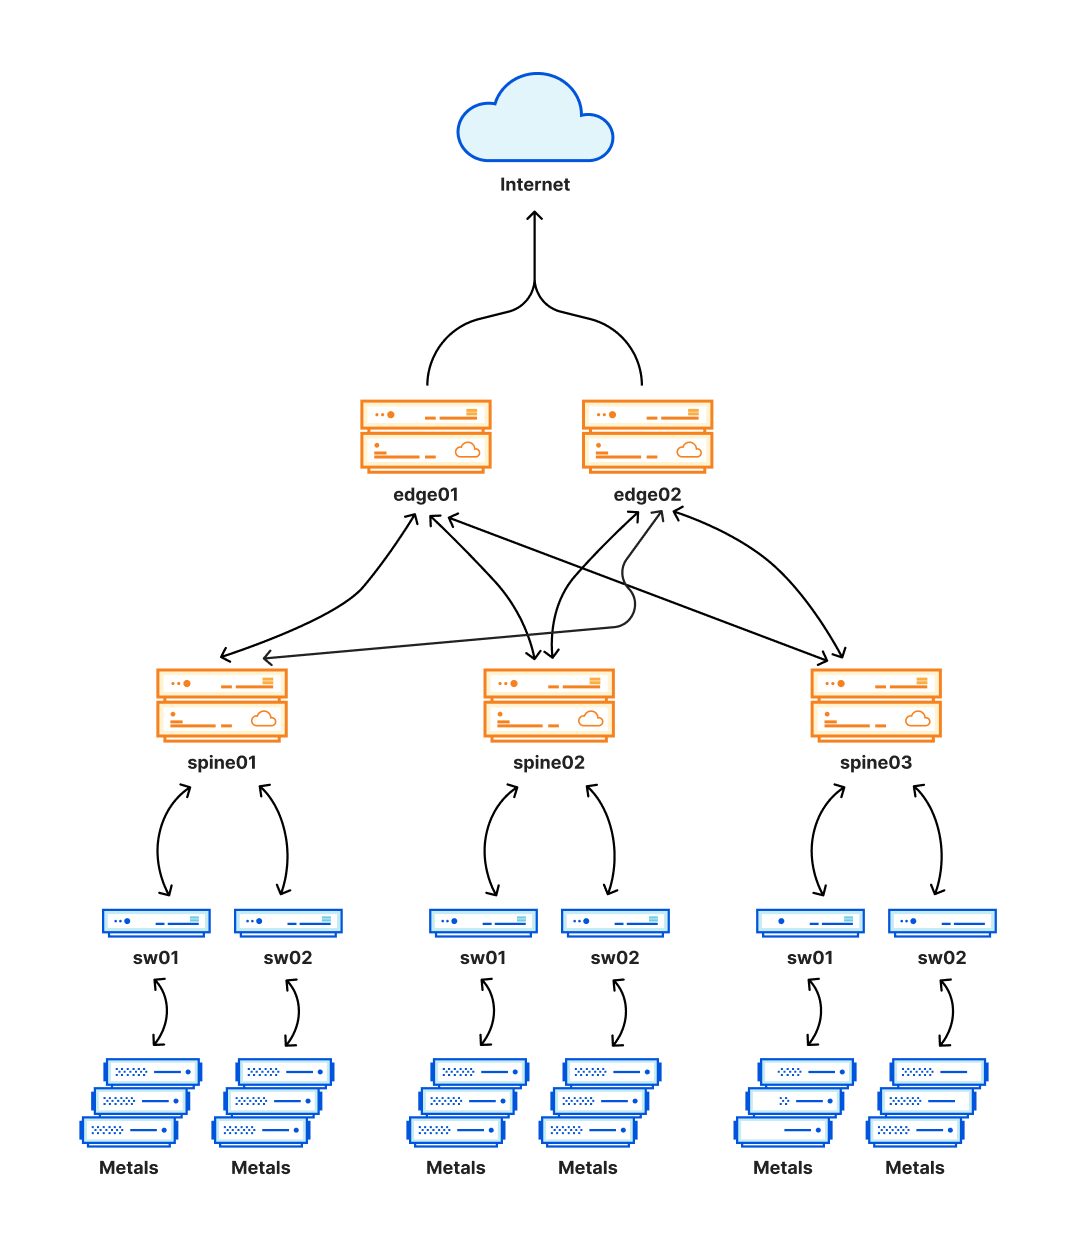
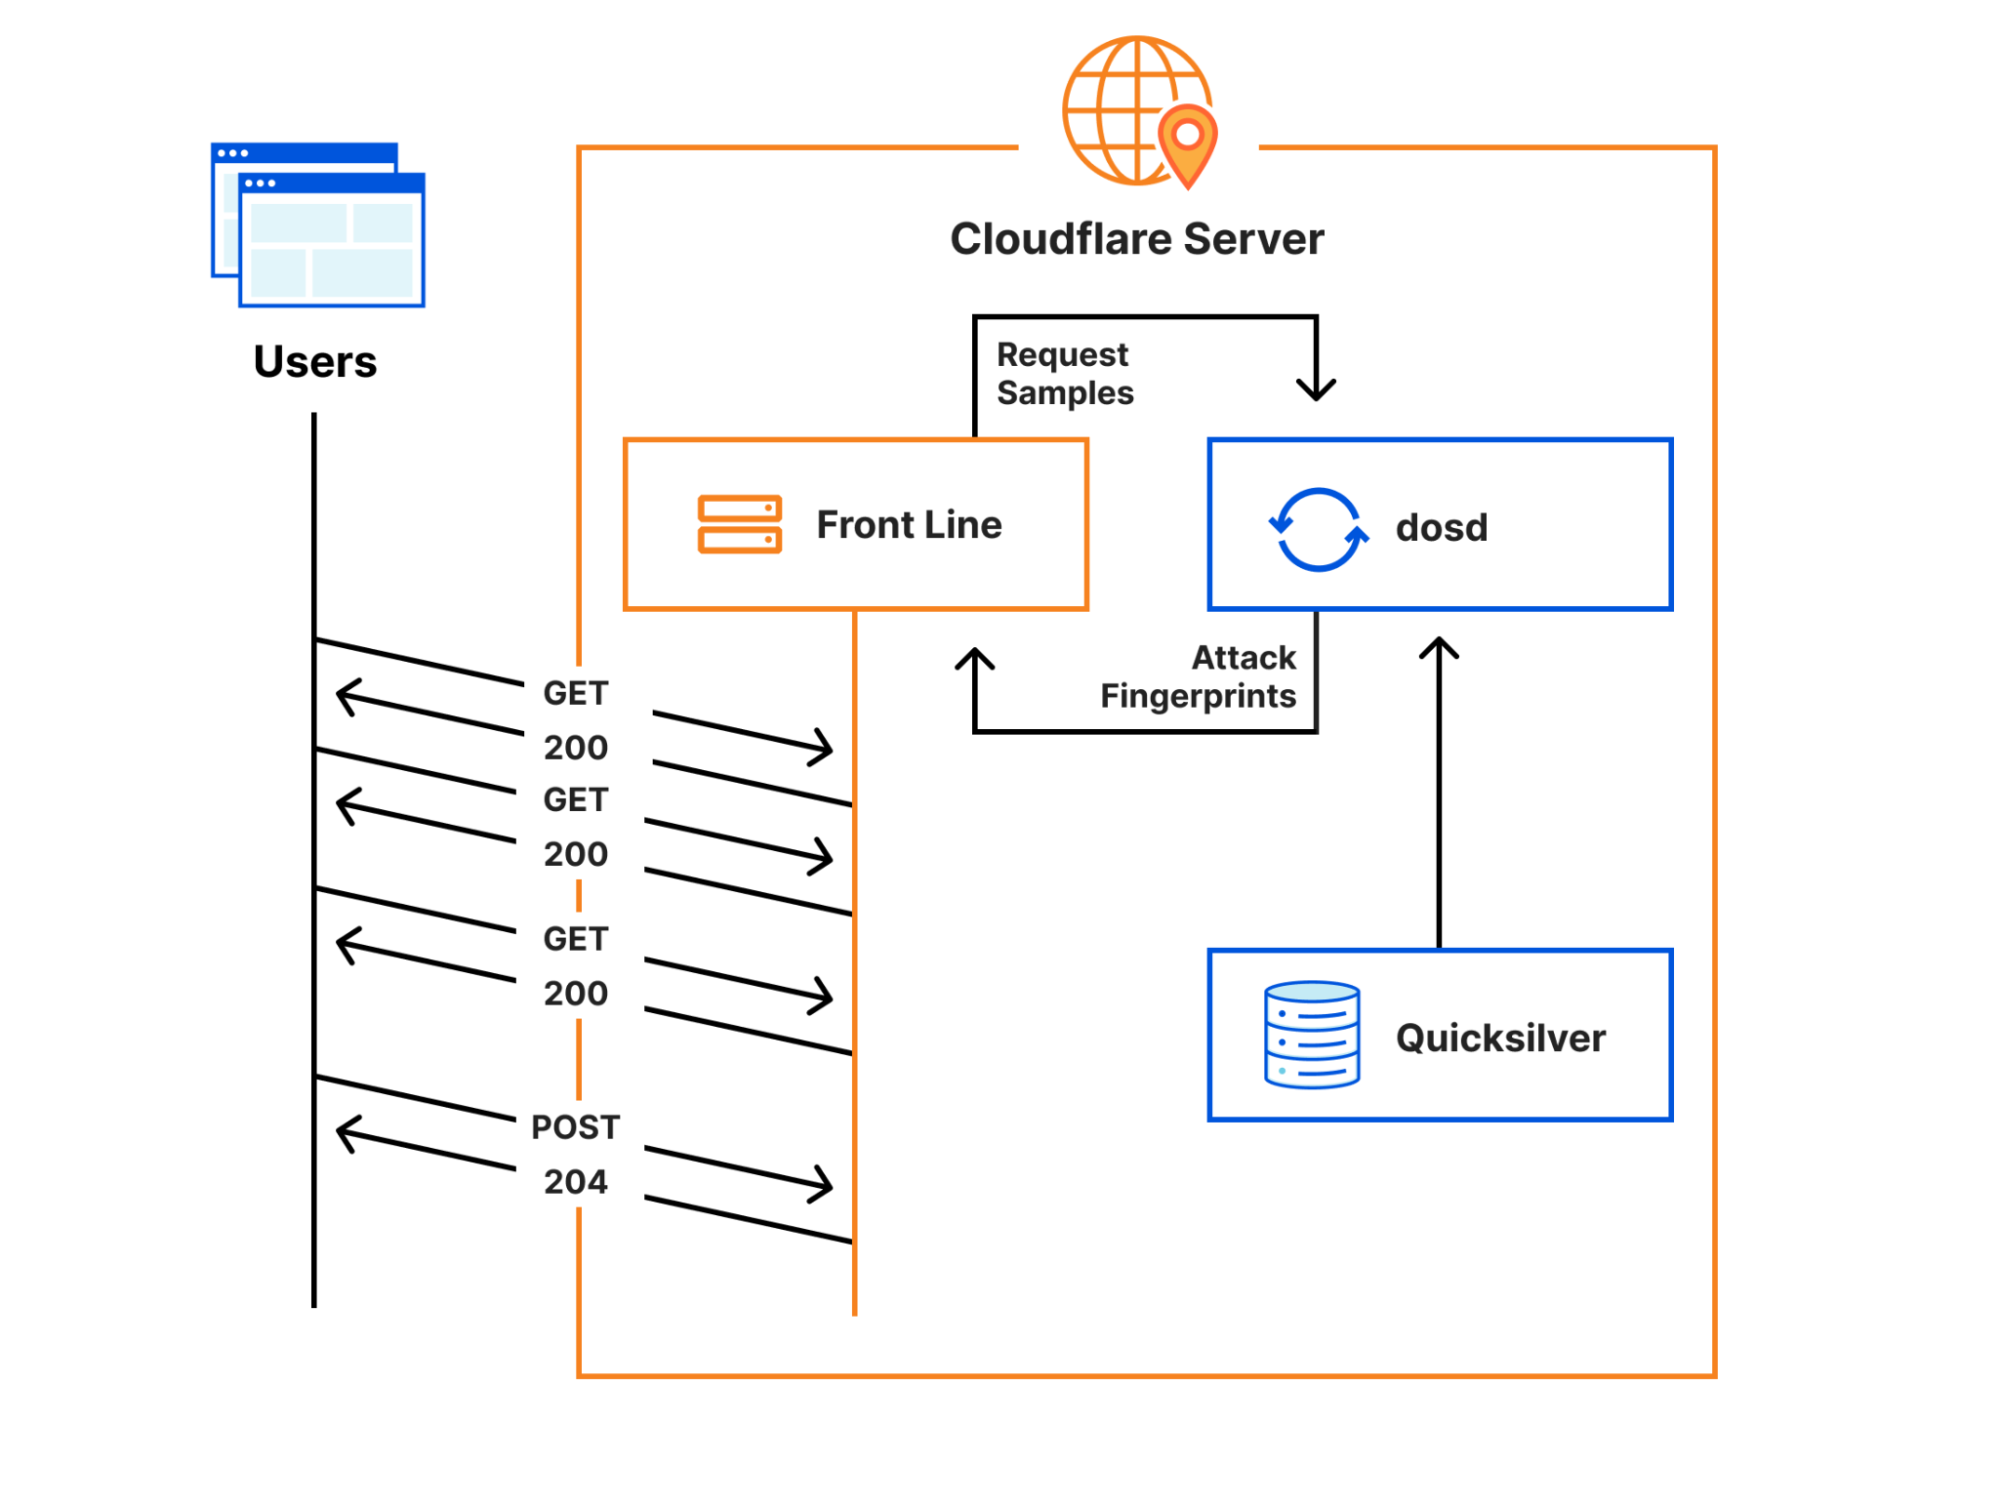
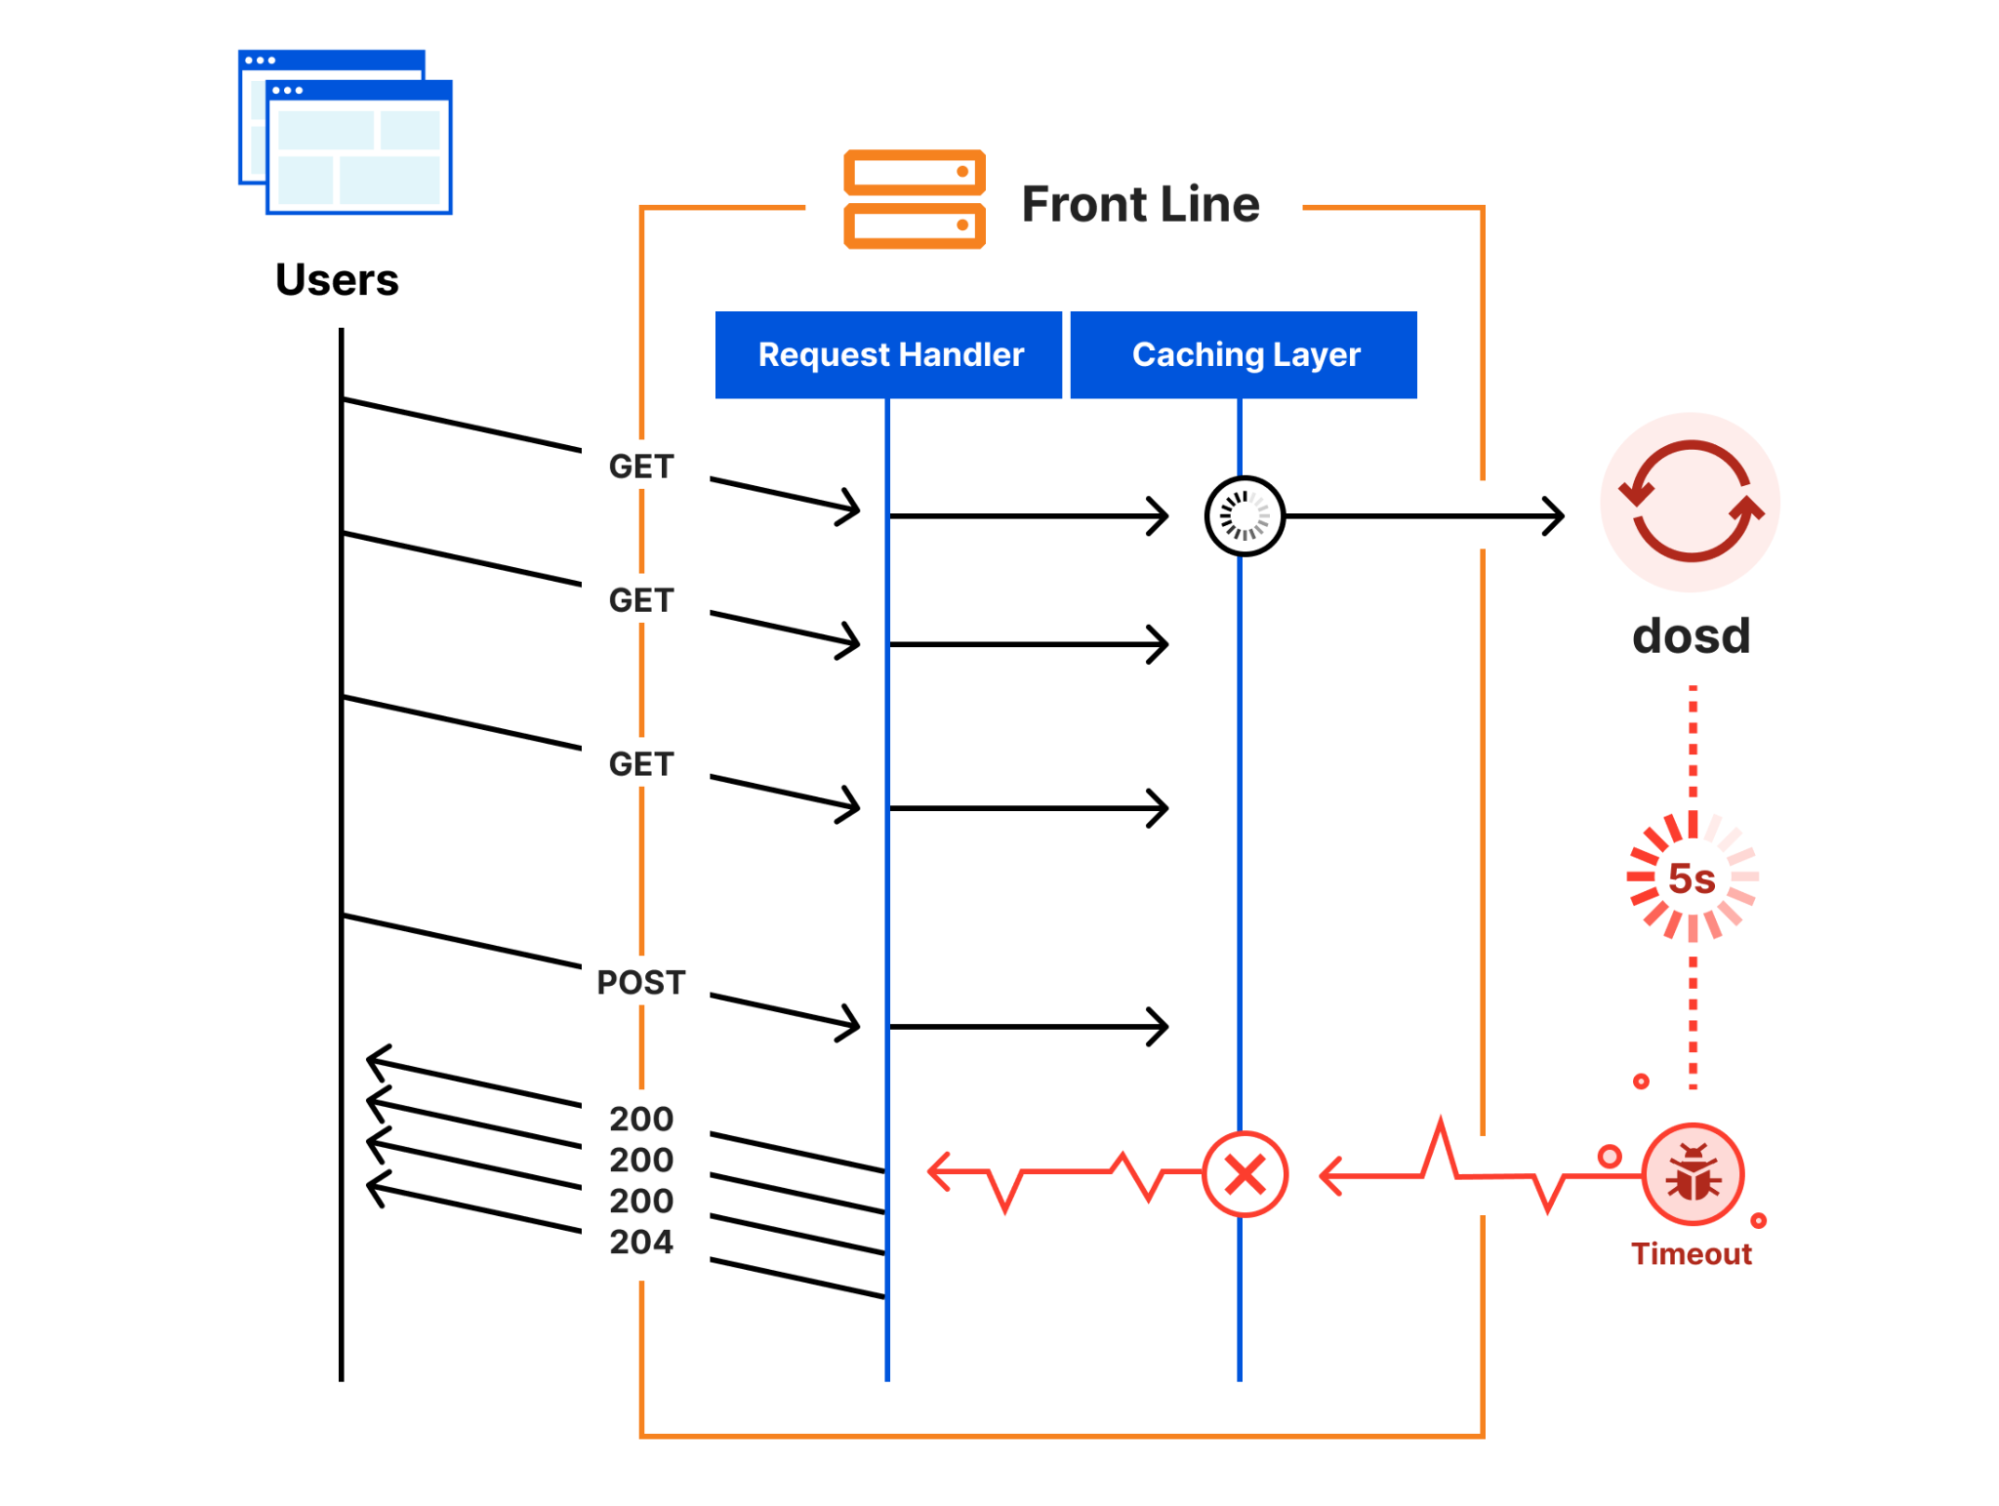
Every request to Cloudflare takes a well-defined path through our network. It could be from a browser loading a webpage, a mobile app calling an API, or automated traffic from another service. These requests first terminate at our HTTP and TLS layer, then flow into our core proxy system (which we call FL for “Frontline”), and finally through Pingora, which performs cache lookups or fetches data from the origin if needed.

We previously shared more detail about how the core proxy works here


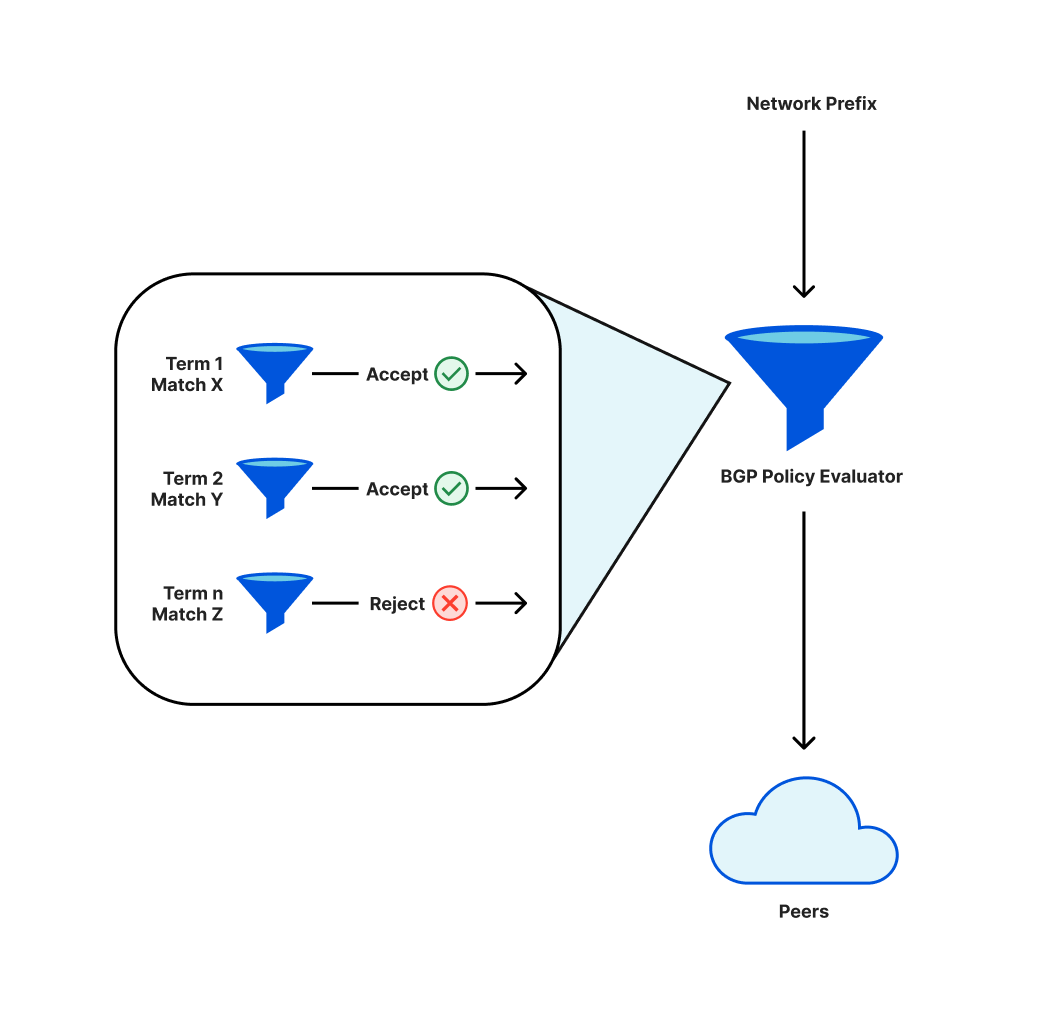
As a request transits the core proxy, we run the various security and performance products available in our network. The proxy applies each customer’s unique configuration and settings, from enforcing WAF rules and DDoS protection to routing traffic to the Developer Platform and R2. It accomplishes this through a set of domain-specific modules that apply the configuration and policy rules to traffic transiting our proxy.

One of those modules, Bot Management, was the source of today’s outage. 

Cloudflare’s Bot Management includes, among other systems, a machine learning model that we use to generate bot scores for every request traversing our network. Our customers use bot scores to control which bots are allowed to access their sites — or not.

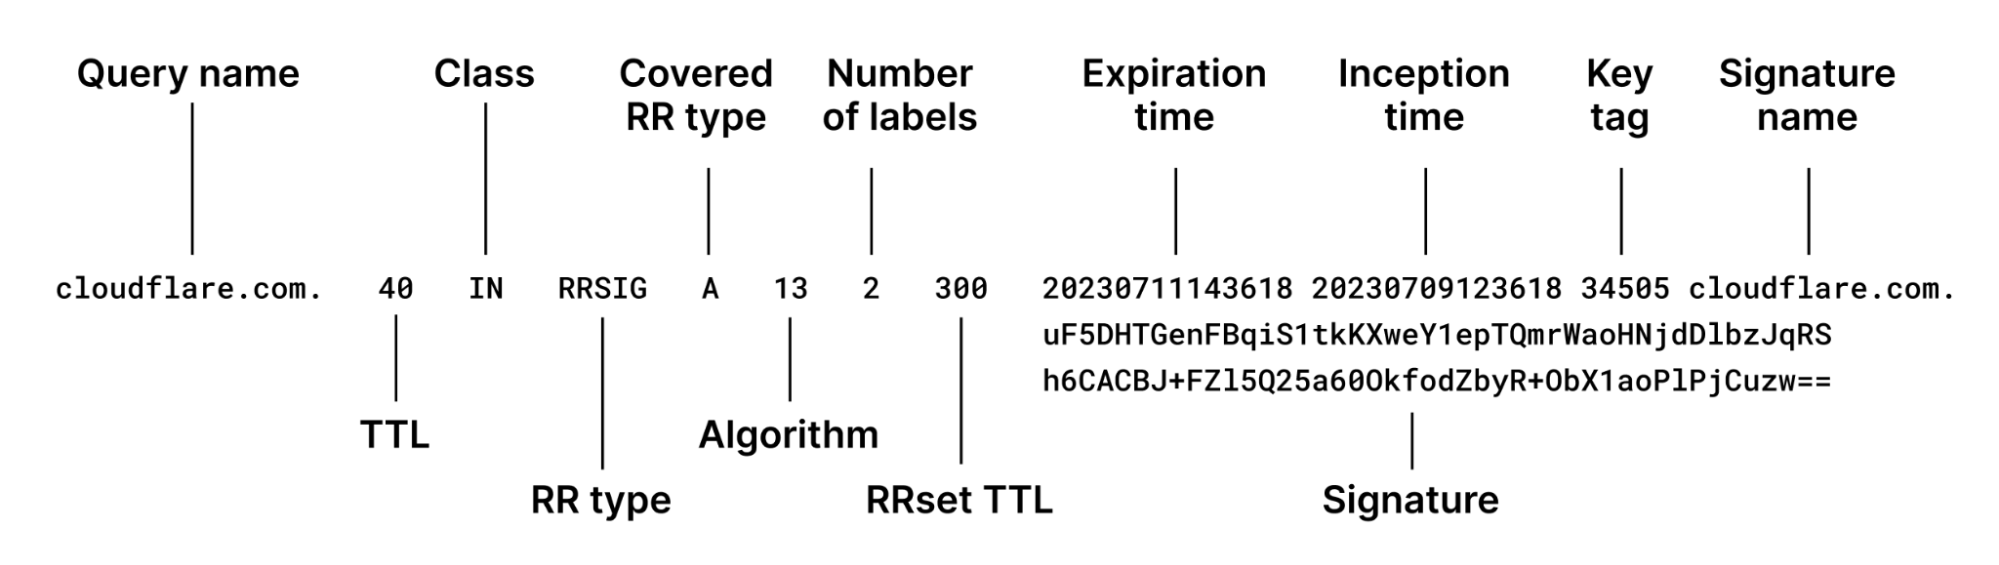
The model takes as input a “feature” configuration file. A feature, in this context, is an individual trait used by the machine learning model to make a prediction about whether the request was automated or not. The feature configuration file is a collection of individual features.

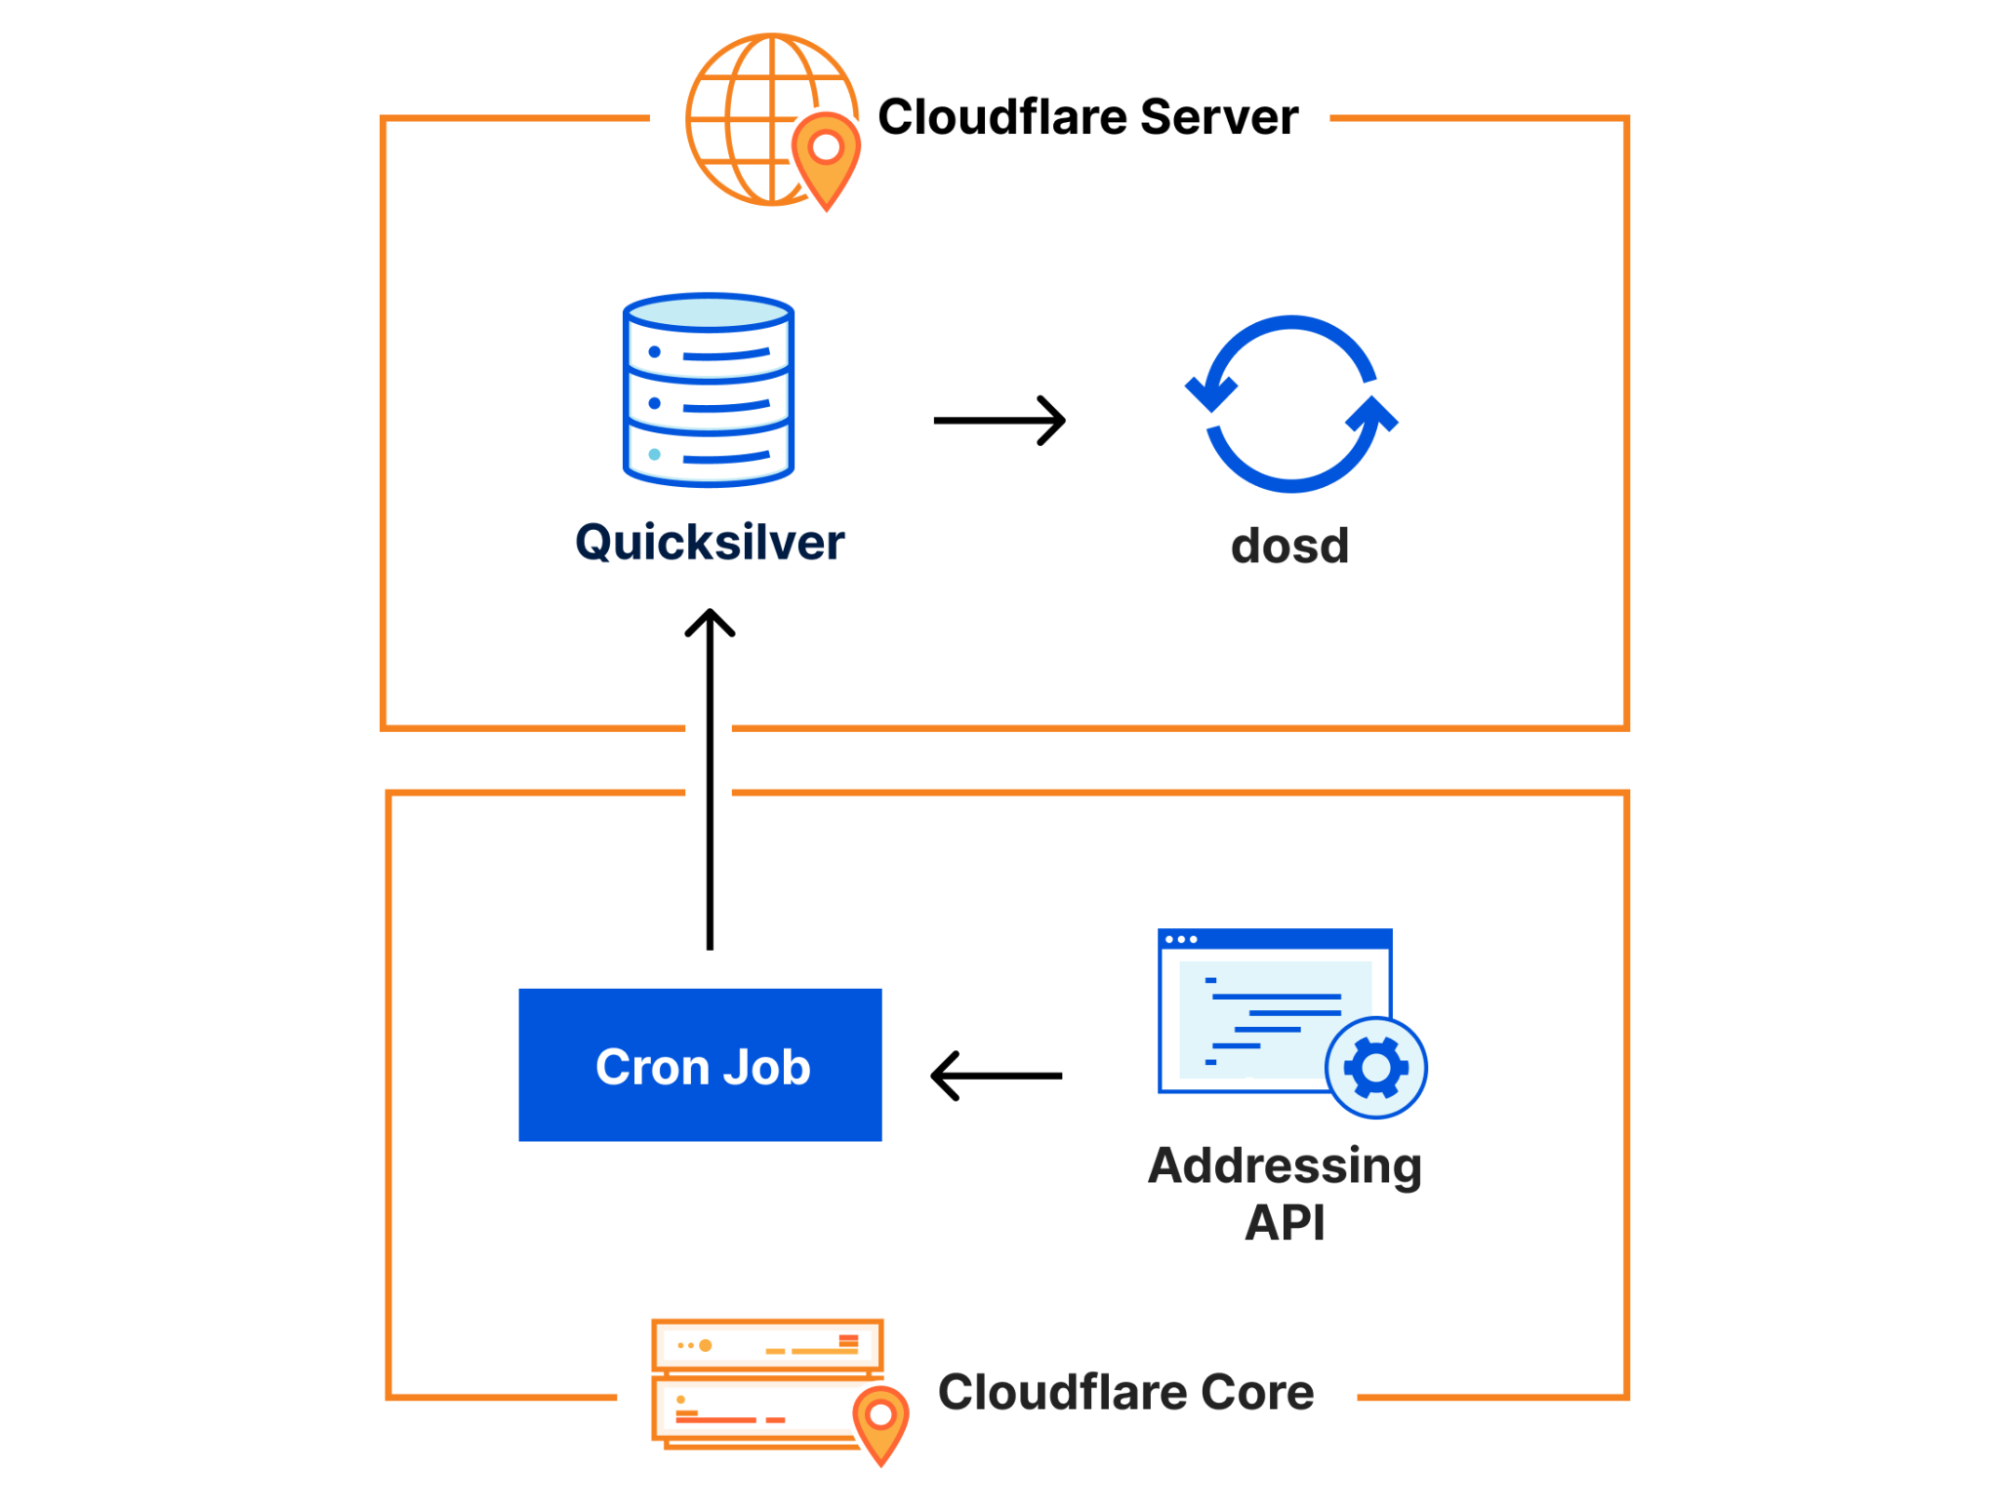
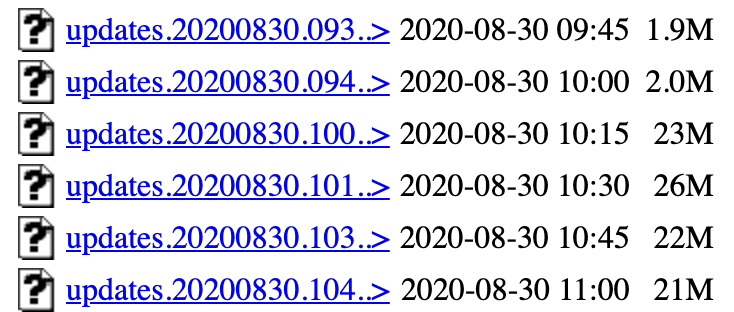
This feature file is refreshed every few minutes and published to our entire network and allows us to react to variations in traffic flows across the Internet. It allows us to react to new types of bots and new bot attacks. So it’s critical that it is rolled out frequently and rapidly as bad actors change their tactics quickly.

A change in our underlying ClickHouse query behaviour (explained below) that generates this file caused it to have a large number of duplicate “feature” rows. This changed the size of the previously fixed-size feature configuration file, causing the bots module to trigger an error.

As a result, HTTP 5xx error codes were returned by the core proxy system that handles traffic processing for our customers, for any traffic that depended on the bots module. This also affected Workers KV and Access, which rely on the core proxy.

Unrelated to this incident, we were and are currently migrating our customer traffic to a new version of our proxy service, internally known as FL2. Both versions were affected by the issue, although the impact observed was different.

Customers deployed on the new FL2 proxy engine, observed HTTP 5xx errors. Customers on our old proxy engine, known as FL, did not see errors, but bot scores were not generated correctly, resulting in all traffic receiving a bot score of zero. Customers that had rules deployed to block bots would have seen large numbers of false positives. Customers who were not using our bot score in their rules did not see any impact.

Throwing us off and making us believe this might have been an attack was another apparent symptom we observed: Cloudflare’s status page went down. The status page is hosted completely off Cloudflare’s infrastructure with no dependencies on Cloudflare. While it turned out to be a coincidence, it led some of the team diagnosing the issue to believe that an attacker may be targeting both our systems as well as our status page. Visitors to the status page at that time were greeted by an error message:


In the internal incident chat room, we were concerned that this might be the continuation of the recent spate of high volume Aisuru DDoS attacks:


The query behaviour change

I mentioned above that a change in the underlying query behaviour resulted in the feature file containing a large number of duplicate rows. The database system in question uses ClickHouse’s software.

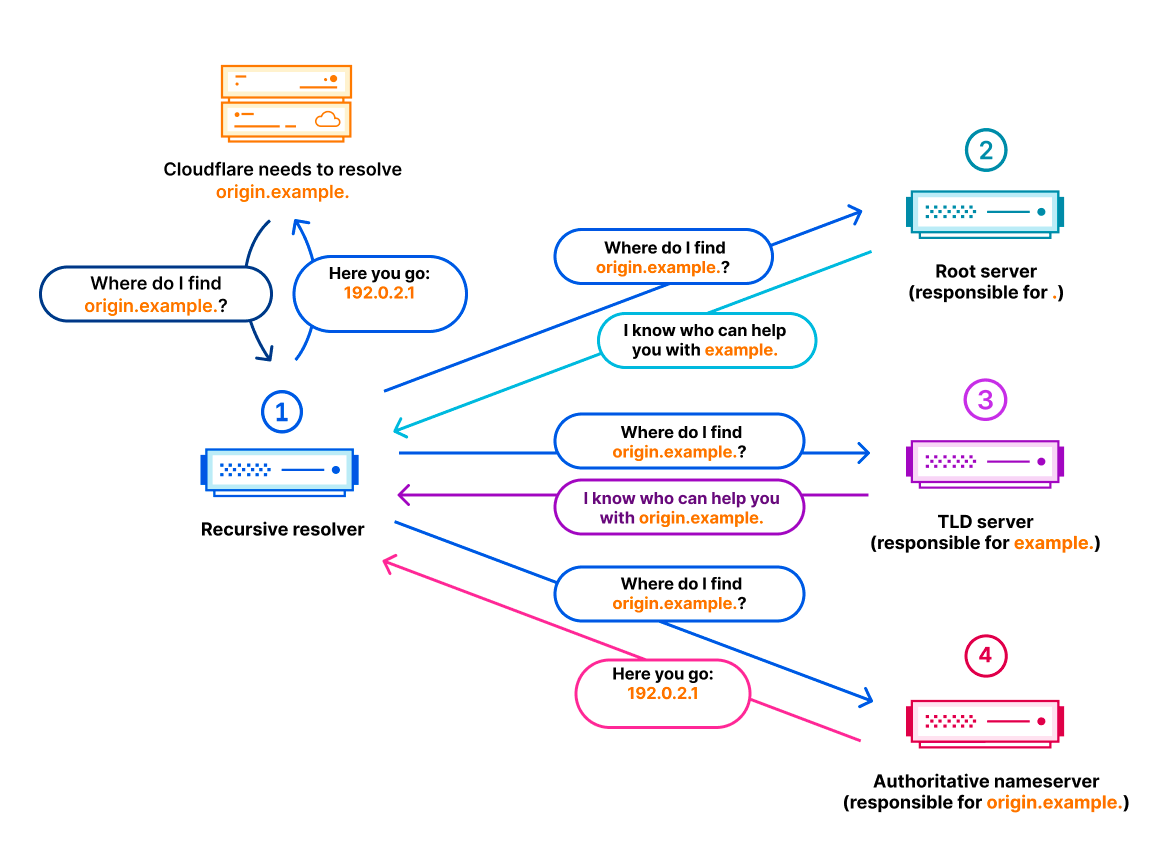
For context, it’s helpful to know how ClickHouse distributed queries work. A ClickHouse cluster consists of many shards. To query data from all shards, we have so-called distributed tables (powered by the table engine Distributed) in a database called default. The Distributed engine queries underlying tables in a database r0. The underlying tables are where data is stored on each shard of a ClickHouse cluster.

Queries to the distributed tables run through a shared system account. As part of efforts to improve our distributed queries security and reliability, there’s work being done to make them run under the initial user accounts instead.

Before today, ClickHouse users would only see the tables in the default database when querying table metadata from ClickHouse system tables such as system.tables or system.columns.

Since users already have implicit access to underlying tables in r0, we made a change at 11:05 to make this access explicit, so that users can see the metadata of these tables as well. By making sure that all distributed subqueries can run under the initial user, query limits and access grants can be evaluated in a more fine-grained manner, avoiding one bad subquery from a user affecting others.

The change explained above resulted in all users accessing accurate metadata about tables they have access to. Unfortunately, there were assumptions made in the past, that the list of columns returned by a query like this would only include the “default” database:

SELECT
name,
type
FROM system.columns
WHERE
table = 'http_requests_features'
order by name;

Note how the query does not filter for the database name. With us gradually rolling out the explicit grants to users of a given ClickHouse cluster, after the change at 11:05 the query above started returning “duplicates” of columns because those were for underlying tables stored in the r0 database.

This, unfortunately, was the type of query that was performed by the Bot Management feature file generation logic to construct each input “feature” for the file mentioned at the beginning of this section. 

The query above would return a table of columns like the one displayed (simplified example):


However, as part of the additional permissions that were granted to the user, the response now contained all the metadata of the r0 schema effectively more than doubling the rows in the response ultimately affecting the number of rows (i.e. features) in the final file output. 

Memory preallocation

Each module running on our proxy service has a number of limits in place to avoid unbounded memory consumption and to preallocate memory as a performance optimization. In this specific instance, the Bot Management system has a limit on the number of machine learning features that can be used at runtime. Currently that limit is set to 200, well above our current use of ~60 features. Again, the limit exists because for performance reasons we preallocate memory for the features.

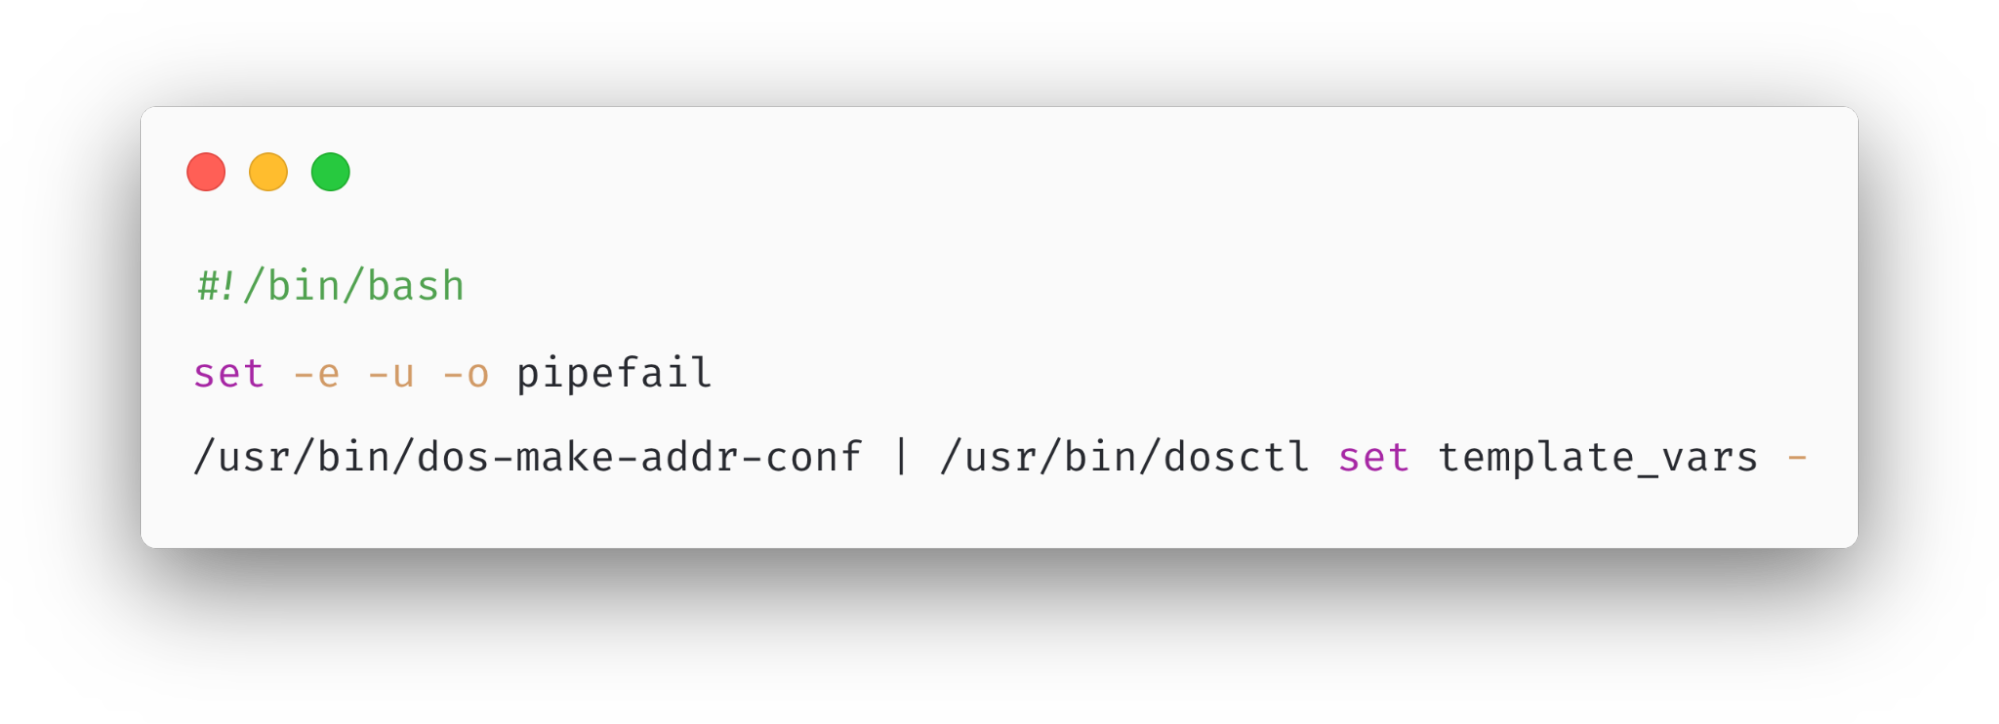
When the bad file with more than 200 features was propagated to our servers, this limit was hit — resulting in the system panicking. The FL2 Rust code that makes the check and was the source of the unhandled error is shown below:


This resulted in the following panic which in turn resulted in a 5xx error:

thread fl2_worker_thread panicked: called Result::unwrap() on an Err value

Other impact during the incident

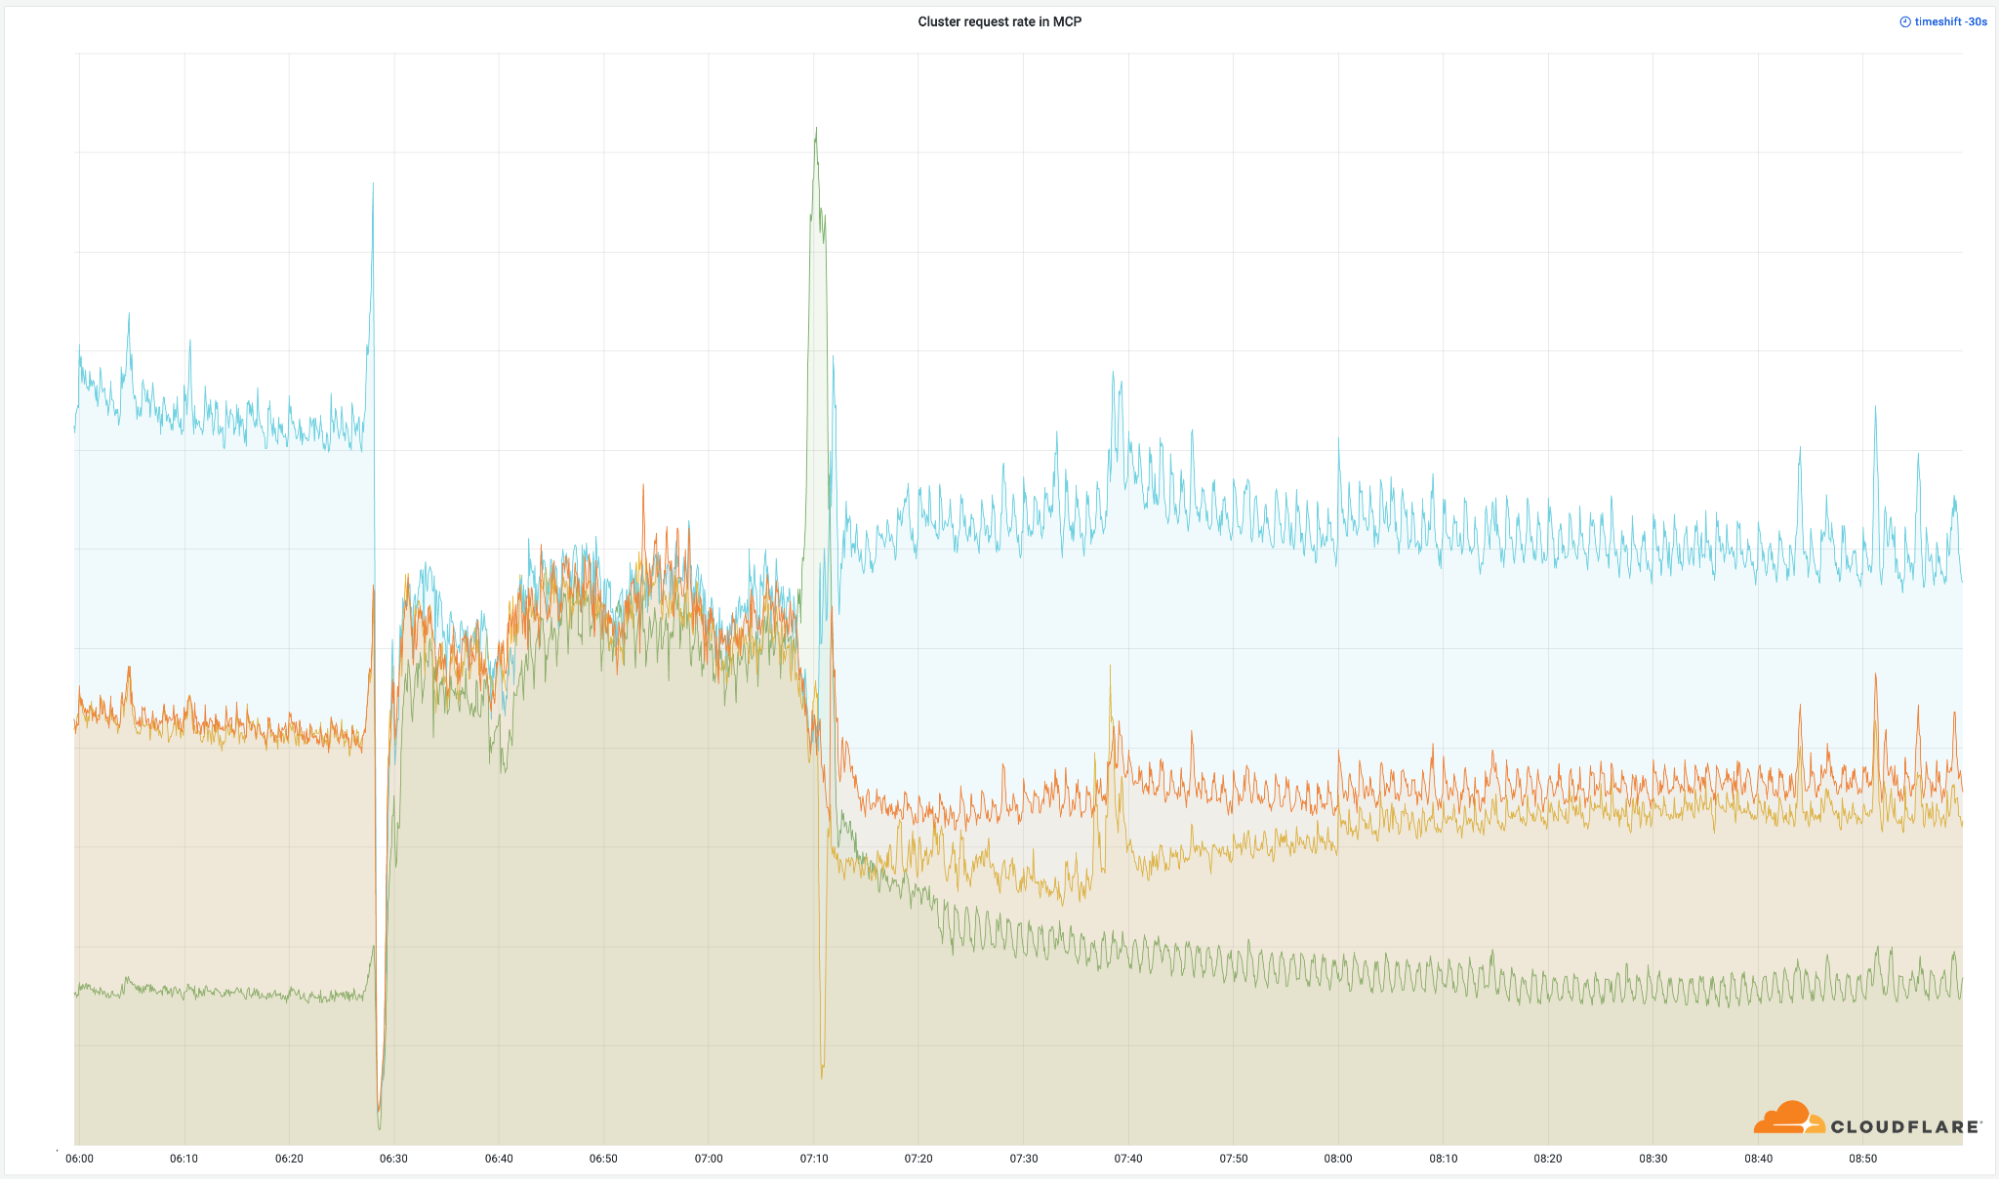
Other systems that rely on our core proxy were impacted during the incident. This included Workers KV and Cloudflare Access. The team was able to reduce the impact to these systems at 13:04, when a patch was made to Workers KV to bypass the core proxy. Subsequently, all downstream systems that rely on Workers KV (such as Access itself) observed a reduced error rate. 

The Cloudflare Dashboard was also impacted due to both Workers KV being used internally and Cloudflare Turnstile being deployed as part of our login flow.

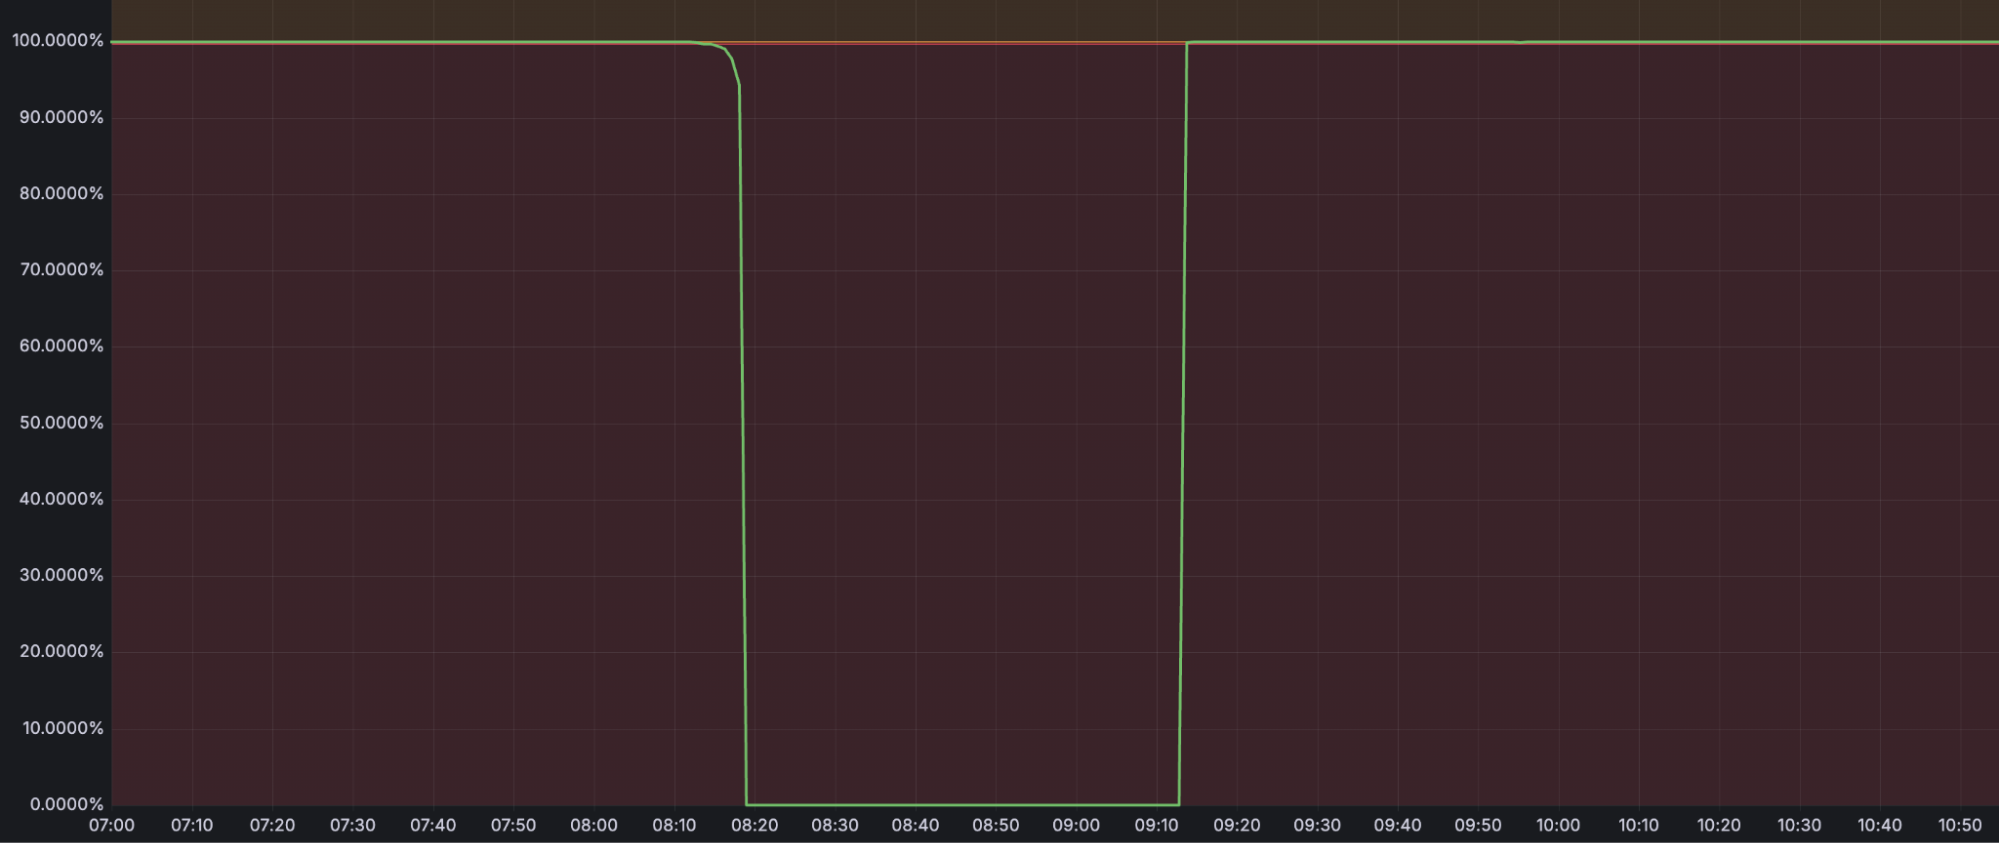
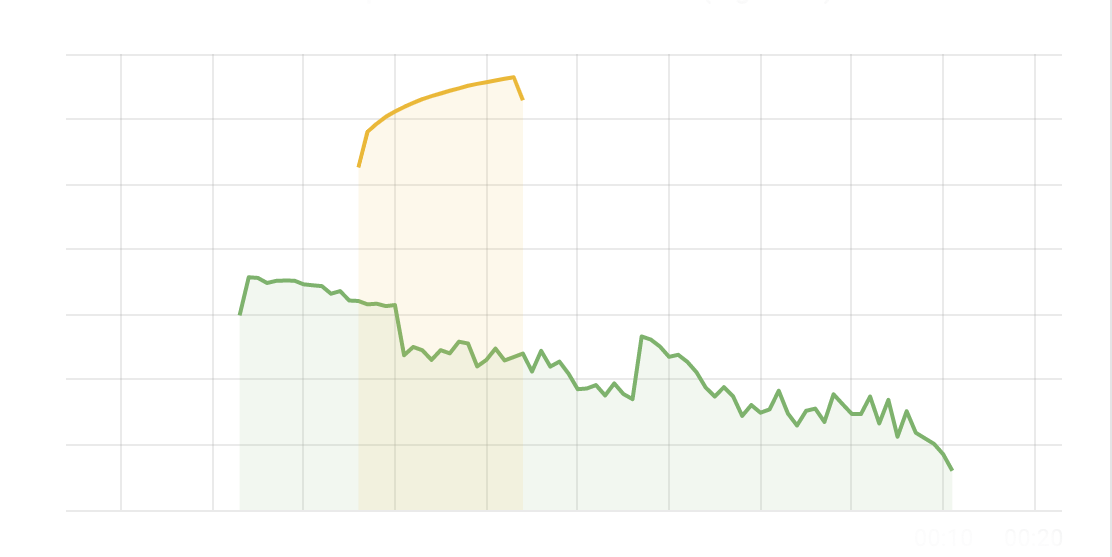
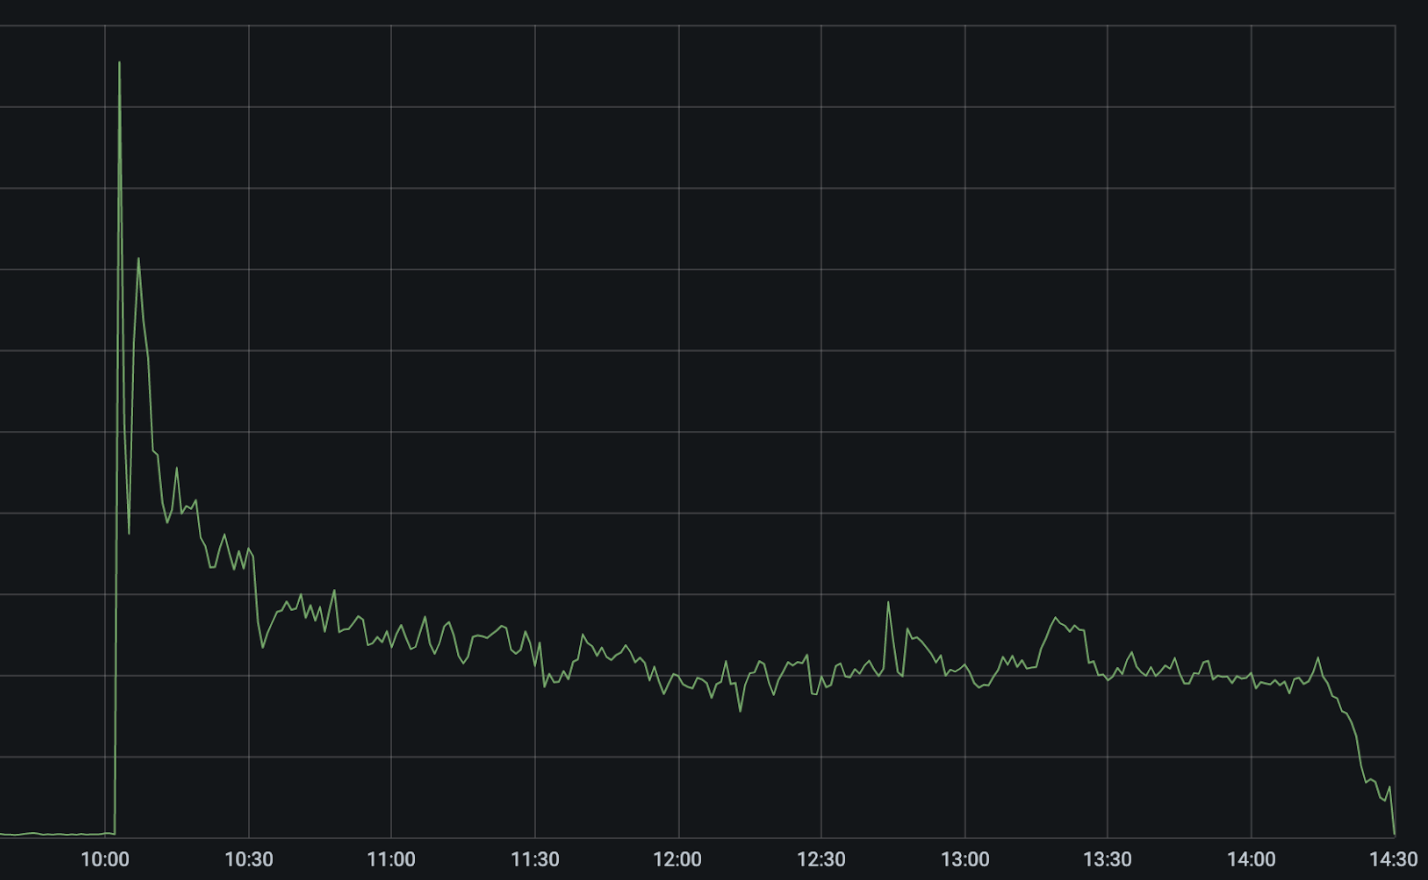
Turnstile was impacted by this outage, resulting in customers who did not have an active dashboard session being unable to log in. This showed up as reduced availability during two time periods: from 11:30 to 13:10, and between 14:40 and 15:30, as seen in the graph below.


The first period, from 11:30 to 13:10, was due to the impact to Workers KV, which some control plane and dashboard functions rely upon. This was restored at 13:10, when Workers KV bypassed the core proxy system.

The second period of impact to the dashboard occurred after restoring the feature configuration data. A backlog of login attempts began to overwhelm the dashboard. This backlog, in combination with retry attempts, resulted in elevated latency, reducing dashboard availability. Scaling control plane concurrency restored availability at approximately 15:30.

Remediation and follow-up steps

Now that our systems are back online and functioning normally, work has already begun on how we will harden them against failures like this in the future. In particular we are:

  • Hardening ingestion of Cloudflare-generated configuration files in the same way we would for user-generated input

  • Enabling more global kill switches for features

  • Eliminating the ability for core dumps or other error reports to overwhelm system resources

  • Reviewing failure modes for error conditions across all core proxy modules

Today was Cloudflare’s worst outage since 2019. We’ve had outages that have made our dashboard unavailable. Some that have caused newer features to not be available for a period of time. But in the last 6+ years we’ve not had another outage that has caused the majority of core traffic to stop flowing through our network.

An outage like today is unacceptable. We’ve architected our systems to be highly resilient to failure to ensure traffic will always continue to flow. When we’ve had outages in the past it’s always led to us building new, more resilient systems.

On behalf of the entire team at Cloudflare, I would like to apologize for the pain we caused the Internet today.

Time (UTC)

Status

Description

11:05

Normal.

Database access control change deployed.

11:28

Impact starts.

Deployment reaches customer environments, first errors observed on customer HTTP traffic.

11:32-13:05

The team investigated elevated traffic levels and errors to Workers KV service.

The initial symptom appeared to be degraded Workers KV response rate causing downstream impact on other Cloudflare services.

Mitigations such as traffic manipulation and account limiting were attempted to bring the Workers KV service back to normal operating levels.

The first automated test detected the issue at 11:31 and manual investigation started at 11:32. The incident call was created at 11:35.

13:05

Workers KV and Cloudflare Access bypass implemented — impact reduced.

During investigation, we used internal system bypasses for Workers KV and Cloudflare Access so they fell back to a prior version of our core proxy. Although the issue was also present in prior versions of our proxy, the impact was smaller as described below.

13:37

Work focused on rollback of the Bot Management configuration file to a last-known-good version.

We were confident that the Bot Management configuration file was the trigger for the incident. Teams worked on ways to repair the service in multiple workstreams, with the fastest workstream a restore of a previous version of the file.

14:24

Stopped creation and propagation of new Bot Management configuration files.

We identified that the Bot Management module was the source of the 500 errors and that this was caused by a bad configuration file. We stopped automatic deployment of new Bot Management configuration files.

14:24

Test of new file complete.

We observed successful recovery using the old version of the configuration file and then focused on accelerating the fix globally.

14:30

Main impact resolved. Downstream impacted services started observing reduced errors.

A correct Bot Management configuration file was deployed globally and most services started operating correctly.

17:06

All services resolved. Impact ends.

All downstream services restarted and all operations fully restored.

The impact of the Salesloft Drift breach on Cloudflare and our customers

Post Syndicated from Sourov Zaman original https://blog.cloudflare.com/response-to-salesloft-drift-incident/

Last week, Cloudflare was notified that we (and our customers) are affected by the Salesloft Drift breach. Because of this breach, someone outside Cloudflare got access to our Salesforce instance, which we use for customer support and internal customer case management, and some of the data it contains. Most of this information is customer contact information and basic support case data, but some customer support interactions may reveal information about a customer’s configuration and could contain sensitive information like access tokens. Given that Salesforce support case data contains the contents of support tickets with Cloudflare, any information that a customer may have shared with Cloudflare in our support system—including logs, tokens or passwords—should be considered compromised, and we strongly urge you to rotate any credentials that you may have shared with us through this channel.

As part of our response to this incident, we did our own search through the compromised data to look for tokens or passwords and found 104 Cloudflare API tokens. We have identified no suspicious activity associated with those tokens, but all of these have been rotated in an abundance of caution. All customers whose data was compromised in this breach have been informed directly by Cloudflare.

No Cloudflare services or infrastructure were compromised as a result of this breach.

We are responsible for the choice of tools we use in support of our business. This breach has let our customers down. For that, we sincerely apologize. The rest of this blog gives a detailed timeline and detailed information on how we investigated this breach.

The Salesloft Drift breach

Last week, Cloudflare became aware of suspicious activity within our Salesforce tenant and learned that we, as well as hundreds of other companies, had become the target of a threat actor that was able to successfully exfiltrate the text fields of support cases from our Salesforce instance. Our security team immediately began an investigation, cut off the threat actor’s access, and took a number of steps, detailed below, to secure our environment. We are writing this blog to detail what happened, how we responded, and to help our customers and others understand how to protect themselves from this incident.

Cloudflare uses Salesforce to keep track of who our customers are and how they use our services, and we use it as a support tool to interact with our customers. An important detail to understand as part of this incident is that the threat actor only accessed data in Salesforce “cases,” which may be created when Cloudflare sales and support team members need to comment to each other internally in order to support our customers; they are also created when customers interact with Cloudflare support. Salesforce had an integration with the Salesloft Drift chatbot, which Cloudflare used to give anyone who visited our website a way to contact us.

As Salesloft has announced, a threat actor breached their systems. As part of the breach, the threat actor was able to obtain OAuth credentials associated with the Salesloft Drift chat agent’s Salesforce integration to exfiltrate data from Salesloft customers’ Salesforce instances. Our investigation revealed that this was part of a sophisticated supply chain attack targeting business-to-business third-party integrations, affecting hundreds of organizations globally that were customers of Salesloft. Cloudforce One—Cloudflare’s threat intelligence & research team—has classified the advanced threat actor as GRUB1. Additional disclosures from Google’s Threat Intelligence Group aligned with the activity we observed in our environment.

Our investigation showed the threat actor compromised and exfiltrated data from our Salesforce tenant between August 12-17, 2025, following initial reconnaissance observed on August 9, 2025. A detailed analysis confirmed the exposure was limited to Salesforce case objects, which primarily consist of customer support tickets and their associated data within our Salesforce tenant. These case objects contain customer contact information related to the support case, case subject lines, and the body of the case correspondence—but not any attachments to the cases. Cloudflare does not request or require customers to share secrets, credentials, or API keys in support cases. However, in some troubleshooting scenarios, customers may paste keys, logs, or other sensitive information into the case text fields. Anything shared through this channel should now be considered compromised.

We believe this incident was not an isolated event but that the threat actor intended to harvest credentials and customer information for future attacks. Given that hundreds of organizations were affected through this Drift compromise, we suspect the threat actor will use this information to launch targeted attacks against customers across the affected organizations. 

This post provides a timeline of the attack, details our response, and offers security recommendations to help other organizations mitigate similar threats.

Throughout this blog post, all dates and times are in UTC.

Cloudflare’s response and remediation

When Salesforce and Salesloft notified us on August 23, 2025, that the Drift integration had been abused across multiple organizations, including Cloudflare, we immediately launched a company-wide Security Incident Response. We activated cross-functional teams, pulling together experts from Security, IT, Product, Legal, Communications, and business leadership under a single, unified incident command structure.

We set up four clear priority workstreams with the goal to protect our customers and Cloudflare:

  1. Immediate Threat Containment: We cut off all threat actor access by disabling the compromised Drift integration, conducted forensic analysis to understand the scope of the compromise, and eliminated the active threat from our environment.

  2. Secure our third-party ecosystem: We immediately disconnected all third-party integrations from Salesforce. We issued new secrets for all services and implemented a new process to rotate them weekly.

  3. Safeguard the integrity of our wider systems: We expanded credential rotation to all our third-party Internet services and accounts as a precautionary measure to prevent the attacker from using compromised data to access other Cloudflare systems.

  4. Customer Impact Analysis: We analyzed our Salesforce case objects data to identify whether customers could be compromised and to ensure they received timely and accurate communication about potential exposure.

Attack timeline & Cloudflare response

Our forensic investigation reconstructed the threat actor’s activities against Cloudflare, which occurred between August 9 and August 17, 2025. The following is a chronological summary of the threat actor’s actions, including initial reconnaissance prior to the initial compromise.

August 9, 2025: First signs of reconnaissance

At 11:51, GRUB1 attempted to validate a Customer Cloudflare-issued API token to the Salesforce API. The actor used Trufflehog (a popular open-source secrets scanner) as their User-Agent and sent a verification request to client/v4/user/tokens/verify. The request failed with a 404 Not Found, confirming the token was invalid. The source of this API token is unclear—it could have been obtained from various sources including other Drift customers that GRUB1 may have compromised prior to Cloudflare. 

August 12, 2025: Initial compromise of Cloudflare

At 22:14, GRUB1 gained access to Cloudflare’s Salesforce tenant by using a stolen credential used by the Salesloft integration. Using this credential, the GRUB1 logged in from the IP address 44[.]215[.]108[.]109 and made a GET request to the /services/data/v58.0/sobjects/ API endpoint. This action appeared to enumerate all objects in our Salesforce environment, giving the threat actor a high-level overview of the data stored there.

August 13, 2025: Expanding reconnaissance

One day after the initial breach, the threat actor GRUB1 launched a subsequent attack from the same IP address, 44[.]215[.]108[.]109. Starting at 19:33, the threat actor stole customer data from the Salesforce case objects. They first re-ran an object enumeration to confirm the data structure, then immediately retrieved the case objects’ schema using the /sobjects/Case/describe/ endpoint. This was followed by a broad Salesforce query that enumerated fields from the Salesforce case object.

August 14, 2025: Understanding our Salesforce environment

The threat actor GRUB1 dedicated hours to conduct comprehensive reconnaissance of Cloudflare’s Salesforce tenant from the IP address 44[.]215[.]108[.]109. It appears their objective was to build an understanding of our environment. For several hours, they executed a series of targeted queries:

  • 00:17 – They measured the tenant’s scale by counting accounts, contacts, and users; 

  • 04:34 – Analyzed case workflows by querying CaseTeamMemberHistory; and 

  • 11:09 – Confirmed they were in a production environment by fingerprinting the Organization object. 

The threat actor completed their reconnaissance with additional queries to understand how our customer support system operates—including how team members handle different types of cases, how cases are assigned and escalated, and how our support processes work—and then queried the /limits/ endpoint to learn the API’s operational thresholds. The queries run by GRUB1 provided them with insight into their level of access, the size of the case objects, and the precise API limits they needed to respect to avoid detection within our Salesforce environment.

August 16, 2025: Preparing for the operation

Following the reconnaissance on August 14, 2025, we observed no traffic or successful logins from the threat actor GRUB1 for nearly 48 hours.  

They returned on August 16, 2025. At 19:26, GRUB1 logged back into Cloudflare’s Salesforce tenant from the IP address 44[.]215[.]108[.]109 and, at 19:28, executed a single, final query: SELECT COUNT() FROM Case. This action served as a final “dry run” to verify the exact size of the dataset they were about to steal, marking the definitive end of the reconnaissance phase and setting the stage for the main attack. 

August 17, 2025: Final exfiltration and coverup

GRUB1 initiated the data exfiltration phase by switching to new infrastructure, logging in at 11:11:23 from the IP address 208[.]68[.]36[.]90. After performing one final check on the size of the case object, they launched a Salesforce Bulk API 2.0 job at 11:11:56. In just over three minutes, they successfully exfiltrated a dataset containing the text of support cases—but not any attachments or files—in our instance of Salesforce. At 11:15:42, GRUB1 attempted to cover their tracks by deleting the API job. While this action concealed the primary evidence, our team was able to reconstruct the attack from residual logs. 

We observed no further activity from this threat actor after August 17, 2025.

August 20, 2025: Vendor action ahead of notification

Salesloft revoked Drift-to-Salesforce connections across its customer base and published a notice on their website. At that point, Cloudflare had not yet been notified, and we had no indication that this vendor action might relate to our environment.

August 23, 2025: Salesforce and Salesloft notifications to Cloudflare

Our response to this incident began when Salesforce and Salesloft notified us of unusual Drift-related activity.  We promptly implemented the vendors’ recommended containment steps and engaged them to gather intelligence. 

August 25, 2025: Cloudflare initiates response activity

By August 25, we had received additional intelligence about the incident and escalated our response beyond the initial vendor-recommended containment steps. We launched our own comprehensive investigation and remediation effort.

Our first priority was cutting off GRUB1’s access at the source. We disabled the Drift user account, revoked its client ID and secrets, and completely purged all Salesloft software and browser extensions from Cloudflare systems. This comprehensive removal mitigated the risk of the threat actor reusing compromised tokens, regaining access through stale sessions, or leveraging software extensions for persistence.

Separately, we expanded our security review to include all third-party services connected to our Salesforce environment, rotating credentials as a precautionary measure to prevent any potential lateral movement by the threat actor. 

Since we use Salesforce as our primary tool for managing our customer support data, the risk was that customers had submitted secrets, passwords, or other sensitive data in their customer service requests. We needed to understand what sensitive material the attacker now had. 

We immediately focused on whether any of that data could have been used to compromise our customers accounts, systems, or infrastructure. We examined the data obtained by the threat actor to see if it contained exposed credentials, since cases include freeform text fields where customers may submit Cloudflare API tokens, keys, or logs to our support team. Our teams developed custom scanning tools using regex, entropy, and pattern-matching techniques to detect likely Cloudflare secrets at scale. 

Our investigation confirmed that the exposure was strictly limited to the freeform text in Salesforce case objects—not attachments or files. Cases are used by sales and support teams to communicate internally about customer support issues and to communicate directly with customers. As a result, these case objects contained text-only data consisting of:

  • The subject line of the Salesforce case

  • The body of the case (freeform text which may include any correspondence including keys, secrets, etc., if provided by the customer to Cloudflare)

  • Customer contact information (for example, company name, requestor email address and phone number, company domain name, and company country)

This conclusion was validated through extensive reviews of integrations, authentication activity, endpoint telemetry, and network logs.

August 26–29, 2025: Scaling the response and proactive measures

While the primary Salesforce and Salesloft credentials had already been rotated, our next step was to terminate and securely re-establish our third-party integrations. We began methodically re-onboarding the terminated services, ensuring each was provisioned with new secrets and subject to stricter security controls.

Meanwhile, our teams continued to analyze the data that was exfiltrated. Based on the analysis, we triaged & validated potential exposures, operating under the principle that any data that could have been exposed, was examined. This enabled us to take direct action by rotating Cloudflare platform-issued tokens immediately upon discovery—a total of 104 API tokens were rotated. No suspicious activity has been identified related to those tokens. 

September 2, 2025: Customers notified 

Based on Cloudflare’s detailed analysis—all impacted customers were formally notified via email and banner notices in our Dashboard with information about the incident and recommended next steps. 

Recommendations for all organizations

This incident highlights the critical need for heightened vigilance in securing SaaS applications and other third-party integrations. The data compromised across hundreds of companies targeted in this attack could be used to launch additional attacks. We strongly urge all organizations to adopt the following security measures:

  • Disconnect Salesloft and its applications: Immediately disconnect all Salesloft connections from your Salesforce environment and uninstall any related software or browser extensions.

  • Rotate credentials: Reset the credentials for all third-party applications and integrations connected to your Salesforce instance. Rotate any credentials that may have been previously shared in a support case to Cloudflare. Based on the scope and intent of this attack, we also recommend rotating all third party credentials in your environment as well as any credentials that may have been included in a support case with any other vendor. 

  • Implement frequent credential rotation: Establish a regular rotation schedule for all API keys and other secrets used in your integrations to reduce the window of exposure.

  • Review support case data: Review all customer support case data with your third-party providers to identify what sensitive information may have been exposed. Look for cases containing credentials, API keys, configuration details, or other sensitive data that customers may have shared. For Cloudflare customers specifically: you can access your support case history through the Cloudflare dashboard under Support > Technical Support > My Activities, where you can filter cases or use the “Download Cases” feature to conduct a comprehensive review.

  • Conduct forensics:  Review access logs and permissions to all third-party integrations and review public materials associated with the Drift incident and conduct a security review of your environment as appropriate.

  • Enforce least privilege: Audit all third-party applications to ensure they operate with the minimum level of access (least privilege) required for their function and ensure that admin accounts are not used for vendors. Additionally, enforce strict controls like IP address restrictions and session binding on all third-party and business-to-business (B2B) connections.

  • Enhance monitoring and controls: Deploy enhanced monitoring to detect anomalies such as large data exports or logins from unfamiliar locations. While capturing third party to third party logs can be difficult, it is imperative that these logs are part of your security operations teams.

Indicators of compromise

Below are the Indications of Compromise (IOCs) that we saw from GRUB1. We are publishing them so that other organizations, and especially those that may have been impacted by the Salesloft breach, can search their logs to confirm the same threat actor did not access their systems or third parties.

Indicator

Type

Description

208[.]68[.]36[.]90

IPV4

DigitalOcean based infrastructure 

44[.]215[.]108[.]109

IPV4

AWS based infrastructure 

TruffleHog

User Agent

Open source Secret Scanning tool

Salesforce-Multi-Org-Fetcher/1.0

User Agent

User-Agent string linked to malicious tooling

Salesforce-CLI/1.0

User Agent

Salesforce Command Line Interface (CLI),

python-requests/2.32.4

User Agent

User agent may indicate custom scripting 

Python/3.11 aiohttp/3.12.15

User Agent

User agent which may allow many API calls in parallel

Conclusion

We are responsible for the tools that we select and when those tools are compromised by sophisticated threat actors, we own the consequences. Our team responded to the notice, and our investigation confirmed that the impact was strictly limited to data in Salesforce case objects, with no compromise of other Cloudflare systems or infrastructure.

That said, we consider the compromise of any data to be unacceptable. Our customers trust Cloudflare with their data, their infrastructure, and their security. In turn, we sometimes place our trust in third-party tools which need to be monitored and carefully scoped in what they can access. We are responsible for this. We let our customers down. For this, we sincerely apologize.

As third-party tools increasingly integrate with internal corporate data across the industry, we need to approach each new tool with careful scrutiny. This incident affected hundreds of organizations through a single integration point, highlighting the interconnected risks in today’s technology landscape. We are committed to developing new capabilities to help us and our customers defend against such attacks in the future—stay tuned for announcements during Cloudflare’s Birthday Week later this month.

We are also committed to sharing threat intelligence and research with the broader security community. In the weeks ahead, our Cloudforce One team will publish an in-depth blog analyzing GRUB1’s tradecraft to support the broader community in defending against similar campaigns.

Detailed event timeline

The following table provides a granular, chronological view of GRUB1’s specific actions during the incident.

Date/Time (UTC)

Event Description

2025-08-09 11:51:13

GRUB1 observed leveraging Trufflehog and attempting to verify a token against a Cloudflare Customer Tenant: client/v4/user/tokens/verify, and received a 404 error from 44[.]215[.]108[.]109

2025-08-12 22:14:08

GRUB1 logged into Cloudflare’s Salesforce tenant from 44[.]215[.]108[.]109

2025-08-12 22:14:09

GRUB1 sent a GET request for a list of objects in Cloudflare’s Salesforce tenant: /services/data/v58.0/sobjects/

2025-08-13 19:33:02

GRUB1 logged into Cloudflare’s Salesforce tenant from 44[.]215[.]108[.]109

2025-08-13 19:33:03

GRUB1 sent a GET request for a list of objects in Cloudflare’s Salesforce tenant: /services/data/v58.0/sobjects/

2025-08-13 19:33:07 and 19:33:09

GRUB1 sent a GET request for metadata information for case in Cloudflare’s Salesforce tenant: /services/data/v58.0/sobjects/Case/describe/

2025-08-13 19:33:11

GRUB1 first observed executing Salesforce query: A broad query against the case object by 44[.]215[.]108[.]109. This produced one of the earliest and larger data responses, consistent with reconnaissance via bulk record retrieval

2025-08-14 0:17:40

GRUB1 lists available objects and counts “Account”, “Contact” and “User” objects.

2025-08-14 00:17:47

GRUB1 queried Account table in Cloudflare’s Salesforce tenant: “SELECT COUNT() FROM Account” query on Cloudflare’s Salesforce tenant

2025-08-14 00:17:51

GRUB1 queried Contact table in Cloudflare’s Salesforce tenant: “SELECT COUNT() FROM Contact” query on Cloudflare’s Salesforce tenant

2025-08-14 00:18:00

GRUB1 queried User table in Cloudflare’s Salesforce tenant: “SELECT COUNT() FROM User” query on Cloudflare’s Salesforce tenant

2025-08-14 04:34:39

GRUB1 queried “CaseTeamMemberHistory” in Cloudflare’s Salesforce tenant: “SELECT Id, IsDeleted, Name, CreatedDate, CreatedById, LastModifiedDate, LastModifiedById, SystemModstamp, LastViewedDate, LastReferencedDate, Case__c FROM CaseTeamMemberHistory__c LIMIT 5000”

2025-08-14 11:09:14

GRUB1 queried Organization table in Cloudflare’s Salesforce tenant: “SELECT Id, Name, OrganizationType, InstanceName, IsSandbox FROM Organization LIMIT 1”

2025-08-14 11:09:21

GRUB1 queried User table in Cloudflare’s Salesforce tenant: “SELECT Id, Username, Email, FirstName, LastName, Name, Title, CompanyName, Department, Division, Phone, MobilePhone, IsActive, LastLoginDate, CreatedDate, LastModifiedDate, TimeZoneSidKey, LocaleSidKey, LanguageLocaleKey, EmailEncodingKey FROM User WHERE IsActive = :x ORDER BY LastLoginDate DESC NULLS LAST LIMIT 20”

2025-08-14 11:09:22

GRUB1 sent a GET request on LimitSnapshot in Cloudflare’s Salesforce tenant: /services/data/v58.0/limits/

2025-08-16 19:26:37

GRUB1 logged into Cloudflare’s Salesforce tenant from  44[.]215[.]108[.]109

2025-08-16 19:28:08

GRUB1 queried Cases table in Cloudflare’s Salesforce tenant: SELECT COUNT() FROM Case

2025-08-17 11:11:23

GRUB1 logged into Cloudflare’s Salesforce tenant from 208[.]68[.]36[.]90

2025-08-17 11:11:55

GRUB1 queried Case table in Cloudflare’s Salesforce tenant: SELECT COUNT() FROM Case

2025-08-17 11:11:56 to 11:15:18

GRUB1 leveraged Salesforce BulkAPI 2.0 from 208[.]68[.]36[.]90 to execute a job to exfiltrate the Cases object 

2025-08-17 11:15:42

GRUB1 leveraged Salesforce Bulk API 2.0 from 208[.]68[.]36[.]90 to delete the recently executed job used to exfiltrate the Cases object

Cloudflare incident on August 21, 2025

Post Syndicated from David Tuber original https://blog.cloudflare.com/cloudflare-incident-on-august-21-2025/

On August 21, 2025, an influx of traffic directed toward clients hosted in the Amazon Web Services (AWS) us-east-1 facility caused severe congestion on links between Cloudflare and AWS us-east-1. This impacted many users who were connecting to or receiving connections from Cloudflare via servers in AWS us-east-1 in the form of high latency, packet loss, and failures to origins.

Customers with origins in AWS us-east-1 began experiencing impact at 16:27 UTC. The impact was substantially reduced by 19:38 UTC, with intermittent latency increases continuing until 20:18 UTC.

This was a regional problem between Cloudflare and AWS us-east-1, and global Cloudflare services were not affected. The degradation in performance was limited to traffic between Cloudflare and AWS us-east-1. The incident was a result of a surge of traffic from a single customer that overloaded Cloudflare’s links with AWS us-east-1. It was a network congestion event, not an attack or a BGP hijack.

We’re very sorry for this incident. In this post, we explain what the failure was, why it occurred, and what we’re doing to make sure this doesn’t happen again.

Background

Cloudflare helps anyone to build, connect, protect, and accelerate their websites on the Internet. Most customers host their websites on origin servers that Cloudflare does not operate. To make their sites fast and secure, they put Cloudflare in front as a reverse proxy

When a visitor requests a page, Cloudflare will first inspect the request. If the content is already cached on Cloudflare’s global network, or if the customer has configured Cloudflare to serve the content directly, Cloudflare will respond immediately, delivering the content without contacting the origin. If the content cannot be served from cache, we fetch it from the origin, serve it to the visitor, and cache it along the way (if it is eligible). The next time someone requests that same content, we can serve it directly from cache instead of making another round trip to the origin server. 

When Cloudflare responds to a request with the cached content, it will send the response traffic over internal Data Center Interconnect (DCI) links through a series of network equipment and eventually reach the routers that represent our network edge (our “edge routers”) as shown below:


Our internal network capacity is designed to be larger than the available traffic demand in a location to account for failures of redundant links, failover from other locations, traffic engineering within or between networks, or even traffic surges from users. The majority of Cloudflare’s network links were operating normally, but some edge router links to an AWS peering switch had insufficient capacity to handle this particular surge. 

What happened

At approximately 16:27 UTC on August, 21, 2025, a customer started sending many requests from AWS us-east-1 to Cloudflare for objects in Cloudflare’s cache. These requests generated a volume of response traffic that saturated all available direct peering connections between Cloudflare and AWS. This initial saturation became worse when AWS, in an effort to alleviate the congestion, withdrew some BGP advertisements to Cloudflare over some of the congested links. This action rerouted traffic to an additional set of peering links connected to Cloudflare via an offsite network interconnection switch, which subsequently also became saturated, leading to significant performance degradation. The impact became worse for two reasons: One of the direct peering links was operating at half-capacity due to a pre-existing failure, and the Data Center Interconnect (DCI) that connected Cloudflare’s edge routers to the offsite switch was due for a capacity upgrade. The diagram below illustrates this using approximate capacity estimates:


In response, our incident team immediately engaged with our partners at AWS to address the issue. Through close collaboration, we successfully alleviated the congestion and fully restored services for all affected customers.

Timeline

Time

Description

2025-08-21 16:27 UTC

Traffic surge for single customer begins, doubling total traffic from Cloudflare to AWS

IMPACT START

2025-08-21 16:37 UTC

AWS begins withdrawing prefixes from Cloudflare on congested PNI (Private Network Interconnect) BGP sessions

2025-08-21 16:44 UTC

Network team is alerted to internal congestion in Ashburn (IAD)

2025-08-21 16:45 UTC

Network team is evaluating options for response, but AWS prefixes are unavailable on paths that are not congested due to their withdrawals

2025-08-21 17:22 UTC

AWS BGP prefixes withdrawals result in a higher amount of dropped traffic

IMPACT INCREASE

2025-08-21 17:45 UTC

Incident is raised for customer impact in Ashburn (IAD)

2025-08-21 19:05 UTC

Rate limiting of single customer causing traffic surge decreases congestion

2025-08-21 19:27 UTC

Network team additional traffic engineering actions fully resolve congestion

IMPACT DECREASE

2025-08-21 19:45 UTC

AWS begins reverting BGP withdrawals as requested by Cloudflare

2025-08-21 20:07 UTC

AWS finishes normalizing BGP prefix announcements to Cloudflare over IAD PNIs

2025-08-21 20:18 UTC

IMPACT END

When impact started, we saw a significant amount of traffic related to one customer, resulting in congestion:


This was handled by manual traffic actions both from Cloudflare and AWS. You can see some of the attempts by AWS to alleviate the congestion by looking at the number of IP prefixes AWS is advertising to Cloudflare during the duration of the outage. The lines in different colors correspond to the number of prefixes advertised per BGP session with us. The dips indicate AWS attempting to mitigate by withdrawing prefixes from the BGP sessions in an attempt to steer traffic elsewhere:


The congestion in the network caused network queues on the routers to grow significantly and begin dropping packets. Our edge routers were dropping high priority packets consistently during the outage, as seen in the chart below, which shows the queue drops for our Ashburn routers during the impact period:


The primary impact to customers as a result of this congestion would have been latency, loss (timeouts), or low throughput. We have a set of latency Service Level Objectives defined which imitate customer requests back to their origins measuring availability and latency. We can see that during the impact period, the percentage of requests whose latency fails to meet the target SLO threshold dips below an acceptable level in lock step with the packet drops during the outage:


After the congestion was alleviated, there was a brief period where both AWS and Cloudflare were attempting to normalize the prefix advertisements that had been adjusted to attempt to mitigate the congestion. That caused a long tail of latency that may have impacted some customers, which is why you see the packet drops resolve before the customer latencies are restored.

Remediations and follow-up steps

This event has underscored the need for enhanced safeguards to ensure that one customer’s usage patterns cannot negatively affect the broader ecosystem. Our key takeaways are the necessity of architecting for better customer isolation to prevent any single entity from monopolizing shared resources and impacting the stability of the platform for others, and augmenting our network infrastructure to have sufficient capacity to meet demand. 

To prevent a recurrence of this issue, we are implementing a multi-phased mitigation strategy. In the short and medium term: 

  • We are developing a mechanism to selectively deprioritize a customer’s traffic if it begins to congest the network to a degree that impacts others.

  • We are expediting the Data Center Interconnect (DCI) upgrades which will provide network capacity significantly above what it is today.

  • We are working with AWS to make sure their and our BGP traffic engineering actions do not conflict with one another in the future.

Looking further ahead, our long-term solution involves building a new, enhanced traffic management system. This system will allot network resources on a per-customer basis, creating a budget that, once exceeded, will prevent a customer’s traffic from degrading the service for anyone else on the platform. This system will also allow us to automate many of the manual actions that were taken to attempt to remediate the congestion seen during this incident.

Conclusion

Customers accessing AWS us-east-1 through Cloudflare experienced an outage due to insufficient network congestion management during an unusual high-traffic event.

We are sorry for the disruption this incident caused for our customers. We are actively making these improvements to ensure improved stability moving forward and to prevent this problem from happening again.

Redesigning Workers KV for increased availability and faster performance

Post Syndicated from Alex Robinson original https://blog.cloudflare.com/rearchitecting-workers-kv-for-redundancy/

On June 12, 2025, Cloudflare suffered a significant service outage that affected a large set of our critical services. As explained in our blog post about the incident, the cause was a failure in the underlying storage infrastructure used by our Workers KV service. Workers KV is not only relied upon by many customers, but serves as critical infrastructure for many other Cloudflare products, handling configuration, authentication and asset delivery across the affected services. Part of this infrastructure was backed by a third-party cloud provider, which experienced an outage on June 12 and directly impacted availability of our KV service.

Today we’re providing an update on the improvements that have been made to Workers KV to ensure that a similar outage cannot happen again. We are now storing all data on our own infrastructure. We are also serving all requests from our own infrastructure in addition to any third-party cloud providers used for redundancy, ensuring high availability and eliminating single points of failure. Finally, the work has meaningfully improved performance and set a clear path for the removal of any reliance on third-party providers as redundant back-ups.

Background: The Original Architecture

Workers KV is a global key-value store that supports high read volumes with low latency. Behind the scenes, the service stores data in regional storage and caches data across Cloudflare’s network to deliver exceptional read performance, making it ideal for configuration data, static assets, and user preferences that need to be available instantly around the globe.

Workers KV was initially launched in September 2018, predating Cloudflare-native storage services like Durable Objects and R2. As a result, Workers KV’s original design leveraged object storage offerings from multiple third-party cloud service providers, maximizing availability via provider redundancy. The system operated in an active-active configuration, successfully serving requests even when one of the providers was unavailable, experiencing errors, or performing slowly.

Requests to Workers KV were handled by Storage Gateway Worker (SGW), a service running on Cloudflare Workers. When it received a write request, SGW would simultaneously write the key-value pair to two different third-party object storage providers, ensuring that data was always available from multiple independent sources. Deletes were handled similarly, by writing a special tombstone value in place of the object to mark the key as deleted, with these tombstones garbage collected later.

Reads from Workers KV could usually be served from Cloudflare’s cache, providing reliably low latency. For reads of data not in cache, the system would race requests against both providers and return whichever response arrived first, typically from the geographically closer provider. This racing approach optimized read latency by always taking the fastest response while providing resilience against provider issues.


Given the inherent difficulty of keeping two independent storage providers synchronized, the architecture included sophisticated machinery to handle data consistency issues between backends. Despite this machinery, consistency edge cases remained more frequent than consumers required due to the inherently imperfect availability of upstream object storage systems and the challenges of maintaining perfect synchronization across independent providers.

Over the years, the system’s implementation evolved significantly, including a variety of performance improvements we discussed last year, but the fundamental dual-provider architecture remained unchanged. This provided a reliable foundation for the massive growth in Workers KV usage while maintaining the performance characteristics that made it valuable for global applications.

Scaling Challenges and Architectural Trade-offs

As Workers KV usage scaled dramatically and access patterns became more diverse, the dual-provider architecture faced mounting operational challenges. The providers had fundamentally different limits, failure modes, APIs, and operational procedures that required constant adaptation. 

The scaling issues extended beyond provider reliability. As KV traffic increased, the total number of IOPS exceeded what we could write to local cache infrastructure, forcing us to rely on traditional caching approaches when data was fetched from origin storage. This shift exposed additional consistency edge cases that hadn’t been apparent at smaller scales, as the caching behavior became less predictable and more dependent on upstream provider performance characteristics.

Eventually, the combination of consistency issues, provider reliability disparities, and operational overhead led to a strategic decision to reduce complexity by moving to a single object storage provider earlier this year. This decision was made with awareness of the increased risk profile, but we believed the operational benefits outweighed the risks and viewed this as a temporary intermediate state while we developed our own storage infrastructure.


Unfortunately, on June 12, 2025, that risk materialized when our remaining third-party cloud provider experienced a global outage, causing a high percentage of Workers KV requests to fail for a period that lasted over two hours. The cascading impact to customers and to other Cloudflare services was severe: Access failed all identity-based logins, Gateway proxy became unavailable, WARP clients couldn’t connect, and dozens of other services experienced significant disruptions.

Designing the Solution

The immediate goal after the incident was clear: bring at least one other fully redundant provider online such that another single-provider outage would not bring KV down. The new provider needed to handle massive scale along several dimensions: hundreds of billions of key-value pairs, petabytes of data stored, millions of GET requests per second, tens of thousands of steady-state PUT/DELETE requests per second, and tens of gigabits per second of throughput—all with high availability and low single-digit millisecond internal latency.

One obvious option was to bring back the provider that we had disabled earlier in the year. However, we could not just flip the switch back. The infrastructure to run in the dual backend configuration on the prior third-party storage provider was gone and the code had experienced some bit rot, making it infeasible to quickly revert to the previous dual-provider setup. 

Additionally, the other provider had frequently been a source of their own operational problems, with relatively high error rates and concerningly low request throughput limits, that made us hesitant to rely on it again. Ultimately, we decided that our second provider should be entirely owned and operated by Cloudflare.

The next option was to build directly on top of Cloudflare R2. We already had a private beta version of Workers KV running on R2, but this experience helped us better understand Workers KV’s unique storage requirements. Workers KV’s traffic patterns are characterized by hundreds of billions of small objects with a median size of just 288 bytes—very different from typical object storage workloads that assume larger file sizes.


For workloads dominated by sub-1KB objects at this scale, database storage becomes significantly more efficient and cost-effective than traditional object storage. When you need to store billions of very small values with minimal per-value overhead, a database is a natural architectural fit. We’re working on optimizations for R2 such as inlining small objects with metadata to eliminate additional retrieval hops that will improve performance for small objects, but for our immediate needs, a database-backed solution offered the most promising path forward.

After thorough evaluation of possible options, we decided to use a distributed database already in production at Cloudflare. This same database is used behind the scenes by both R2 and Durable Objects, giving us several key advantages: we have deep in-house expertise and existing automation for deployment and operations, and we knew we could depend on its reliability and performance characteristics at scale.

We sharded data across multiple database clusters, each with three-way replication for durability and availability. This approach allows us to scale capacity horizontally while maintaining strong consistency guarantees within each shard. We chose to run multiple clusters rather than one massive system to ensure a smaller blast radius if any cluster becomes unhealthy and to avoid pushing the practical limits of single-cluster scalability as Workers KV continues to grow.

Implementing the Solution

One immediate challenge that we ran into when implementing the system was connectivity. The SGW needed to communicate with database clusters running in our core datacenters, but databases typically use binary protocols over persistent TCP connections—not the HTTP-based communication patterns that work efficiently across our global network.

We built KV Storage Proxy (KVSP) to bridge this gap. KVSP is a service that provides an HTTP interface that our SGW can use while managing the complex database connectivity, authentication, and shard routing behind the scenes. KVSP stripes namespaces across multiple clusters using consistent hashing, preventing hotspotting where popular namespaces could overwhelm single clusters, eliminating noisy neighbor issues, and ensuring capacity limitations are distributed rather than concentrated.

The biggest downside of using a distributed database for Workers KV’s storage is that, while it excels at handling the small objects that dominate KV traffic, it is not optimal for the occasional large values of up to 25 MiB that some users store. Rather than compromise on either use case, we extended KVSP to automatically route larger objects to Cloudflare R2, creating a hybrid storage architecture that optimizes the backend choice based on object characteristics. From the perspective of SGW, this complexity is completely transparent—the same HTTP API works for all objects regardless of size.

We also restored our dual-provider capabilities between storage providers from KV’s prior architecture and adapted them to work well in tandem with the changes that had been made to KV’s implementation since it dropped down to a single provider. The modified system now operates by racing writes to both backends simultaneously, but returns success to the client as soon as the first backend confirms the write.

This improvement minimizes latency while ensuring durability across both systems. When one backend succeeds but the other fails—due to temporary network issues, rate limiting, or service degradation—the failed write is queued for background reconciliation, which serves as part of our synchronization machinery that is described in more detail below.


Deploying the Solution

With the hybrid architecture implemented, we began a careful rollout process designed to validate the new system while maintaining service availability.

The first step was introducing background writes from SGW to the new Cloudflare backend. This allowed us to validate write performance and error rates under real production load without affecting read traffic or user experience. It also was a necessary step in copying all data over to the new backend.

Next, we copied existing data from the third-party provider to our new backend running on Cloudflare infrastructure, routing the data through KVSP. This brought us to a critical milestone: we were now in a state where we could manually failover all operations to the new backend within minutes in the event of another provider outage. The single point of failure that caused the June incident had been eliminated.

With confidence in the failover capability, we began enabling our first namespaces in active-active mode, starting with internal Cloudflare services where we had sophisticated monitoring and deep understanding of the workloads. We dialed up traffic very slowly, carefully comparing results between backends. The fact that SGW could see responses from both backends asynchronously—after already returning a response to the user—allowed us to perform detailed comparisons and catch any discrepancies without impacting user-facing latency.

During testing, we discovered an important consistency regression compared to our single provider setup, which caused us to briefly roll back the change to put namespaces in active-active mode. While Workers KV is eventually consistent by design, with changes taking up to 60 seconds to propagate globally as cached versions time out, we had inadvertently regressed read-your-own-write (RYOW) consistency for requests routed through the same Cloudflare point of presence.

In the previous dual provider active-active setup, RYOW was provided within each PoP because we wrote PUT operations directly to a local cache instead of relying on the traditional caching system in front of upstream storage. However, KV throughput had outscaled the number of IOPS that the caching infrastructure could support, so we could no longer rely on that approach. This wasn’t a documented property of Workers KV, but it is behavior that some customers have come to rely on in their applications.

To understand the scope of this issue, we created an adversarial test framework designed to maximize the likelihood of hitting consistency edge cases by rapidly interspersing reads and writes to a small set of keys from a handful of locations around the world. This framework allowed us to measure the percentage of reads where we observed a violation of RYOW consistency—scenarios where a read immediately following a write from the same point of presence would return stale data instead of the value that was just written. This allowed us to design and verify a new approach to how KV populates and invalidates data in cache, which restored the RYOW behavior that customers expect while maintaining the performance characteristics that make Workers KV effective for high-read workloads.

How KV Maintains Consistency Across Multiple Backends

With writes racing to both backends and reads potentially returning different results, maintaining data consistency across independent storage providers requires a sophisticated multi-layered approach. While the details have evolved over time, KV has always taken the same basic approach, consisting of three complementary mechanisms that work together to reduce the likelihood of inconsistencies and minimize the window for data divergence.

The first line of defense happens during write operations. When SGW sends writes to both backends simultaneously, we treat the write as successful as soon as either provider confirms persistence. However, if a write succeeds on one provider but fails on the other—due to network issues, rate limiting, or temporary service degradation—the failed write is captured and sent to a background reconciliation system. This system deduplicates failed keys and initiates a synchronization process to resolve the inconsistency.

The second mechanism activates during read operations. When SGW races reads against both providers and notices different results, it triggers the same background synchronization process. This helps ensure that keys that become inconsistent are brought back into alignment when first accessed rather than remaining divergent indefinitely.

The third layer consists of background crawlers that continuously scan data across both providers, identifying and fixing any inconsistencies missed by the previous mechanisms. These crawlers also provide valuable data on consistency drift rates, helping us understand how frequently keys slip through the reactive mechanisms and address any underlying issues.

The synchronization process itself relies on version metadata that we attach to every key-value pair. Each write automatically generates a new version consisting of a high-precision timestamp plus a random nonce, stored alongside the actual data. When comparing values between providers, we can determine which version is newer based on these timestamps. The newer value is then copied to the provider with the older version.

In rare cases where timestamps are within milliseconds of each other, clock skew could theoretically cause incorrect ordering, though given the tight bounds we maintain on our clocks through Cloudflare Time Services and typical write latencies, such conflicts would only occur with nearly simultaneous overlapping writes.

To prevent data loss during synchronization, we use conditional writes that verify that the last timestamp is older before writing instead of blindly overwriting values. This allows us to avoid introducing new inconsistency issues in cases where requests in close proximity succeed to different backends and the synchronization process copies older values over newer values.

Similarly, we can’t just delete data when the user requests it because if the delete only succeeded to one backend, the synchronization process would see this as missing data and copy it from the other backend. Instead, we overwrite the value with a tombstone that has a newer timestamp and no actual data. Only after both providers have the tombstone do we proceed with actually removing the keys from storage.

This layered consistency architecture doesn’t guarantee strong consistency, but in practice it does eliminate most mismatches between backends while maintaining a performance profile that makes Workers KV attractive for latency-sensitive, high-read workloads while also providing high availability in the case of any backend errors. In distributed systems terms, KV chooses availability (AP) over consistency (CP) in the CAP theorem, and more interestingly also chooses latency over consistency in the absence of a partition, meaning it’s PA/EL under the PACELC theorem. Most inconsistencies are resolved within seconds through the reactive mechanisms, while the background crawlers ensure that even edge cases are typically corrected over time.

The above description applies to both our historical dual-provider setup and today’s implementation, but two key improvements in the current architecture lead to significantly better consistency outcomes. First, KVSP maintains a much lower steady-state error rate compared to our previous third-party providers, reducing the frequency of write failures that create inconsistencies in the first place. Second, we now race all reads against both backends, whereas the previous system optimized for cost and latency by preferentially routing reads to a single provider after an initial learning period.

In the original dual-provider architecture, each SGW instance would initially race reads against both providers to establish baseline performance characteristics. Once an instance determined that one provider consistently outperformed the other for its geographic region, it would route subsequent reads exclusively to the faster provider, only falling back to the slower provider when the primary experienced failures or abnormal latency. While this approach effectively controlled third-party provider costs and optimized read performance, it created a significant blind spot in our consistency detection mechanisms—inconsistencies between providers could persist indefinitely if reads were consistently served from only one backend.

Results: Performance and Availability Gains

With these consistency mechanisms in place and our careful rollout strategy validated through internal services, we continued expanding active-active operation to additional namespaces across both internal and external workloads, and we were thrilled with what we saw. Not only did the new architecture provide the increased availability we needed for Workers KV, it also delivered significant performance improvements.

These performance gains were particularly pronounced in Europe, where our new storage backend is located, but the benefits extended far beyond what geographic locality alone could explain. The internal latency improvements compared to the third-party object store we were writing to in parallel were remarkable.

For example, p99 internal latency for reads to KVSP were below 5 milliseconds. For comparison, non-cached reads to the third-party object store from our closest location—after normalizing for transit time to create an apples-to-apples comparison—were typically around 80ms at p50 and 200ms at p99.

The graphs below show the closest thing that we can get to an apples-to-apples comparison: our observed internal latency for requests to KVSP compared with observed latency for requests that are cache misses and end up being forwarded to the external service provider from the closest point of presence, which includes an additional 5-10 milliseconds of request transit time.


These performance improvements translated directly into faster response times for the many internal Cloudflare services that depend on Workers KV, creating cascading benefits across our platform. The database-optimized storage proved particularly effective for the small object access patterns that dominate Workers KV traffic.

After seeing these positive results, we continued expanding the rollout, copying data and enabling groups of namespaces for both internal and external customers. The combination of improved availability and better performance validated our architectural approach and demonstrated the value of building critical infrastructure on our own platform.

What’s next?

Our immediate plans focus on expanding this hybrid architecture to provide even greater resilience and performance for Workers KV. We’re rolling out the KVSP solution to additional locations, creating a truly global distributed backend that can serve traffic entirely from our own infrastructure while also working to further improve how quickly we reach consistency between providers and in cache after writes.

Our ultimate goal is to eliminate our remaining third-party storage dependency entirely, achieving full infrastructure independence for Workers KV. This will remove the external single points of failure that led to the June incident while giving us complete control over the performance and reliability characteristics of our storage layer.

Beyond Workers KV, this project has demonstrated the power of hybrid architectures that combine the best aspects of different storage technologies. The patterns we’ve developed—using KVSP as a translation layer, automatically routing objects based on size characteristics, and leveraging our existing database expertise—can be leveraged by other services that need to balance global scale with strong consistency requirements. The journey from a single-provider setup to a resilient hybrid architecture running on Cloudflare infrastructure demonstrates how thoughtful engineering can turn operational challenges into competitive advantages. With dramatically improved performance and active-active redundancy, Workers KV is well positioned to serve as an even more reliable foundation for the growing set of customers that depend on it.

Cloudflare service outage June 12, 2025

Post Syndicated from Jeremy Hartman original https://blog.cloudflare.com/cloudflare-service-outage-june-12-2025/

On June 12, 2025, Cloudflare suffered a significant service outage that affected a large set of our critical services, including Workers KV, WARP, Access, Gateway, Images, Stream, Workers AI, Turnstile and Challenges, AutoRAG, Zaraz, and parts of the Cloudflare Dashboard.

This outage lasted 2 hours and 28 minutes, and globally impacted all Cloudflare customers using the affected services. The cause of this outage was due to a failure in the underlying storage infrastructure used by our Workers KV service, which is a critical dependency for many Cloudflare products and relied upon for configuration, authentication and asset delivery across the affected services. Part of this infrastructure is backed by a third-party cloud provider, which experienced an outage today and directly impacted availability of our KV service.

We’re deeply sorry for this outage: this was a failure on our part, and while the proximate cause (or trigger) for this outage was a third-party vendor failure, we are ultimately responsible for our chosen dependencies and how we choose to architect around them.

This was not the result of an attack or other security event. No data was lost as a result of this incident. Cloudflare Magic Transit and Magic WAN, DNS, cache, proxy, WAF and related services were not directly impacted by this incident.

What was impacted?

As a rule, Cloudflare designs and builds our services on our own platform building blocks, and as such many of Cloudflare’s products are built to rely on the Workers KV service. 

The following table details the impacted services, including the user-facing impact, operation failures, and increases in error rates observed:

Product/Service

Impact

Workers KV

Workers KV saw 90.22% of requests failing: any key-value pair not cached and that required to retrieve the value from Workers KV’s origin storage backends resulted in failed requests with response code 503 or 500. 

The remaining requests were successfully served from Workers KV’s cache (status code 200 and 404) or returned errors within our expected limits and/or error budget.

This did not impact data stored in Workers KV.

Access

Access uses Workers KV to store application and policy configuration along with user identity information.

During the incident Access failed 100% of identity based logins for all application types including Self-Hosted, SaaS and Infrastructure. User Identity information was unavailable to other services like WARP and Gateway during this incident. Access is designed to fail closed when it cannot successfully fetch policy configuration or a user’s identity. 

Active Infrastructure Application SSH sessions with command logging enabled failed to save logs due to a Workers KV dependency. 

Access’ System for Cross Domain Identity (SCIM) service was also impacted due to its reliance on Workers KV and Durable Objects (which depended on KV) to store user information. During this incident, user identities were not updated due to Workers KV updates failures. These failures would result in a 500 returned to identity providers. Some providers may require a manual re-synchronization but most customers would have seen immediate service restoration once Access’ SCIM service was restored due to retry logic by the identity provider.

Service authentication based logins (e.g. service token, Mutual TLS, and IP-based policies) and Bypass policies were unaffected. No Access policy edits or changes were lost during this time.

Gateway

This incident did not affect most Gateway DNS queries, including those over IPv4, IPv6, DNS over TLS (DoT), and DNS over HTTPS (DoH).

However, there were two exceptions:

DoH queries with identity-based rules failed. This happened because Gateway couldn’t retrieve the required user’s identity information.

Authenticated DoH was disrupted for some users. Users with active sessions with valid authentication tokens were unaffected, but those needing to start new sessions or refresh authentication tokens could not.

Users of Gateway proxy, egress, and TLS decryption were unable to connect, register, proxy, or log traffic.

This was due to our reliance on Workers KV to retrieve up-to-date identity and device posture information. Each of these actions requires a call to Workers KV, and when unavailable, Gateway is designed to fail closed to prevent traffic from bypassing customer-configured rules.

WARP

The WARP client was impacted due to core dependencies on Access and Workers KV, which is required for device registration and authentication. As a result, no new clients were able to connect or sign up during the incident.

Existing WARP client users sessions that were routed through the Gateway proxy experienced disruptions, as Gateway was unable to perform its required policy evaluations.

Additionally, the WARP emergency disconnect override was rendered unavailable because of a failure in its underlying dependency, Workers KV.

Consumer WARP saw a similar sporadic impact as the Zero Trust version.

Dashboard

Dashboard user logins and most of the existing dashboard sessions were unavailable. This was due to an outage affecting Turnstile, DO, KV, and Access. The specific causes for login failures were:

Standard Logins (User/Password): Failed due to Turnstile unavailability.

Sign-in with Google (OIDC) Logins: Failed due to a KV dependency issue.

SSO Logins: Failed due to a full dependency on Access.

The Cloudflare v4 API was not impacted during this incident.

Challenges and Turnstile

The Challenge platform that powers Cloudflare Challenges and Turnstile saw a high rate of failure and timeout for siteverify API requests during the incident window due to its dependencies on Workers KV and Durable Objects.

We have kill switches in place to disable these calls in case of incidents and outages such as this. We activated these kill switches as a mitigation so that eyeballs are not blocked from proceeding. Notably, while these kill switches were active, Turnstile’s siteverify API (the API that validates issued tokens) could redeem valid tokens multiple times, potentially allowing for attacks where a bad actor might try to use a previously valid token to bypass. 

There was no impact to Turnstile’s ability to detect bots. A bot attempting to solve a challenge would still have failed the challenge and thus, not received a token. 

Browser Isolation

Existing Browser Isolation sessions via Link-based isolation were impacted due to a reliance on Gateway for policy evaluation.

New link-based Browser Isolation sessions could not be initiated due to a dependency on Cloudflare Access. All Gateway-initiated isolation sessions failed due its Gateway dependency.

Images

Uploads to Cloudflare Images were impacted during the incident window, with a 100% failure rate at the peak of the incident. 

Overall image delivery dipped to around 97% success rate. Image Transformations were not significantly impacted, and Polish was not impacted.

Stream

Stream’s error rate exceeded 90% during the incident window as video playlists were unable to be served. Stream Live observed a 100% error rate.

Video uploads were not impacted.

Realtime

The Realtime TURN (Traversal Using Relays around NAT) service uses KV and was heavily impacted. Error rates were near 100% for the duration of the incident window.

The Realtime SFU service (Selective Forwarding Unit) was unable to create new sessions, although existing connections were maintained. This caused a reduction to 20% of normal traffic during the impact window. 

Workers AI

All inference requests to Workers AI failed for the duration of the incident. Workers AI depends on Workers KV for distributing configuration and routing information for AI requests globally.

Pages & Workers Assets

Static assets served by Cloudflare Pages and Workers Assets (such as HTML, JavaScript, CSS, images, etc) are stored in Workers KV, cached, and retrieved at request time. Workers Assets saw an average error rate increase of around 0.06% of total requests during this time. 

During the incident window, Pages error rate peaked to ~100% and all Pages builds could not complete. 

AutoRAG

AutoRAG relies on Workers AI models for both document conversion and generating vector embeddings during indexing, as well as LLM models for querying and search. AutoRAG was unavailable during the incident window because of the Workers AI dependency.

Durable Objects

SQLite-backed Durable Objects share the same underlying storage infrastructure as Workers KV. The average error rate during the incident window peaked at 22%, and dropped to 2% as services started to recover.

Durable Object namespaces using the legacy key-value storage were not impacted.

D1

D1 databases share the same underlying storage infrastructure as Workers KV and Durable Objects.

Similar to Durable Objects, the average error rate during the incident window peaked at 22%, and dropped to 2% as services started to recover.

Queues & Event Notifications

Queues message operations including–pushing and consuming–were unavailable during the incident window.

Queues uses KV to map each Queue to underlying Durable Objects that contain queued messages.

Event Notifications use Queues as their underlying delivery mechanism.

AI Gateway

AI Gateway is built on top of Workers and relies on Workers KV for client and internal configurations. During the incident window, AI Gateway saw error rates peak at 97% of requests until dependencies recovered.

CDN

Automated traffic management infrastructure was operational but acted with reduced efficacy during the impact period. In particular, registration requests from Zero Trust clients increased substantially as a result of the outage.

The increase in requests imposed additional load in several Cloudflare locations, triggering response from automated traffic management. In response to these conditions, systems rerouted incoming CDN traffic to nearby locations, reducing impact to customers. There was a portion of traffic that was not rerouted as expected and is under investigation. CDN requests impacted by this issue would experience elevated latency, HTTP 499 errors, and / or HTTP 503 errors. Impacted Cloudflare service areas included São Paulo, Philadelphia, Atlanta, and Raleigh.

Workers / Workers for Platforms

Workers and Workers for Platforms rely on a third party service for uploads. During the incident window, Workers saw an overall error rate peak to ~2% of total requests. Workers for Platforms saw an overall error rate peak to ~10% of total requests during the same time period. 

Workers Builds (CI/CD)
 

Starting at 18:03 UTC Workers builds could not receive new source code management push events due to Access being down.

100% of new Workers Builds failed during the incident window.

Browser Rendering

Browser Rendering depends on Browser Isolation for browser instance infrastructure.

Requests to both the REST API and via the Workers Browser Binding were 100% impacted during the incident window.

Zaraz

100% of requests were impacted during the incident window. Zaraz relies on Workers KV configs for websites when handling eyeball traffic. Due to the same dependency, attempts to save updates to Zaraz configs were unsuccessful during this period, but our monitoring shows that only a single user was affected.

Background

Workers KV is built as what we call a “coreless” service which means there should be no single point of failure as the service runs independently in each of our locations worldwide. However, Workers KV today relies on a central data store to provide a source of truth for data. A failure of that store caused a complete outage for cold reads and writes to the KV namespaces used by services across Cloudflare.

Workers KV is in the process of being transitioned to significantly more resilient infrastructure for its central store: regrettably, we had a gap in coverage which was exposed during this incident. Workers KV removed a storage provider as we worked to re-architect KV’s backend, including migrating it to Cloudflare R2, to prevent data consistency issues (caused by the original data syncing architecture), and to improve support for data residency requirements.

One of our principles is to build Cloudflare services on our own platform as much as possible, and Workers KV is no exception. Many of our internal and external services rely heavily on Workers KV, which under normal circumstances helps us deliver the most robust services possible, instead of service teams attempting to build their own storage services. In this case, the cascading impact from the failure from Workers KV exacerbated the issue and significantly broadened the blast radius. 

Incident timeline and impact

The incident timeline, including the initial impact, investigation, root cause, and remediation, are detailed below. 


Workers KV error rates to storage infrastructure. 91% of requests to KV failed during the incident window.


Cloudflare Access percentage of successful requests. Cloudflare Access relies directly on Workers KV and serves as a good proxy to measure Workers KV availability over time.

All timestamps referenced are in Coordinated Universal Time (UTC).

Time

Event

2025-06-12 17:52

INCIDENT START
Cloudflare WARP team begins to see registrations of new devices fail and begin to investigate these failures and declares an incident.

2025-06-12 18:05

Cloudflare Access team received an alert due to a rapid increase in error rates.

Service Level Objectives for multiple services drop below targets and trigger alerts across those teams.

2025-06-12 18:06

Multiple service-specific incidents are combined into a single incident as we identify a shared cause (Workers KV unavailability). Incident priority upgraded to P1.

2025-06-12 18:21

Incident priority upgraded to P0 from P1 as severity of impact becomes clear.

2025-06-12 18:43

Cloudflare Access begins exploring options to remove Workers KV dependency by migrating to a different backing datastore with the Workers KV engineering team. This was proactive in the event the storage infrastructure continued to be down.

2025-06-12 19:09

Zero Trust Gateway began working to remove dependencies on Workers KV by gracefully degrading rules that referenced Identity or Device Posture state.

2025-06-12 19:32

Access and Device Posture force drop identity and device posture requests to shed load on Workers KV until third-party service comes back online.

2025-06-12 19:45

Cloudflare teams continue to work on a path to deploying a Workers KV release against an alternative backing datastore and having critical services write configuration data to that store.

2025-06-12 20:23

Services begin to recover as storage infrastructure begins to recover. We continue to see a non-negligible error rate and infrastructure rate limits due to the influx of services repopulating caches.

2025-06-12 20:25

Access and Device Posture restore calling Workers KV as third-party service is restored.

2025-06-12 20:28

IMPACT END 
Service Level Objectives return to pre-incident level. Cloudflare teams continue to monitor systems to ensure services do not degrade as dependent systems recover.

INCIDENT END
Cloudflare team see all affected services return to normal function. Service level objective alerts are recovered.

Remediation and follow-up steps

We’re taking immediate steps to improve the resiliency of services that depend on Workers KV and our storage infrastructure. This includes existing planned work that we are accelerating as a result of this incident.

This encompasses several workstreams, including efforts to avoid singular dependencies on storage infrastructure we do not own, improving the ability for us to recover critical services (including Access, Gateway and WARP) 

Specifically:

  • (Actively in-flight): Bringing forward our work to improve the redundancy within Workers KV’s storage infrastructure, removing the dependency on any single provider. During the incident window we began work to cut over and backfill critical KV namespaces to our own infrastructure, in the event the incident continued.

  • (Actively in-flight): Short-term blast radius remediations for individual products that were impacted by this incident so that each product becomes resilient to any loss of service caused by any single point of failure, including third party dependencies..

  • (Actively in-flight): Implementing tooling that allows us to progressively re-enable namespaces during storage infrastructure incidents. This will allow us to ensure that key dependencies, including Access and WARP, are able to come up without risking a denial-of-service against our own infrastructure as caches are repopulated.

This list is not exhaustive: our teams continue to revisit design decisions and assess the infrastructure changes we need to make in both the near (immediate) term and long term to mitigate the incidents like this going forward.

This was a serious outage, and we understand that organizations and institutions that are large and small depend on us to protect and/or run their websites, applications, zero trust and network infrastructure.  Again we are deeply sorry for the impact and are working diligently to improve our service resiliency. 

Cloudflare incident on March 21, 2025

Post Syndicated from Phillip Jones original https://blog.cloudflare.com/cloudflare-incident-march-21-2025/

Multiple Cloudflare services, including R2 object storage, experienced an elevated rate of errors for 1 hour and 7 minutes on March 21, 2025 (starting at 21:38 UTC and ending 22:45 UTC). During the incident window, 100% of write operations failed and approximately 35% of read operations to R2 failed globally. Although this incident started with R2, it impacted other Cloudflare services including Cache Reserve, Images, Log Delivery, Stream, and Vectorize.

While rotating credentials used by the R2 Gateway service (R2’s API frontend) to authenticate with our storage infrastructure, the R2 engineering team inadvertently deployed the new credentials (ID and key pair) to a development instance of the service instead of production. When the old credentials were deleted from our storage infrastructure (as part of the key rotation process), the production R2 Gateway service did not have access to the new credentials. This ultimately resulted in R2’s Gateway service being able to authenticate with our storage backend. There was no data loss or corruption that occurred as part of this incident: any in-flight uploads or mutations that returned successful HTTP status codes were persisted.

Once the root cause was identified and we realized we hadn’t deployed the new credentials to the production R2 Gateway service, we deployed the updated credentials and service availability was restored. 

This incident happened because of human error and lasted longer than it should have because we didn’t have proper visibility into which credentials were being used by the Gateway Worker to authenticate with our storage infrastructure. 

We’re deeply sorry for this incident and the disruption it may have caused to you or your users. We hold ourselves to a high standard and this is not acceptable. This blog post exactly explains the impact, what happened and when, and the steps we are taking to make sure this failure (and others like it) doesn’t happen again.

What was impacted?

The primary incident window occurred between 21:38 UTC and 22:45 UTC.

The following table details the specific impact to R2 and Cloudflare services that depend on, or interact with, R2:

Product/Service Impact
R2 All customers using Cloudflare R2 would have experienced an elevated error rate during the primary incident window. Specifically:

* Object write operations had a 100% error rate.

* Object reads had an approximate error rate of 35% globally. Individual customer error rate varied during this window depending on access patterns. Customers accessing public assets through custom domains would have seen a reduced error rate as cached object reads were not impacted.

* Operations involving metadata only (e.g., head and list operations) were not impacted.

There was no data loss or risk to data integrity within R2’s storage subsystem. This incident was limited to a temporary authentication issue between R2’s API frontend and our storage infrastructure.

Billing Billing uses R2 to store customer invoices. During the primary incident window, customers may have experienced errors when attempting to download/access past Cloudflare invoices.
Cache Reserve Cache Reserve customers observed an increase in requests to their origin during the incident window as an increased percentage of reads to R2 failed. This resulted in an increase in requests to origins to fetch assets unavailable in Cache Reserve during this period.

User-facing requests for assets to sites with Cache Reserve did not observe failures as cache misses failed over to the origin.

Email Security Email Security depends on R2 for customer-facing metrics. During the primary incident window, customer-facing metrics would not have updated.
Images All (100% of) uploads failed during the primary incident window. Successful delivery of stored images dropped to approximately 25%.
Key Transparency Auditor All (100% of) operations failed during the primary incident window due to dependence on R2 writes and/or reads. Once the incident was resolved, service returned to normal operation immediately.
Log Delivery Log delivery (for Logpush and Logpull) was delayed during the primary incident window, resulting in significant delays (up to 70 minutes) in log processing. All logs were delivered after incident resolution.
Stream All (100% of) uploads failed during the primary incident window. Successful Stream video segment delivery dropped to 94%. Viewers may have seen video stalls every minute or so, although actual impact would have varied.

Stream Live was down during the primary incident window as it depends on object writes.

Vectorize Queries and operations against Vectorize indexes were impacted during the incident window. During the incident window, Vectorize customers would have seen an increased error rate for read queries to indexes and all (100% of) insert and upsert operation failed as Vectorize depends on R2 for persistent storage.

Incident timeline

All timestamps referenced are in Coordinated Universal Time (UTC).

Time Event
Mar 21, 2025 – 19:49 UTC The R2 engineering team started the credential rotation process. A new set of credentials (ID and key pair) for storage infrastructure was created. Old credentials were maintained to avoid downtime during credential change over.
Mar 21, 2025 – 20:19 UTC Set updated production secret (wrangler secret put) and executed wrangler deploy command to deploy R2 Gateway service with updated credentials.

Note: We later discovered the –env parameter was inadvertently omitted for both Wrangler commands. This resulted in credentials being deployed to the Worker assigned to the default environment instead of the Worker assigned to the production environment.

Mar 21, 2025 – 20:20 UTC The R2 Gateway service Worker assigned to the default environment is now using the updated storage infrastructure credentials.

Note: This was the wrong Worker, the production environment should have been explicitly set. But, at this point, we incorrectly believed the credentials were updated on the correct production Worker.

Mar 21, 2025 – 20:37 UTC Old credentials were removed from our storage infrastructure to complete the credential rotation process.
Mar 21, 2025 – 21:38 UTC – IMPACT BEGINS –

R2 availability metrics begin to show signs of service degradation. The impact to R2 availability metrics was gradual and not immediately obvious because there was a delay in the propagation of the previous credential deletion to storage infrastructure.

Mar 21, 2025 – 21:45 UTC R2 global availability alerts are triggered (indicating 2% of error budget burn rate).

The R2 engineering team began looking at operational dashboards and logs to understand impact.

Mar 21, 2025 – 21:50 UTC Internal incident declared.
Mar 21, 2025 – 21:51 UTC R2 engineering team observes gradual but consistent decline in R2 availability metrics for both read and write operations. Operations involving metadata only (e.g., head and list operations) were not impacted.

Given gradual decline in availability metrics, R2 engineering team suspected a potential regression in propagation of new credentials in storage infrastructure.

Mar 21, 2025 – 22:05 UTC Public incident status page published.
Mar 21, 2025 – 22:15 UTC R2 engineering team created a new set of credentials (ID and key pair) for storage infrastructure in an attempt to force re-propagation.

Continued monitoring operational dashboards and logs.

Mar 21, 2025 – 22:20 UTC R2 engineering team saw no improvement in availability metrics. Continued investigating other potential root causes.
Mar 21, 2025 – 22:30 UTC R2 engineering team deployed a new set of credentials (ID and key pair) to R2 Gateway service Worker. This was to validate whether there was an issue with the credentials we had pushed to gateway service.

Environment parameter was still omitted in the deploy and secret put commands, so this deployment was still to the wrong non-production Worker.

Mar 21, 2025 – 22:36 UTC – ROOT CAUSE IDENTIFIED –

The R2 engineering team discovered that credentials had been deployed to a non-production Worker by reviewing production Worker release history.

Mar 21, 2025 – 22:45 UTC – IMPACT ENDS –

Deployed credentials to correct production Worker. R2 availability recovered.

Mar 21, 2025 – 22:54 UTC The incident is considered resolved.

Analysis

R2’s architecture is primarily composed of three parts: R2 production gateway Worker (serves requests from S3 API, REST API, Workers API), metadata service, and storage infrastructure (stores encrypted object data).


The R2 Gateway Worker uses credentials (ID and key pair) to securely authenticate with our distributed storage infrastructure. We rotate these credentials regularly as a best practice security precaution.

Our key rotation process involves the following high-level steps:

  1. Create a new set of credentials (ID and key pair) for our storage infrastructure. At this point, the old credentials are maintained to avoid downtime during credential change over.

  2. Set the new credential secret for the R2 production gateway Worker using the wrangler secret put command.

  3. Set the new updated credential ID as an environment variable in the R2 production gateway Worker using the wrangler deploy command. At this point, new storage credentials start being used by the gateway Worker.

  4. Remove previous credentials from our storage infrastructure to complete the credential rotation process.

  5. Monitor operational dashboards and logs to validate change over.

The R2 engineering team uses Workers environments to separate production and development environments for the R2 Gateway Worker. Each environment defines a separate isolated Cloudflare Worker with separate environment variables and secrets. 

Critically, both wrangler secret put and wrangler deploy commands default to the default environment if the –env command line parameter is not included. In this case, due to human error, we inadvertently omitted the –env parameter and deployed the new storage credentials to the wrong Worker (default environment instead of production). To correctly deploy storage credentials to the production R2 Gateway Worker, we need to specify --env production.

The action we took on step 4 above to remove the old credentials from our storage infrastructure caused authentication errors, as the R2 Gateway production Worker still had the old credentials. This is ultimately what resulted in degraded availability.

The decline in R2 availability metrics was gradual and not immediately obvious because there was a delay in the propagation of the previous credential deletion to storage infrastructure. This accounted for a delay in our initial discovery of the problem. Instead of relying on availability metrics after updating the old set of credentials, we should have explicitly validated which token was being used by the R2 Gateway service to authenticate with R2’s storage infrastructure.

Overall, the impact on read availability was significantly mitigated by our intermediate cache that sits in front of storage and continued to serve requests.

Resolution

Once we identified the root cause, we were able to resolve the incident quickly by deploying the new credentials to the production R2 Gateway Worker. This resulted in an immediate recovery of R2 availability.

Next steps

This incident happened because of human error and lasted longer than it should have because we didn’t have proper visibility into which credentials were being used by the R2 Gateway Worker to authenticate with our storage infrastructure.

We have taken immediate steps to prevent this failure (and others like it) from happening again:

  • Added logging tags that include the suffix of the credential ID the R2 Gateway Worker uses to authenticate with our storage infrastructure. With this change, we can explicitly confirm which credential is being used.

  • Related to the above step, our internal processes now require explicit confirmation that the suffix of the new token ID matches logs from our storage infrastructure before deleting the previous token.

  • Require that key rotation takes place through our hotfix release tooling instead of relying on manual wrangler command entry which introduces human error. Our hotfix release deploy tooling explicitly enforces the environment configuration and contains other safety checks.

  • While it’s been an implicit standard that this process involves at least two humans to validate the changes ahead as we progress, we’ve updated our relevant SOPs (standard operating procedures) to include this explicitly.

  • In Progress: Extend our existing closed loop health check system that monitors our endpoints to test new keys, automate reporting of their status through our alerting platform, and ensure global propagation prior to releasing the gateway Worker.

  • In Progress: To expedite triage on any future issues with our distributed storage endpoints, we are updating our observability platform to include views of upstream success rates that bypass caching to give clearer indication of issues serving requests for any reason.

The list above is not exhaustive: as we work through the above items, we will likely uncover other improvements to our systems, controls, and processes that we’ll be applying to improve R2’s resiliency, on top of our business-as-usual efforts. We are confident that this set of changes will prevent this failure, and related credential rotation failure modes, from occurring again. Again, we sincerely apologize for this incident and deeply regret any disruption it has caused you or your users.

Cloudflare Incident on February 6, 2025

Post Syndicated from Matt Silverlock original https://blog.cloudflare.com/cloudflare-incident-on-february-6-2025/

Multiple Cloudflare services, including our R2 object storage, were unavailable for 59 minutes on Thursday, February 6th. This caused all operations against R2 to fail for the duration of the incident, and caused a number of other Cloudflare services that depend on R2 — including Stream, Images, Cache Reserve, Vectorize and Log Delivery — to suffer significant failures.

The incident occurred due to human error and insufficient validation safeguards during a routine abuse remediation for a report about a phishing site hosted on R2. The action taken on the complaint resulted in an advanced product disablement action on the site that led to disabling the production R2 Gateway service responsible for the R2 API.  

Critically, this incident did not result in the loss or corruption of any data stored on R2. 

We’re deeply sorry for this incident: this was a failure of a number of controls and we are prioritizing work to implement additional system-level controls related not only to our abuse processing systems, but so that we continue to reduce the blast radius of any system- or human- action that could result in disabling any production service at Cloudflare.

What was impacted?

All customers using Cloudflare R2 would have observed a 100% failure rate against their R2 buckets and objects during the primary incident window. Services that depend on R2 (detailed in the table below) observed heightened error rates and failure modes depending on their usage of R2.

The primary incident window occurred between 08:14 UTC to 09:13 UTC, when operations against R2 had a 100% error rate. Dependent services (detailed below) observed increased failure rates for operations that relied on R2.

From 09:13 UTC to 09:36 UTC, as R2 recovered and clients reconnected, the backlog and resulting spike in client operations caused load issues with R2’s metadata layer (built on Durable Objects). This impact was significantly more isolated: we observed a 0.09% increase in error rates in calls to Durable Objects running in North America during this window. 

The following table details the impacted services, including the user-facing impact, operation failures, and increases in error rates observed:

Product/Service

Impact

R2

100% of operations against R2 buckets and objects, including uploads, downloads, and associated metadata operations were impacted during the primary incident window. During the secondary incident window, we observed a <1% increase in errors as clients reconnected and increased pressure on R2’s metadata layer.

There was no data loss within the R2 storage subsystem: this incident impacted the HTTP frontend of R2. Separation of concerns and blast radius management meant that the underlying R2 infrastructure was unaffected by this.

Stream

100% of operations (upload & streaming delivery) against assets managed by Stream were impacted during the primary incident window.

Images

100% of operations (uploads & downloads) against assets managed by Images were impacted during the primary incident window.

Impact to Image Delivery was minor: success rate dropped to 97% as these assets are fetched from existing customer backends and do not rely on intermediate storage.

Cache Reserve

Cache Reserve customers observed an increase in requests to their origin during the incident window as 100% of operations failed. This resulted in an increase in requests to origins to fetch assets unavailable in Cache Reserve during this period. This impacted less than 0.049% of all cacheable requests served during the incident window.

User-facing requests for assets to sites with Cache Reserve did not observe failures as cache misses failed over to the origin.

Log Delivery

Log delivery was delayed during the primary incident window, resulting in significant delays (up to an hour) in log processing, as well as some dropped logs. 

Specifically:

Non-R2 delivery jobs would have experienced up to 4.5% data loss during the incident. This level of data loss could have been different between jobs depending on log volume and buffer capacity in a given location.

R2 delivery jobs would have experienced up to 13.6% data loss during the incident. 

R2 is a major destination for Cloudflare Logs. During the primary incident window, all available resources became saturated attempting to buffer and deliver data to R2. This prevented other jobs from acquiring resources to process their queues. Data loss (dropped logs) occurred when the job queues expired their data (to allow for new, incoming data). The system recovered when we enabled a kill switch to stop processing jobs sending data to R2.

Durable Objects

Durable Objects, and services that rely on it for coordination & storage, were impacted as the stampeding horde of clients re-connecting to R2 drove an increase in load.

We observed a 0.09% actual) increase in error rates in calls to Durable Objects running in North America, starting at 09:13 UTC and recovering by 09:36 UTC.

Cache Purge

Requests to the Cache Purge API saw a 1.8% error rate (HTTP 5xx) increase and a 10x increase in p90 latency for purge operations during the primary incident window. Error rates returned to normal immediately after this.

Vectorize

Queries and operations against Vectorize indexes were impacted during the primary incident window. 75% of queries to indexes failed (the remainder were served out of cache) and 100% of insert, upsert, and delete operations failed during the incident window as Vectorize depends on R2 for persistent storage. Once R2 recovered, Vectorize systems recovered in full.

We observed no continued impact during the secondary incident window, and we have not observed any index corruption as the Vectorize system has protections in place for this.

Key Transparency Auditor

100% of signature publish & read operations to the KT auditor service failed during the primary incident window. No third party reads occurred during this window and thus were not impacted by the incident.

Workers & Pages

A small volume (0.002%) of deployments to Workers and Pages projects failed during the primary incident window. These failures were limited to services with bindings to R2, as our control plane was unable to communicate with the R2 service during this period.

Incident timeline and impact

The incident timeline, including the initial impact, investigation, root cause, and remediation, are detailed below.

All timestamps referenced are in Coordinated Universal Time (UTC).

Time Event
2025-02-06 08:12 The R2 Gateway service is inadvertently disabled while responding to an abuse report.
2025-02-06 08:14 — IMPACT BEGINS —
2025-02-06 08:15 R2 service metrics begin to show signs of service degradation.
2025-02-06 08:17 Critical R2 alerts begin to fire due to our service no longer responding to our health checks.
2025-02-06 08:18 R2 on-call engaged and began looking at our operational dashboards and service logs to understand impact to availability.
2025-02-06 08:23 Sales engineering escalated to the R2 engineering team that customers are experiencing a rapid increase in HTTP 500’s from all R2 APIs.
2025-02-06 08:25 Internal incident declared.
2025-02-06 08:33 R2 on-call was unable to identify the root cause and escalated to the lead on-call for assistance.
2025-02-06 08:42 Root cause identified as R2 team reviews service deployment history and configuration, which surfaces the action and the validation gap that allowed this to impact a production service.
2025-02-06 08:46 On-call attempts to re-enable the R2 Gateway service using our internal admin tooling, however this tooling was unavailable because it relies on R2.
2025-02-06 08:49 On-call escalates to an operations team who has lower level system access and can re-enable the R2 Gateway service.
2025-02-06 08:57 The operations team engaged and began to re-enable the R2 Gateway service.
2025-02-06 09:09 R2 team triggers a redeployment of the R2 Gateway service.
2025-02-06 09:10 R2 began to recover as the forced re-deployment rolled out as clients were able to reconnect to R2.
2025-02-06 09:13 — IMPACT ENDS —
R2 availability recovers to within its service-level objective (SLO). Durable Objects begins to observe a slight increase in error rate (0.09%) for Durable Objects running in North America due to the spike in R2 clients reconnecting.
2025-02-06 09:36 The Durable Objects error rate recovers.
2025-02-06 10:29 The incident is closed after monitoring error rates.

At the R2 service level, our internal Prometheus metrics showed R2’s SLO near-immediately drop to 0% as R2’s Gateway service stopped serving all requests and terminated in-flight requests.

The slight delay in failure was due to the product disablement action taking 1-2 minutes to take effect as well as our configured metrics aggregation intervals:


For context, R2’s architecture separates the Gateway service, which is responsible for authenticating and serving requests to R2’s S3 & REST APIs and is the “front door” for R2 — its metadata store (built on Durable Objects), our intermediate caches, and the underlying, distributed storage subsystem responsible for durably storing objects. 


During the incident, all other components of R2 remained up: this is what allowed the service to recover so quickly once the R2 Gateway service was restored and re-deployed. The R2 Gateway acts as the coordinator for all work when operations are made against R2. During the request lifecycle, we validate authentication and authorization, write any new data to a new immutable key in our object store, then update our metadata layer to point to the new object. When the service was disabled, all running processes stopped.

While this means that all in-flight and subsequent requests fail, anything that had received a HTTP 200 response had already succeeded with no risk of reverting to a prior version when the service recovered. This is critical to R2’s consistency guarantees and mitigates the chance of a client receiving a successful API response without the underlying metadata and storage infrastructure having persisted the change.  

Deep dive 

Due to human error and insufficient validation safeguards in our admin tooling, the R2 Gateway service was taken down as part of a routine remediation for a phishing URL.

During a routine abuse remediation, action was taken on a complaint that inadvertently disabled the R2 Gateway service instead of the specific endpoint/bucket associated with the report. This was a failure of multiple system level controls (first and foremost) and operator training. 

A key system-level control that led to this incident was in how we identify (or “tag”) internal accounts used by our teams. Teams typically have multiple accounts (dev, staging, prod) to reduce the blast radius of any configuration changes or deployments, but our abuse processing systems were not explicitly configured to identify these accounts and block disablement actions against them. Instead of disabling the specific endpoint associated with the abuse report, the system allowed the operator to (incorrectly) disable the R2 Gateway service. 

Once we identified this as the cause of the outage, remediation and recovery was inhibited by the lack of direct controls to revert the product disablement action and the need to engage an operations team with lower level access than is routine. The R2 Gateway service then required a re-deployment in order to rebuild its routing pipeline across our edge network.

Once re-deployed, clients were able to re-connect to R2, and error rates for dependent services (including Stream, Images, Cache Reserve and Vectorize) returned to normal levels.

Remediation and follow-up steps

We have taken immediate steps to resolve the validation gaps in our tooling to prevent this specific failure from occurring in the future.

We are prioritizing several work-streams to implement stronger, system-wide controls (defense-in-depth) to prevent this, including how we provision internal accounts so that we are not relying on our teams to correctly and reliably tag accounts. A key theme to our remediation efforts here is around removing the need to rely on training or process, and instead ensuring that our systems have the right guardrails and controls built-in to prevent operator errors.

These work-streams include (but are not limited to) the following:

  • Actioned: deployed additional guardrails implemented in the Admin API to prevent product disablement of services running in internal accounts.

  • Actioned: Product disablement actions in the abuse review UI have been disabled while we add more robust safeguards. This will prevent us from inadvertently repeating similar high-risk manual actions.

  • In-flight: Changing how we create all internal accounts (staging, dev, production) to ensure that all accounts are correctly provisioned into the correct organization. This must include protections against creating standalone accounts to avoid re-occurrence of this incident (or similar) in the future.

  • In-flight: Further restricting access to product disablement actions beyond the remediations recommended by the system to a smaller group of senior operators.

  • In-flight: Two-party approval required for ad-hoc product disablement actions. Going forward, if an investigator requires additional remediations, they must be submitted to a manager or a person on our approved remediation acceptance list to approve their additional actions on an abuse report. 

  • In-flight: Expand existing abuse checks that prevent accidental blocking of internal hostnames to also prevent any product disablement action of products associated with an internal Cloudflare account.  

  • In-flight: Internal accounts are being moved to our new Organizations model ahead of public release of this feature. The R2 production account was a member of this organization but our abuse remediation engine did not have the necessary protections to prevent acting against accounts within this organization.

We’re continuing to discuss & review additional steps and effort that can continue to reduce the blast radius of any system- or human- action that could result in disabling any production service at Cloudflare.

Conclusion

We understand this was a serious incident and we are painfully aware of — and extremely sorry for — the impact it caused to customers and teams building and running their businesses on Cloudflare.

This is the first (and ideally, the last) incident of this kind and duration for R2, and we’re committed to improving controls across our systems and workflows to prevent this in the future.

Cloudflare incident on June 20, 2024

Post Syndicated from Lloyd Wallis original https://blog.cloudflare.com/cloudflare-incident-on-june-20-2024


On Thursday, June 20, 2024, two independent events caused an increase in latency and error rates for Internet properties and Cloudflare services that lasted 114 minutes. During the 30-minute peak of the impact, we saw that 1.4 – 2.1% of HTTP requests to our CDN received a generic error page, and observed a 3x increase for the 99th percentile Time To First Byte (TTFB) latency.

These events occurred because:

  1. Automated network monitoring detected performance degradation, re-routing traffic suboptimally and causing backbone congestion between 17:33 and 17:50 UTC
  2. A new Distributed Denial-of-Service (DDoS) mitigation mechanism deployed between 14:14 and 17:06 UTC triggered a latent bug in our rate limiting system that allowed a specific form of HTTP request to cause a process handling it to enter an infinite loop between 17:47 and 19:27 UTC

Impact from these events were observed in many Cloudflare data centers around the world.

With respect to the backbone congestion event, we were already working on expanding backbone capacity in the affected data centers, and improving our network mitigations to use more information about the available capacity on alternative network paths when taking action. In the remainder of this blog post, we will go into more detail on the second and more impactful of these events.

As part of routine updates to our protection mechanisms, we created a new DDoS rule to prevent a specific type of abuse that we observed on our infrastructure. This DDoS rule worked as expected, however in a specific suspect traffic case it exposed a latent bug in our existing rate-limiting component. To be absolutely clear, we have no reason to believe this suspect traffic was intentionally exploiting this bug, and there is no evidence of a breach of any kind.

We are sorry for the impact and have already made changes to help prevent these problems from occurring again.

Background

Rate-limiting suspicious traffic

Depending on the profile of an HTTP request and the configuration of the requested Internet property, Cloudflare may protect our network and our customer’s origins by applying a limit to the number of requests a visitor can make within a certain time window. These rate limits can activate through customer configuration or in response to DDoS rules detecting suspicious activity.

Usually, these rate limits will be applied based on the IP address of the visitor. As many institutions and Internet Service Providers (ISPs) can have many devices and individual users behind a single IP address, rate limiting based on the IP address is a broad brush that can unintentionally block legitimate traffic.

Balancing traffic across our network

Cloudflare has several systems that together provide continuous real-time capacity monitoring and rebalancing to ensure we serve as much traffic as we can as quickly and efficiently as we can.

The first of these is Unimog, Cloudflare’s edge load balancer. Every packet that reaches our anycast network passes through Unimog, which delivers it to an appropriate server to process that packet. That server may be in a different location from where the packet originally arrived into our network, depending on the availability of compute capacity. Within each data center, Unimog aims to keep the CPU load uniform across all active servers.

For a global view of our network, we rely on Traffic Manager. Across all of our data center locations, it takes in a variety of signals, such as overall CPU utilization, HTTP request latency, and bandwidth utilization to instruct rebalancing decisions. It has built-in safety limits to prevent causing outsized traffic shifts, and also considers the expected resulting load in destination locations when making any decisions.

Incident timeline and impact

All timestamps are UTC on 2024-06-20.

  • 14:14 DDoS rule gradual deployment starts
  • 17:06 DDoS rule deployed globally
  • 17:47 First HTTP request handling processe is poisoned
  • 18:04 Incident declared automatically based on detected high CPU load
  • 18:34 Service restart shown to recover on a server, full restart tested in one data center
  • 18:44 CPU load normalized in data center after service restart
  • 18:51 Continual global reloads of all servers with many stuck processes begin
  • 19:05 Global eyeball HTTP error rate peaks at 2.1% service unavailable / 3.45% total
  • 19:05 First Traffic Manager actions recovering service
  • 19:11 Global eyeball HTTP error rate halved to 1% service unavailable / 1.96% total
  • 19:27 Global eyeball HTTP error rate reduced to baseline levels
  • 19:29 DDoS rule deployment identified as likely cause of process poisoning
  • 19:34 DDoS rule is fully disabled
  • 19:43 Engineers stop routine restarts of services on servers with many stuck processes
  • 20:16 Incident response stood down

Below, we provide a view of the impact from some of Cloudflare’s internal metrics. The first graph illustrates the percentage of all eyeball (inbound from external devices) HTTP requests that were served an error response because the service suffering poisoning could not be reached. We saw an initial increase to 0.5% of requests, and then later a larger one reaching as much as 2.1% before recovery started due to our service reloads.

For a broader view of errors, we can see all 5xx responses our network returned to eyeballs during the same window, including those from origin servers. These peaked at 3.45%, and you can more clearly see the gradual recovery between 19:25 and 20:00 UTC as Traffic Manager finished its re-routing activities. The dip at 19:25 UTC aligns with the last large reload, with the error increase afterwards primarily consisting of upstream DNS timeouts and connection limits which are consistent with high and unbalanced load.

And here’s what our TTFB measurements looked like at the 50th, 90th and 99th percentiles, showing an almost 3x increase in latency at p99:

Technical description of the error and how it happened

Global percentage of HTTP Request handling processes that were using excessive CPU during the event

Earlier on June 20, between 14:14 – 17:06 UTC, we gradually activated a new DDoS rule on our network. Cloudflare has recently been building a new way of mitigating HTTP DDoS attacks. This method is using a combination of rate-limits and cookies in order to allow legitimate clients that were falsely identified as being part of an attack to proceed anyway.

With this new method, an HTTP request that is considered suspicious runs through these key steps:

  1. Check for the presence of a valid cookie, otherwise block the request
  2. If a valid cookie is found, add a rate-limit rule based on the cookie value to be evaluated at a later point
  3. Once all the currently applied DDoS mitigation are run, apply rate-limit rules

We use this “asynchronous” workflow because it is more efficient to block a request without a rate-limit rule, so it gives a chance for other rule types to be applied.

So overall, the flow can be summarized with this pseudocode:

for (rule in active_mitigations) {
   // ... (ignore other rule types)
   if (rule.match_current_request()) {
       if (!has_valid_cookie()) {
           // no cookie: serve error page
           return serve_error_page();
       } else {
           // add a rate-limit rule to be evaluated later
           add_rate_limit_rule(rule);
       }
   }
}


evaluate_rate_limit_rules();

When evaluating rate-limit rules, we need to make a key for each client that is used to look up the correct counter and compare it with the target rate. Typically, this key is the client IP address, but other options are available, such as the value of a cookie as used here. We actually reused an existing portion of the rate-limit logic to achieve this. In pseudocode, it looks like:

function get_cookie_key() {
   // Validate that the cookie is valid before taking its value.
   // Here the cookie has been checked before already, but this code is
   // also used for "standalone" rate-limit rules.
   if (!has_valid_cookie_broken()) { // more on the "broken" part later
       return cookie_value;
   } else {
       return parent_key_generator();
   }
}

This simple key generation function had two issues that, combined with a specific form of client request, caused an infinite loop in the process handling the HTTP request:

  1. The rate-limit rules generated by the DDoS logic are using internal APIs in ways that haven’t been anticipated. This caused the parent_key_generator in the pseudocode above to point to the get_cookie_key function itself, meaning that if that code path was taken, the function would call itself indefinitely
  2. As these rate-limit rules are added only after validating the cookie, validating it a second time should give the same result. The problem is that the has_valid_cookie_broken function used here is actually different and both can disagree if the client sends multiple cookies where some are valid but not others

So, combining these two issues: the broken validation function tells get_cookie_key that the cookie is invalid, causing the else branch to be taken and calling the same function over and over.

A protection many programming languages have in place to help prevent loops like this is a run-time protection limit on how deep the stack of function calls can get. An attempt to call a function once already at this limit will result in a runtime error. When reading the logic above, an initial analysis might suggest we were reaching the limit in this case, and so requests eventually resulted in an error, with a stack containing those same function calls over and over.

However, this isn’t the case here. Some languages, including Lua, in which this logic is written, also implement an optimization called proper tail calls. A tail call is when the final action a function takes is to execute another function. Instead of adding that function as another layer in the stack, as we know for sure that we will not be returning execution context to the parent function afterwards, nor using any of its local variables, we can replace the top frame in the stack with this function call instead.

The end result is a loop in the request processing logic which never increases the size of the stack. Instead, it simply consumes 100% of available CPU resources, and never terminates. Once a process handling HTTP requests receives a single request on which the action should be applied and has a mixture of valid and invalid cookies, that process is poisoned and is never able to process any further requests.

Every Cloudflare server has dozens of such processes, so a single poisoned process does not have much of an impact. However, then some other things start happening:

  1. The increase in CPU utilization for the server causes Unimog to lower the amount of new traffic that server receives, moving traffic to other servers, so at a certain point, more new connections are directed away from servers with a subset of their processes poisoned to those with fewer or no poisoned processes, and therefore lower CPU utilization.
  2. The gradual increase in CPU utilization in the data center starts to cause Traffic Manager to redirect traffic to other data centers. As this movement does not fix the poisoned processes, CPU utilization remains high, and so Traffic Manager continues to redirect more and more traffic away.
  3. The redirected traffic in both cases includes the requests that are poisoning processes, causing the servers and data centers to which this redirected traffic was sent to start failing in the same way.

Within a few minutes, multiple data centers had many poisoned processes, and Traffic Manager had redirected as much traffic away from them as possible, but was restricted from doing more. This was partly due to its built-in automation safety limits, but also because it was becoming more difficult to find a data center with sufficient available capacity to use as a target.

The first case of a poisoned process was at 17:47 UTC, and by 18:09 UTC – five minutes after the incident was declared – Traffic Manager was re-routing a lot of traffic out of Europe:

A summary map of Traffic Manager capacity actions as of 18:09 UTC. Each circle represents a data center that traffic is being re-routed towards or away from. The color of the circle indicates the CPU load of that data center. The orange ribbons between them show how much traffic is re-routed, and where from/to.

It’s obvious to see why, if we look at the percentage of the HTTP request service’s processes that were saturating their CPUs. 10% of our capacity in Western Europe was already gone, and 4% in Eastern Europe, during peak traffic time for those timezones:

Percentage of all the HTTP request handling processes saturating their CPU, by geographic region

Partially poisoned servers in many locations struggled with the request load, and the remaining processes could not keep up, resulting in Cloudflare returning minimal HTTP error responses.

Cloudflare engineers were automatically notified at 18:04 UTC, once our global CPU utilization reached a certain sustained level, and started to investigate. Many of our on-duty incident responders were already working on the open incident caused by backbone network congestion, and in the early minutes we looked into likely correlation with the network congestion events. It took some time for us to realize that locations where the CPU was highest is where traffic was the lowest, drawing the investigation away from a network event being the trigger. At this point, the focus moved to two main streams:

  1. Evaluating if restarting poisoned processes allowed them to recover, and if so, instigating mass-restarts of the service on affected servers
  2. Identifying the trigger of processes entering this CPU saturation state

It was 25 minutes after the initial incident was declared when we validated that restarts helped on one sample server. Five minutes after this, we started executing wider restarts – initially to entire data centers at once, and then as the identification method was refined, on servers with a large number of poisoned processes. Some engineers continued regular routine restarts of the affected service on impacted servers, whilst others moved to join the ongoing parallel effort to identify the trigger. At 19:36 UTC, the new DDoS rule was disabled globally, and the incident was declared resolved after executing one more round of mass restarts and monitoring.

At the same time, conditions presented by the incident triggered a latent bug in Traffic Manager. When triggered, the system would attempt to recover from the exception by initiating a graceful restart, halting its activity. The bug was first triggered at 18:17 UTC, then numerous times between 18:35 and 18:57 UTC. During two periods in this window (18:35-18:52 UTC and 18:56-19:05 UTC) the system did not issue any new traffic routing actions. This meant whilst we had recovered service in the most affected data centers, almost all traffic was still being re-routed away from them. Alerting notified on-call engineers of the issue at 18:34 UTC. By 19:05 UTC the Traffic team had written, tested, and deployed a fix. The first actions following restoration showed a positive impact on restoring service.

Remediation and follow-up steps

To resolve the immediate impact to our network from the request poisoning, Cloudflare instigated mass rolling restarts of the affected service until the change that triggered the condition was identified and rolled back. The change, which was the activation of a new type of DDoS rule, remains fully rolled back, and the rule will not be reactivated until we have fixed the broken cookie validation check and are fully confident this situation cannot recur.

We take these incidents very seriously, and recognize the magnitude of impact they had. We have identified several steps we can take to address these specific situations, and the risk of these sorts of problems from recurring in the future.

  • Design: The rate limiting implementation in use for our DDoS module is a legacy component, and rate limiting rules customers configure for their Internet properties use a newer engine with more modern technologies and protections.
  • Design: We are exploring options within and around the service which experienced process poisoning to limit the ability to loop forever through tail calls. Longer term, Cloudflare is entering the early implementation stages of replacing this service entirely. The design of this replacement service will allow us to apply limits on the non-interrupted and total execution time of a single request.
  • Process: The activation of the new rule for the first time was staged in a handful of production data centers for validation, and then to all data centers a few hours later. We will continue to enhance our staging and rollout procedures to minimize the potential change-related blast radius.

Conclusion

Cloudflare experienced two back-to-back incidents that affected a significant set of customers using our CDN and network services. The first was network backbone congestion that our systems automatically remediated. We mitigated the second by regularly restarting the faulty service whilst we identified and deactivated the DDoS rule that was triggering the fault. We are sorry for any disruption this caused our customers and to end users trying to access services.

The conditions necessary to activate the latent bug in the faulty service are no longer possible in our production environment, and we are putting further fixes and detections in place as soon as possible.

Major data center power failure (again): Cloudflare Code Orange tested

Post Syndicated from Matthew Prince original https://blog.cloudflare.com/major-data-center-power-failure-again-cloudflare-code-orange-tested


Here’s a post we never thought we’d need to write: less than five months after one of our major data centers lost power, it happened again to the exact same data center. That sucks and, if you’re thinking “why do they keep using this facility??,” I don’t blame you. We’re thinking the same thing. But, here’s the thing, while a lot may not have changed at the data center, a lot changed over those five months at Cloudflare. So, while five months ago a major data center going offline was really painful, this time it was much less so.

This is a little bit about how a high availability data center lost power for the second time in five months. But, more so, it’s the story of how our team worked to ensure that even if one of our critical data centers lost power it wouldn’t impact our customers.

On November 2, 2023, one of our critical facilities in the Portland, Oregon region lost power for an extended period of time. It happened because of a cascading series of faults that appears to have been caused by maintenance by the electrical grid provider, climaxing with a ground fault at the facility, and was made worse by a series of unfortunate incidents that prevented the facility from getting back online in a timely fashion.

If you want to read all the gory details, they’re available here.

It’s painful whenever a data center has a complete loss of power, but it’s something that we were supposed to expect. Unfortunately, in spite of that expectation, we hadn’t enforced a number of requirements on our products that would ensure they continued running in spite of a major failure.

That was a mistake we were never going to allow to happen again.

Code Orange

The incident was painful enough that we declared what we called Code Orange. We borrowed the idea from Google which, when they have an existential threat to their business, reportedly declares a Code Yellow or Code Red. Our logo is orange, so we altered the formula a bit.

Our conception of Code Orange was that the person who led the incident, in this case our SVP of Technical Operations, Jeremy Hartman, would be empowered to charge any engineer on our team to work on what he deemed the highest priority project. (Unless we declared a Code Red, which we actually ended up doing due to a hacking incident, and which would then take even higher priority. If you’re interested, you can read more about that here.)

After getting through the immediate incident, Jeremy quickly triaged the most important work that needed to be done in order to ensure we’d be highly available even in the case of another catastrophic failure of a major data center facility. And the team got to work.

How’d we do?

We didn’t expect such an extensive real-world test so quickly, but the universe works in mysterious ways. On Tuesday, March 26, 2024, — just shy of five months after the initial incident — the same facility had another major power outage. Below, we’ll get into what caused the outage this time, but what is most important is that it provided a perfect test for the work our team had done under Code Orange. So, what were the results?

First, let’s revisit what functions the Portland data centers at Cloudflare provide. As described in the November 2, 2023, post, the control plane of Cloudflare primarily consists of the customer-facing interface for all of our services including our website and API. Additionally, the underlying services that provide the Analytics and Logging pipelines are primarily served from these facilities.

Just like in November 2023, we were alerted immediately that we had lost connectivity to our PDX01 data center. Unlike in November, we very quickly knew with certainty that we had once again lost all power, putting us in the exact same situation as five months prior. We also knew, based on a successful internal cut test in February, how our systems should react. We had spent months preparing, updating countless systems and activating huge amounts of network and server capacity, culminating with a test to prove the work was having the intended effect, which in this case was an automatic failover to the redundant facilities.

Our Control Plane consists of hundreds of internal services, and the expectation is that when we lose one of the three critical data centers in Portland, these services continue to operate normally in the remaining two facilities, and we continue to operate primarily in Portland. We have the capability to fail over to our European data centers in case our Portland centers are completely unavailable. However, that is a secondary option, and not something we pursue immediately.

On March 26, 2024, at 14:58 UTC, PDX01 lost power and our systems began to react. By 15:05 UTC, our APIs and Dashboards were operating normally, all without human intervention. Our primary focus over the past few months has been to make sure that our customers would still be able to configure and operate their Cloudflare services in case of a similar outage. There were a few specific services that required human intervention and therefore took a bit longer to recover, however the primary interface mechanism was operating as expected.

To put a finer point on this, during the November 2, 2023, incident the following services had at least six hours of control plane downtime, with several of them functionally degraded for days.

API and Dashboard
Zero Trust
Magic Transit
SSL
SSL for SaaS
Workers
KV
Waiting Room
Load Balancing
Zero Trust Gateway
Access
Pages
Stream
Images

During the March 26, 2024, incident, all of these services were up and running within minutes of the power failure, and many of them did not experience any impact at all during the failover.

The data plane, which handles the traffic that Cloudflare customers pass through our 300+ data centers, was not impacted.

Our Analytics platform, which provides a view into customer traffic, was impacted and wasn’t fully restored until later that day. This was expected behavior as the Analytics platform is reliant on the PDX01 data center. Just like the Control Plane work, we began building new Analytics capacity immediately after the November 2, 2023, incident. However, the scale of the work requires that it will take a bit more time to complete. We have been working as fast as we can to remove this dependency, and we expect to complete this work in the near future.

Once we had validated the functionality of our Control Plane services, we were faced yet again with the cold start of a very large data center. This activity took roughly 72 hours in November 2023, but this time around we were able to complete this in roughly 10 hours. There is still work to be done to make that even faster in the future, and we will continue to refine our procedures in case we have a similar incident in the future.

How did we get here?

As mentioned above, the power outage event from last November led us to introduce Code Orange, a process where we shift most or all engineering resources to addressing the issue at hand when there’s a significant event or crisis. Over the past five months, we shifted all non-critical engineering functions to focusing on ensuring high reliability of our control plane.

Teams across our engineering departments rallied to ensure our systems would be more resilient in the face of a similar failure in the future. Though the March 26, 2024, incident was unexpected, it was something we’d been preparing for.

The most obvious difference is the speed at which the control plane and APIs regained service. Without human intervention, the ability to log in and make changes to Cloudflare configuration was possible seven minutes after PDX01 was lost. This is due to our efforts to move all of our configuration databases to a Highly Available (HA) topology, and pre-provision enough capacity that we could absorb the capacity loss. More than 100 databases across over 20 different database clusters simultaneously failed out of the affected facility and restored service automatically. This was actually the culmination of over a year’s worth of work, and we make sure we prove our ability to failover properly with weekly tests.

Another significant improvement is the updates to our Logpush infrastructure. In November 2023, the loss of the PDX01 datacenter meant that we were unable to push logs to our customers. During Code Orange, we invested in making the Logpush infrastructure HA in Portland, and additionally created an active failover option in Amsterdam. Logpush took advantage of our massively expanded Kubernetes cluster that spans all of our Portland facilities and provides a seamless way for service owners to deploy HA compliant services that have resiliency baked in. In fact, during our February chaos exercise, we found a flaw in our Portland HA deployment, but customers were not impacted because the Amsterdam Logpush infrastructure took over successfully. During this event, we saw that the fixes we’d made since then worked, and we were able to push logs from the Portland region.

A number of other improvements in our Stream and Zero Trust products resulted in little to no impact to their operation. Our Stream products, which use a lot of compute resources to transcode videos, were able to seamlessly hand off to our Amsterdam facility to continue operations. Teams were given specific availability targets for the services and were provided several options to achieve those targets. Stream is a good example of a service that chose a different resiliency architecture but was able to seamlessly deliver their service during this outage. Zero Trust, which was also impacted in November 2023, has since moved the vast majority of its functionally to our hundreds of data centers, which kept working seamlessly throughout this event. Ultimately this is the strategy we are pushing all Cloudflare products to adopt as our 300+ data centers provide the highest level of availability possible.

What happened to the power in the data center?

On March 26, 2024, at 14:58 UTC, PDX01 experienced a total loss of power to Cloudflare’s physical infrastructure following a reportedly simultaneous failure of four Flexential-owned and operated switchboards serving all of Cloudflare’s cages. This meant both primary and redundant power paths were deactivated across the entire environment. During the Flexential investigation, engineers focused on a set of equipment known as Circuit Switch Boards, or CSBs. CSBs are likened to an electrical panel board, consisting of a main input circuit breaker and series of smaller output breakers. Flexential engineers reported that infrastructure upstream of the CSBs (power feed, generator, UPS & PDU/transformer) was not impacted and continued to act normally. Similarly, infrastructure downstream from the CSBs such as Remote Power Panels and connected switchgear was not impacted – thus implying the outage was isolated to the CSBs themselves.

Initial assessment of the root cause of Flexential’s CSB failures points to incorrectly set breaker coordination settings within the four CSBs as one contributing factor. Trip settings which are too restrictive can result in overly sensitive overcurrent protection and the potential nuisance tripping of devices. In our case, Flexential’s breaker settings within the four CSBs were reportedly too low in relation to the downstream provisioned power capacities. When one or more of these breakers tripped, a cascading failure of the remaining active CSB boards resulted, thus causing a total loss of power serving Cloudflare’s cage and others on the shared infrastructure. During the triage of the incident, we were told that the Flexential facilities team noticed the incorrect trip settings, reset the CSBs and adjusted them to the expected values, enabling our team to power up our servers in a staged and controlled fashion. We do not know when these settings were established – typically, these would be set/adjusted as part of a data center commissioning process and/or breaker coordination study before customer critical loads are installed.

What’s next?

Our top priority is completing the resilience program for our Analytics platform. Analytics aren’t simply pretty charts in a dashboard. When you want to check the status of attacks, activities a firewall is blocking, or even the status of Cloudflare Tunnels – you need analytics. We have evidence that the resiliency pattern we are adopting works as expected, so this remains our primary focus, and we will progress as quickly as possible.

There were some services that still required manual intervention to properly recover, and we have collected data and action items for each of them to ensure that further manual action is not required. We will continue to use production cut tests to prove all of these changes and enhancements provide the resiliency that our customers expect.

We will continue to work with Flexential on follow-up activities to expand our understanding of their operational and review procedures to the greatest extent possible. While this incident was limited to a single facility, we will turn this exercise into a process that ensures we have a similar view into all of our critical data center facilities.

Once again, we are very sorry for the impact to our customers, particularly those that rely on the Analytics engine who were unable to access that product feature during the incident. Our work over the past four months has yielded the results that we expected, and we will stay absolutely focused on completing the remaining body of work.

1.1.1.1 lookup failures on October 4th, 2023

Post Syndicated from Ólafur Guðmundsson original http://blog.cloudflare.com/1-1-1-1-lookup-failures-on-october-4th-2023/

1.1.1.1 lookup failures on  October 4th, 2023

1.1.1.1 lookup failures on  October 4th, 2023

On 4 October 2023, Cloudflare experienced DNS resolution problems starting at 07:00 UTC and ending at 11:00 UTC. Some users of 1.1.1.1 or products like WARP, Zero Trust, or third party DNS resolvers which use 1.1.1.1 may have received SERVFAIL DNS responses to valid queries. We’re very sorry for this outage. This outage was an internal software error and not the result of an attack. In this blog, we’re going to talk about what the failure was, why it occurred, and what we’re doing to make sure this doesn’t happen again.

Background

In the Domain Name System (DNS), every domain name exists within a DNS zone. The zone is a collection of domain names and host names that are controlled together. For example, Cloudflare is responsible for the domain name cloudflare.com, which we say is in the “cloudflare.com” zone. The .com top-level domain (TLD) is owned by a third party and is in the “com” zone. It gives directions on how to reach cloudflare.com. Above all of the TLDs is the root zone, which gives directions on how to reach TLDs. This means that the root zone is important in being able to resolve all other domain names. Like other important parts of the DNS, the root zone is signed with DNSSEC, which means the root zone itself contains cryptographic signatures.

The root zone is published on the root servers, but it is also common for DNS operators to retrieve and retain a copy of the root zone automatically so that in the event that the root servers cannot be reached, the information in the root zone is still available. Cloudflare’s recursive DNS infrastructure takes this approach as it also makes the resolution process faster. New versions of the root zone are normally published twice a day. 1.1.1.1 has a WebAssembly app called static_zone running on top of the main DNS logic that serves those new versions when they are available.

1.1.1.1 lookup failures on  October 4th, 2023

What happened

On 21 September, as part of a known and planned change in root zone management, a new resource record type was included in the root zones for the first time. The new resource record is named ZONEMD, and is in effect a checksum for the contents of the root zone.

The root zone is retrieved by software running in Cloudflare’s core network. It is subsequently redistributed to Cloudflare’s data centers around the world. After the change, the root zone containing the ZONEMD record continued to be retrieved and distributed as normal. However, the 1.1.1.1 resolver systems that make use of that data had problems parsing the ZONEMD record. Because zones must be loaded and served in their entirety, the system’s failure to parse ZONEMD meant the new versions of the root zone were not used in Cloudflare’s resolver systems. Some of the servers hosting Cloudflare's resolver infrastructure failed over to querying the DNS root servers directly on a request-by-request basis when they did not receive the new root zone. However, others continued to rely on the known working version of the root zone still available in their memory cache, which was the version pulled on 21 September before the change.

On 4 October 2023 at 07:00 UTC, the DNSSEC signatures in the version of the root zone from 21 September expired. Because there was no newer version that the Cloudflare resolver systems were able to use, some of Cloudflare’s resolver systems stopped being able to validate DNSSEC signatures and as a result started sending error responses (SERVFAIL). The rate at which Cloudflare resolvers generated SERVFAIL responses grew by 12%. The diagrams below illustrate the progression of the failure and how it became visible to users.

1.1.1.1 lookup failures on  October 4th, 2023

Incident timeline and impact

21 September 6:30 UTC: Last successful pull of the root zone
4 October 7:00 UTC: DNSSEC signatures in the root zone obtained on 21 September expired causing an increase in SERVFAIL responses to client queries.
7:57: First external reports of unexpected SERVFAILs started coming in.
8:03: Internal Cloudflare incident declared.
8:50: Initial attempt made at stopping 1.1.1.1 from serving responses using the stale root zone file with an override rule.
10:30: Stopped 1.1.1.1 from preloading the root zone file entirely.
10:32: Responses returned to normal.
11:02: Incident closed.

This below chart shows the timeline of impact along with the percentage of DNS queries that returned with a SERVFAIL error:

1.1.1.1 lookup failures on  October 4th, 2023

We expect a baseline volume of SERVFAIL errors for regular traffic during normal operation. Usually that percentage sits at around 3%. These SERVFAILs can be caused by legitimate issues in the DNSSEC chain, failures to connect to authoritative servers, authoritative servers taking too long to respond, and many others. During the incident the amount of SERVFAILs peaked at 15% of total queries, although the impact was not evenly distributed around the world and was mainly concentrated in our larger data centers like Ashburn, Virginia; Frankfurt, Germany; and Singapore.

Why this incident happened

Why parsing the ZONEMD record failed

DNS has a binary format for storing resource records. In this binary format the type of the resource record (TYPE)  is stored as a 16-bit integer. The type of resource record determines how the resource data (RDATA) is parsed. When the record type is 1, this means it is an A record, and the RDATA can be parsed as an IPv4 address. Record type 28 is an AAAA record, whose RDATA can be parsed as an IPv6 address instead. When a parser runs into an unknown resource type it won’t know how to parse its RDATA, but fortunately it doesn’t have to: the RDLENGTH field indicates how long the RDATA field is, allowing the parser to treat it as an opaque data element.

                                   1  1  1  1  1  1
      0  1  2  3  4  5  6  7  8  9  0  1  2  3  4  5
    +--+--+--+--+--+--+--+--+--+--+--+--+--+--+--+--+
    |                                               |
    /                                               /
    /                      NAME                     /
    |                                               |
    +--+--+--+--+--+--+--+--+--+--+--+--+--+--+--+--+
    |                      TYPE                     |
    +--+--+--+--+--+--+--+--+--+--+--+--+--+--+--+--+
    |                     CLASS                     |
    +--+--+--+--+--+--+--+--+--+--+--+--+--+--+--+--+
    |                      TTL                      |
    |                                               |
    +--+--+--+--+--+--+--+--+--+--+--+--+--+--+--+--+
    |                   RDLENGTH                    |
    +--+--+--+--+--+--+--+--+--+--+--+--+--+--+--+--|
    /                     RDATA                     /
    /                                               /
    +--+--+--+--+--+--+--+--+--+--+--+--+--+--+--+--+
RFC 1035

The reason static_zone didn’t support the new ZONEMD record is because up until now we had chosen to distribute the root zone internally in its presentation format, rather than in the binary format. When looking at the text representation for a few resource records we can see there is a lot more variation in how different records are presented.

.			86400	IN	SOA	a.root-servers.net. nstld.verisign-grs.com. 2023100400 1800 900 604800 86400
.			86400	IN	RRSIG	SOA 8 0 86400 20231017050000 20231004040000 46780 . J5lVTygIkJHDBt6HHm1QLx7S0EItynbBijgNlcKs/W8FIkPBfCQmw5BsUTZAPVxKj7r2iNLRddwRcM/1sL49jV9Jtctn8OLLc9wtouBmg3LH94M0utW86dKSGEKtzGzWbi5hjVBlkroB8XVQxBphAUqGxNDxdE6AIAvh/eSSb3uSQrarxLnKWvHIHm5PORIOftkIRZ2kcA7Qtou9NqPCSE8fOM5EdXxussKChGthmN5AR5S2EruXIGGRd1vvEYBrRPv55BAWKKRERkaXhgAp7VikYzXesiRLdqVlTQd+fwy2tm/MTw+v3Un48wXPg1lRPlQXmQsuBwqg74Ts5r8w8w==
.			518400	IN	NS	a.root-servers.net.
.			86400	IN	ZONEMD	2023100400 1 241 E375B158DAEE6141E1F784FDB66620CC4412EDE47C8892B975C90C6A102E97443678CCA4115E27195B468E33ABD9F78C
Example records taken from https://www.internic.net/domain/root.zone

When we run into an unknown resource record it’s not always easy to know how to handle it. Because of this, the library we use to parse the root zone at the edge does not make an attempt at doing so, and instead returns a parser error.

Why a stale version of the root zone was used

The static_zone app, tasked with loading and parsing the root zone for the purpose of serving the root zone locally (RFC 7706), stores the latest version in memory. When a new version is published it parses it and, when successfully done so, drops the old version. However, as parsing failed the static_zone app never switched to a newer version, and instead continued using the old version indefinitely. When the 1.1.1.1 service is first started the static_zone app does not have an existing version in memory. When it tries to parse the root zone it fails in doing so, but because it does not have an older version of the root zone to fall back on, it falls back on querying the root servers directly for incoming requests.

1.1.1.1 lookup failures on  October 4th, 2023

Why the initial attempt at disabling static_zone didn’t work

Initially we tried to disable the static_zone app through override rules, a mechanism that allows us to programmatically change some behavior of 1.1.1.1. The rule we deployed was:

phase = pre-cache set-tag rec_disable_static

For any incoming request this rule adds the tag rec_disable_static to the request. Inside the static_zone app we check for this tag and, if it’s set, we do not return a response from the cached, static root zone. However, to improve cache performance queries are sometimes forwarded to another node if the current node can’t find the response in its own cache. Unfortunately, the rec_disable_static tag is not included in the queries being forwarded to other nodes, which caused the static_zone app to continue replying with stale information until we eventually disabled the app entirely.

Why the impact was partial

Cloudflare regularly performs rolling reboots of the servers that host our services for tasks like kernel updates that can only take effect after a full system restart. At the time of this outage, resolver server instances that were restarted between the ZONEMD change and the DNSSEC invalidation did not contribute to impact. If they had restarted during this two-week period, they would have failed to load the root zone on startup and fallen back to resolving by sending DNS queries to root servers instead. In addition, the resolver uses a technique called serve stale (RFC 8767) with the purpose of being able to continue to serve popular records from a potentially stale cache to limit the impact. A record is considered to be stale once the TTL amount of seconds has passed since the record was retrieved from upstream.  This prevented a total outage; impact was mainly felt in our largest data centers which had many servers that had not restarted the 1.1.1.1 service in that timeframe.

Remediation and follow-up steps

This incident had widespread impact, and we take the availability of our services very seriously. We have identified several areas of improvement and will continue to work on uncovering any other gaps that could cause a recurrence.

Here is what we are working on immediately:

Visibility: We’re adding alerts to notify when static_zone serves a stale root zone file. It should not have been the case that serving a stale root zone file went unnoticed for as long as it did. If we had been monitoring this better, with the caching that exists, there would have been no impact. It is our goal to protect our customers and their users from upstream changes.

Resilience: We will re-evaluate how we ingest and distribute the root zone internally. Our ingestion and distribution pipelines should handle new RRTYPEs seamlessly, and any brief interruption to the pipeline should be invisible to end users.

Testing: Despite having tests in place around this problem, including tests related to unreleased changes in parsing the new ZONEMD records, we did not adequately test what happens when the root zone fails to parse. We will improve our test coverage and the related processes.

Architecture: We should not use stale copies of the root zone past a certain point. While it’s certainly possible to continue to use stale root zone data for a limited amount of time, past a certain point there are unacceptable operational risks. We will take measures to ensure that the lifetime of cached root zone data is better managed as described in RFC 8806: Running a Root Server Local to a Resolver.

Conclusion

We are deeply sorry that this incident happened. There is one clear message from this incident: do not ever assume that something is not going to change!  Many modern systems are built with a long chain of libraries that are pulled into the final executable, each one of those may have bugs or may not be updated early enough for programs to operate correctly when changes in input happen. We understand how important it is to have good testing in place that allows detection of regressions and systems and components that fail gracefully on changes to input. We understand that we need to always assume that “format” changes in the most critical systems of the internet (DNS and BGP) are going to have an impact.

We have a lot to follow up on internally and are working around the clock to make sure something like this does not happen again.

Hardening Workers KV

Post Syndicated from Matt Silverlock original http://blog.cloudflare.com/workers-kv-restoring-reliability/

Hardening Workers KV

Hardening Workers KV

Over the last couple of months, Workers KV has suffered from a series of incidents, culminating in three back-to-back incidents during the week of July 17th, 2023. These incidents have directly impacted customers that rely on KV — and this isn’t good enough.

We’re going to share the work we have done to understand why KV has had such a spate of incidents and, more importantly, share in depth what we’re doing to dramatically improve how we deploy changes to KV going forward.

Workers KV?

Workers KV — or just “KV” — is a key-value service for storing data: specifically, data with high read throughput requirements. It’s especially useful for user configuration, service routing, small assets and/or authentication data.

We use KV extensively inside Cloudflare too, with Cloudflare Access (part of our Zero Trust suite) and Cloudflare Pages being some of our highest profile internal customers. Both teams benefit from KV’s ability to keep regularly accessed key-value pairs close to where they’re accessed, as well its ability to scale out horizontally without any need to become an expert in operating KV.

Given Cloudflare’s extensive use of KV, it wasn’t just external customers impacted. Our own internal teams felt the pain of these incidents, too.

The summary of the post-mortem

Back in June 2023, we announced the move to a new architecture for KV, which is designed to address two major points of customer feedback we’ve had around KV: high latency for infrequently accessed keys (or a key accessed in different regions), and working to ensure the upper bound on KV’s eventual consistency model for writes is 60 seconds — not “mostly 60 seconds”.

At the time of the blog, we’d already been testing this internally, including early access with our community champions and running a small % of production traffic to validate stability and performance expectations beyond what we could emulate within a staging environment.

However, in the weeks between mid-June and culminating in the series of incidents during the week of July 17th, we would continue to increase the volume of new traffic onto the new architecture. When we did this, we would encounter previously unseen problems (many of these customer-impacting) — then immediately roll back, fix bugs, and repeat. Internally, we’d begun to identify that this pattern was becoming unsustainable — each attempt to cut traffic onto the new architecture would surface errors or behaviors we hadn’t seen before and couldn’t immediately explain, and thus we would roll back and assess.

The issues at the root of this series of incidents proved to be significantly challenging to track and observe. Once identified, the two causes themselves proved to be quick to fix, but an (1) observability gap in our error reporting and (2) a mutation to local state that resulted in an unexpected mutation of global state were both hard to observe and reproduce over the days following the customer-facing impact ending.

The detail

One important piece of context to understand before we go into detail on the post-mortem: Workers KV is composed of two separate Workers scripts – internally referred to as the Storage Gateway Worker and SuperCache. SuperCache is an optional path in the Storage Gateway Worker workflow, and is the basis for KV's new (faster) backend (refer to the blog).

Here is a timeline of events:

Time Description
2023-07-17 21:52 UTC Cloudflare observes alerts showing 500 HTTP status codes in the MEL01 data-center (Melbourne, AU) and begins investigating.
We also begin to see a small set of customers reporting HTTP 500s being returned via multiple channels. It is not immediately clear if this is a data-center-wide issue or KV specific, as there had not been a recent KV deployment, and the issue directly correlated with three data-centers being brought back online.
2023-07-18 00:09 UTC We disable the new backend for KV in MEL01 in an attempt to mitigate the issue (noting that there had not been a recent deployment or change to the % of users on the new backend).
2023-07-18 05:42 UTC Investigating alerts showing 500 HTTP status codes in VIE02 (Vienna, AT) and JNB01 (Johannesburg, SA).
2023-07-18 13:51 UTC The new backend is disabled globally after seeing issues in VIE02 (Vienna, AT) and JNB01 (Johannesburg, SA) data-centers, similar to MEL01. In both cases, they had also recently come back online after maintenance, but it remained unclear as to why KV was failing.
2023-07-20 19:12 UTC The new backend is inadvertently re-enabled while deploying the update due to a misconfiguration in a deployment script.
2023-07-20 19:33 UTC The new backend is (re-) disabled globally as HTTP 500 errors return.
2023-07-20 23:46 UTC Broken Workers script pipeline deployed as part of gradual rollout due to incorrectly defined pipeline configuration in the deployment script.
Metrics begin to report that a subset of traffic is being black-holed.
2023-07-20 23:56 UTC Broken pipeline rolled back; errors rates return to pre-incident (normal) levels.

All timestamps referenced are in Coordinated Universal Time (UTC).

We initially observed alerts showing 500 HTTP status codes in the MEL01 data-center (Melbourne, AU) at 21:52 UTC on July 17th, and began investigating. We also received reports from a small set of customers reporting HTTP 500s being returned via multiple channels. This correlated with three data centers being brought back online, and it was not immediately clear if it related to the data centers or was KV-specific — especially given there had not been a recent KV deployment. On 05:42, we began investigating alerts showing 500 HTTP status codes in VIE02 (Vienna) and JNB02 (Johannesburg) data-centers; while both had recently come back online after maintenance, it was still unclear why KV was failing. At 13:51 UTC, we made the decision to disable the new backend globally.

Following the incident on July 18th, we attempted to deploy an allow-list configuration to reduce the scope of impacted accounts. However, while attempting to roll out a change for the Storage Gateway Worker at 19:12 UTC on July 20th, an older configuration was progressed causing the new backend to be enabled again, leading to the third event. As the team worked to fix this and deploy this configuration, they attempted to manually progress the deployment at 23:46 UTC, which resulted in the passing of a malformed configuration value that caused traffic to be sent to an invalid Workers script configuration.

After all deployments and the broken Workers configuration (pipeline) had been rolled back at 23:56 on the 20th July, we spent the following three days working to identify the root cause of the issue. We lacked observability as KV's Worker script (responsible for much of KV's logic) was throwing an unhandled exception very early on in the request handling process. This was further exacerbated by prior work to disable error reporting in a disabled data-center due to the noise generated, which had previously resulted in logs being rate-limited upstream from our service.

This previous mitigation prevented us from capturing meaningful logs from the Worker, including identifying the exception itself, as an uncaught exception terminates request processing. This has raised the priority of improving how unhandled exceptions are reported and surfaced in a Worker (see Recommendations, below, for further details). This issue was exacerbated by the fact that KV's Worker script would fail to re-enter its "healthy" state when a Cloudflare data center was brought back online, as the Worker was mutating an environment variable perceived to be in request scope, but that was in global scope and persisted across requests. This effectively left the Worker “frozen” with the previous, invalid configuration for the affected locations.

Further, the introduction of a new progressive release process for Workers KV, designed to de-risk rollouts (as an action from a prior incident), prolonged the incident. We found a bug in the deployment logic that led to a broader outage due to an incorrectly defined configuration.

This configuration effectively caused us to drop a single-digit % of traffic until it was rolled back 10 minutes later. This code is untested at scale, and we need to spend more time hardening it before using it as the default path in production.

Additionally: although the root cause of the incidents was limited to three Cloudflare data-centers (Melbourne, Vienna, and Johannesburg), traffic across these regions still uses these data centers to route reads and writes to our system of record. Because these three data centers participate in KV’s new backend as regional tiers, a portion of traffic across the Oceania, Europe, and African regions was affected. Only a portion of keys from enrolled namespaces use any given data center as a regional tier in order to limit a single (regional) point of failure, so while traffic across all data centers in the region was impacted, nowhere was all traffic in a given data center affected.

We estimated the affected traffic to be 0.2-0.5% of KV's global traffic (based on our error reporting), however we observed some customers with error rates approaching 20% of their total KV operations. The impact was spread across KV namespaces and keys for customers within the scope of this incident.

Both KV’s high total traffic volume and its role as a critical dependency for many customers amplify the impact of even small error rates. In all cases, once the changes were rolled back, errors returned to normal levels and did not persist.

Thinking about risks in building software

Before we dive into what we’re doing to significantly improve how we build, test, deploy and observe Workers KV going forward, we think there are lessons from the real world that can equally apply to how we improve the safety factor of the software we ship.

In traditional engineering and construction, there is an extremely common procedure known as a   “JSEA”, or Job Safety and Environmental Analysis (sometimes just “JSA”). A JSEA is designed to help you iterate through a list of tasks, the potential hazards, and most importantly, the controls that will be applied to prevent those hazards from damaging equipment, injuring people, or worse.

One of the most critical concepts is the “hierarchy of controls” — that is, what controls should be applied to mitigate these hazards. In most practices, these are elimination, substitution, engineering, administration and personal protective equipment. Elimination and substitution are fairly self-explanatory: is there a different way to achieve this goal? Can we eliminate that task completely? Engineering and administration ask us whether there is additional engineering work, such as changing the placement of a panel, or using a horizontal boring machine to lay an underground pipe vs. opening up a trench that people can fall into.

The last and lowest on the hierarchy, is personal protective equipment (PPE). A hard hat can protect you from severe injury from something falling from above, but it’s a last resort, and it certainly isn’t guaranteed. In engineering practice, any hazard that only lists PPE as a mitigating factor is unsatisfactory: there must be additional controls in place. For example, instead of only wearing a hard hat, we should engineer the floor of scaffolding so that large objects (such as a wrench) cannot fall through in the first place. Further, if we require that all tools are attached to the wearer, then it significantly reduces the chance the tool can be dropped in the first place. These controls ensure that there are multiple degrees of mitigation — defense in depth — before your hard hat has to come into play.

Coming back to software, we can draw parallels between these controls: engineering can be likened to improving automation, gradual rollouts, and detailed metrics. Similarly, personal protective equipment can be likened to code review: useful, but code review cannot be the only thing protecting you from shipping bugs or untested code. Automation with linters, more robust testing, and new metrics are all vastly safer ways of shipping software.

As we spent time assessing where to improve our existing controls and how to put new controls in place to mitigate risks and improve the reliability (safety) of Workers KV, we took a similar approach: eliminating unnecessary changes, engineering more resilience into our codebase, automation, deployment tooling, and only then looking at human processes.

How we plan to get better

Cloudflare is undertaking a larger, more structured review of KV's observability tooling, release infrastructure and processes to mitigate not only the contributing factors to the incidents within this report, but recent incidents related to KV. Critically, we see tooling and automation as the most powerful mechanisms for preventing incidents, with process improvements designed to provide an additional layer of protection. Process improvements alone cannot be the only mitigation.

Specifically, we have identified and prioritized the below efforts as the most important next steps towards meeting our own availability SLOs, and (above all) make KV a service that customers building on Workers can rely on for storing configuration and service data in the hot path of their traffic:

  • Substantially improve the existing observability tooling for unhandled exceptions, both for internal teams and customers building on Workers. This is especially critical for high-volume services, where traditional logging alone can be too noisy (and not specific enough) to aid in tracking down these cases. The existing ongoing work to land this will be prioritized further. In the meantime, we have directly addressed the specific uncaught exception with KV's primary Worker script.
  • Improve the safety around the mutation of environmental variables in a Worker, which currently operate at "global" (per-isolate) scope, but can appear to be per-request. Mutating an environmental variable in request scope mutates the value for all requests transiting that same isolate (in a given location), which can be unexpected. Changes here will need to take backwards compatibility in mind.
  • Continue to expand KV’s test coverage to better address the above issues, in parallel with the aforementioned observability and tooling improvements, as an additional layer of defense. This includes allowing our test infrastructure to simulate traffic from any source data-center, which would have allowed us to more quickly reproduce the issue and identify a root cause.
  • Improvements to our release process, including how KV changes and releases are reviewed and approved, going forward. We will enforce a higher level of scrutiny for future changes, and where possible, reduce the number of changes deployed at once. This includes taking on new infrastructure dependencies, which will have a higher bar for both design and testing.
  • Additional logging improvements, including sampling, throughout our request handling process to improve troubleshooting & debugging. A significant amount of the challenge related to these incidents was due to the lack of logging around specific requests (especially non-2xx requests)
  • Review and, where applicable, improve alerting thresholds surrounding error rates. As mentioned previously in this report, sub-% error rates at a global scale can have severe negative impact on specific users and/or locations: ensuring that errors are caught and not lost in the noise is an ongoing effort.
  • Address maturity issues with our progressive deployment tooling for Workers, which is net-new (and will eventually be exposed to customers directly).

This is not an exhaustive list: we're continuing to expand on preventative measures associated with these and other incidents. These changes will not only improve KVs reliability, but other services across Cloudflare that KV relies on, or that rely on KV.

We recognize that KV hasn’t lived up to our customers’ expectations recently. Because we rely on KV so heavily internally, we’ve felt that pain first hand as well. The work to fix the issues that led to this cycle of incidents is already underway. That work will not only improve KV’s reliability but also improve the reliability of any software written on the Cloudflare Workers developer platform, whether by our customers or by ourselves.

Connection errors in Asia Pacific region on July 9, 2023

Post Syndicated from Christian Elmerot original http://blog.cloudflare.com/connection-errors-in-asia-pacific-region-on-july-9-2023/

Connection errors in Asia Pacific region on July 9, 2023

Connection errors in Asia Pacific region on July 9, 2023

On Sunday, July 9, 2023, early morning UTC time, we observed a high number of DNS resolution failures — up to 7% of all DNS queries across the Asia Pacific region — caused by invalid DNSSEC signatures from Verisign .com and .net Top Level Domain (TLD) nameservers. This resulted in connection errors for visitors of Internet properties on Cloudflare in the region.

The local instances of Verisign’s nameservers started to respond with expired DNSSEC signatures in the Asia Pacific region. In order to remediate the impact, we have rerouted upstream DNS queries towards Verisign to locations on the US west coast which are returning valid signatures.

We have already reached out to Verisign to get more information on the root cause. Until their issues have been resolved, we will keep our DNS traffic to .com and .net TLD nameservers rerouted, which might cause slightly increased latency for the first visitor to domains under .com and .net in the region.

Background

In order to proxy a domain’s traffic through Cloudflare’s network, there are two components involved with respect to the Domain Name System (DNS) from the perspective of a Cloudflare data center: external DNS resolution, and upstream or origin DNS resolution.

To understand this, let’s look at the domain name blog.cloudflare.com — which is proxied through Cloudflare’s network — and let’s assume it is configured to use origin.example as the origin server:

Connection errors in Asia Pacific region on July 9, 2023

Here, the external DNS resolution is the part where DNS queries to blog.cloudflare.com sent by public resolvers like 1.1.1.1 or 8.8.8.8 on behalf of a visitor return a set of Cloudflare Anycast IP addresses. This ensures that the visitor’s browser knows where to send an HTTPS request to load the website. Under the hood your browser performs a DNS query that looks something like this (the trailing dot indicates the DNS root zone):

$ dig blog.cloudflare.com. +short
104.18.28.7
104.18.29.7

(Your computer doesn’t actually use the dig command internally; we’ve used it to illustrate the process) Then when the next closest Cloudflare data center receives the HTTPS request for blog.cloudflare.com, it needs to fetch the content from the origin server (assuming it is not cached).

There are two ways Cloudflare can reach the origin server. If the DNS settings in Cloudflare contain IP addresses then we can connect directly to the origin. In some cases, our customers use a CNAME which means Cloudflare has to perform another DNS query to get the IP addresses associated with the CNAME. In the example above, blog.cloudflare.com has a CNAME record instructing us to look at origin.example for IP addresses. During the incident, only customers with CNAME records like this going to .com and .net domain names may have been affected.

The domain origin.example needs to be resolved by Cloudflare as part of the upstream or origin DNS resolution. This time, the Cloudflare data center needs to perform an outbound DNS query that looks like this:

$ dig origin.example. +short
192.0.2.1

DNS is a hierarchical protocol, so the recursive DNS resolver, which usually handles DNS resolution for whoever wants to resolve a domain name, needs to talk to several involved nameservers until it finally gets an answer from the authoritative nameservers of the domain (assuming no DNS responses are cached). This is the same process during the external DNS resolution and the origin DNS resolution. Here is an example for the origin DNS resolution:

Connection errors in Asia Pacific region on July 9, 2023

Inherently, DNS is a public system that was initially published without any means to validate the integrity of the DNS traffic. So in order to prevent someone from spoofing DNS responses, DNS Security Extensions (DNSSEC) were introduced as a means to authenticate that DNS responses really come from who they claim to come from. This is achieved by generating cryptographic signatures alongside existing DNS records like A, AAAA, MX, CNAME, etc. By validating a DNS record’s associated signature, it is possible to verify that a requested DNS record really comes from its authoritative nameserver and wasn’t altered en-route. If a signature cannot be validated successfully, recursive resolvers usually return an error indicating the invalid signature. This is exactly what happened on Sunday.

Incident timeline and impact

On Saturday, July 8, 2023, at 21:10 UTC our logs show the first instances of DNSSEC validation errors that happened during upstream DNS resolution from multiple Cloudflare data centers in the Asia Pacific region. It appeared DNS responses from the TLD nameservers of .com and .net of the type NSEC3 (a DNSSEC mechanism to prove non-existing DNS records) did not include signatures. About an hour later at 22:16 UTC, the first internal alerts went off (since it required issues to be consistent over a certain period of time), but error rates were still at a level at around 0.5% of all upstream DNS queries.

After several hours, the error rate had increased to a point in which ~13% of our upstream DNS queries in affected locations were failing. This percentage continued to fluctuate over the duration of the incident between the ranges of 10-15% of upstream DNS queries, and roughly 5-7% of all DNS queries (external & upstream resolution) to affected Cloudflare data centers in the Asia Pacific region.

Connection errors in Asia Pacific region on July 9, 2023

Initially it appeared as though only a single upstream nameserver was having issues with DNS resolution, however upon further investigation it was discovered that the issue was more widespread. Ultimately, we were able to verify that the Verisign nameservers for .com and .net were returning expired DNSSEC signatures on a portion of DNS queries in the Asia Pacific region. Based on our tests, other nameserver locations were correctly returning valid DNSSEC signatures.

In response, we rerouted our DNS traffic to the .com and .net TLD nameserver IP addresses to Verisign’s US west locations. After this change was propagated, the issue very quickly subsided and origin resolution error rates returned to normal levels.

All times are in UTC:

2023-07-08 21:10 First instances of DNSSEC validation errors appear in our logs for origin DNS resolution.

2023-07-08 22:16 First internal alerts for Asia Pacific data centers go off indicating origin DNS resolution error on our test domain. Very few errors for other domains at this point.

2023-07-09 02:58 Error rates have increased substantially since the first instance. An incident is declared.

2023-07-09 03:28 DNSSEC validation issues seem to be isolated to a single upstream provider. It is not abnormal that a single upstream has issues that propagate back to us, and in this case our logs were predominantly showing errors from domains that resolve to this specific upstream.

2023-07-09 04:52 We realize that DNSSEC validation issues are more widespread and affect multiple .com and .net domains. Validation issues continue to be isolated to the Asia Pacific region only, and appear to be intermittent.

2023-07-09 05:15 DNS queries via popular recursive resolvers like 8.8.8.8 and 1.1.1.1 do not return invalid DNSSEC signatures at this point. DNS queries using the local stub resolver continue to return DNSSEC errors.

2023-07-09 06:24 Responses from .com and .net Verisign nameservers in Singapore contain expired DNSSEC signatures, but responses from Verisign TLD nameservers in other locations are fine.

2023-07-09 06:41 We contact Verisign and notify them about expired DNSSEC signatures.

2023-07-09 06:50 In order to remediate the impact, we reroute DNS traffic via IPv4 for the .com and .net Verisign nameserver IPs to US west IPs instead. This immediately leads to a substantial drop in the error rate.

2023-07-09 07:06 We also reroute DNS traffic via IPv6 for the .com and .net Verisign nameserver IPs to US west IPs. This leads to the error rate going down to zero.

2023-07-10 09:23 The rerouting is still in place, but the underlying issue with expired signatures in the Asia Pacific region has still not been resolved.

2023-07-10 18:23 Versign gets back to us confirming that they “were serving stale data” at their local site and have resolved the issues.

Technical description of the error and how it happened

As mentioned in the introduction, the underlying cause for this incident was expired DNSSEC signatures for .net and .com zones. Expired DNSSEC signatures will cause a DNS response to be interpreted as invalid. There are two main scenarios in which this error was observed by a user:

  1. CNAME flattening for external DNS resolution. This is when our authoritative nameservers attempt to return the IP address(es) that a CNAME record target resolves to rather than the CNAME record itself.
  2. CNAME target lookup for origin DNS resolution. This is most commonly used when an HTTPS request is sent to a Cloudflare anycast IP address, and we need to determine what IP address to forward the request to. See How Cloudflare works for more details.

In both cases, behind the scenes the DNS query goes through an in-house recursive DNS resolver in order to lookup what a hostname resolves to. The purpose of this resolver is to cache queries, optimize future queries and provide DNSSEC validation. If the query from this resolver fails for whatever reason, our authoritative DNS system will not be able to perform the two scenarios outlined above.

Connection errors in Asia Pacific region on July 9, 2023

During the incident, the recursive resolver was failing to validate the DNSSEC signatures in DNS responses for domains ending in .com and .net. These signatures are sent in the form of an RRSIG record alongside the other DNS records they cover. Together they form a Resource Record set (RRset). Each RRSIG has the corresponding fields:

Connection errors in Asia Pacific region on July 9, 2023

As you can see, the main part of the payload is associated with the signature and its corresponding metadata. Each recursive resolver is responsible for not only checking the signature but also the expiration time of the signature. It is important to obey the expiration time in order to avoid returning responses for RRsets that have been signed by old keys, which could have potentially been compromised by that time.

During this incident, Verisign, the authoritative operator for the .com and .net TLD zones, was occasionally returning expired signatures in its DNS responses in the Asia Pacific region. As a result our recursive resolver was not able to validate the corresponding RRset. Ultimately this meant that a percentage of DNS queries would return SERVFAIL as response code to our authoritative nameserver. This in turn caused connection issues for users trying to connect to a domain on Cloudflare, because we weren't able to resolve the upstream target of affected domain names and thus didn’t know where to send proxied HTTPS requests to upstream servers.

Remediation and follow-up steps

Once we had identified the root cause we started to look at different ways to remedy the issue. We came to the conclusion that the fastest way to work around this very regionalized issue was to stop using the local route to Verisign's nameservers. This means that, at the time of writing this, our outgoing DNS traffic towards Verisign's nameservers in the Asia Pacific region now traverses the Pacific and ends up at the US west coast, rather than being served by closer nameservers. Due to the nature of DNS and the important role of DNS caching, this has less impact than you might initially expect. Frequently looked up names will be cached after the first request, and this only needs to happen once per data center, as we share and pool the local DNS recursor caches to maximize their efficiency.

Ideally, we would have been able to fix the issue right away as it potentially affected others in the region too, not just our customers. We will therefore work diligently to improve our incident communications channels with other providers in order to ensure that the DNS ecosystem remains robust against issues such as this. Being able to quickly get hold of other providers that can take action is vital when urgent issues like these arise.

Conclusion

This incident once again shows how impactful DNS failures are and how crucial this technology is for the Internet. We will investigate how we can improve our systems to detect and resolve issues like this more efficiently and quickly if they occur again in the future.

While Cloudflare was not the cause of this issue, and we are certain that we were not the only ones affected by this, we are still sorry for the disruption to our customers and to all the users who were unable to access Internet properties during this incident.

Cloudflare Incident on January 24th, 2023

Post Syndicated from Kenny Johnson original https://blog.cloudflare.com/cloudflare-incident-on-january-24th-2023/

Cloudflare Incident on January 24th, 2023

Cloudflare Incident on January 24th, 2023

Several Cloudflare services became unavailable for 121 minutes on January 24th, 2023 due to an error releasing code that manages service tokens. The incident degraded a wide range of Cloudflare products including aspects of our Workers platform, our Zero Trust solution, and control plane functions in our content delivery network (CDN).

Cloudflare provides a service token functionality to allow automated services to authenticate to other services. Customers can use service tokens to secure the interaction between an application running in a data center and a resource in a public cloud provider, for example. As part of the release, we intended to introduce a feature that showed administrators the time that a token was last used, giving users the ability to safely clean up unused tokens. The change inadvertently overwrote other metadata about the service tokens and rendered the tokens of impacted accounts invalid for the duration of the incident.

The reason a single release caused so much damage is because Cloudflare runs on Cloudflare. Service tokens impact the ability for accounts to authenticate, and two of the impacted accounts power multiple Cloudflare services. When these accounts’ service tokens were overwritten, the services that run on these accounts began to experience failed requests and other unexpected errors.

We know this impacted several customers and we know the impact was painful. We’re documenting what went wrong so that you can understand why this happened and the steps we are taking to prevent this from occurring again.

What is a service token?

When users log into an application or identity provider, they typically input a username and a password. The password allows that user to demonstrate that they are in control of the username and that the service should allow them to proceed. Layers of additional authentication can be added, like hard keys or device posture, but the workflow consists of a human proving they are who they say they are to a service.

However, humans are not the only users that need to authenticate to a service. Applications frequently need to talk to other applications. For example, imagine you build an application that shows a user information about their upcoming travel plans.

The airline holds details about the flight and its duration in their own system. They do not want to make the details of every individual trip public on the Internet and they do not want to invite your application into their private network. Likewise, the hotel wants to make sure that they only send details of a room booking to a valid, approved third party service.

Your application needs a trusted way to authenticate with those external systems. Service tokens solve this problem by functioning as a kind of username and password for your service. Like usernames and passwords, service tokens come in two parts: a Client ID and a Client Secret. Both the ID and Secret must be sent with a request for authentication. Tokens are also assigned a duration, after which they become invalid and must be rotated. You can grant your application a service token and, if the upstream systems you need validate it, your service can grab airline and hotel information and present it to the end user in a joint report.

When administrators create Cloudflare service tokens, we generate the Client ID and the Client Secret pair. Customers can then configure their requesting services to send both values as HTTP headers when they need to reach a protected resource. The requesting service can run in any environment, including inside of Cloudflare’s network in the form of a Worker or in a separate location like a public cloud provider. Customers need to deploy the corresponding protected resource behind Cloudflare’s reverse proxy. Our network checks every request bound for a configured service for the HTTP headers. If present, Cloudflare validates their authenticity and either blocks the request or allows it to proceed. We also log the authentication event.

Incident Timeline

All Timestamps are UTC

At 2023-01-24 16:55 UTC the Access engineering team initiated the release that inadvertently began to overwrite service token metadata, causing the incident.

At 2023-01-24 17:05 UTC a member of the Access engineering team noticed an unrelated issue and rolled back the release which stopped any further overwrites of service token metadata.

Service token values are not updated across Cloudflare’s network until the service token itself is updated (more details below). This caused a staggered impact of the service token’s that had their metadata overwritten.

2023-01-24 17:50 UTC: The first invalid service token for Cloudflare WARP was synced to the edge. Impact began for WARP and Zero Trust users.

Cloudflare Incident on January 24th, 2023
WARP device posture uploads dropped to zero which raised an internal alert

At 2023-01-24 18:12 an incident was declared due to the large drop in successful WARP device posture uploads.

2023-01-24 18:19 UTC: The first invalid service token for the Cloudflare API was synced to the edge. Impact began for Cache Purge, Cache Reserve, Images and R2. Alerts were triggered for these products which identified a larger scope of the incident.

Cloudflare Incident on January 24th, 2023

At 2023-01-24 18:21 the overwritten services tokens were discovered during the initial investigation.

At 2023-01-24 18:28 the incident was elevated to include all impacted products.

At 2023-01-24 18:51 An initial solution was identified and implemented to revert the service token to its original value for the Cloudflare WARP account, impacting WARP and Zero Trust. Impact ended for WARP and Zero Trust.

At 2023-01-24 18:56 The same solution was implemented on the Cloudflare API account, impacting Cache Purge, Cache Reserve, Images and R2. Impact ended for Cache Purge, Cache Reserve, Images and R2.

At 2023-01-24 19:00 An update was made to the Cloudflare API account which incorrectly overwrote the Cloudflare API account. Impact restarted for Cache Purge, Cache Reserve, Images and R2. All internal Cloudflare account changes were then locked until incident resolution.

At 2023-01-24 19:07 the Cloudflare API was updated to include the correct service token value. Impact ended for Cache Purge, Cache Reserve, Images and R2.

At 2023-01-24 19:51 all affected accounts had their service tokens restored from a database backup. Incident Ends.

What was released and how did it break?

The Access team was rolling out a new change to service tokens that added a “Last seen at” field. This was a popular feature request to help identify which service tokens were actively in use.

What went wrong?

The “last seen at” value was derived by scanning all new login events in an account’s login event Kafka queue. If a login event using a service token was detected, an update to the corresponding service token’s last seen value was initiated.

In order to update the service token’s “last seen at” value a read write transaction is made to collect the information about the corresponding service token. Service token read requests redact the “client secret” value by default for security reasons. The “last seen at” update to the service token then used that information from the read did not include the “client secret” and updated the service token with an empty “client secret” on the write.

An example of the correct and incorrect service token values shown below:

Example Access Service Token values

{
  "1a4ddc9e-a1234-4acc-a623-7e775e579c87": {
    "client_id": "6b12308372690a99277e970a3039343c.access",
    "client_secret": "<hashed-value>", <-- what you would expect
    "expires_at": 1698331351
  },
  "23ade6c6-a123-4747-818a-cd7c20c83d15": {
    "client_id": "1ab44976dbbbdadc6d3e16453c096b00.access",
    "client_secret": "", <--- this is the problem
    "expires_at": 1670621577
  }
}

The service token “client secret” database did have a “not null” check however in this situation an empty text string did not trigger as a null value.

As a result of the bug, any Cloudflare account that used a service token to authenticate during the 10 minutes “last seen at” release was out would have its “client secret” value set to an empty string. The service token then needed to be modified in order for the empty “client secret” to be used for authentication. There were a total of 4 accounts in this state, all of which are internal to Cloudflare.

How did we fix the issue?

As a temporary solution, we were able to manually restore the correct service token values for the accounts with overwritten service tokens. This stopped the immediate impact across the affected Cloudflare services.

The database team was then able to implement a solution to restore the service tokens of all impacted accounts from an older database copy. This concluded any impact from this incident.

Why did this impact other Cloudflare services?

Service tokens impact the ability for accounts to authenticate. Two of the impacted accounts power multiple Cloudflare services. When these accounts’ services tokens were overwritten, the services that run on these accounts began to experience failed requests and other unexpected errors.

Cloudflare WARP Enrollment

Cloudflare provides a mobile and desktop forward proxy, Cloudflare WARP (our “1.1.1.1” app), that any user can install on a device to improve the privacy of their Internet traffic. Any individual can install this service without the need for a Cloudflare account and we do not retain logs that map activity to a user.

When a user connects using WARP, Cloudflare validates the enrollment of a device by relying on a service that receives and validates the keys on the device. In turn, that service communicates with another system that tells our network to provide the newly enrolled device with access to our network

During the incident, the enrollment service could no longer communicate with systems in our network that would validate the device. As a result, users could no longer register new devices and/or install the app on a new device, and may have experienced issues upgrading to a new version of the app (which also triggers re-registration).

Cloudflare Zero Trust Device Posture and Re-Auth Policies

Cloudflare provides a comprehensive Zero Trust solution that customers can deploy with or without an agent living on the device. Some use cases are only available when using the Cloudflare agent on the device. The agent is an enterprise version of the same Cloudflare WARP solution and experienced similar degradation anytime the agent needed to send or receive device state. This impacted three use cases in Cloudflare Zero Trust.

First, similar to the consumer product, new devices could not be enrolled and existing devices could not be revoked. Administrators were also unable to modify settings of enrolled devices.. In all cases errors would have been presented to the user.

Second, many customers who replace their existing private network with Cloudflare’s Zero Trust solution may add rules that continually validate a user’s identity through the use of session duration policies. The goal of these rules is to enforce users to reauthenticate in order to prevent stale sessions from having ongoing access to internal systems. The agent on the device prompts the user to reauthenticate based on signals from Cloudflare’s control plane. During the incident, the signals were not sent and users could not successfully reauthenticate.

Finally, customers who rely on device posture rules also experienced impact. Device posture rules allow customers who use Access or Gateway policies to rely on the WARP agent to continually enforce that a device meets corporate compliance rules.

The agent communicates these signals to a Cloudflare service responsible for maintaining the state of the device. Cloudflare’s Zero Trust access control product uses a service token to receive this signal and evaluate it along with other rules to determine if a user can access a given resource. During this incident those rules defaulted to a block action, meaning that traffic modified by these policies would appear broken to the user. In some cases this meant that all internet bound traffic from a device was completely blocked leaving users unable to access anything.

Cloudflare Gateway caches the device posture state for users every 5 minutes to apply Gateway policies. The device posture state is cached so Gateway can apply policies without having to verify device state on every request. Depending on which Gateway policy type was matched, the user would experience two different outcomes. If they matched a network policy the user would experience a dropped connection and for an HTTP policy they would see a 5XX error page. We peaked at over 50,000 5XX errors/minute over baseline and had over 10.5 million posture read errors until the incident was resolved.

Gateway 5XX errors per minute

Cloudflare Incident on January 24th, 2023

Total count of Gateway Device posture errors

Cloudflare Incident on January 24th, 2023

Cloudflare R2 Storage and Cache Reserve

Cloudflare R2 Storage allows developers to store large amounts of unstructured data without the costly egress bandwidth fees associated with typical cloud storage services.

During the incident, the R2 service was unable to make outbound API requests to other parts of the Cloudflare infrastructure. As a result, R2 users saw elevated request failure rates when making requests to R2.  

Many Cloudflare products also depend on R2 for data storage and were also affected. For example, Cache Reserve users were impacted during this window and saw increased origin load for any items not in the primary cache. The majority of read and write operations to the Cache Reserve service were impacted during this incident causing entries into and out of Cache Reserve to fail. However, when Cache Reserve sees an R2 error, it falls back to the customer origin, so user traffic was still serviced during this period.

Cloudflare Cache Purge

Cloudflare’s content delivery network (CDN) caches the content of Internet properties on our network in our data centers around the world to reduce the distance that a user’s request needs to travel for a response. In some cases, customers want to purge what we cache and replace it with different data.

The Cloudflare control plane, the place where an administrator interacts with our network, uses a service token to authenticate and reach the cache purge service. During the incident, many purge requests failed while the service token was invalid. We saw an average impact of 20 purge requests/second failing and a maximum of 70 requests/second.

What are we doing to prevent this from happening again?

We take incidents like this seriously and recognize the impact it had. We have identified several steps we can take to address the risk of a similar problem occurring in the future. We are implementing the following remediation plan as a result of this incident:

Test: The Access engineering team will add unit tests that would automatically catch any similar issues with service token overwrites before any new features are launched.

Alert: The Access team will implement an automatic alert for any dramatic increase in failed service token authentication requests to catch issues before they are fully launched.

Process: The Access team has identified process improvements to allow for faster rollbacks for specific database tables.

Implementation: All relevant database fields will be updated to include checks for empty strings on top of existing “not null checks”

We are sorry for the disruption this caused for our customers across a number of Cloudflare services. We are actively making these improvements to ensure improved stability moving forward and that this problem will not happen again.

Partial Cloudflare outage on October 25, 2022

Post Syndicated from John Graham-Cumming original https://blog.cloudflare.com/partial-cloudflare-outage-on-october-25-2022/

Partial Cloudflare outage on October 25, 2022

Partial Cloudflare outage on October 25, 2022

Today, a change to our Tiered Cache system caused some requests to fail for users with status code 530. The impact lasted for almost six hours in total. We estimate that about 5% of all requests failed at peak. Because of the complexity of our system and a blind spot in our tests, we did not spot this when the change was released to our test environment.  

The failures were caused by side effects of how we handle cacheable requests across locations. At first glance, the errors looked like they were caused by a different system that had started a release some time before. It took our teams a number of tries to identify exactly what was causing the problems. Once identified we expedited a rollback which completed in 87 minutes.

We’re sorry, and we’re taking steps to make sure this does not happen again.

Background

One of Cloudflare’s products is our Content Delivery Network, or CDN. This is used to cache assets for websites globally. However, a data center is not guaranteed to have an asset cached. It could be new, expired, or has been purged. If that happens, and a user requests that asset, our CDN needs to retrieve a fresh copy from a website’s origin server. But the data center that the user is accessing might still be pretty far away from the origin server. This presents an additional issue for customers: every time an asset is not cached in the data center, we need to retrieve a new copy from the origin server.

To improve cache hit ratios, we introduced Tiered Cache. With Tiered Cache, we organize our data centers in the CDN into a hierarchy of “lower tiers” which are closer to the end users and “upper tiers” that are closer to the origin. When a cache-miss occurs in a lower tier, the upper tier is checked. If the upper tier has a fresh copy of the asset, we can serve that in response to the request. This improves performance and reduces the amount of times that Cloudflare has to reach out to an origin server to retrieve assets that are not cached in lower tier data centers.

Partial Cloudflare outage on October 25, 2022

Incident timeline and impact

At 08:40 UTC, a software release of a CDN component containing a bug began slowly rolling out. The bug was triggered when a user visited a site with either Tiered Cache, Cloudflare Images, or Bandwidth Alliance configured. This bug caused a subset of those customers to return HTTP Status Code 530 — an error. Content that could be served directly from a data center’s local cache was unaffected.

We started an investigation after receiving customer reports of an intermittent increase in 530s after the faulty component was released to a subset of data centers.

Once the release started rolling out globally to the remaining data centers, a sharp increase in 530s triggered alerts along with more customer reports, and an incident was declared.

Partial Cloudflare outage on October 25, 2022
Requests resulting in a response with status code 530

We confirmed a bad release was responsible by rolling back the release in a data center at 17:03 UTC. After the rollback, we observed a drop in 530 errors. After this confirmation, an accelerated global rollback began and the 530s started to decrease. Impact ended once the release was reverted in all data centers configured as Tiered Cache upper tiers at 18:04 UTC.

Timeline:

  • 2022-10-25 08:40: The release started to roll out to a small subset of data centers.
  • 2022-10-25 10:35: An individual customer alert fires, indicating an increase in 500 error codes.
  • 2022-10-25 11:20: After an investigation, a single small data center is pinpointed as the source of the issue and removed from production while teams investigate the issue there.
  • 2022-10-25 12:30: Issue begins spreading more broadly as more data centers get the code changes.
  • 2022-10-25 14:22: 530s errors increase as the release starts to slowly roll out to our largest data centers.
  • 2022-10-25 14:39: Multiple teams become involved in the investigation as more customers start reporting increases in errors.
  • 2022-10-25 17:03: CDN Release is rolled back in Atlanta and root cause is confirmed.
  • 2022-10-25 17:28: Peak impact with approximately 5% of all HTTP requests resulting in an error with status code 530.
  • 2022-10-25 17:38: An accelerated rollback continues with large data centers acting as Upper tier for many customers.
  • 2022-10-25 18:04: Rollback is complete in all Upper Tiers.
  • 2022-10-25 18:30: Rollback is complete.

During the early phases of the investigation, the indicators were that this was a problem with our internal DNS system that also had a release rolling out at the same time. As the following section shows, that was a side effect rather than the cause of the outage.  

Adding distributed tracing to Tiered Cache introduced the problem

In order to help improve our performance, we routinely add monitoring code to various parts of our services. Monitoring code helps by giving us visibility into how various components are performing, allowing us to determine bottlenecks that we can improve on. Our team recently added additional distributed tracing to our Tiered Cache logic. The tiered cache entrypoint code is as follows:

* Before:

function _M.go()
   -- code to run here
end

* After:

local trace_fn = require("opentracing").trace_fn
local function go()
-- code to run here
end
function _M.go()
trace_fn(ngx.ctx, "tiered_cache_rewrite", go)
end

The code above wraps the existing go() function with trace_fn() which will call the go() function and then reports its execution time.

However, the logic that injects a function to the opentracing module clears control headers on every request:

require("opentracing").configure_module(conf,
-- control header extractor
function(ctx)
-- Always clear the headers.
clear_control_headers()

Normally, we extract data from these control headers before clearing them as a routine part of how we process requests.

But internal tiered cache traffic expects the control headers from the lower tier to be passed as-is. The combination of clearing headers and using an upper tier meant that information that might be critical to the routing of the request was not available. In the subset of requests affected, we were missing the hostname to resolve by our internal DNS lookup for origin server IP addresses. As a result, a 530 DNS error was returned to the client.

Remediation and follow-up steps

To prevent this from happening again, in addition to the fixing the bug, we have identified a set of changes that help us detect and prevent issues like this in the future:

  • Include a larger data center that is configured as a Tiered Cache upper tier in an earlier stage in the release plan. This will allow us to notice similar issues more quickly, before a global release.
  • Expand our acceptance test coverage to include a broader set of configurations, including various Tiered Cache topologies.
  • Alert more aggressively in situations where we do not have full context on requests, and need the extra host information in the control headers.
  • Ensure that our system correctly fails fast in an error like this, which would have helped identify the problem during development and test.

Conclusion

We experienced an incident that affected a significant set of customers using Tiered Cache. After identifying the faulty component, we were able to quickly rollback and remediate the issue. We are sorry for any disruption this has caused our customers and end users trying to access services.

Remediations to prevent such an incident from happening in the future will be put in place as soon as possible.

The mechanics of a sophisticated phishing scam and how we stopped it

Post Syndicated from Matthew Prince original https://blog.cloudflare.com/2022-07-sms-phishing-attacks/

The mechanics of a sophisticated phishing scam and how we stopped it

The mechanics of a sophisticated phishing scam and how we stopped it

Yesterday, August 8, 2022, Twilio shared that they’d been compromised by a targeted phishing attack. Around the same time as Twilio was attacked, we saw an attack with very similar characteristics also targeting Cloudflare’s employees. While individual employees did fall for the phishing messages, we were able to thwart the attack through our own use of Cloudflare One products, and physical security keys issued to every employee that are required to access all our applications.

We have confirmed that no Cloudflare systems were compromised. Our Cloudforce One threat intelligence team was able to perform additional analysis to further dissect the mechanism of the attack and gather critical evidence to assist in tracking down the attacker.

This was a sophisticated attack targeting employees and systems in such a way that we believe most organizations would be likely to be breached. Given that the attacker is targeting multiple organizations, we wanted to share here a rundown of exactly what we saw in order to help other companies recognize and mitigate this attack.

Targeted Text Messages

On July 20, 2022, the Cloudflare Security team received reports of employees receiving legitimate-looking text messages pointing to what appeared to be a Cloudflare Okta login page. The messages began at 2022-07-22 22:50 UTC. Over the course of less than 1 minute, at least 76 employees received text messages on their personal and work phones. Some messages were also sent to the employee’s family members. We have not yet been able to determine how the attacker assembled the list of employee’s phone numbers but have reviewed access logs to our employee directory services and have found no sign of compromise.

Cloudflare runs a 24×7 Security Incident Response Team (SIRT). Every Cloudflare employee is trained to report anything that is suspicious to the SIRT. More than 90 percent of the reports to SIRT turn out to not be threats. Employees are encouraged to report anything and never discouraged from over-reporting. In this case, however, the reports to SIRT were a real threat.

The text messages received by employees looked like this:

The mechanics of a sophisticated phishing scam and how we stopped it

They came from four phone numbers associated with T-Mobile-issued SIM cards: (754) 268-9387, (205) 946-7573, (754) 364-6683 and (561) 524-5989. They pointed to an official-looking domain: cloudflare-okta.com. That domain had been registered via Porkbun, a domain registrar, at 2022-07-20 22:13:04 UTC — less than 40 minutes before the phishing campaign began.

Cloudflare built our secure registrar product in part to be able to monitor when domains using the Cloudflare brand were registered and get them shut down. However, because this domain was registered so recently, it had not yet been published as a new .com registration, so our systems did not detect its registration and our team had not yet moved to terminate it.

If you clicked on the link it took you to a phishing page. The phishing page was hosted on DigitalOcean and looked like this:

The mechanics of a sophisticated phishing scam and how we stopped it

Cloudflare uses Okta as our identity provider. The phishing page was designed to look identical to a legitimate Okta login page. The phishing page prompted anyone who visited it for their username and password.

Real-Time Phishing

We were able to analyze the payload of the phishing attack based on what our employees received as well as its content being posted to services like VirusTotal by other companies that had been attacked. When the phishing page was completed by a victim, the credentials were immediately relayed to the attacker via the messaging service Telegram. This real-time relay was important because the phishing page would also prompt for a Time-based One Time Password (TOTP) code.

Presumably, the attacker would receive the credentials in real-time, enter them in a victim company’s actual login page, and, for many organizations that would generate a code sent to the employee via SMS or displayed on a password generator. The employee would then enter the TOTP code on the phishing site, and it too would be relayed to the attacker. The attacker could then, before the TOTP code expired, use it to access the company’s actual login page — defeating most two-factor authentication implementations.

The mechanics of a sophisticated phishing scam and how we stopped it

Protected Even If Not Perfect

We confirmed that three Cloudflare employees fell for the phishing message and entered their credentials. However, Cloudflare does not use TOTP codes. Instead, every employee at the company is issued a FIDO2-compliant security key from a vendor like YubiKey. Since the hard keys are tied to users and implement origin binding, even a sophisticated, real-time phishing operation like this cannot gather the information necessary to log in to any of our systems. While the attacker attempted to log in to our systems with the compromised username and password credentials, they could not get past the hard key requirement.

But this phishing page was not simply after credentials and TOTP codes. If someone made it past those steps, the phishing page then initiated the download of a phishing payload which included AnyDesk’s remote access software. That software, if installed, would allow an attacker to control the victim’s machine remotely. We confirmed that none of our team members got to this step. If they had, however, our endpoint security would have stopped the installation of the remote access software.

How Did We Respond?

The main response actions we took for this incident were:

1. Block the phishing domain using Cloudflare Gateway

Cloudflare Gateway is a Secure Web Gateway solution providing threat and data protection with DNS / HTTP filtering and natively-integrated Zero Trust. We use this  solution internally to proactively identify malicious domains and block them. Our team added the malicious domain to Cloudflare Gateway to block all employees from accessing it.

Gateway’s automatic detection of malicious domains also identified the domain and blocked it, but the fact that it was registered and messages were sent within such a short interval of time meant that the system hadn’t automatically taken action before some employees had clicked on the links. Given this incident we are working to speed up how quickly malicious domains are identified and blocked. We’re also implementing controls on access to newly registered domains which we offer to customers but had not implemented ourselves.

2. Identify all impacted Cloudflare employees and reset compromised credentials

We were able to compare recipients of the phishing texts to login activity and identify threat-actor attempts to authenticate to our employee accounts. We identified login attempts blocked due to the hard key (U2F) requirements indicating that the correct password was used, but the second factor could not be verified. For the three of our employees’ credentials were leaked, we reset their credentials and any active sessions and initiated scans of their devices.

3. Identify and take down threat-actor infrastructure

The threat actor’s phishing domain was newly registered via Porkbun, and hosted on DigitalOcean. The phishing domain used to target Cloudflare was set up less than an hour before the initial phishing wave. The site had a Nuxt.js frontend, and a Django backend. We worked with DigitalOcean to shut down the attacker’s server. We also worked with Porkbun to seize control of the malicious domain.

From the failed sign-in attempts we were able to determine that the threat actor was leveraging Mullvad VPN software and distinctively using the Google Chrome browser on a Windows 10 machine. The VPN IP addresses used by the attacker were 198.54.132.88, and 198.54.135.222. Those IPs are assigned to Tzulo, a US-based dedicated server provider whose website claims they have servers located in Los Angeles and Chicago. It appears, actually, that the first was actually running on a server in the Toronto area and the latter on a server in the Washington, DC area. We blocked these IPs from accessing any of our services.

4. Update detections to identify any subsequent attack attempts

With what we were able to uncover about this attack, we incorporated additional signals to our already existing detections to specifically identify this threat-actor. At the time of writing we have not observed any additional waves targeting our employees. However, intelligence from the server indicated the attacker was targeting other organizations, including Twilio. We reached out to these other organizations and shared intelligence on the attack.

5. Audit service access logs for any additional indications of attack

Following the attack, we screened all our system logs for any additional fingerprints from this particular attacker. Given Cloudflare Access serves as the central control point for all Cloudflare applications, we can search the logs for any indication the attacker may have breached any systems. Given employees’ phones were targeted, we also carefully reviewed the logs of our employee directory providers. We did not find any evidence of compromise.

Lessons Learned and Additional Steps We’re Taking

We learn from every attack. Even though the attacker was not successful, we are making additional adjustments from what we’ve learned. We’re adjusting the settings for Cloudflare Gateway to restrict or sandbox access to sites running on domains that were registered within the last 24 hours. We will also run any non-whitelisted sites containing terms such as “cloudflare” “okta” “sso” and “2fa” through our browser isolation technology. We are also increasingly using Area 1’s phish-identification technology to scan the web and look for any pages that are designed to target Cloudflare. Finally, we’re tightening up our Access implementation to prevent any logins from unknown VPNs, residential proxies, and infrastructure providers. All of these are standard features of the same products we offer to customers.

The attack also reinforced the importance of three things we’re doing well. First, requiring hard keys for access to all applications. Like Google, we have not seen any successful phishing attacks since rolling hard keys out. Tools like Cloudflare Access made it easy to support hard keys even across legacy applications. If you’re an organization interested in how we rolled out hard keys, reach out to [email protected] and our security team would be happy to share the best practices we learned through this process.

Second, using Cloudflare’s own technology to protect our employees and systems. Cloudflare One’s solutions like Access and Gateway were critical to staying ahead of this attack. We configured our Access implementation to require hard keys for every application. It also creates a central logging location for all application authentications. And, if ever necessary, a place from which we can kill the sessions of a potentially compromised employee. Gateway allows us the ability to shut down malicious sites like this one quickly and understand what employees may have fallen for the attack. These are all functionalities that we make available to Cloudflare customers as part of our Cloudflare One suite and this attack demonstrates how effective they can.

Third, having a paranoid but blame-free culture is critical for security. The three employees who fell for the phishing scam were not reprimanded. We’re all human and we make mistakes. It’s critically important that when we do, we report them and don’t cover them up. This incident provided another example of why security is part of every team member at Cloudflare’s job.

Detailed Timeline of Events

2022-07-20 22:49 UTC Attacker sends out 100+ SMS messages to Cloudflare employees and their families.
2022-07-20 22:50 UTC Employees begin reporting SMS messages to Cloudflare Security team.
2022-07-20 22:52 UTC Verify that the attacker’s domain is blocked in Cloudflare Gateway for corporate devices.
2022-07-20 22:58 UTC Warning communication sent to all employees across chat and email.
2022-07-20 22:50 UTC to
2022-07-20 23:26 UTC
Monitor telemetry in the Okta System log & Cloudflare Gateway HTTP logs to locate credential compromise. Clear login sessions and suspend accounts on discovery.
2022-07-20 23:26 UTC Phishing site is taken down by the hosting provider.
2022-07-20 23:37 UTC Reset leaked employee credentials.
2022-07-21 00:15 UTC Deep dive into attacker infrastructure and capabilities.

Indicators of compromise

Value Type Context and MITRE Mapping
cloudflare-okta[.]com hosted on 147[.]182[.]132[.]52 Phishing URL T1566.002: Phishing: Spear Phishing Link sent to users.
64547b7a4a9de8af79ff0eefadde2aed10c17f9d8f9a2465c0110c848d85317a SHA-256 T1219: Remote Access Software being distributed by the threat actor

What You Can Do

If you are similar attacks in your environment, please don’t hesitate to reach out to [email protected], and we’re happy to share best practices on how to keep your business secure. Finally, if you want to work on detecting and mitigating the next attacks with us? We’re hiring on our Detection and Response team, come join us!

Cloudflare outage on June 21, 2022

Post Syndicated from Tom Strickx original https://blog.cloudflare.com/cloudflare-outage-on-june-21-2022/

Cloudflare outage on June 21, 2022

Introduction

Cloudflare outage on June 21, 2022

Today, June 21, 2022, Cloudflare suffered an outage that affected traffic in 19 of our data centers. Unfortunately, these 19 locations handle a significant proportion of our global traffic. This outage was caused by a change that was part of a long-running project to increase resilience in our busiest locations. A change to the network configuration in those locations caused an outage which started at 06:27 UTC. At 06:58 UTC the first data center was brought back online and by 07:42 UTC all data centers were online and working correctly.

Depending on your location in the world you may have been unable to access websites and services that rely on Cloudflare. In other locations, Cloudflare continued to operate normally.

We are very sorry for this outage. This was our error and not the result of an attack or malicious activity.

Background

Over the last 18 months, Cloudflare has been working to convert all of our busiest locations to a more flexible and resilient architecture. In this time, we’ve converted 19 of our data centers to this architecture, internally called Multi-Colo PoP (MCP): Amsterdam, Atlanta, Ashburn, Chicago, Frankfurt, London, Los Angeles, Madrid, Manchester, Miami, Milan, Mumbai, Newark, Osaka, São Paulo, San Jose, Singapore, Sydney, Tokyo.

A critical part of this new architecture, which is designed as a Clos network, is an added layer of routing that creates a mesh of connections. This mesh allows us to easily disable and enable parts of the internal network in a data center for maintenance or to deal with a problem. This layer is represented by the spines in the following diagram.

Cloudflare outage on June 21, 2022

This new architecture has provided us with significant reliability improvements, as well as allowing us to run maintenance in these locations without disrupting customer traffic. As these locations also carry a significant proportion of the Cloudflare traffic, any problem here can have a very wide impact, and unfortunately, that’s what happened today.

Incident timeline and impact

In order to be reachable on the Internet, networks like Cloudflare make use of a protocol called BGP. As part of this protocol, operators define policies which decide which prefixes (a collection of adjacent IP addresses) are advertised to peers (the other networks they connect to), or accepted from peers.

These policies have individual components, which are evaluated sequentially. The end result is that any given prefixes will either be advertised or not advertised. A change in policy can mean a previously advertised prefix is no longer advertised, known as being “withdrawn”, and those IP addresses will no longer be reachable on the Internet.

Cloudflare outage on June 21, 2022

While deploying a change to our prefix advertisement policies, a re-ordering of terms caused us to withdraw a critical subset of prefixes.

Due to this withdrawal, Cloudflare engineers experienced added difficulty in reaching the affected locations to revert the problematic change. We have backup procedures for handling such an event and used them to take control of the affected locations.

03:56 UTC: We deploy the change to our first location. None of our locations are impacted by the change, as these are using our older architecture.
06:17: The change is deployed to our busiest locations, but not the locations with the MCP architecture.
06:27: The rollout reached the MCP-enabled locations, and the change is deployed to our spines. This is when the incident started, as this swiftly took these 19 locations offline.
06:32: Internal Cloudflare incident declared.
06:51: First change made on a router to verify the root cause.
06:58: Root cause found and understood. Work begins to revert the problematic change.
07:42: The last of the reverts has been completed. This was delayed as network engineers walked over each other’s changes, reverting the previous reverts, causing the problem to re-appear sporadically.
09:00: Incident closed.

The criticality of these data centers can clearly be seen in the volume of successful HTTP requests we handled globally:

Cloudflare outage on June 21, 2022

Even though these locations are only 4% of our total network, the outage impacted 50% of total requests. The same can be seen in our egress bandwidth:

Cloudflare outage on June 21, 2022

Technical description of the error and how it happened

As part of our continued effort to standardize our infrastructure configuration, we were rolling out a change to standardize the BGP communities we attach to a subset of the prefixes we advertise. Specifically, we were adding informational communities to our site-local prefixes.

These prefixes allow our metals to communicate with each other, as well as connect to customer origins. As part of the change procedure at Cloudflare, a Change Request ticket was created, which includes a dry-run of the change, as well as a stepped rollout procedure. Before it was allowed to go out, it was also peer reviewed by multiple engineers. Unfortunately, in this case, the steps weren’t small enough to catch the error before it hit all of our spines.

The change looked like this on one of the routers:

[edit policy-options policy-statement 4-COGENT-TRANSIT-OUT term ADV-SITELOCAL then]
+      community add STATIC-ROUTE;
+      community add SITE-LOCAL-ROUTE;
+      community add TLL01;
+      community add EUROPE;
[edit policy-options policy-statement 4-PUBLIC-PEER-ANYCAST-OUT term ADV-SITELOCAL then]
+      community add STATIC-ROUTE;
+      community add SITE-LOCAL-ROUTE;
+      community add TLL01;
+      community add EUROPE;
[edit policy-options policy-statement 6-COGENT-TRANSIT-OUT term ADV-SITELOCAL then]
+      community add STATIC-ROUTE;
+      community add SITE-LOCAL-ROUTE;
+      community add TLL01;
+      community add EUROPE;
[edit policy-options policy-statement 6-PUBLIC-PEER-ANYCAST-OUT term ADV-SITELOCAL then]
+      community add STATIC-ROUTE;
+      community add SITE-LOCAL-ROUTE;
+      community add TLL01;
+      community add EUROPE;

This was harmless, and just added some additional information to these prefix advertisements. The change on the spines was the following:

[edit policy-options policy-statement AGGREGATES-OUT]
term 6-DISABLED_PREFIXES { ... }
!    term 6-ADV-TRAFFIC-PREDICTOR { ... }
!    term 4-ADV-TRAFFIC-PREDICTOR { ... }
!    term ADV-FREE { ... }
!    term ADV-PRO { ... }
!    term ADV-BIZ { ... }
!    term ADV-ENT { ... }
!    term ADV-DNS { ... }
!    term REJECT-THE-REST { ... }
!    term 4-ADV-SITE-LOCALS { ... }
!    term 6-ADV-SITE-LOCALS { ... }
[edit policy-options policy-statement AGGREGATES-OUT term 4-ADV-SITE-LOCALS then]
community delete NO-EXPORT { ... }
+      community add STATIC-ROUTE;
+      community add SITE-LOCAL-ROUTE;
+      community add AMS07;
+      community add EUROPE;
[edit policy-options policy-statement AGGREGATES-OUT term 6-ADV-SITE-LOCALS then]
community delete NO-EXPORT { ... }
+      community add STATIC-ROUTE;
+      community add SITE-LOCAL-ROUTE;
+      community add AMS07;
+      community add EUROPE;

An initial glance at this diff might give the impression that this change is identical, but unfortunately, that’s not the case. If we focus on one part of the diff, it might become clear why:

!    term REJECT-THE-REST { ... }
!    term 4-ADV-SITE-LOCALS { ... }
!    term 6-ADV-SITE-LOCALS { ... }

In this diff format, the exclamation marks in front of the terms indicate a re-ordering of the terms. In this case, multiple terms moved up, and two terms were added to the bottom. Specifically, the 4-ADV-SITE-LOCALS and 6-ADV-SITE-LOCALS terms moved from the top to the bottom. These terms were now behind the REJECT-THE-REST term, and as might be clear from the name, this term is an explicit reject:

term REJECT-THE-REST {
    then reject;
} 

As this term is now before the site-local terms, we immediately stopped advertising our site-local prefixes, removing our direct access to all the impacted locations, as well as removing the ability of our servers to reach origin servers.

On top of the inability to contact origins, the removal of these site-local prefixes also caused our internal load balancing system Multimog (a variation of our Unimog load-balancer) to stop working, as it could no longer forward requests between the servers in our MCPs. This meant that our smaller compute clusters in an MCP received the same amount of traffic as our largest clusters, causing the smaller ones to overload.

Cloudflare outage on June 21, 2022

Remediation and follow-up steps

This incident had widespread impact, and we take availability very seriously. We have identified several areas of improvement and will continue to work on uncovering any other gaps that could cause a recurrence.

Here is what we are working on immediately:

Process: While the MCP program was designed to improve availability, a procedural gap in how we updated these data centers ultimately caused a broader impact in MCP locations specifically. While we did use a stagger procedure for this change, the stagger policy did not include an MCP data center until the final step. Change procedures and automation need to include MCP-specific test and deploy procedures to ensure there are no unintended consequences.

Architecture: The incorrect router configuration prevented the proper routes from being announced, preventing traffic from flowing properly to our infrastructure. Ultimately the policy statement that caused the incorrect routing advertisement will be redesigned to prevent an unintentional incorrect ordering.

Automation: There are several opportunities in our automation suite that would mitigate some or all of the impact seen from this event. Primarily, we will be concentrating on automation improvements that enforce an improved stagger policy for rollouts of network configuration and provide an automated “commit-confirm” rollback. The former enhancement would have significantly lessened the overall impact, and the latter would have greatly reduced the Time-to-Resolve during the incident.

Conclusion

Although Cloudflare has invested significantly in our MCP design to improve service availability, we clearly fell short of our customer expectations with this very painful incident. We are deeply sorry for the disruption to our customers and to all the users who were unable to access Internet properties during the outage. We have already started working on the changes outlined above and will continue our diligence to ensure this cannot happen again.

PIPEFAIL: How a missing shell option slowed Cloudflare down

Post Syndicated from Alex Forster original https://blog.cloudflare.com/pipefail-how-a-missing-shell-option-slowed-cloudflare-down/

PIPEFAIL: How a missing shell option slowed Cloudflare down

PIPEFAIL: How a missing shell option slowed Cloudflare down

At Cloudflare, we’re used to being the fastest in the world. However, for approximately 30 minutes last December, Cloudflare was slow. Between 20:10 and 20:40 UTC on December 16, 2021, web requests served by Cloudflare were artificially delayed by up to five seconds before being processed. This post tells the story of how a missing shell option called “pipefail” slowed Cloudflare down.

Background

Before we can tell this story, we need to introduce you to some of its characters.

PIPEFAIL: How a missing shell option slowed Cloudflare down

Cloudflare’s Front Line protects millions of users from some of the largest attacks ever recorded. This protection is orchestrated by a sidecar service called dosd, which analyzes traffic and looks for attacks. When dosd detects an attack, it provides Front Line with a list of attack fingerprints that describe how Front Line can match and block the attack traffic.

Instances of dosd run on every Cloudflare server, and they communicate with each other using a peer-to-peer mesh to identify malicious traffic patterns. This decentralized design allows dosd to perform analysis with much higher fidelity than is possible with a centralized system, but its scale also imposes some strict performance requirements. To meet these requirements, we need to provide dosd with very fast access to large amounts of configuration data, which naturally means that dosd depends on Quicksilver. Cloudflare developed Quicksilver to manage configuration data and replicate it around the world in milliseconds, allowing it to be accessed by services like dosd in microseconds.

PIPEFAIL: How a missing shell option slowed Cloudflare down

One piece of configuration data that dosd needs comes from the Addressing API, which is our authoritative IP address management service. The addressing data it provides is important because dosd uses it to understand what kind of traffic is expected on particular IPs. Since addressing data doesn’t change very frequently, we use a simple Kubernetes cron job to query it at 10 minutes past each hour and write it into Quicksilver, allowing it to be efficiently accessed by dosd.

With this context, let’s walk through the change we made on December 16 that ultimately led to the slowdown.

The Change

Approximately once a week, all of our Bug Fixes and Performance Improvements to the Front Line codebase are released to the network. On December 16, the Front Line team released a fix for a subtle bug in how the code handled compression in the presence of a Cache-Control: no-transform header. Unfortunately, the team realized pretty quickly that this fix actually broke some customers who had started depending on that buggy behavior, so the team decided to roll back the release and work with those customers to correct the issue.

PIPEFAIL: How a missing shell option slowed Cloudflare down

Here’s a graph showing the progression of the rollback. While most releases and rollbacks are fully automated, this particular rollback needed to be performed manually due to its urgency. Since this was a manual rollback, SREs decided to perform it in two batches as a safety measure. The first batch went to our smaller tier 2 and 3 data centers, and the second batch went to our larger tier 1 data centers.

SREs started the first batch at 19:25 UTC, and it completed in about 30 minutes. Then, after verifying that there were no issues, they started the second batch at 20:10. That’s when the slowdown started.

The Slowdown

Within minutes of starting the second batch of rollbacks, alerts started firing. “Traffic levels are dropping.” “CPU utilization is dropping.” “A P0 incident has been automatically declared.” The timing could not be a coincidence. Somehow, a deployment of known-good code, which had been limited to a subset of the network and which had just been successfully performed 40 minutes earlier, appeared to be causing a global problem.

A P0 incident is an “all hands on deck” emergency, so dozens of Cloudflare engineers quickly began to assess impact to their services and test their theories about the root cause. The rollback was paused, but that did not fix the problem. Then, approximately 10 minutes after the start of the incident, my team – the DOS team – received a concerning alert: “dosd is not running on numerous servers.” Before that alert fired we had been investigating whether the slowdown was caused by an unmitigated attack, but this required our immediate attention.

Based on service logs, we were able to see that dosd was panicking because the customer addressing data in Quicksilver was corrupted in some way. Remember: the data in this Quicksilver key is important. Without it, dosd could not make correct choices anymore, so it refused to continue.

Once we realized that the addressing data was corrupted, we had to figure out how it was corrupted so that we could fix it. The answer turned out to be pretty obvious: the Quicksilver key was completely empty.

Following the old adage – “did you try restarting it?” – we decided to manually re-run the Kubernetes cron job that populates this key and see what happened. At 20:40 UTC, the cron job was manually triggered. Seconds after it completed, dosd started running again, and traffic levels began returning to normal. We confirmed that the Quicksilver key was no longer empty, and the incident was over.

The Aftermath

Despite fixing the problem, we still didn’t really understand what had just happened.

Why was the Quicksilver key empty?

It was urgent that we quickly figure out how an empty value was written into that Quicksilver key, because for all we knew, it could happen again at any moment.

We started by looking at the Kubernetes cron job, which turned out to have a bug:

PIPEFAIL: How a missing shell option slowed Cloudflare down

This cron job is implemented using a small Bash script. If you’re unfamiliar with Bash (particularly shell pipelining), here’s what it does:

First, the dos-make-addr-conf executable runs. Its job is to query the Addressing API for various bits of JSON data and serialize it into a Toml document. Afterward, that Toml is “piped” as input into the dosctl executable, whose job is to simply write it into a Quicksilver key called template_vars.

Can you spot the bug? Here’s a hint: what happens if dos-make-addr-conf fails for some reason and exits with a non-zero error code? It turns out that, by default, the shell pipeline ignores the error code and continues executing the next command! This means that the output of dos-make-addr-conf (which could be empty) gets unconditionally piped into dosctl and used as the value of the template_vars key, regardless of whether dos-make-addr-conf succeeded or failed.

30 years ago, when the first users of Bourne shell were burned by this problem, a shell option called “pipefail” was introduced. Enabling this option changes the shell’s behavior so that, when any command in a pipeline series fails, the entire pipeline stops processing. However, this option is not enabled by default, so it’s widely recommended as best practice that all scripts should start by enabling this (and a few other) options.

Here’s the fixed version of that cron job:

PIPEFAIL: How a missing shell option slowed Cloudflare down

This bug was particularly insidious because dosd actually did attempt to gracefully handle the case where this Quicksilver key contained invalid Toml. However, an empty string is a perfectly valid Toml document. If an error message had been accidentally written into this Quicksilver key instead of an empty string, then dosd would have rejected the update and continued to use the previous value.

Why did that cause the Front Line to slow down?

We had figured out how an empty key could be written into Quicksilver, and we were confident that it wouldn’t happen again. However, we still needed to untangle how that empty key caused such a severe incident.

As I mentioned earlier, the Front Line relies on dosd to tell it how to mitigate attacks, but it doesn’t depend on dosd directly to serve requests. Instead, once every few seconds, the Front Line asynchronously asks dosd for new attack fingerprints and stores them in an in-memory cache. This cache is consulted while serving each request, and if dosd ever fails to provide fresh attack fingerprints, then the stale fingerprints will continue to be used instead. So how could this have caused the impact that we saw?

PIPEFAIL: How a missing shell option slowed Cloudflare down

As part of the rollback process, the Front Line’s code needed to be reloaded. Reloading this code implicitly flushed the in-memory caches, including the attack fingerprint data from dosd. The next time that a request tried to consult with the cache, the caching layer realized that it had no attack fingerprints to return and a “cache miss” happened.

To handle a cache miss, the caching layer tried to reach out to dosd, and this is when the slowdown happened. While the caching layer was waiting for dosd to reply, it blocked all pending requests from progressing. Since dosd wasn’t running, the attempt eventually timed out after five seconds when the caching layer gave up. But in the meantime, each pending request was stuck waiting for the timeout to happen. Once it did, all the pending requests that were queued up over the five-second timeout period became unblocked and were finally allowed to progress. This cycle repeated over and over again every five seconds on every server until the dosd failure was resolved.

To trigger this slowdown, not only did dosd have to fail, but the Front Line’s in-memory cache had to also be flushed at the same time. If dosd had failed, but the Front Line’s cache had not been flushed, then the stale attack fingerprints would have remained in the cache and request processing would not have been impacted.

Why didn’t the first rollback cause this problem?

These two batches of rollbacks were performed by forcing servers to run a Salt highstate. When each batch was executed, thousands of servers began running highstates at the same time. The highstate process involves, among other things, contacting the Addressing API in order to retrieve various bits of customer addressing information.

The first rollback started at 19:25 UTC, and the second rollback started 45 minutes later at 20:10. Remember how I mentioned that our Kubernetes cron job only runs on the 10th minute of every hour? At 21:10 – exactly the time that our cron job started executing – thousands of servers also began to highstate, flooding the Addressing API with requests. All of these requests were queued up and eventually served, but it took the Addressing API a few minutes to work through the backlog. This delay was long enough to cause our cron job to time out, and, due to the “pipefail”  bug, inadvertently clobber the Quicksilver key that it was responsible for updating.

To trigger the “pipefail” bug, not only did we have to flood the Addressing API with requests, we also had to do it at exactly 10 minutes after the hour. If SREs had started the second batch of rollbacks a few minutes earlier or later, this bug would have continued to lay dormant.

Lessons Learned

This was a unique incident where a chain of small or unlikely failures cascaded into a severe and painful outage that we deeply regret. In response, we have hardened each link in the chain:

  • A manual rollback inadvertently triggered the thundering herd problem, which overwhelmed the Addressing API. We have since significantly scaled out the Addressing API, so that it can handle high request rates if it ever again has to.
  • An error in a Kubernetes cron job caused invalid data to be written to Quicksilver. We have since made sure that, when this cron job fails, it is no longer possible for that failure to clobber the Quicksilver key.
  • dosd did not correctly handle all possible error conditions when loading configuration data from Quicksilver, causing it to fail. We have since taken these additional conditions into account where necessary, so that dosd will gracefully degrade in the face of corrupt Quicksilver data.
  • The Front Line had an unexpected dependency on dosd, which caused it to fail when dosd failed. We have since removed all such dependencies, and the Front Line will now gracefully survive dosd failures.

More broadly, this incident has served as an example to us of why code and systems must always be resilient to failure, no matter how unlikely that failure may seem.

Incorrect proxying of 24 hostnames on January 24, 2022

Post Syndicated from Jeremy Hartman original https://blog.cloudflare.com/incorrect-proxying-of-24-hostnames-on-january-24-2022/

Incorrect proxying of 24 hostnames on January 24, 2022

On January 24, 2022, as a result of an internal Cloudflare product migration, 24 hostnames (including www.cloudflare.com) that were actively proxied through the Cloudflare global network were mistakenly redirected to the wrong origin. During this incident, traffic destined for these hostnames was passed through to the clickfunnels.com origin and may have resulted in a clickfunnels.com page being displayed instead of the intended website. This was our doing and clickfunnels.com was unaware of our error until traffic started to reach their origin.

API calls or other expected responses to and from these hostnames may not have responded properly, or may have failed completely. For example, if you were making an API call to api.example.com, and api.example.com was an impacted hostname, you likely would not have received the response you would have expected.

Here is what happened:

At 2022-01-24 22:24 UTC we started a migration of hundreds of thousands of custom hostnames to the Cloudflare for SaaS product. Cloudflare for SaaS allows SaaS providers to manage their customers’ websites and SSL certificates at scale – more information is available here. This migration was intended to be completely seamless, with the outcome being enhanced features and security for our customers. The migration process was designed to read the custom hostname configuration from a database and migrate it from SaaS v1 (the old system) to SaaS v2 (the current version) automatically.

To better understand what happened next, it’s important to explain a bit more about how custom hostnames are configured.

First, Cloudflare for SaaS customers can configure any hostname; but before we will proxy traffic to them, they must prove (via DNS validation) that they actually are allowed to handle that hostname’s traffic.

When the Cloudflare for SaaS customer first configures the hostname, it is marked as pending until DNS validation has occurred. Pending hostnames are very common for Cloudflare for SaaS customers as the hostname gets provisioned, and then the SaaS provider will typically work with their customer to put in place the appropriate DNS validation that proves ownership.

Once a hostname passes DNS validation, it moves from a pending state to an active state and can be proxied. Except in one case: there’s a special check for whether the hostname is marked as blocked within Cloudflare’s system. A blocked hostname is one that can’t be activated without manual approval by our Trust & Safety team. Some scenarios that could lead to a hostname being blocked include when the hostname is a Cloudflare-owned property, a well known brand, or a hostname in need of additional review for a variety of reasons.

During this incident, a very small number of blocked hostnames were erroneously moved to the active state while migrating clickfunnels.com’s customers. Once that occurred, traffic destined for those previously blocked hostnames was then processed by a configuration belonging to clickfunnels.com, sending traffic to the clickfunnels.com’s origin. One of those hostnames was www.cloudflare.com. Note that it was www.cloudflare.com and not cloudflare.com, so subdomains like dash.cloudflare.com, api.cloudflare.com, cdnjs.cloudflare.com, and so on were unaffected by this problem.

As the migration process continued down the list of hostnames, additional traffic was re-routed to the clickfunnels.com origin. At 23:06 UTC www.cloudflare.com was affected. At 23:15 UTC an incident was declared internally. Since the first alert we received was for www.cloudflare.com, we started our investigation there. In the next 19 minutes, the team restored www.cloudflare.com to its correct origin, determined the breadth of the impact and the root cause of the incident, and began remediation for the remaining affected hostnames.

By 2022-01-25 00:13 UTC, all custom hostnames had been restored to their proper configuration and the incident was closed. We have contacted all the customers who were affected by this error. We have worked with ClickFunnels to delete logs of this event to ensure that no data erroneously sent to the clickfunnels.com’s origin is retained by them and are very grateful for their speedy assistance.

Here is a graph (on a log scale) of requests to clickfunnels.com during the event. Out of a total of 268,430,157 requests redirected, 268,220,296 (99.92%) were for www.cloudflare.com:

Incorrect proxying of 24 hostnames on January 24, 2022

At Cloudflare, we take these types of incidents very seriously, dedicating massive amounts of resources in preventative action and in follow-up engineering. In this case, there are both procedural and technical follow-ups to prevent reoccurrence. Here are our next steps:

  • No more blocked hostname overrides. All blocked hostname changes will route through our verification pipeline as part of the migration process.
  • All migrations will require explicit validation and approval from SaaS customers for a blocked hostname to be considered for activation.
  • Additional monitoring will be added to the hostnames being migrated to spot potential erroneous traffic patterns and alert the migration team.
  • Additional monitoring added for www.cloudflare.com.
  • Stage hostname activations on non-production elements prior to promoting to production will enable the ability to verify the new hostname state is expected. This will allow us to catch issues before they hit production traffic.

Conclusion

This event exposed previously unknown gaps in our process and technology that directly impacted our customers. We are truly sorry for the disruption to our customers and any potential visitor to the impacted properties. Our commitment is to provide fully reliable and secure products, and we will continue to make every effort possible to deliver just that for our customers and partners.

A Byzantine failure in the real world

Post Syndicated from Tom Lianza original https://blog.cloudflare.com/a-byzantine-failure-in-the-real-world/

A Byzantine failure in the real world

An analysis of the Cloudflare API availability incident on 2020-11-02

When we review design documents at Cloudflare, we are always on the lookout for Single Points of Failure (SPOFs). Eliminating these is a necessary step in architecting a system you can be confident in. Ironically, when you’re designing a system with built-in redundancy, you spend most of your time thinking about how well it functions when that redundancy is lost.

On November 2, 2020, Cloudflare had an incident that impacted the availability of the API and dashboard for six hours and 33 minutes. During this incident, the success rate for queries to our API periodically dipped as low as 75%, and the dashboard experience was as much as 80 times slower than normal. While Cloudflare’s edge is massively distributed across the world (and kept working without a hitch), Cloudflare’s control plane (API & dashboard) is made up of a large number of microservices that are redundant across two regions. For most services, the databases backing those microservices are only writable in one region at a time.

Each of Cloudflare’s control plane data centers has multiple racks of servers. Each of those racks has two switches that operate as a pair—both are normally active, but either can handle the load if the other fails. Cloudflare survives rack-level failures by spreading the most critical services across racks. Every piece of hardware has two or more power supplies with different power feeds. Every server that stores critical data uses RAID 10 redundant disks or storage systems that replicate data across at least three machines in different racks, or both. Redundancy at each layer is something we review and require. So—how could things go wrong?

In this post we present a timeline of what happened, and how a difficult failure mode known as a Byzantine fault played a role in a cascading series of events.

2020-11-02 14:43 UTC: Partial Switch Failure

At 14:43, a network switch started misbehaving. Alerts began firing about the switch being unreachable to pings. The device was in a partially operating state: network control plane protocols such as LACP and BGP remained operational, while others, such as vPC, were not. The vPC link is used to synchronize ports across multiple switches, so that they appear as one large, aggregated switch to servers connected to them. At the same time, the data plane (or forwarding plane) was not processing and forwarding all the packets received from connected devices.

This failure scenario is completely invisible to the connected nodes, as each server only sees an issue for some of its traffic due to the load-balancing nature of LACP. Had the switch failed fully, all traffic would have failed over to the peer switch, as the connected links would’ve simply gone down, and the ports would’ve dropped out of the forwarding LACP bundles.

Six minutes later, the switch recovered without human intervention. But this odd failure mode led to further problems that lasted long after the switch had returned to normal operation.

2020-11-02 14:44 UTC: etcd Errors begin

The rack with the misbehaving switch included one server in our etcd cluster. We use etcd heavily in our core data centers whenever we need strongly consistent data storage that’s reliable across multiple nodes.

In the event that the cluster leader fails, etcd uses the RAFT protocol to maintain consistency and establish consensus to promote a new leader. In the RAFT protocol, cluster members are assumed to be either available or unavailable, and to provide accurate information or none at all. This works fine when a machine crashes, but is not always able to handle situations where different members of the cluster have conflicting information.

In this particular situation:

  • Network traffic between node 1 (in the affected rack) and node 3 (the leader) was being sent through the switch in the degraded state,
  • Network traffic between node 1 and node 2 were going through its working peer, and
  • Network traffic between node 2 and node 3 was unaffected.

This caused cluster members to have conflicting views of reality, known in distributed systems theory as a Byzantine fault. As a consequence of this conflicting information, node 1 repeatedly initiated leader elections, voting for itself, while node 2 repeatedly voted for node 3, which it could still connect to. This resulted in ties that did not promote a leader node 1 could reach. RAFT leader elections are disruptive, blocking all writes until they’re resolved, so this made the cluster read-only until the faulty switch recovered and node 1 could once again reach node 3.

A Byzantine failure in the real world

2020-11-02 14:45 UTC: Database system promotes a new primary database

Cloudflare’s control plane services use relational databases hosted across multiple clusters within a data center. Each cluster is configured for high availability. The cluster setup includes a primary database, a synchronous replica, and one or more asynchronous replicas. This setup allows redundancy within a data center. For cross-datacenter redundancy, a similar high availability secondary cluster is set up and replicated in a geographically dispersed data center for disaster recovery. The cluster management system leverages etcd for cluster member discovery and coordination.

When etcd became read-only, two clusters were unable to communicate that they had a healthy primary database. This triggered the automatic promotion of a synchronous database replica to become the new primary. This process happened automatically and without error or data loss.

There was a defect in our cluster management system that requires a rebuild of all database replicas when a new primary database is promoted. So, although the new primary database was available instantly, the replicas would take considerable time to become available, depending on the size of the database. For one of the clusters, service was restored quickly. Synchronous and asynchronous database replicas were rebuilt and started replicating successfully from primary, and the impact was minimal.

For the other cluster, however, performant operation of that database required a replica to be online. Because this database handles authentication for API calls and dashboard activities, it takes a lot of reads, and one replica was heavily utilized to spare the primary the load. When this failover happened and no replicas were available, the primary was overloaded, as it had to take all of the load. This is when the main impact started.

Reduce Load, Leverage Redundancy

At this point we saw that our primary authentication database was overwhelmed and began shedding load from it. We dialed back the rate at which we push SSL certificates to the edge, send emails, and other features, to give it space to handle the additional load. Unfortunately, because of its size, we knew it would take several hours for a replica to be fully rebuilt.

A silver lining here is that every database cluster in our primary data center also has online replicas in our secondary data center. Those replicas are not part of the local failover process, and were online and available throughout the incident. The process of steering read-queries to those replicas was not yet automated, so we manually diverted API traffic that could leverage those read replicas to the secondary data center. This substantially improved our API availability.

The Dashboard

The Cloudflare dashboard, like most web applications, has the notion of a user session. When user sessions are created (each time a user logs in) we perform some database operations and keep data in a Redis cluster for the duration of that user’s session. Unlike our API calls, our user sessions cannot currently be moved across the ocean without disruption. As we took actions to improve the availability of our API calls, we were unfortunately making the user experience on the dashboard worse.

This is an area of the system that is currently designed to be able to fail over across data centers in the event of a disaster, but has not yet been designed to work in both data centers at the same time. After a first period in which users on the dashboard became increasingly frustrated, we failed the authentication calls fully back to our primary data center, and kept working on our primary database to ensure we could provide the best service levels possible in that degraded state.

2020-11-02 21:20 UTC Database Replica Rebuilt

The instant the first database replica rebuilt, it put itself back into service, and performance resumed to normal levels. We re-ramped all of the services that had been turned down, so all asynchronous processing could catch up, and after a period of monitoring marked the end of the incident.

Redundant Points of Failure

The cascade of failures in this incident was interesting because each system, on its face, had redundancy. Moreover, no system fully failed—each entered a degraded state. That combination meant the chain of events that transpired was considerably harder to model and anticipate. It was frustrating yet reassuring that some of the possible failure modes were already being addressed.

A team was already working on fixing the limitation that requires a database replica rebuild upon promotion. Our user sessions system was inflexible in scenarios where we’d like to steer traffic around, and redesigning that was already in progress.

This incident also led us to revisit the configuration parameters we put in place for things that auto-remediate. In previous years, promoting a database replica to primary took far longer than we liked, so getting that process automated and able to trigger on a minute’s notice was a point of pride. At the same time, for at least one of our databases, the cure may be worse than the disease, and in fact we may not want to invoke the promotion process so quickly. Immediately after this incident we adjusted that configuration accordingly.

Byzantine Fault Tolerance (BFT) is a hot research topic. Solutions have been known since 1982, but have had to choose between a variety of engineering tradeoffs, including security, performance, and algorithmic simplicity. Most general-purpose cluster management systems choose to forgo BFT entirely and use protocols based on PAXOS, or simplifications of PAXOS such as RAFT, that perform better and are easier to understand than BFT consensus protocols. In many cases, a simple protocol that is known to be vulnerable to a rare failure mode is safer than a complex protocol that is difficult to implement correctly or debug.

The first uses of BFT consensus were in safety-critical systems such as aircraft and spacecraft controls. These systems typically have hard real time latency constraints that require tightly coupling consensus with application logic in ways that make these implementations unsuitable for general-purpose services like etcd. Contemporary research on BFT consensus is mostly focused on applications that cross trust boundaries, which need to protect against malicious cluster members as well as malfunctioning cluster members. These designs are more suitable for implementing general-purpose services such as etcd, and we look forward to collaborating with researchers and the open source community to make them suitable for production cluster management.

We are very sorry for the difficulty the outage caused, and are continuing to improve as our systems grow. We’ve since fixed the bug in our cluster management system, and are continuing to tune each of the systems involved in this incident to be more resilient to failures of their dependencies.  If you’re interested in helping solve these problems at scale, please visit cloudflare.com/careers.

Analysis of Today’s CenturyLink/Level(3) Outage

Post Syndicated from Matthew Prince original https://blog.cloudflare.com/analysis-of-todays-centurylink-level-3-outage/

Analysis of Today's CenturyLink/Level(3) Outage

Today CenturyLink/Level(3), a major ISP and Internet bandwidth provider, experienced a significant outage that impacted some of Cloudflare’s customers as well as a significant number of other services and providers across the Internet. While we’re waiting for a post mortem from CenturyLink/Level(3), I wanted to write up the timeline of what we saw, how Cloudflare’s systems routed around the problem, why some of our customers were still impacted in spite of our mitigations, and what  appears to be the likely root cause of the issue.

Increase In Errors

At 10:03 UTC our monitoring systems started to observe an increased number of errors reaching our customers’ origin servers. These show up as “522 Errors” and indicate that there is an issue connecting from Cloudflare’s network to wherever our customers’ applications are hosted.

Cloudflare is connected to CenturyLink/Level(3) among a large and diverse set of network providers. When we see an increase in errors from one network provider, our systems automatically attempt to reach customers’ applications across alternative providers. Given the number of providers we have access to, we are generally able to continue to route traffic even when one provider has an issue.

Analysis of Today's CenturyLink/Level(3) Outage
The diverse set of network providers Cloudflare connects to. Source: https://bgp.he.net/AS13335#_asinfo‌‌

Automatic Mitigations

In this case, beginning within seconds of the increase in 522 errors, our systems automatically rerouted traffic from CenturyLink/Level(3) to alternate network providers we connect to including Cogent, NTT, GTT, Telia, and Tata.

Our Network Operations Center was also alerted and our team began taking additional steps to mitigate any issues our automated systems weren’t automatically able to address beginning at 10:09 UTC. We were successful in keeping traffic flowing across our network for most customers and end users even with the loss of CenturyLink/Level(3) as one of our network providers.

Analysis of Today's CenturyLink/Level(3) Outage
Dashboard Cloudflare’s automated systems recognizing the damage to the Internet caused by the CenturyLink/Level(3) failure and automatically routing around it.

The graph below shows traffic between Cloudflare’s network and six major tier-1 networks that are among the network providers we connect to. The red portion shows CenturyLink/Level(3) traffic, which dropped to near-zero during the incident. You can also see how we automatically shifted traffic to other network providers during the incident to mitigate the impact and ensure traffic continued to flow.

Analysis of Today's CenturyLink/Level(3) Outage
Traffic across six major tier-1 networks that are among the network providers Cloudflare connects to. CenturyLink/Level(3) in red.

The following graph shows 522 errors (indicating our inability to reach customers’ applications) across our network during the time of the incident.

Analysis of Today's CenturyLink/Level(3) Outage

The sharp spike up at 10:03 UTC was the CenturyLink/Level(3) network failing. Our automated systems immediately kicked in to attempt to reroute and rebalance traffic across alternative network providers, causing the errors to drop in half immediately and then fall to approximately 25 percent of the peak as those paths were automatically optimized.

Between 10:03 UTC and 10:11 UTC our systems automatically disabled CenturyLink/Level(3) in the 48 cities where we’re connected to them and rerouted traffic across alternate network providers. Our systems take into account capacity on other providers before shifting out traffic in order to prevent cascading failures. This is why the failover, while automatic, isn’t instantaneous in all locations. Our team was able to apply additional manual mitigations to reduce the number of errors another 5 percent.

Why Did the Errors Not Drop to Zero?

Unfortunately, there were still an elevated number of errors indicating we were still unable to reach some customers. CenturyLink/Level(3) is among the largest network providers in the world. As a result, many hosting providers only have single-homed connectivity to the Internet through their network.

To use the old Internet as a “superhighway” analogy, that’s like only having a single offramp to a town. If the offramp is blocked, then there’s no way to reach the town. This was exacerbated in some cases because CenturyLink/Level(3)’s network was not honoring route withdrawals and continued to advertise routes to networks like Cloudflare’s even after they’d been withdrawn. In the case of customers whose only connectivity to the Internet is via CenturyLink/Level(3), or if CenturyLink/Leve(3) continued to announce bad routes after they’d been withdrawn, there was no way for us to reach their applications and they continued to see 522 errors until CenturyLink/Level(3) resolved their issue around 14:30 UTC.

The same was a problem on the other (“eyeball”) side of the network. Individuals need to have an onramp onto the Internet’s superhighway. An onramp to the Internet is essentially what your ISP provides. CenturyLink is one of the largest ISPs in the United States.

Analysis of Today's CenturyLink/Level(3) Outage
Source: https://broadbandnow.com/CenturyLink

Because this outage appeared to take all of the CenturyLink/Level(3) network offline, individuals who are CenturyLink customers would not have been able to reach Cloudflare or any other Internet provider until the issue was resolved. Globally, we saw a 3.5% drop in global traffic during the outage, nearly all of which was due to a nearly complete outage of CenturyLink’s ISP service across the United States.

So What Likely Happened Here?

While we will not know exactly what happened until CenturyLink/Level(3) issue a post mortem, we can see clues from BGP announcements and how they propagated across the Internet during the outage. BGP is the Border Gateway Protocol. It is how routers on the Internet announce to each other what IPs sit behind them and therefore what traffic they should receive.

Starting at 10:04 UTC, there were a significant number of BGP updates. A BGP update is the signal a router makes to say that a route has changed or is no longer available. Under normal conditions, the Internet sees about 1.5MBs – 2MBs of BGP updates every 15 minutes. At the start of the incident, the number of BGP updates spiked to more than 26MBs of BGP updates per 15 minute period and stayed elevated throughout the incident.

Analysis of Today's CenturyLink/Level(3) Outage
Source: http://archive.routeviews.org/bgpdata/2020.08/UPDATES/

These updates show the instability of BGP routes inside the CenturyLink/Level(3) backbone. The question is what would have caused this instability. The CenturyLink/Level(3) status update offers some hints and points at a flowspec update as the root cause.

Analysis of Today's CenturyLink/Level(3) Outage

What’s Flowspec?

In CenturyLink/Level(3)’s update they mention that a bad Flowspec rule caused the issue. So what is Flowspec? Flowspec is an extension to BGP, which allows firewall rules to be easily distributed across a network, or even between networks, using BGP. Flowspec is a powerful tool. It allows you to efficiently push rules across an entire network almost instantly. It is great when you are trying to quickly respond to something like an attack, but it can be dangerous if you make a mistake.

At Cloudflare, early in our history, we used to use Flowspec ourselves to push out firewall rules in order to, for instance, mitigate large network-layer DDoS attacks. We suffered our own Flowspec-induced outage more than 7 years ago. We no longer use Flowspec ourselves, but it remains a common protocol for pushing out network firewall rules.

We can only speculate what happened at CenturyLink/Level(3), but one plausible scenario is that they issued a Flowspec command to try to block an attack or other abuse directed at their network. The status report indicates that the Flowspec rule prevented BGP itself from being announced. We have no way of knowing what that Flowspec rule was, but here’s one in Juniper’s format that would have blocked all BGP communications across their network.

route DISCARD-BGP {
   match {
      protocol tcp;
      destination-port 179;
   }
 then discard;
}

Why So Many Updates?

A mystery remains, however, why global BGP updates stayed elevated throughout the incident. If the rule blocked BGP then you would expect to see an increase in BGP announcements initially and then they would fall back to normal.

One possible explanation is that the offending Flowspec rule came near the end of a long list of BGP updates. If that were the case, what may have happened is that every router in CenturyLink/Level(3)’s network would receive the Flowspec rule. They would then block BGP. That would cause them to stop receiving the rule. They would start back up again, working their way through all the BGP rules until they got to the offending Flowspec rule again. BGP would be dropped again. The Flowspec rule would no longer be received. And the loop would continue, over and over.

One challenge of this is that on every cycle, the queue of BGP updates would continue to increase within CenturyLink/Level(3)’s network. This may have gotten to a point where the memory and CPU of their routers was overloaded, causing an additional set of challenges to getting their network back online.

Why Did It Take So Long to Fix?

This was a significant global Internet outage and, undoubtedly, the CenturyLink/Level(3) team received immediate alerts. They are a very sophisticated network operator with a world class Network Operations Center (NOC). So why did it take more than four hours to resolve?

Again, we can only speculate. First, it may have been that the Flowspec rule and the significant load that large number of BGP updates imposed on their routers made it difficult for them to login to their own interfaces. Several of the other tier-1 providers took action, it appears at CenturyLink/Level(3)’s request, to de-peer their networks. This would have limited the number of BGP announcements being received by the CenturyLink/Level(3) network and helped give it time to catch up.

Second, it also may have been that the Flowspec rule was not issued by CenturyLink/Level(3) themselves but rather by one of their customers. Many network providers will allow Flowspec peering. This can be a powerful tool for downstream customers wishing to block attack traffic, but can make it much more difficult to track down an offending Flowspec rule when something goes wrong.

Finally, it never helps when these issues occur early on a Sunday morning. Networks the size and scale of CenturyLink/Level(3)’s are extremely complicated. Incidents happen. We appreciate their team keeping us informed with what was going on throughout the incident. #hugops