All posts by Michael Kammer

Exploring the Human Side of Software with Dylan Beatty

Post Syndicated from Michael Kammer original https://blog.zabbix.com/exploring-the-human-side-of-software-with-dylan-beatty/31320/

There are plenty of good reasons to attend Zabbix Summit 2025, but one of the most important is the fact that this year’s Summit will feature Dylan Beattie as a special guest speaker. A Software Development Consultant and Founder of Ursatile, Dylan is an international keynote speaker, and a long-time contributor to the open-source community. He’s also a Microsoft MVP and has created Rockstar, an esoteric programming language that started as an inside joke and ended up being featured in Classic Rock magazine.

At the Summit, Dylan will give a talk titled “Open Source, Open Minds. The Cost of Free Software.” We asked him about his beginnings in the tech industry, what drove the creation of Rockstar, and why communication is the key to successful software development.

Can you tell us a bit about your journey into software development? How did you get started, and was there any particular moment when you realized that you were on the right path?

Like a lot of folks in tech, I got started on the 8-bit home computers of the 1980s – mine was an Amstrad 6128, which came with a couple of fairly mediocre games, but it also had a BASIC and a LOGO interpreter, and I pretty quickly found out that writing little programs and trying to create my own games was way more fun than playing the games which were included with it. I graduated from that to a 286 PC with MS—DOS 5, Windows 3.1 – but I really wasn’t thinking about it as a career.

The turning point was when I was sixteen years old, and I was supposed to be going to university to study mathematics. Dad brought home a new 486 PC a couple of weeks before my final exams, I spent my study leave messing around on the computer instead of studying, and when I didn’t get the grades I needed for my university course I figured maybe that was a sign I should be studying computer science instead. I went to Southampton and got a bachelor’s degree in computer science, learned C, C++, Lisp, SQL, and HTML. I graduated right as the dot-com bubble was bursting but still managed to get a job building data-driven web applications, and I’ve never really looked back.

You talk a lot about the human side of software. Why do you think communication is such a critical skill in development?

One of the perennial challenges facing the craft of programming is that it can be a profoundly solitary activity. One person working on their own can create an app or a game, put it online, and share their creation with literally millions of people – no meetings, no emails, just one person cranking out code. But then you try to translate those coding skills into domains like banking, healthcare, aviation, domains where software quality can have a real, material effect on people’s lives, and you realize that the code is actually the easy part.

The ability to talk to people, figure out what they need, help them understand your own ideas; to create consensus and avoid misunderstanding? It’s way more important than being able to crank out code. The most expensive problems I’ve had to deal with in my career haven’t been bugs in the code, they’ve been misunderstandings about what the team is doing and why it matters.

How did you end up creating a programming language (Rockstar) that can do double-duty as rock lyrics?

Good question! So, there’s always been this trope of the “rockstar programmer” – these mythical, high-powered, hyper-productive developers who can crank out millions of lines of fast, flawless code – and about a decade ago there was a massive spike in recruiters putting out adverts for “rockstar programmers.” When somebody suggested on Twitter that somebody should create a programming language called Rockstar to really confuse recruiters, that gave me an idea.

Initially it was just a piece of comedy writing – a parody of a programming language specification. I wanted to see if it was possible to extract enough clichés from rock music to create a formal grammar for a Turing-complete programming language that read exactly like song lyrics. It turns out that the answer is yes! I published the parody spec on GitHub, it got shared on Reddit and Hacker News, and the whole thing snowballed from there. Eventually I had no choice but to actually build a Rockstar interpreter, which turned out to be way more difficult than I thought, but also a lot of fun. The latest version is online here  – it’s built in C#, compiles to native binaries for WIndows, Linux, and macOS, plus there’s a web assembly version on the website so curious folks can run Rockstar right in their browser without having to download anything!

Before taking on a speaking slot at this year’s Summit, how familiar were you with Zabbix? What has your experience of using it been like?

I’ve got to be honest – I’m not sure I’d ever heard of Zabbix before I was invited to speak at Zabbix Summit 2025, but that’s not unusual. I get invited to a lot of events that are focused around a particular technology or platform, and it’s a constant reminder of just how vast our industry is that somebody will organize a conference around a product I’ve never even heard of and attract literally hundreds of smart, curious people who want to share their own experiences and learn from each other. One thing about Zabbix which was particularly interesting to me when I started researching it was the licensing model. I think it’s a relatively unusual example of a commercially sustainable product or software that’s published under the Affero GPL license, so I’m really looking forward to chatting with other attendees about that and how that’s influenced their decision to use it.

You’re famous for your detailed and theatrical presentations – what makes a technical talk memorable to you?

A great talk is one that really connects with an audience, and the best way I’ve found to do that is to look for the little things that we all do every day that we’ve all learned just accept at face value, even when we have no idea why they work that way. Why is a capital “A” ASCII code 65 but a lowercase “a” is code 97? Why is validating email addresses difficult? Why is vertically aligning something in CSS such a big deal? There’s a good chance that a lot of folks in the audience have asked themselves that same question at some point, so the curiosity is already there. Tapping into that curiosity gets their attention, and then you can tell them the good stuff: the history, the stories, the personalities, the decisions.

There’s a lot of stuff in tech which feels kinda stupid, but none of it was designed to be stupid (well, except Rockstar!) Once you understand the context and the history, everything makes a lot more sense – and then at some point, maybe months later, you’ll hit a weird text encoding bug, or a problem with a system that won’t accept certain kinds of email addresses, and you’ll remember the talk. I get email from folks sometimes talking about how something from one of my presentations has helped them fix a weird bug years after they saw the presentation. That’s a great feeling.

Can you drop any hints about your presentation at this year’s Summit? What should audience members expect?

Sure! We’re going to talk about MIT, laser printers, software, Commander Keen, Doom, Quake, Netscape, the origins of the term “open source”, Linksys routers, WordPress, how the xz-utils backdoor nearly ended up compromising about half the computers on the internet – and a really cute story about a squirrel. It’s going to be awesome. I can’t wait!


The post Exploring the Human Side of Software with Dylan Beatty appeared first on Zabbix Blog.

Expand your Knowledge at Zabbix Summit 2025

Post Syndicated from Michael Kammer original https://blog.zabbix.com/expand-your-knowledge-at-zabbix-summit-2025/31168/

October is just around the corner, and that annual shift into Q4 can mean only one thing – it’s almost Summit time! Zabbix Summit 2025 will take place on October 8-10 in Riga, Latvia at the Radisson Blu Hotel Latvija, and it’s shaping up to be the perfect blend of established traditions and fresh approaches – we’ve been at this for a (very lucky) 13 years now, and we’d like to think we’ve kept the aspects of the Summit experience that everyone knows and loves while adding a few twists! Here’s what you can expect for the price of admission:

Top-tier presentations from Zabbix leaders and experts

The learning begins with Zabbix Founder and CEO Alexei Vladishev’s keynote speech, which promises to be an “info drop” full of details about upcoming releases, new features, and what Alexei sees on the horizon for Zabbix. From there, it will be time for over 30 main stage speakers spread across two days of conference action. Some of the highlights include:

Presentations from Zabbix experts on topics like:

  • Turning playbooks into automated action plans
  • Streaming metrics for multiple tenants without chaos
  • Syncing systems painlessly
  • Maintaining control over massive amounts of Zabbix data
  • Detecting and responding to security threats before they escalate

Deep dives that will show you how to:

  • Spot the blind spots in large-scale networks (and fix them)
  • Keep tabs on Zabbix itself (after all, even monitoring needs monitoring)
  • Take full control of tag management
  • Use Zabbix Proxy to scale without breaking a sweat

Practical case studies, including:

  • Turning sensor data into insights with AI
  • Keeping SAP environments and multisite clusters in check
  • Transforming enterprise-level monitoring
  • Supercharging operations via migration projects
  • Making discovery, correlation, and AI work together for smart monitoring in action

Expect all this, plus inside information from the Zabbix team on the path to becoming a Zabbix partner and how Zabbix services can help you scale efficiently. As if that weren’t enough, this year’s Summit will also feature special guest Dylan Beattie! A Software Development Consultant and Founder of Ursatile, Dylan is an international keynote speaker, and a long-time contributor to the open-source community.

At the Summit, Dylan will give a talk titled “Open Source, Open Minds. The Cost of Free Software.” Expect stories about why developers choose to give their code away, what happens when they change their minds, the quirks of licenses and legalities, and the big question of whether open source can ever be truly sustainable.

Dedicated Dev and Community tracks

Created by developers and for developers, the Dev Track makes its debut this year and brings together some of the top minds on the Zabbix development team to cover topics as diverse as extending Zabbix Agent 2 with custom plugins, enhanced widget development, and template design best practices.

For attendees of a slightly less technical persuasion, the Community Track is there to facilitate author led discussions about community-driven content and resources, like the Zabbix Book. Assembled by longtime Zabbix enthusiasts Patrik Uytterhoeven, Brian van Baekel, and Nathan Liefting, the Zabbix Book will get its own breakout room, where Summit attendees can brainstorm in small groups about how to improve the book via new ideas and topics.

Hands-on workshops

The Summit experience has always been about finding opportunities to put theory into practice, and this year’s workshops showcase the latest features and use cases in action. Attendees will be able to dive into workshops on AI powered monitoring with Zabbix and ESP32, nested LLDs (low-level discovery), reducing alert noise, diagnosing performance issues with Diaginfo, and using Netflow integration via H5 Network. It’s a rare opportunity to confirm your knowledge retention by performing real-world tasks under the guidance of workshop hosts and their assistants.

Training and certification (yes, with discounts!)

A Zabbix Summit is the perfect place to get recognized as a Zabbix specialist or professional by taking part in Zabbix Certified Training sessions and exams at bargain prices. These one-day courses will be held from October 6 through October 13:

  • Automation and Integration with Zabbix API
  • Advanced Zabbix Database Monitoring
  • Advanced Zabbix SNMP Monitoring
  • Zabbix Certified Specialist Upgrade
  • Zabbix Certified Professional Upgrade

If you find yourself in Riga after the Summit, it’s worth your time to take part in the full Zabbix Certified Specialist course scheduled for October 13-17. Please remember that you can choose more than one training course and also keep in mind that you can attend the courses (without the 50% Summit discount) even if you’re not joining us at the Summit. You can register for all training sessions and exams here.

Networking and community building


A big part of what makes a Zabbix Summit a Zabbix Summit is the vibe – a big, global community coming together to catch up with old friends, welcome new members, and celebrate a certain open-source monitoring solution that brings us all together. That atmosphere of conviviality is exactly what makes a Summit such a one-of-a-kind networking opportunity. We’ve put together an open house visit and three evening events that are the ideal places to connect with like-minded monitoring enthusiasts, show off your skills, or get your company’s name in front of industry decision-makers.

This year’s Zabbix Open House on October 8 is your chance to see where the magic happens – drop by our offices and chat with our team members, grab yourself a coffee in our kitchen, and take part in a quiz that will teach even the most seasoned Zabbix fans a few new fun facts.

No summit would be complete without its events, and the opening event of Zabbix Summit 2025 on October 8 will take place at Riga’s renowned Monkey Club, with delicious fusion cuisine, a broad selection of cocktails and beverages, and a chance to unwind in style with your fellow Summit attendees.

The main event on October 9 is hosted by the Tallinn Quarter Hangar, which boasts a concert hall as well as a modern, open-plan street food kitchen and bar that are guaranteed to offer something for everyone.

On October 10, Zabbix Summit 2025 will wrap up at downtown Riga’s Burzma food hall, which offers 10 restaurants and a bar serving up a broad range of flavors from every corner of the globe. It’s the perfect location to relive Summit highlights in the company of your fellow Zabbix enthusiasts, and we’re looking forward to seeing you there!

Can’t make it? There’s always YouTube

A Zabbix Summit is one of those “you had to be there” events, but if you can’t make it to Riga, no worries – as in previous years, we’re going to be livestreaming all the speeches on our YouTube channel! Find out more and subscribe to the livestream here.

The post Expand your Knowledge at Zabbix Summit 2025 appeared first on Zabbix Blog.

Zabbix at the Zhongnan University of Economics and Law

Post Syndicated from Michael Kammer original https://blog.zabbix.com/zabbix-at-the-zhongnan-university-of-economics-and-law/30949/

Zhongnan University of Economics and Law (ZUEL), located in Wuhan City, Hubei Province, China, is a key university with two campuses – Nanhu and Shouyi. The school boasts over 20,000 full-time undergraduate students, more than 8,800 graduate students, and over 2,500 faculty and staff members. ZUEL enjoys an outstanding reputation in the fields of law and economics, with four national key disciplines. Its law discipline, meanwhile, has been included in the list of national “Double First-Class” disciplines.

The challenge

As the information infrastructure at ZUEL continues to expand, the scale of the university’s IT infrastructure has rapidly grown to encompass power systems, dynamic environmental systems, servers, network devices, security appliances, storage systems, virtualization platforms, operating systems, databases, data lakes, and campus application systems.

At the same time, the daily academic and administrative activities of faculty and students increasingly demand higher levels of stability and reliability from information systems. To ensure the efficient operation of these systems, the Information Management department needed a monitoring and management system that could cover the entire university’s IT resources and address the growing complexities of operational maintenance.

The university found that traditional monitoring and management systems often fall short when faced with such large-scale and diverse monitoring demands, revealing problems like insufficient monitoring points, poor real-time capabilities, and limited scalability. To address these challenges, the university decided to adopt Zabbix 7.0 and develop a custom IP Radar platform to further meet its refined operational maintenance needs.

The solution

When combined with Zabbix 7.0, the IP Radar system can achieve comprehensive monitoring and management of the university’s entire IT infrastructure through the integrated application of multiple monitoring protocols and technologies. Specifically, the system collects data and performs monitoring with the help of the following core technologies:

  • Zabbix 7.0. As an enterprise-level open-source monitoring platform renowned for its robust data collection and analysis capabilities, Zabbix enhances the system’s high availability, supporting large-scale concurrent processing to make sure that the monitoring system remains stable and delivers uninterrupted service even under heavy loads.
  • Parallel monitoring with multiple protocols. The system collects data through a variety of protocols, including Agent, SNMP, IPMI, MODBUS, MQTT, and more, enabling the real-time monitoring of a wide variety of IT hardware.
  • High-availability design. To accommodate the monitoring demands of massive devices and thousands of users, the Zabbix 7.0 platform supports multi-node deployment and redundancy design, enabling load balancing and failover among proxy servers. Even in the event of a node failure, the system maintains uninterrupted monitoring services, and it’s also equipped with an automated fault alerting and repair mechanism.
  • The self-developed IP Radar platform. To meet a demanding set of operation and maintenance management needs, ZUEL has developed the IP Radar system based on the Zabbix 7.0 platform, further customizing its business monitoring capabilities. IP Radar not only conducts real-time monitoring of the IT infrastructure, but it also provides detailed performance analysis reports and trend predictions, while integrating behavior monitoring capabilities to enhance the school’s network security management.

The IP Radar platform itself contains a variety of unique and innovative features, including:

  • Comprehensive monitoring coverage. The IP Radar system monitors over a million items – everything from hardware devices to application systems, affecting everything from network performance to user experience. This extensive coverage gives the Information Management department to a comprehensive understanding of the operational status of the school’s IT resources while providing sufficient data support for troubleshooting and performance optimization.
  • Customized monitoring strategies. Compared to traditional monitoring systems, IP Radar offers highly customized monitoring strategies. ZUEL can tailor different business dashboards for networks, computing resources, user experience, data center environments, and more, based on its own needs and the permissions granted to operation and maintenance personnel. Depending on different monitoring thresholds and alerting strategies, the system can automatically generate alerts and notify relevant personnel through enterprise WeChat, SMS, and other channels.
  • Intelligent alerting and automated handling. The intelligent alerting system of the IP Radar platform leverages machine learning algorithms to analyze historical monitoring data, enabling it to predict potential fault risks and issue early warnings. At the same time, the system integrates automated operation and maintenance capabilities, which allow it to automatically execute predetermined repair operations when certain common faults occur, reducing the time and cost of manual intervention.
  • Network security monitoring. In terms of network security, the IP Radar system is capable of identifying abnormal traffic patterns and promptly detecting potential security threats through real-time analysis of the school’s entire network traffic. The system also supports the monitoring of online behavior to ensure that network access activities comply with the school’s security policies.

The results

After implementing the Zabbix-based system, ZUEL was able to measure a wide range of monitoring performance improvements, including:

  • Improved operational and maintenance efficiency. Through the IP Radar system, the school’s Information Management department has been able to monitor the operational status of over 28,000 hosts in real-time, significantly enhancing operational efficiency. The system’s automated fault handling capabilities reduce the complexity of manual operations, allowing operations and maintenance personnel to focus on addressing only the complex issues that the system is unable to resolve automatically. At the same time, the system’s intelligent alerting feature enables the early detection of potential problems, preventing sudden failures.
  • Enhancing system stability and reliability. The high availability design of Zabbix 7.0 ensures that the system remains stable even under heavy loads. Its redundant design and automatic failover mechanisms guarantee the reliability of the system, and the trend analysis functionality provided by IP Radar helps administrators to identify factors that may affect system stability in advance and making corresponding adjustments, enhancing the overall reliability of the IT system in the process.
  • Advancing detailed information management. The IP Radar platform lets schools manage multiple IT resources with greater precision. The system not only monitors the operational status of hardware devices, but it also analyzes the performance of business systems, helping administrators to optimize system configurations and enhancing user experiences. During project development, historical data from the monitoring platform serves as an essential basis for decision-making. In the acceptance phase, the monitoring platform provides evaluation reference data for operational efficiency and stability.

The IP Radar monitoring and management system developed by ZUEL and based on Zabbix 7.0 has become the largest, most widely used, and most effective (in terms of the volume of monitored data) in the Chinese education sector. The successful implementation of this system not only provides strong support for the school’s information management, but it also offers valuable references for information operation and maintenance at other universities.

In conclusion

Looking ahead, the IP Radar system is poised to expand its functionalities further by integrating more intelligent operation and maintenance management tools. Through the introduction of emerging technologies such as big data analysis and artificial intelligence, the system will achieve more breakthroughs in areas like automated operation and maintenance as well as intelligent fault prediction, providing even more comprehensive technical support for the university’s information management.

To learn more about what Zabbix can do for educational institutions, visit our website.


The post Zabbix at the Zhongnan University of Economics and Law appeared first on Zabbix Blog.

Reducing Alert Fatigue with Zabbix and China Pacific Insurance

Post Syndicated from Michael Kammer original https://blog.zabbix.com/reducing-alert-fatigue-with-zabbix-and-china-pacific-insurance/30913/

Headquartered in Shanghai, the China Pacific Insurance (Group) Co., Ltd. (CPI) is a Chinese insurance company that was established on the basis of the former China Pacific Insurance Corporation. CPI Group is the second largest property insurance company and the third largest life insurance company in Mainland China. It provides integrated insurance services (including life insurance, property insurance, and reinsurance) through its subsidiaries.

The challenge:

The overall data center operation structure of the company works along financial industry lines, with a two-site, three-center operation model. The total scale of China Pacific Insurance’s on-premises hosts is over 6,000, and the three centers add up to nearly 40,000 host devices in the production environment.

It’s an enormous amount of information to monitor, so any monitoring solution needs to significantly reduce the difficulty of overall alert analysis. The alert information provided by the mixture of cloud product components that CPI were using caused a serious case of alert fatigue for their operations and maintenance personnel, with some alerts taking as long as 4 months to process.

The solution:

The bank’s cloud platforms all had their own monitoring and alerting functions, but the configuration of value threshold and notification policies was not flexible enough. Zabbix’s ability to uniformly collect data while configuring triggers and alerting proved to be a game-changer.

In addition, when compared to cloud vendors whose solutions require adjustments to thresholds in each product component, Zabbix proved to be a much simpler and more cost-effective way to notify operators of only the most essential alerts.

The results:

In practice, CPI found that the Zabbix multi-index combined alert function eliminates 30% of invalid alerts. Thanks to this success, CPI now plans to transfer the Zabbix Data Transmission Service to their digital twin data center, so that the inspection of physical facilities and the impact analysis of the application system can be quickly displayed to their operations and maintenance personnel.

Conclusion

The team at China Pacific Insurance successfully built an intelligent operation and maintenance system covering a number of key modules such as automated operation and maintenance, intelligent monitoring, logging platforms, and container platforms – all with Zabbix at the core. They are currently exploring the cutting-edge integration of monitoring systems with LLMs, further advancing intelligent monitoring and observability solutions in the process.

To learn more about what Zabbix can do for customers in banking and finance, visit our website.

The post Reducing Alert Fatigue with Zabbix and China Pacific Insurance appeared first on Zabbix Blog.

Keeping Latvia Connected with Zabbix and LMT

Post Syndicated from Michael Kammer original https://blog.zabbix.com/keeping-latvia-connected-with-zabbix-and-lmt/30834/

LMT is a mobile GSM/UMTS/LTE operator in Latvia. Founded on January 2, 1992, it was the first mobile network operator in the country. In addition to providing mobile network and ISP services, LMT uses innovative technologies and solutions to develop and maintain a variety of IT solutions for public and private organizations. Currently, LMT is the largest telecommunications service provider in the country, with over 1,660 base stations and over 1.5 million users as of 2024.

The challenge

LMT utilizes a variety of monitoring solutions for a variety of purposes – from tools performing and monitoring ping responses to vendor-specific solutions and all-in-one tools such as Zabbix. LMT has 2 data centers, and since the vast majority of services delivered by LMT can be considered critical, most of the relevant infrastructure is duplicated across them.

Multiple Zabbix instances are used in the environment, including Zabbix 5.0 with MySQL database backend, Zabbix 7.0 with PostgreSQL, and TimescaleDB. Over 3,000 hosts with approximately 500,000 items are monitored by Zabbix.

The solution

Here is one example of how Zabbix is used to monitor switch cabinets in LMT data centers. Switch cabinets contain devices to measure the electric current, which support Modbus protocol and which can in turn be used to collect data.

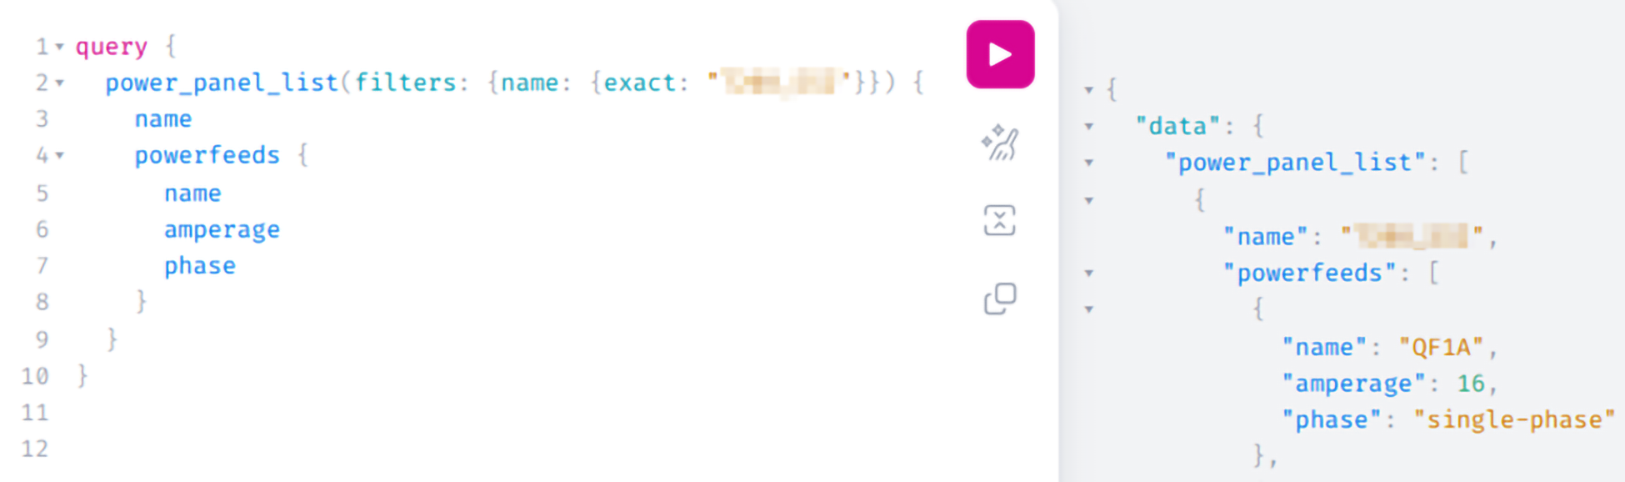
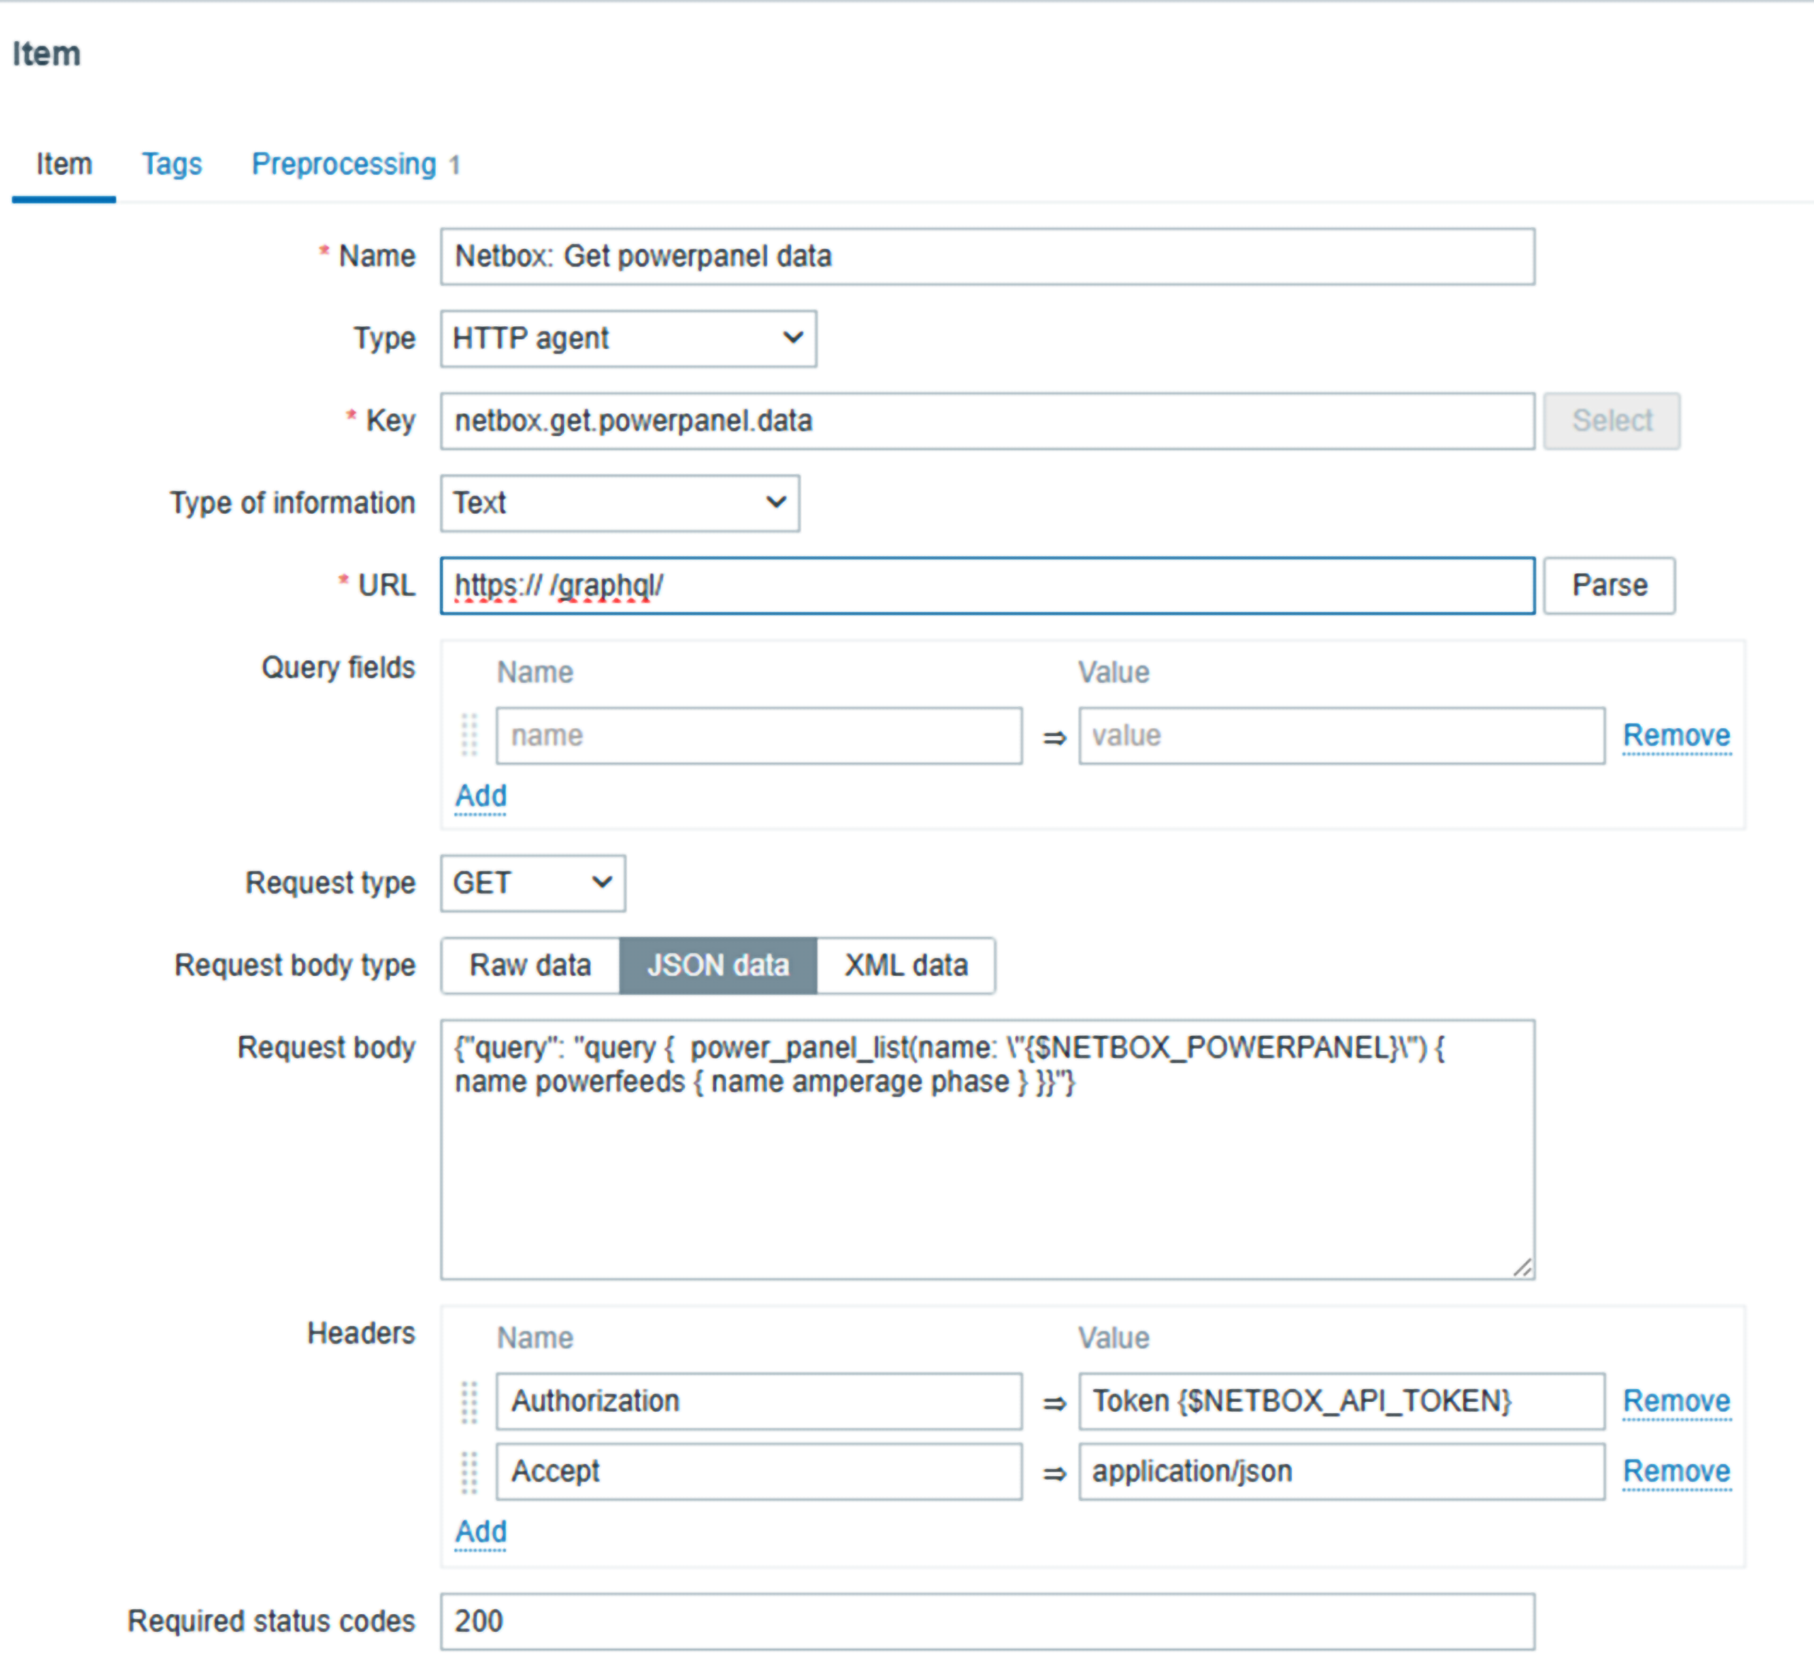
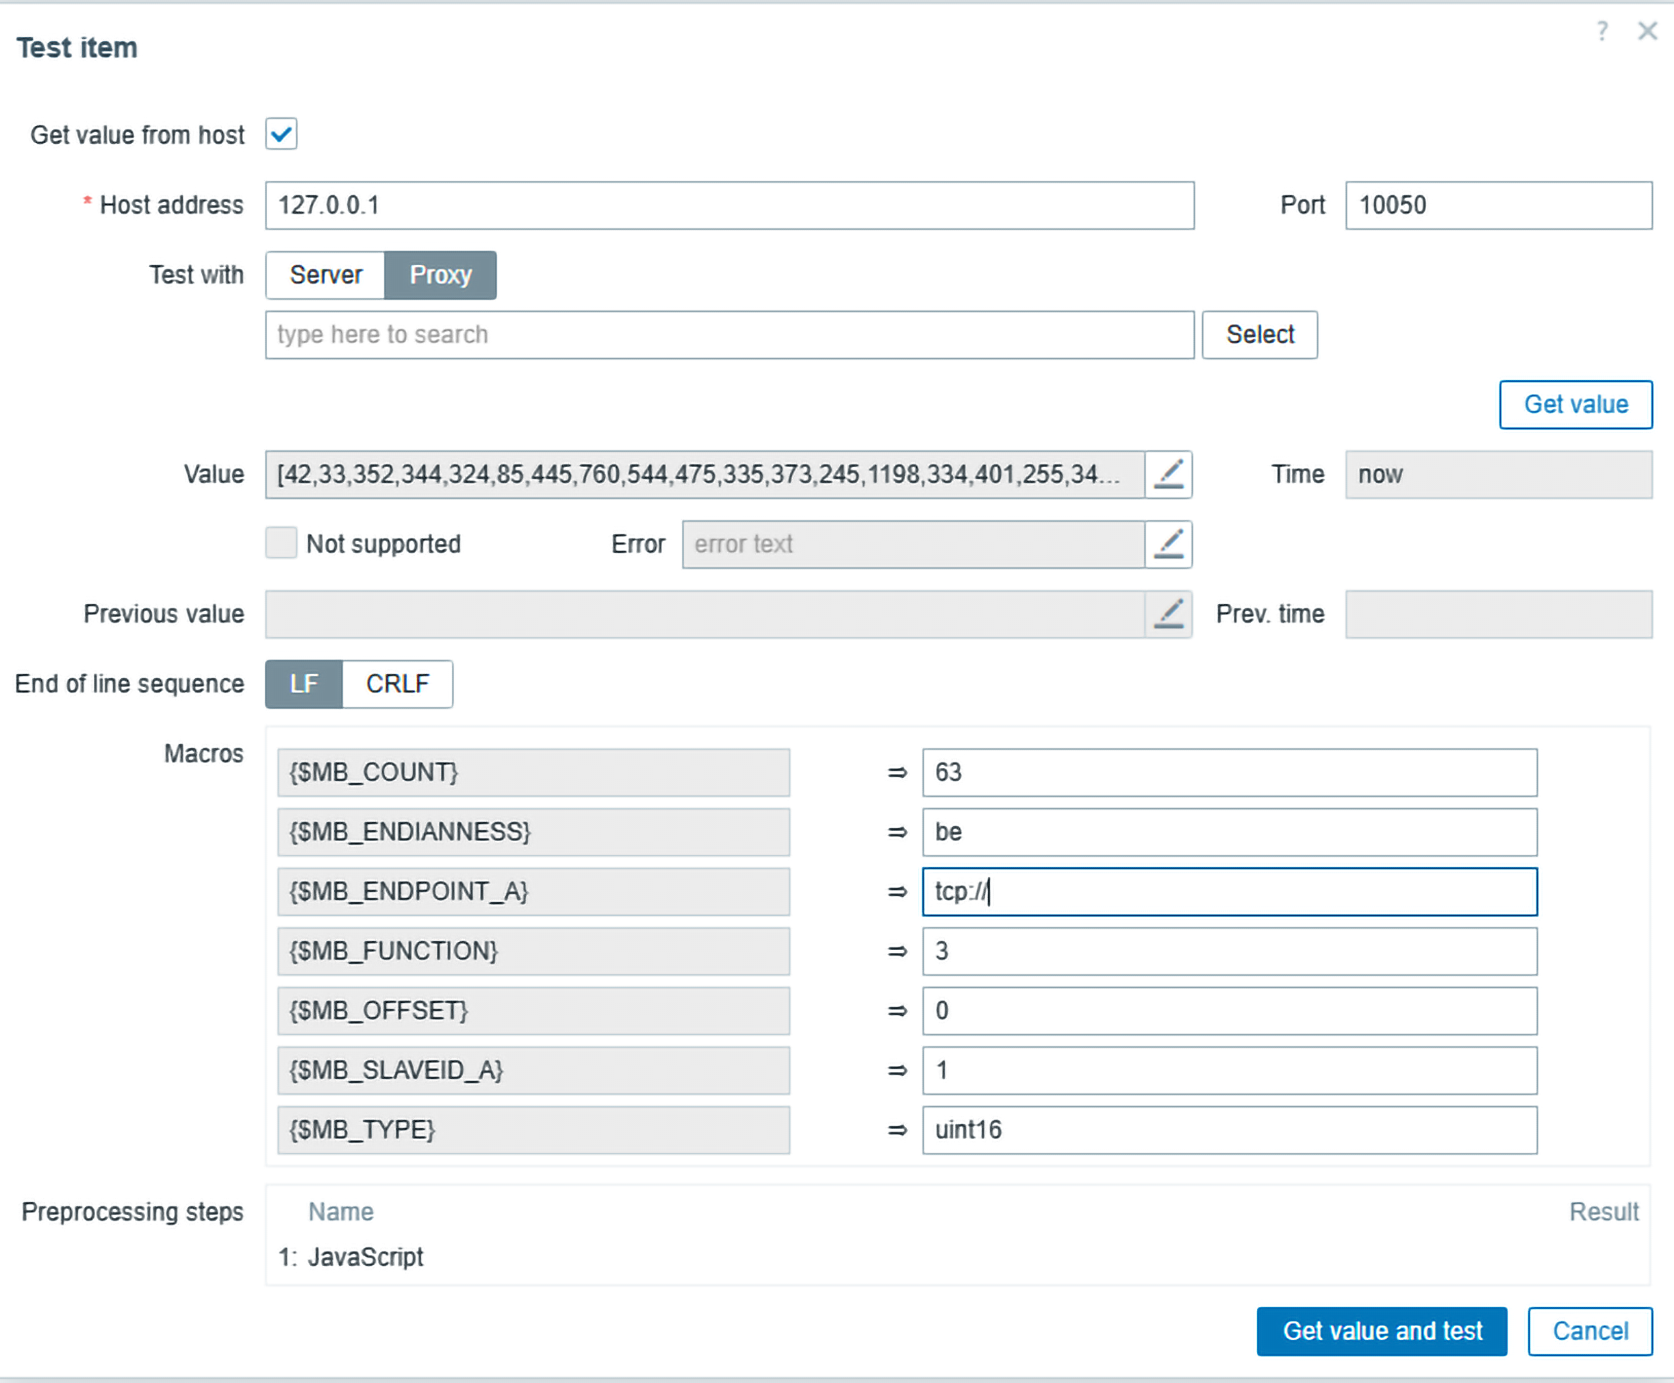
Modbus monitoring was achieved by using Zabbix agent2 with the official Modbus plugin. This was combined with NetBox and GraphQL. NetBox was used as the source of truth, providing information about power feed and various electrical characteristics, such as voltage, amperage, utilization, phase, and more. The data was collected from NetBox via HTTP agent checks and GraphQL, and a JSON result was created by utilizing Zabbix preprocessing features.

The information collected from NetBox is combined with Modbus data collection utilizing Zabbix agent2. The data collected by Zabbix agent2 is preprocessed after the collection. The collected data is normalized and used by Zabbix low-level discovery features to automatically create Zabbix items and triggers for the available resources. Finally, the resulting data is visualized on Zabbix dashboards.

The results

Monitoring with Zabbix has made reacting to changes in the monitored power feed (detecting spikes, observing gradual power feed changes, etc.) a much simpler proposition for LMT, which in turn improves service for its millions of users.

In conclusion

Zabbix has proven itself to be an ideal solution for telecommunications clients, making it easier than ever to keep track of network health and performance, driving a more positive customer experience and greater revenue growth in the process.

To learn more about what Zabbix can do for customers in telecommunications, get in touch with us.

The post Keeping Latvia Connected with Zabbix and LMT appeared first on Zabbix Blog.

Transforming IT Infrastructure Visibility at Doğan Trend Automotive

Post Syndicated from Michael Kammer original https://blog.zabbix.com/transforming-it-infrastructure-visibility-at-dogan-trend-automotive/30715/

Established in 2020 to consolidate Doğan Group’s automotive and mobility companies and brands under a single entity, Doğan Trend Automotive is a prominent player in their industry. Representing a diverse portfolio ranging from automobiles, motorcycles, and marine engines to electric commercial vehicles, Doğan Trend also delivers innovative solutions to customers through its e-commerce platforms, such as suvmarket.com and vespastoreturkey.com.

The challenge

Doğan Trend’s IT ecosystem spans data centers, remote locations, and multiple units, necessitating seamless operations as well as an efficient monitoring and alert system. The existing infrastructure posed challenges in monitoring, making it difficult to detect potential issues in a timely manner, thus increasing operational risks.

The solution

To address Doğan Trend’s needs, our associates at ASNSKY implemented a Zabbix-based monitoring system. Key highlights of the project included:

  • Centralized dashboards: Custom dashboards were designed for data centers and remote locations, enabling the unified monitoring of IT locations and components from a single interface.
  • A dynamic alert system: Alerts prioritized based on predefined conditions allowed for the swift and effective resolution of critical issues.
  • Seamless operations: Early detection of potential issues prevented operational disruptions and ensured continuity.

Throughout the integration process, ASNSKY’s team collaborated closely with Doğan Trend’s IT department, addressing the specific requirements of different units and providing training for effective system use.

The results

Implementing the new monitoring system rapidly delivered the following results:

  • Enhanced visibility: Real-time monitoring of all IT locations and components made potential issues easy to spot.
  • Proactive issue management: Early detection of critical issues reduced operational downtime.
  • Increased efficiency: The centralized monitoring system drastically improved the responsiveness and effectiveness of Doğan Trend’s IT team.

“This project with the ASNSKY team made our IT infrastructure more transparent and manageable. With Zabbix’s flexible and effective monitoring capabilities, we gained active control over our critical operations. We thank the ASNSKY team for this successful collaboration.” – Burak Altunalan, IT System Management Specialist at Doğan Trend Automotive

In conclusion

Doğan Trend plans to further take advantage of Zabbix’s flexibility to strengthen their resilience and operational efficiency. Their association with ASNSKY marks a significant step toward achieving these objectives.

To learn more about what Zabbix can do for retail customers in every sector, get in touch with us. 

About ASNSKY

ASNSKY enhances its customers’ competitiveness by integrating the power of enterprise-grade open-source-solutions in security and infrastructure with a professional service approach and high quality standards.

Backed by deep industry expertise and a team of seasoned professionals, ASNSKY stands as a trusted partner in your digital transformation journey.

The post Transforming IT Infrastructure Visibility at Doğan Trend Automotive appeared first on Zabbix Blog.

Zabbix and a Federal Government Agency

Post Syndicated from Michael Kammer original https://blog.zabbix.com/zabbix-and-a-federal-government-agency/30708/

Our Premium Partners at the ATS Group work with a large federal government agency in the United States. They primarily provide storage and compute-as-a-service for the agency, which relies on them to stay up and running at all times.

The challenge

The agency’s primary goal was to simplify their capacity and performance monitoring without extra costs. They had very strict regulatory and SLO oversight requirements that had to be met, especially when it came to capacity and performance.

There was no commercially available software that could accomplish everything they needed directly out of the box, but they still required a solution that was powerful and flexible enough to monitor almost anything.

The solution

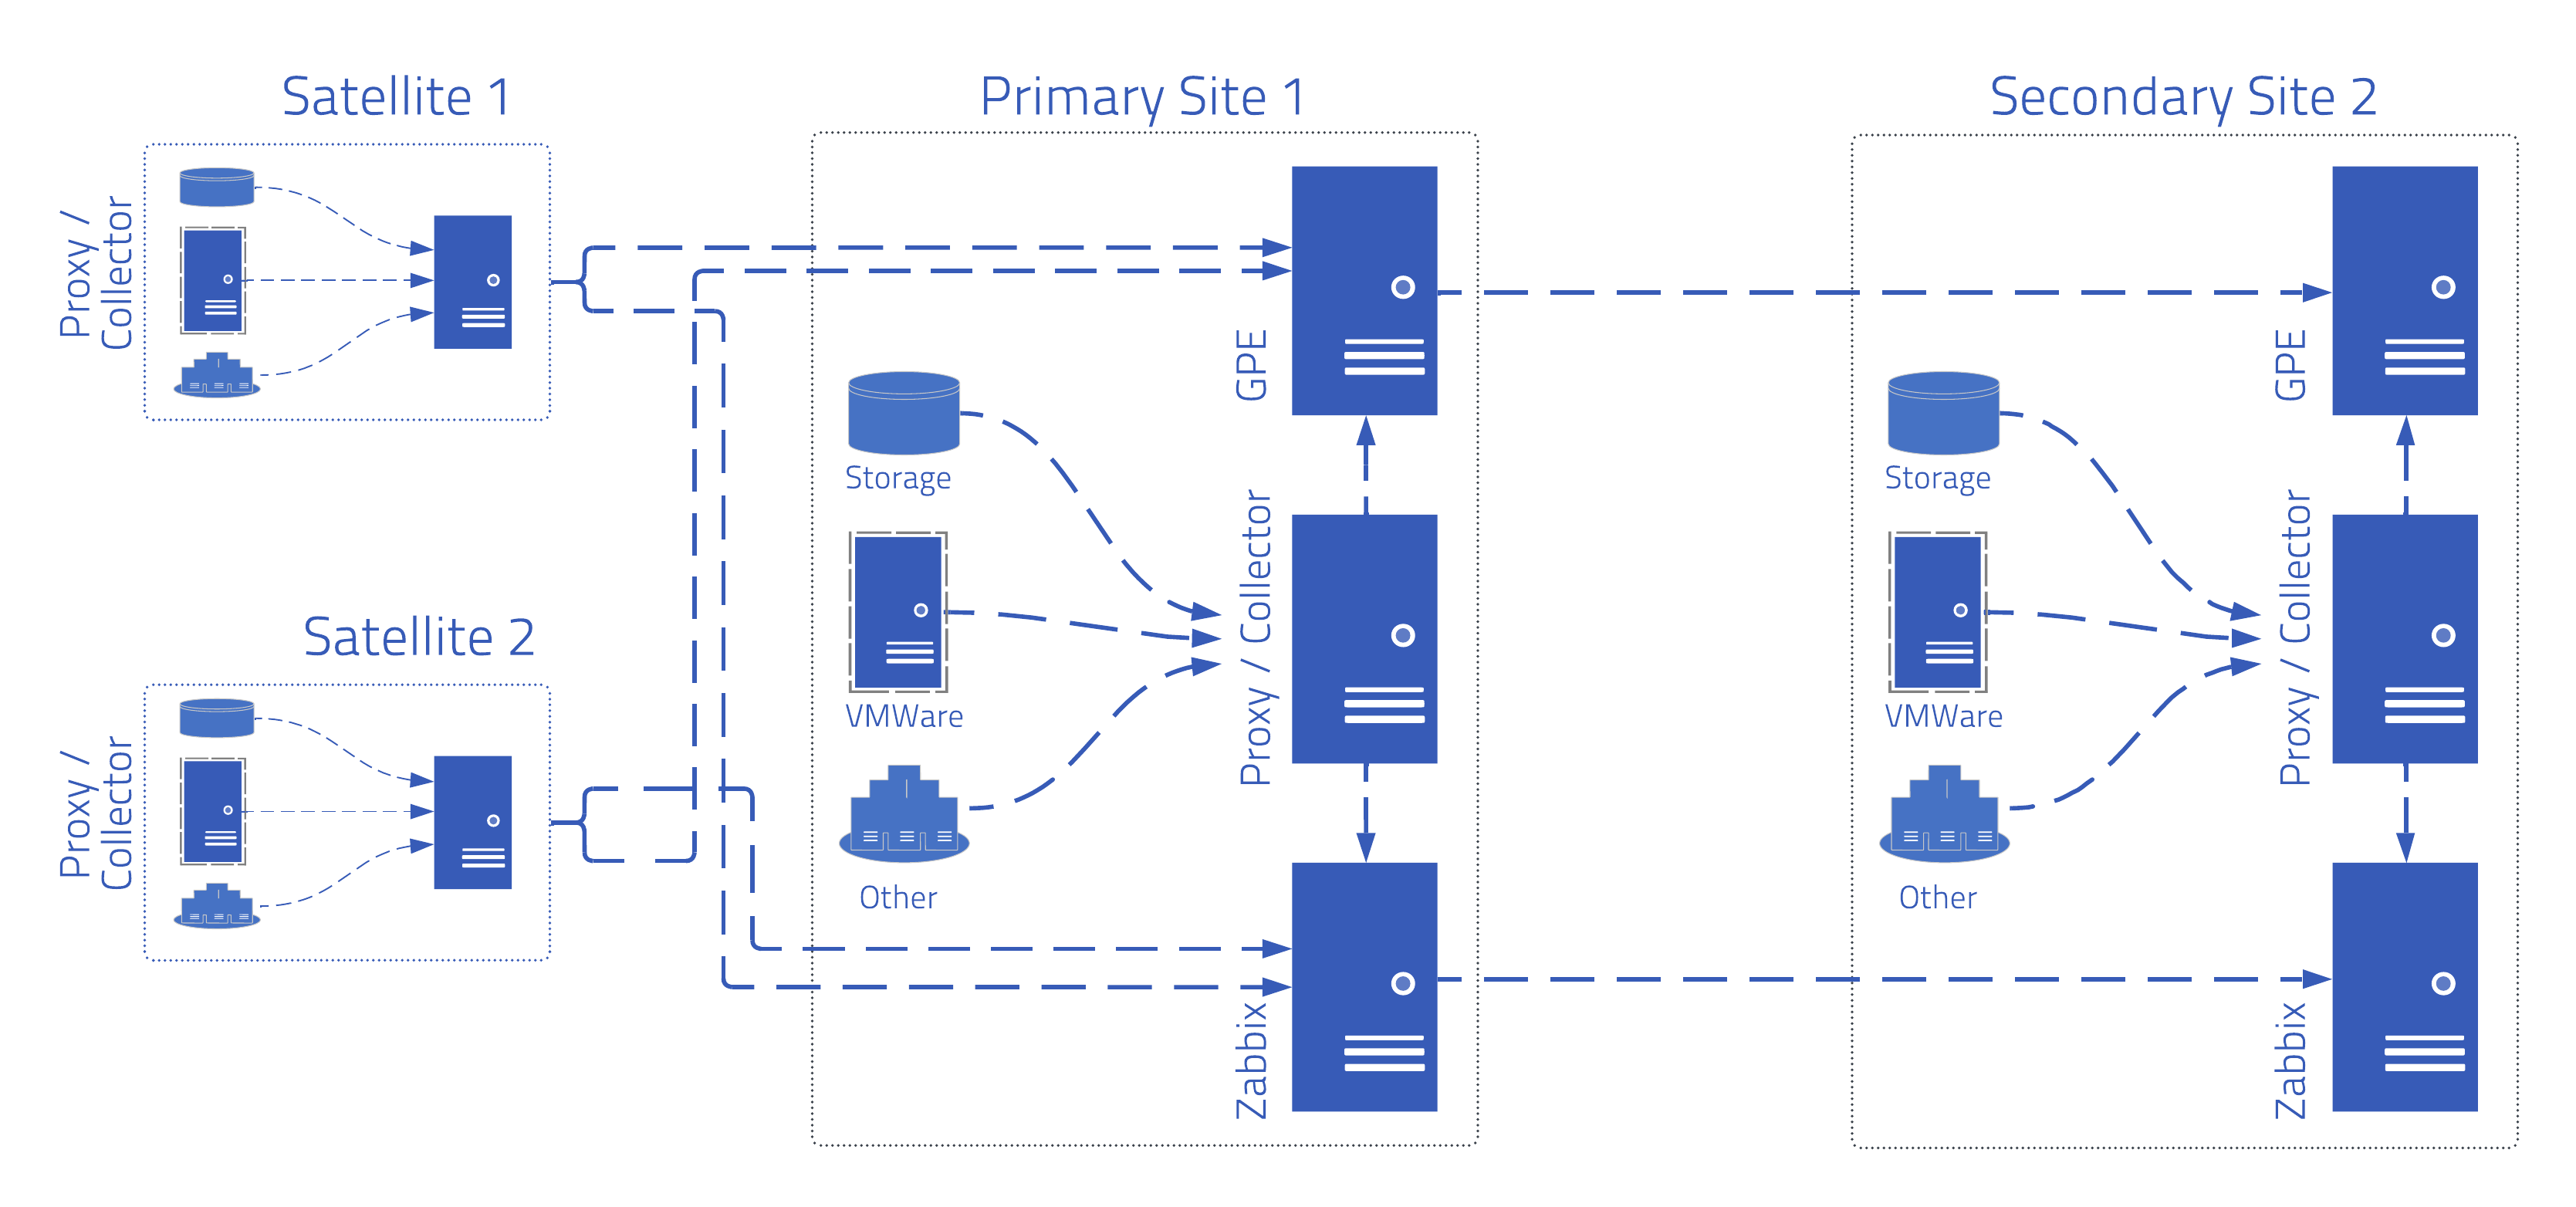
Because the agency has several different data centers of different sizes, they use a distributed proxy set up, intense SLA reporting, a ServiceNow integration, a variety of internal integrations, and a monitoring solution provided by Zabbix that includes a predictive alerting setup.

The agency has plenty of software in the mix, but it primarily relies on storage, VMWare, and Kubernetes. They also have multiple satellite offices and data centers, so that in the event of a data center failure, another can come online with minimal downtime in between.

On top of that, they have over 30 metrics and more than a trillion data points across 10 major technologies that they need to measure, primarily from a regulatory perspective. Thousands of granular metrics needed to have solutions and reporting designed for them in Zabbix, including (for example) CPU cores and frequency, processor-to-core usage metrics, and virtualization ratios from hosts to virtual machines.

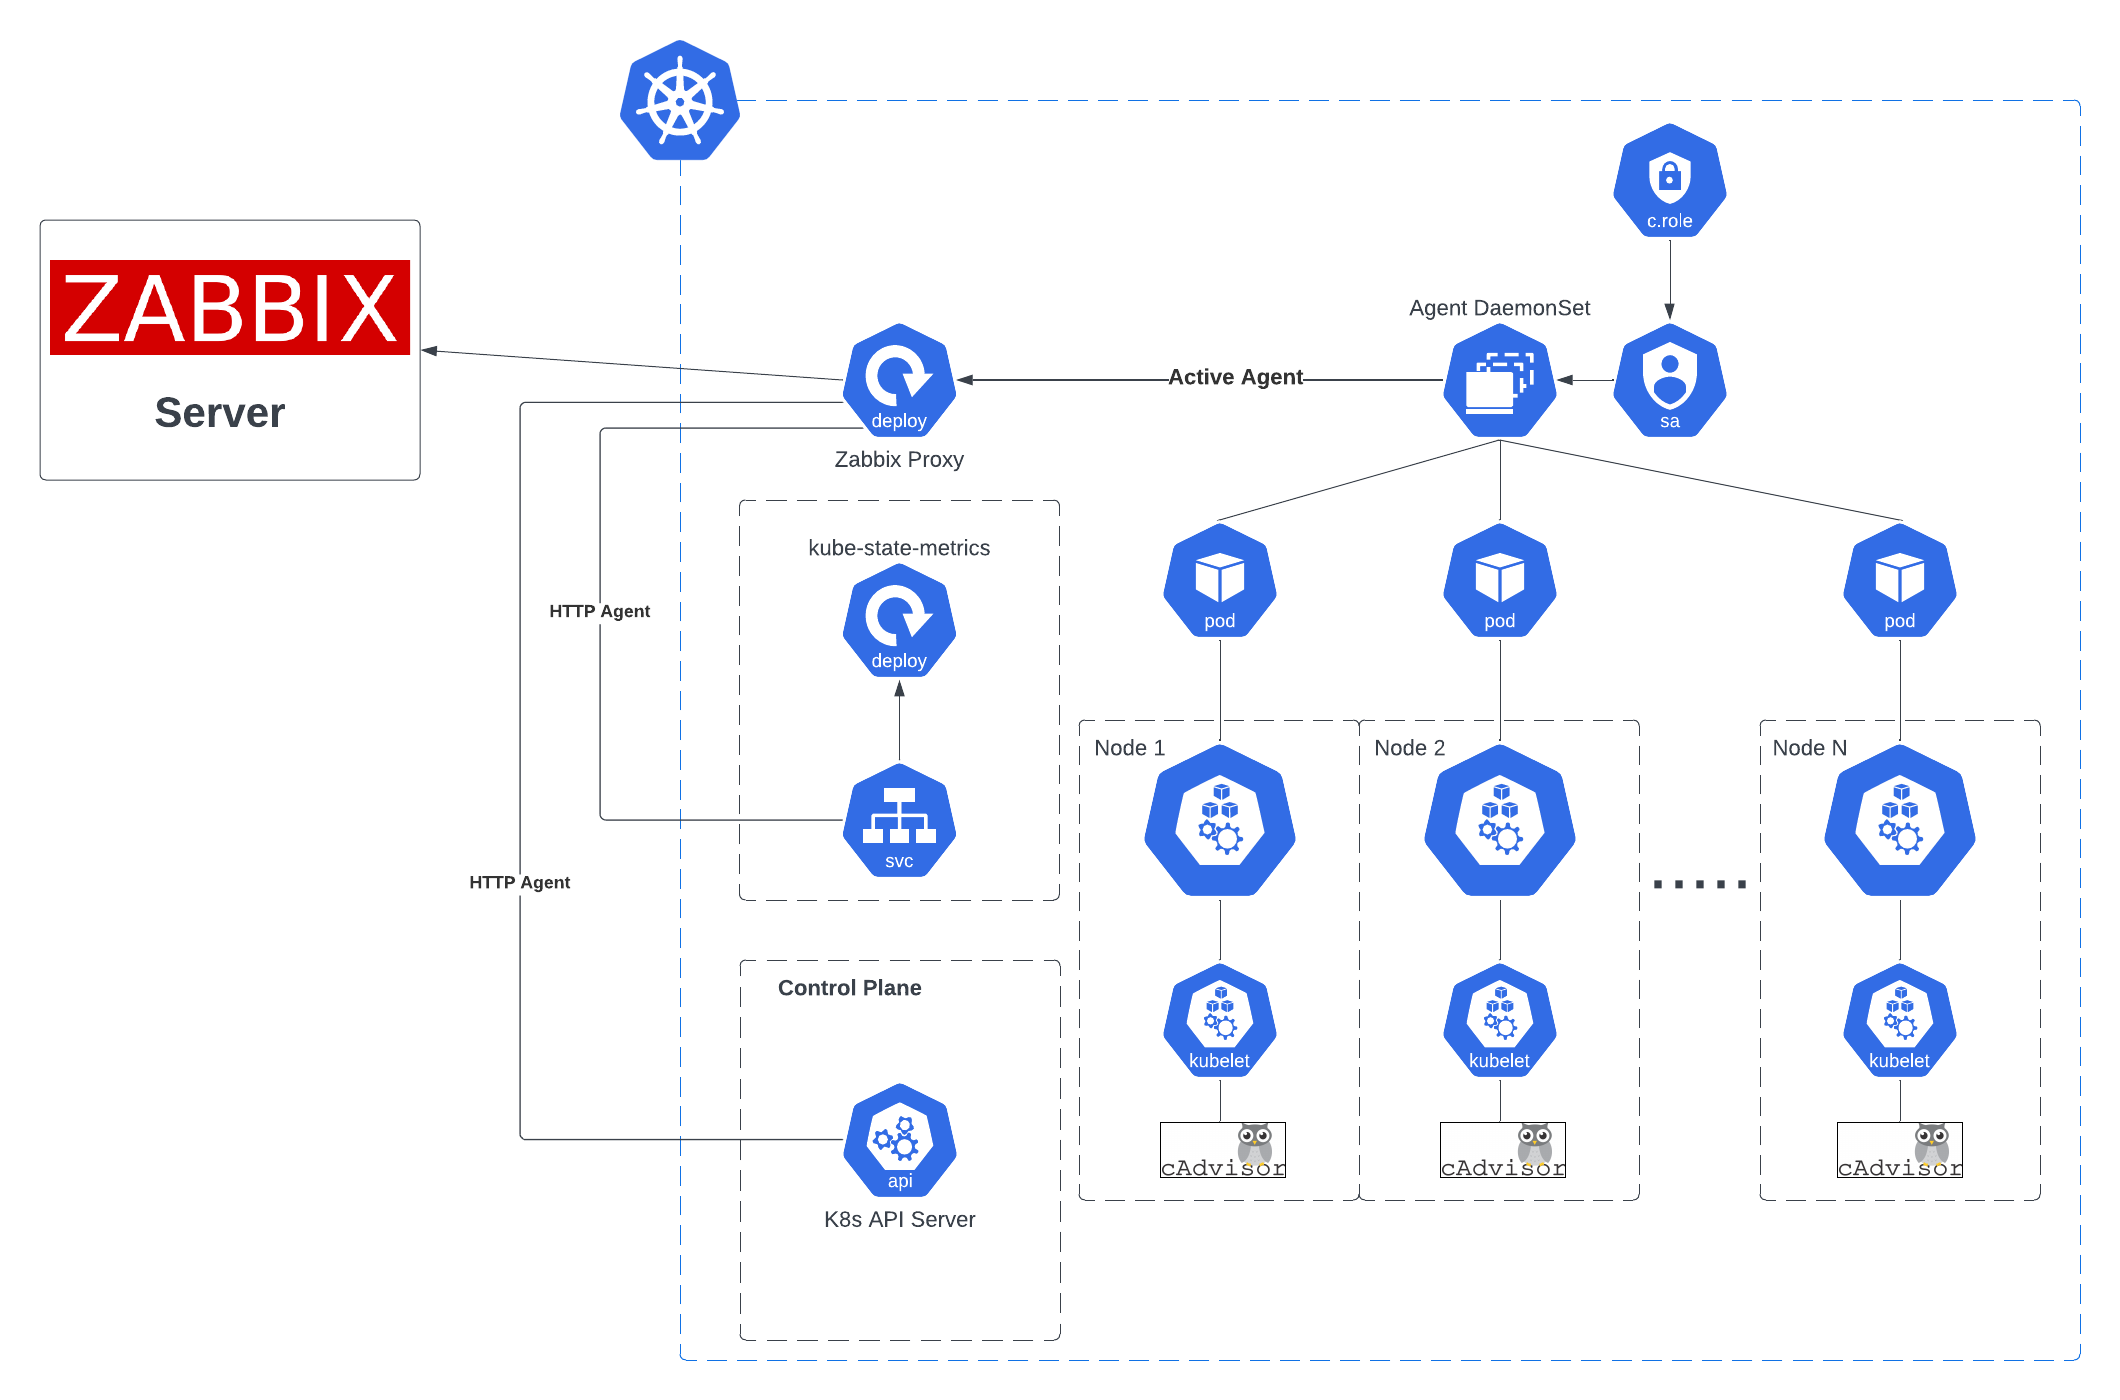
Their Kubernetes-based Openshift environment also needs to be monitored to exact specifications. Deployment took place via Helm Chart, with Zabbix components being installed as Kubernetes resources, node-level resources, and applications being monitored, while data was aggregated and sent to the Zabbix server.

Metrics are collected via the Kubernetes API and kube-state metrics, and the solution uses Prometheus-exported metrics or direct HTTP endpoint calls. When it comes to configuration, proxies and hosts are created in Zabbix to represent Kubernetes nodes and clusters, while templates and macros are configured to point to the Kubernetes API and kube-state-metrics endpoints.

The results

Thanks to Zabbix, the federal government agency in question has a solution that provides centralized monitoring of Kubernetes alongside other IT resources, supports application-specific metrics without requiring Prometheus endpoints, and offers plenty of flexibility to customize and scale.

In addition, Zabbix’s predictive alerting capabilities identify abnormalities in operational data and predictively alert the agency about anything that could potentially impact an application or service, which lets them meet SLAs, optimize user experience, and increase productivity.

In conclusion

Zabbix’s flexibility and ease of customization make it ideal for customers who need a single source of truth that can be relied on in even the most stringent regulatory environments.

To learn more about what Zabbix can do for customers in the public sector, visit us here.

The post Zabbix and a Federal Government Agency appeared first on Zabbix Blog.
Zabbix at the Netherlands Ministry of Infrastructure and Water Management

Post Syndicated from Michael Kammer original https://blog.zabbix.com/zabbix-at-the-netherlands-ministry-of-infrastructure-and-water-management/30681/

The Ministry of Infrastructure and Water Management is the Dutch ministry responsible for transport, aviation, housing policy, public works, spatial planning, land management, and water resource management. Created in 2010 following the merger of the Ministry of Transport and Water Management and the Ministry of Housing, Spatial Planning, and Environment, the ministry works to create an efficient network of roads, railways, waterways, and airways, effective water management to protect against flooding, and improved air and water quality.

The challenge:

The ministry needed a monitoring solution that could handle not only infrastructure monitoring, but also IoT devices responsible for monitoring water levels, water quality, temperature, and other data. The infrastructure components that needed to be monitored included Red Hat Satellite and Capsule servers, Red Hat Virtual Data Centers, Red Hat Identity management, Ansible automation platforms, and a wide range of custom IoT devices.

The solution:

The Red Hat Satellite and Capsule monitoring consists of one satellite, 6 server, and 15 satellite capsules for different environments, with approximately 2000 Linux machines connected to the satellite capsules. The machines retrieve their packages from the capsules and the capsules act as proxies that fetch data from the satellite servers. The capsules also manage the content packages and subscriptions for the machines.

For Red Hat satellite and Capsule monitoring, Zabbix performs capsule discovery via Low Level Discovery, which uses Http requests, which in turn collect data via the REST API. Each capsule’s content sync status is monitored and if the content sync fails, new packages are not installed. Connectivity between capsules and the satellite is also monitored by performing port checks, because capsules need to be able to connect to the satellite in order for the content to be synced.

Zabbix also discovers and monitors satellite repositories, checking both when the last sync was performed and the current sync status. Software subscriptions are also discovered and monitored and alerts are sent, with the severity of the alerts raised at the point when a subscription has only 30 days remaining.

Red Hat Virtual Data Center licences and identity management also benefit from the added flexibility that Zabbix brings to the table. Virtual DC licences must be present on ESX hosts, so situations where an ESX host with an active license has no VMS on it (or has VMS migrated to it) must be avoided, because that would mean that a license is being essentially wasted. Whenever a Zabbix trigger detects a problem, Ansible automatically attaches or detaches a licence to or from the ESX host, depending on the type of problem detected.

When it comes to Red Hat identity management, Zabbix discovers and monitors processes on the identity management platform (including identity management service status) thanks to the ability to extend Zabbix agent with user parameters.

Meanwhile, Ansible Automation Platform monitoring consists of monitoring for controllers. The Ansible Automation Platform API is used to discover the controllers, and each controller is checked to see if any jobs are running, their last seen time, their capacity, and their status. Sometimes controllers are disabled for maintenance and then re-enabled, so alerts are sent out for controllers that have been disabled for a longer time.

Ansible Automation Platform monitoring also includes monitoring decommission machines, which are assigned to a group instead of being immediately deleted. Zabbix monitors the grace period for the decommission machines and alerts users if the grace period is over, generating a warning if an Ansible host is disabled for seven days and then escalating it if the machine has been disabled for more than 14 days.

Zabbix also discovers and monitors configuration management jobs, and if a job fails it will attempt to restart it. If the issue is still not resolved, it gets escalated to the appropriate individual. These Ansible checks are primarily done via Http agents, from Zabbix servers or proxies.

Finally, in addition to infrastructure monitoring, Zabbix also monitors the health of IoT devices responsible for water levels, water quality, temperature, and other data. These devices are running Raspberry Pi modules and Zabbix Agent 2 is used to monitor the device status. Zabbix Agent 2 with a local agent database is used in cases where the agent is unable to send the metrics on these devices. Should a network outage happen, Zabbix stores the backlog data in the local agent database.

The results:

Trusting their monitoring to Zabbix has greatly improved processes at the ministry, saving time and money by making it easy to notice and fix issues before affected departments themselves were aware of them. In addition, having the latest historical data at their fingertips has been invaluable to the ministry’s technical teams during troubleshooting or when dealing with performance issues, saving everyone involved a great deal of time.

In conclusion

Zabbix’s flexible nature and its ability to integrate with popular platforms as well as custom devices made it the perfect “one-stop shop” for the ministry’s needs, consolidating all of their monitoring in a single pane of glass and giving them complete visibility into every layer of their infrastructure – while also integrating smoothly with their existing systems.

To learn more about what Zabbix can do for customers in the public sector, contact us.

The post Zabbix at the Netherlands Ministry of Infrastructure and Water Management appeared first on Zabbix Blog.
Build a Culture of Monitoring and Get Buy-In with Zabbix

Post Syndicated from Michael Kammer original https://blog.zabbix.com/build-a-culture-of-monitoring-and-get-buy-in-with-zabbix/30085/

In today’s fast-paced, interconnected IT world, simply waiting for something to fail before fixing it isn’t good enough. A proactive approach to monitoring, which aims to identify and address potential issues before they escalate into major disruptions, is a necessity rather than a luxury.

Here at Zabbix, we’ve got plenty of reason to believe that we offer the most flexible monitoring solution available on the market today. However, choosing the best monitoring tool for your organization’s needs is only half the battle – you also need to get buy-in from team members who may not understand the need for monitoring, may be fearful of and resistant to change, and may not be familiar with the technologies behind monitoring.

In this post, we’ll take a look at a few strategies you can use to help win over lukewarm or hesitant colleagues and build a culture of monitoring. We’ll also explore how choosing Zabbix for your monitoring needs can make each strategy a bit easier to implement.

Strategy 1: Explain the “why”

One of the first questions that you can anticipate during any change initiative is simply, “what for?” The ethos of “don’t fix what isn’t broken” runs strong in the tech community, and unless you go above and beyond to explain why monitoring matters, your team will remain skeptical.

Zabbix can help you make your case by providing you with the evidence you need to bolster your case. We’ve got plenty of testimonials available from tech communities worldwide (including PeerSpot, Gartner, and Capterra), and no matter what field you’re in or how big your team is, we’ve most likely got a case study or two available that shows how monitoring with Zabbix was a game changer for a company like yours.

All of this should help you explain the rationale for the change in an open and transparent way. When it comes to monitoring, sharing details on costs, expected benefits, and what will happen if no change is made will build understanding around why monitoring is necessary and why monitoring with Zabbix is the right answer for your team’s needs.

Strategy 2: Show your team what’s in it for them

One of the most effective ways to get employee buy-in for monitoring is by highlighting the benefits it will bring to individual employees. Show how monitoring can simplify their tasks, improve efficiency, and enhance their work experience, and give them concrete examples of how the technology can make their jobs easier or help them to deliver better results.

We recently had a large managed services provider (MSP) use our monitoring solution as a true “force multiplier”, allowing them to monitor their systems, automate tasks based on real-time events, and provide immediate responses to issues without manual intervention. Thanks to Zabbix, their engineers report higher job satisfaction thanks to no longer having to be “on call” at all hours to solve simple issues, while management has seen productivity skyrocket thanks to their team’s newfound ability to find potential issues before they become real problems.

Strategy 3: Turn important stakeholders into monitoring champions

Determine who monitoring will impact and who needs to be kept informed. This might be team leaders, IT staff, end users, and/or an executive sponsor. Getting input from these groups early on will help you anticipate needs and concerns, and you’ll also want to identify influential employees who are enthusiastic about monitoring and get them to help you promote it.

A great way to help them do so is by encouraging them to attend one (or more) Zabbix events – we’ve got free meetings, online meetups, regional conferences, or even our yearly Summit in Latvia. No matter where you happen to be located, there’s a pretty good chance that we’ll soon be bringing your key people a chance to network with like-minded professionals from multiple industries, expand their knowledge, get answers to their questions, and explore how Zabbix can work for them.

Strategy 4: Provide adequate training

Equipping employees with the skills and knowledge they need to get the most out of a monitoring system means gaining a solid understanding of their current capabilities and then finding out which gaps you most urgently need to fill. Chances are, you’ll need to provide guidance, documentation, hands-on demonstrations, and access to experts – and this is another area where Zabbix has you covered.

Zabbix Certified trainings are designed to help your people learn Zabbix inside and out, giving them the practical knowledge they’ll need to increase their productivity and performance. When you explore our training options, you’ll find a wide variety of courses, everything from one-day sessions that cover the basics to week-long sessions that guarantee users the ability to tackle any Zabbix challenge on their own.

In addition, we’ve got plenty of other free resources available to teams and individuals looking to upskill, including our famously active forum, blog, webinars, and newsletter.

Conclusion

Building a culture of monitoring requires commitment from every level of an organization. By choosing Zabbix as the guide to your monitoring journey and following the strategies outlined in this article, you and your team can successfully implement and maintain a robust monitoring strategy that will help you achieve your organization’s IT goals.

To learn more about what Zabbix can do for you, visit our website.

The post Build a Culture of Monitoring and Get Buy-In with Zabbix appeared first on Zabbix Blog.
The ATS Group and a Large MSP

Post Syndicated from Michael Kammer original https://blog.zabbix.com/the-ats-group-and-a-large-msp/29857/

One of the most critical clients of our Premium Partners at the ATS Group is a large MSP that acts as a service and administration platform for their own clients, providing them with hardware, software, engineers, support staff, metrics, and reporting.

The challenge

The MSP needed a stable, high-performance platform monitoring solution that would cover all the services they provided. They didn’t have the capabilities or budget to run multiple monitoring solutions – a single, flexible solution that could track every service was paramount, as was the ability to react to anomalies before they became serious problems.

After an initial trial with a different monitoring solution that was notable for poor service, a lack of integrations, no community, and almost no documentation, they took a closer look at Zabbix, thanks in large part to our focus on preventative action and automation.

The solution

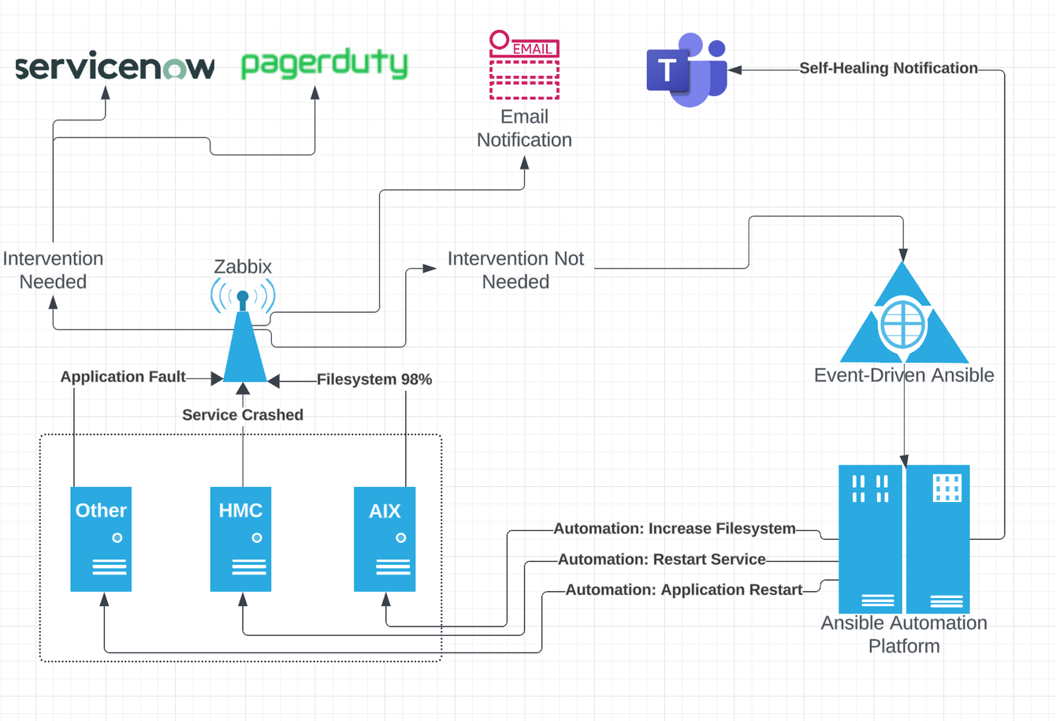
Because of their focus on performance-based monitoring, the client went with a “hot-cold” architecture and an integration with Ansible EDA, which stands for Event-Driven Ansible. It turned out to be a true “force multiplier”, as using Zabbix, Ansible, and EDA together allowed the MSP to monitor their systems, automate tasks based on real-time events, and provide immediate responses to issues without manual intervention.

The integration was designed to sort issues by whether or not they were able to be automated. If an issue arose that required human intervention, alerts could be sent to ServiceNow via multiple channels. If human intervention was unnecessary, the issue was rerouted to Event-Driven Ansible, which runs automation on all monitored hosts.

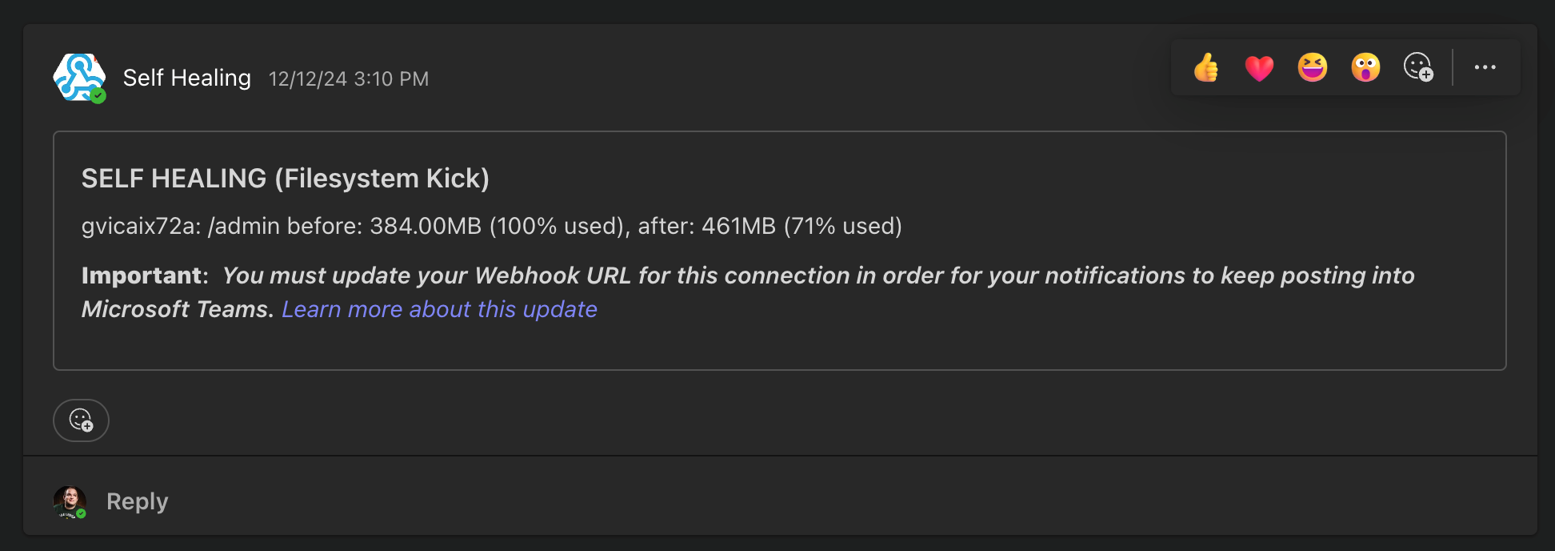
For example, with the joint Zabbix/Ansible solution, a slash admin backstage management system filling up at 2AM because of an overflowing log file for some script is no longer an urgent issue. If there are multiple gigabytes of room in the volume group, Zabbix can tell Ansible it’s a problem. Ansible can then increase the file system by 25% and send a message letting the engineers know in the morning that they took action on their behalf.

The results

With essentially no software costs and an automation integration that can find issues and fix them independently, the MSP was able to rapidly achieve a much higher service-to-spend ratio than they’d ever imagined possible.

There has been a noted increase in employee satisfaction as well – thanks to automation, engineers no longer have to be “on call” at all hours to solve simple issues, while C-level executives have seen productivity skyrocket thanks to the joint solution’s ability to find potential issues before they become real problems.

In conclusion

At Zabbix, we work hard to stay on the forefront of automation. That means constantly improving our own product while also staying on top of new technologies like Event-Driven Ansible in order to better integrate with them. To learn more about what Zabbix can do for MSPs, visit us here.

The post The ATS Group and a Large MSP appeared first on Zabbix Blog.
Building a Monitoring Dashboard: Which Metrics to Track?

Post Syndicated from Michael Kammer original https://blog.zabbix.com/building-a-monitoring-dashboard-which-metrics-to-track/29777/

A well-designed monitoring dashboard is the key to helping users process, interact with, and analyze data. Done right, it allows key decision-makers to track metrics and gain insights in an organized, easy-to-read format, while giving technical teams complete visibility into IT performance at a single glance. Done wrong, it creates information overload, with too much of everything – too many graphs, colors, widgets, and other sources of information, making it at best deceptive and at worst completely useless.

Obviously, there’s no dashboard big enough to display every possible metric for every possible stakeholder, which is why the key to making a well-organized, informative dashboard that doesn’t confuse the viewer is knowing which metrics to track. By sticking to the absolute “must haves,” you’ll make sure that users can find mission-critical information first. But how should you choose which metrics to track? We’ve put our hard-won dashboard expertise to work and identified four key metric groups that no dashboard should be considered complete without.

Global metrics

System uptime and availability. Availability is one of the most important metrics you can use to determine your network’s performance, because it’s a metric that everyone can see the effects of immediately. For a business, it’s critical when it comes to making sure that the services provided to users are consistently available.

Overall resource utilization (CPU, memory, disk storage, etc.). Think of tracking resource utilization like keeping tabs on your phone’s battery life. You need to track CPU, memory, disk storage, and network usage to keep everything running smoothly. Keeping an eye on those metrics will help you fix small issues before they turn into gigantic problems.

Top critical issues or alerts. Speaking of problems, they can and will happen – and when they do, you’ll naturally want to know about them as soon as possible. An alert can be as simple as a notification of a system update, or it can draw attention to an unusual spike in errors. It could also call attention to a major emergency that demands immediate attention. Either way, no effective dashboard is complete without them.

SLA compliance status. If you’re running a business, monitoring SLA compliance status lets you see service availability and performance, which in turn guarantee customer satisfaction. It allows for quick detection of issues, making proactive management and resolution possible before customers feel any impact.

Infrastructure metrics

Server performance (CPU, RAM, disk I/O). Tracking the response time, central processing unit (CPU) utilization, memory consumption, and network bandwidth of a server helps guarantee a functional user experience. It involves keeping an eye on CPU and RAM utilization, disk I/O (input and output operations involving a physical disk), plus a variety of other sub-metrics.

Application health. Monitoring application health involves collecting, analyzing, and interpreting data about an application’s performance, availability, and behavior. It’s mission-critical because it can help you detect and troubleshoot problems, optimize resource utilization, and provide the application’s users with the quality experience they expect.

Storage usage and trends. Keeping track of storage usage on your dashboard gives you a real-time view of storage metrics as well as predictive analytics (useful for capacity planning) and proactive issue detection, across on-premise and cloud storage environments. Like so many other monitored metrics, its purpose is to maintain optimal storage performance while preventing potential issues before they impact any business operations.

Database performance metrics. Basically, database monitoring is how you measure what you want to improve. It’s what you do before you start performance tuning. Keeping track of your database on your dashboard makes this possible by collecting performance metrics, so that you’re always aware of whether your database can fully support your applications and respond quickly to queries.

Network metrics

Bandwidth utilization and traffic patterns. Bandwidth refers to the maximum data transmission rate on a network at a particular time. Having this metric on your dashboard will let you easily track the amount of bandwidth your network is using and make you immediately aware if you run over the bandwidth threshold.

Latency and packet loss. Latency, or network delay, is a network performance metric that measures the amount of time it takes to transfer data from one destination to another. Consistent delays or unusual spikes in delay time usually mean that you have a major network performance issue. Tracking latency and packet loss on your dashboard will let you know if data transfers are taking too long, while also helping you make sure that any lost data packets get to their destinations.

Interface status and error rates. A network interface can be either networking hardware or a software interface. Monitoring them on your dashboard lets you see each and every network device, and tracking their performance is important when it comes time to identify the root causes of poor performance and network bottlenecks.

Firewall and VPN tunnel status. Monitoring the status of Firewalls and VPN tunnels is important because (among other things) it keeps you aware of whether your VPN tunnel interface is up and available for passing traffic, and whether the destination IP address being monitored is reachable. At the same time, you’ll also have access to real-time information about how your firewall is working, which will keep you aware of any security holes or incorrect settings before they become major problems.

Security metrics

Unauthorized access attempts. Unauthorized access is a big risk to businesses, jeopardizing sensitive data and disrupting operations. You can track attempts by unauthorized users to gain access to any website, server, device, or app by monitoring user activity on your dashboard. This data can also be labeled and sorted so that you can easily interpret it at a glance.

Endpoint security status (AV, patching). Endpoints are basically any devices that connect to networks, including laptops, mobile phones, and IoT devices. The more of them you have, the greater your chances of data loss and cyber threat entry. Monitoring the critical junctures of endpoints on your dashboard will help you identify and prevent threats while making sure that you have quick response measures in place to protect your data and systems.

Compliance and audit logs. Compliance and audit logs are there to make sure errors are noticed and fixed, keep you compliant with regulatory requirements, improve business security, and detect fraud. Monitor them on your dashboard, and you’ll have real-time visibility into your compliance posture as well as immediate alerts when a potential violation is detected.

Active security alerts or anomalies. Continuously keeping an eye on your systems and network lets you detect threats (anything from malware to abnormal activities and unauthorized access) before they escalate and cause real damage. In turn, this helps you maintain user trust, avoid downtime, and comply with data security regulations.

These metrics should give any dashboard a solid foundation that can be easily customized to meet specific business or operational goals.

The Zabbix Advantage

One of Zabbix’s most important features has always been our easily customizable dashboards, which allow users to see and analyze even the most complex monitoring data at a single glance. When it’s time to keep tabs on the essential metrics we identified above, Zabbix dashboards allow anyone (or any infrastructure team) to efficiently monitor network performance, manage resource usage, and guarantee device/application availability.

Zabbix’s graphing and visualization features make it easy to see historical trends and make comparisons. You can choose whatever visualization format is best for a particular set of data, including line graphs, bar charts, pie charts, gauges, and more. Not only that, Zabbix dashboard widgets can communicate with each other, serve as data sources for other widgets, and dynamically update the information they display based on the data source.

To learn more about the flexibility of Zabbix dashboards and see how they can help you track just about any metric imaginable, contact us.

The post Building a Monitoring Dashboard: Which Metrics to Track? appeared first on Zabbix Blog.
NIS2 Requirement Support: The Zabbix Advantage

Post Syndicated from Michael Kammer original https://blog.zabbix.com/nis2-requirement-support-the-zabbix-advantage/29743/

In order to stay on top of a constantly-evolving cybersecurity landscape, the European Union has made the Network and Information Security (NIS2) Directive the cornerstone of their efforts to guarantee a uniform level of cybersecurity across all member states.

Introduced in 2020 and coming into effect on January 16, 2023, the NIS2 Directive is a continuation and expansion of NIS, the previous EU cybersecurity directive. NIS2 strengthens NIS, expands its scope, and introduces new requirements to help protect vital infrastructure, critical services, and key sectors from cyber threats.

In this post, we’ll go into detail about 8 key NIS2 requirements and see how Zabbix can help organizations meet each one.

NIS2 Requirement 1: Analyze risks and provide information system security.

Zabbix is set up to detect anomalies, suspicious activities, resource overload, downtime, and many other “red flags.” It can also monitor bandwidth usage and network interface metrics, and track the integrity of important files, including password and configuration files.

Monitoring critical services that prevent potential attacks (such as firewalls) is simple and intuitive, as is checking for open ports and insecure webpages. Not only that, Zabbix can track sensors in data centers to detect any physical security breaches and set up a customized alerting workflow for specific events.

NIS2 Requirement 2: Have procedures in place to handle security incidents as they arise.

Zabbix can provide real-time monitoring and alert users to potential incidents, keep a comprehensive log history for root cause analysis, and support multiple notification channels and scenarios for incident reporting. It can also share real-time incident data with external systems (via integrations or APIs) and display custom dashboards and reports about ongoing incidents.

NIS2 Requirement 3: Have backup management, disaster recovery, and crisis management plans in place to provide business continuity.

Zabbix supports Veeam (OOB) and Bacula data platforms, as well as many others. It can also monitor the backup execution process while tracking the storage and usage of backup servers.

NIS2 Requirement 4: Maintain supply chain security, including security-related aspects concerning the relationships between each entity and its direct suppliers or service providers.

Zabbix users can easily monitor third-party services and dependencies (such as APIs or libraries) for availability and performance, while being alerted to any potential vulnerabilities or disruptions in supply chain services. What’s more, Zabbix can also handle service monitoring and SLA reporting, keeping users updated around the clock on progress against predefined SLAs.

NIS2 Requirement 5: Provide security in network and information systems acquisition, development, and maintenance – including vulnerability handling and disclosure.

With Zabbix, a user can easily track software versions and check for outdated components, thanks to Zabbix’s ability to integrate with external tools for checking vulnerabilities.

NIS2 Requirement 6: Have policies and procedures in place regarding the use of cryptography and encryption.

Zabbix makes it simple for organizations of any size to comprehensively monitor encryption certificates for expiration.

NIS2 Requirement 7: Maintain HR security by providing accessible control and asset management policies.

Zabbix allows organizations to quickly and easily monitor user actions via log files.

NIS2 Requirement 8: Implement multi-factor authentication (MFA) or continuous authentication solutions, secured voice, video and text communications, and secured emergency communication systems.

Zabbix is set up to monitor the performance and uptime of any identity provider (IdP), using APIs provided by the IdPs themselves to query MFA policies and user login events. Zabbix can also monitor logs for MFA-related events while providing custom dashboards and reports on MFA usage.

In conclusion:

NIS2 is reshaping the cybersecurity landscape, and Zabbix has what it takes to equip organizations with the knowledge they need to thrive in this new regulatory environment. Trusting your monitoring to Zabbix can enhance your overall cybersecurity posture and supporting a comprehensive NIS2 implementation strategy.

To learn more, visit our website.

The post NIS2 Requirement Support: The Zabbix Advantage appeared first on Zabbix Blog.
Using Frontend Scripts to the Max with Rick van der Ploeg

Post Syndicated from Michael Kammer original https://blog.zabbix.com/using-frontend-scripts-to-the-max-with-rick-van-der-ploeg/29668/

Zabbix Conference Benelux 2025 is right around the corner, which means that it’s time for another interview with a Conference presenter. This week, we’re talking to Rick van der Ploeg, a Zabbix consultant and expert at Opensource ICT Solutions. We asked him about the road that led him to Zabbix and how frontend scripts can open the door to enhanced Zabbix functionality.

Please tell us a bit about yourself and the journey that led you to Zabbix.

I’m a Zabbix consultant at OICTS. During my time as a DevOps engineer for an MSP, my team was tasked with implementing a monitoring solution for our customers’ network equipment. We successfully integrated Zabbix and never looked back. Since then, I have gained extensive experience with Zabbix, and I recently even became a certified Zabbix Expert.

How long have you been using Zabbix? What kind of Zabbix-related tasks do you take care of on a daily basis?

I’ve been working with Zabbix for over five years now. The first version I used was 4.4, and a lot has changed since then! As a Zabbix consultant, my main role is advising on and implementing Zabbix solutions for our customers. This means anything from building custom templates to installing and managing complete monitoring environments.

Can you drop a couple of hints about what we can expect from your conference presentation?

I’ll be talking about different ways to utilize frontend scripts in Zabbix, and I’ll also showcase some relevant examples of how scripts can enhance Zabbix’s functionality.

How did you decide on the topic of Zabbix and frontend scripts? Was there a specific catalyst or event that led you to this topic?

What I love about frontend scripts is their ability to extend Zabbix’s functionality to almost anything you can think of. Over the years, I’ve developed several solutions that have significantly increased the value and efficiency of the Zabbix installations I’ve worked on.
I’ve noticed that many people are still unaware of the power and possibilities that frontend scripts offer, so I figured this would be a great topic to talk about.

What makes Zabbix especially well-suited for frontend scripts?

For me, the best thing about frontend scripts in Zabbix is that you can use data from Zabbix as input for your scripts. This flexibility allows you to create simple yet powerful scripts that can be easily used by any type of Zabbix user.

The post Using Frontend Scripts to the Max with Rick van der Ploeg appeared first on Zabbix Blog.
The ATS Group and a Regional Telecom Provider

Post Syndicated from Michael Kammer original https://blog.zabbix.com/the-ats-group-and-a-regional-telecom-provider/29671/

Our Premium Partners at the ATS Group have a regional telecom provider on the West Coast of the United States as one of their key clients. The provider covers a massive geographical area on a limited budget and serves thousands of (primarily rural) customers.

The Challenge

After recent price hikes by the “big-box” monitoring solutions, the provider needed an alternative with a more stable pricing model. Simply put, their budget was shrinking, but their software monitoring costs were expanding.

The provider had a large stock of non-traditional IT equipment that all needed to be monitored effectively, and they also had only one month to get all monitored devices and endpoints over to a new solution.

On top of that, many of the provider’s legacy systems were directly related to regulatory compliance and therefore needed to be operational from day one.

The Solution

The provider set about migrating to a complete and robust Zabbix 7.0 solution that would eliminate any foreseeable issues – even the loss of an entire data center.

There were a few initial hiccups in the implementation when it came to getting PostgreSQL set up with database proxies, but the ATS Group team quickly arrived at an architecture that the provider was happy with. The clear and easy-to-follow Zabbix documentation was of particular help.

The Results

The new Zabbix solution, as implemented, was able to monitor a number of things that had previously been challenging, including:

• Doors. The provider badly needed a solution for monitoring doors, including entrance and exit doors as well as cabinet doors in data centers. They had long-term compliance issues with doors sticking open, employees forgetting to close doors, etc. Zabbix made it easy to develop custom SNMP traps that send alerts in case of open doors, solving the issue.

• Weather. The provider’s services are available over a large and varied geographical area that encompasses multiple states. The ability of Zabbix to predict weather changes across this area has been an important added bonus, with the provider now being able to get future weather alerts that can be used to compare against equipment tolerance levels. Personnel can then be sent to affected areas in anticipation of weather events, instead of being purely reactive.

• SLAs. The provider functions as an ISP that provides internet access to customers in rural areas, many of whom may not have other means of accessing the world around them. As such, they not only feel a strong sense of duty to provide consistent uptime, but they are bound by a strict set of service level agreements (SLAs). With Zabbix, it’s possible to provide SLAs for some of the remote edge equipment involved by building an integration with ServiceNow.

In conclusion

The telecom provider in question trusts Zabbix to guarantee rural broadband access for thousands of customers over an enormous geographic area. Zabbix not only gets the job done more effectively than other monitoring solutions, it does so at a fraction of the cost.

The post The ATS Group and a Regional Telecom Provider appeared first on Zabbix Blog.
Feeding Zabbix MQTT Data with Ivo Schooneman

Post Syndicated from Michael Kammer original https://blog.zabbix.com/feeding-zabbix-mqtt-data-with-ivo-schooneman/29650/

This year’s Zabbix Conference Benelux is rapidly approaching, and to whet our audience’s appetite we sat down for a short interview with one of the conference’s featured presenters. Open Source Consultant Ivo Schooneman works for our Certified Partner Xifeo ICT B.V., and we quizzed him about how he got started in the open-source movement, what led him down the path to Zabbix, and how he sees Zabbix and MQTT (Message Queuing Telemetry Transport) fitting into a new world of connected and smart devices.

Please tell us a bit about yourself and how you got to this point in your career.

I started using Linux and open-source software in the mid-1990s, building my own home server for email, a website, and a firewall. After my internship in a Linux team, I got a job offer that I accepted. From there I became a consultant, helping small companies to build their servers. Eventually, I moved to a bigger company to offer consultancy services to banks, telecom providers, television stations, and streaming providers.

When you work in a company with a lot of open source enthusiasts, you hear a lot about new products and keep growing to make the environment for your customers better every day. I completed a lot of certifications and training courses – AWS, RHCA, Python, and many more. At some point, I wanted to move on, so I joined Xifeo, where I got the boost I needed to specialize in Zabbix.

How long have you been using Zabbix? What kind of Zabbix-related tasks do you and your team get involved in daily?

I’ve been using Zabbix for about 4 years. When I joined Xifeo in 2022, I took the opportunity to give myself a boost by gaining my Zabbix Certified User, Zabbix Certified Specialist, and Zabbix Certified Professional certifications. I’ve grown to trust it so much that even my home network is monitored with Zabbix!

Can you give us a few clues about what we can expect to hear during your presentation at Zabbix Conference Benelux?

I will talk about the history of MQTT, where it started, how it works with pub/sub, and talk about some scenarios where it could be used – there are always other options. At that point we will take a look at the plugin configuration and see how to split your different subscriptions to multiple topics and servers.

In your experience, does Zabbix lend itself easily to the IoT generally and MQTT data specifically?

I never feel like it’s necessary to have the color of my lights in Zabbix, but the power usage of my appliances, temperatures, particular matter in my rooms, that’s data you can monitor and alert on! MQTT is a great and easy way to do that, as writing API calls for every device would be very time consuming.

What changes do you think MQTT data and the IoT will bring to the world of monitoring over the next decade or so?

With more and more devices capable of measuring different things, we can gather more data than ever before. As the prices of sensors keep dropping, we can measure about anything we want on any place you want. By using a standard protocol, such as MQTT, you will have a uniform way of handling the data. IoT will help us save power and make life easier!

The post Feeding Zabbix MQTT Data with Ivo Schooneman appeared first on Zabbix Blog.

Change is the Only Constant: 2024 in Review

Post Syndicated from Michael Kammer original https://blog.zabbix.com/change-is-the-only-constant-2024-in-review/29528/

Time waits for no one, and as impossible as it may seem, one of the most consequential years in the history of Zabbix is already in the books. You can be forgiven for feeling at times like we were trying to cram a decade of events into a single year, which is why we’ve prepared this handy look back at the highlights of 2024 – just in case there’s anything you were too busy to notice as it happened!

Re-imagining the product

One of the year’s unquestioned highlights was the long-awaited release of Zabbix Cloud on October 1. As our first new product release since the creation of Zabbix, Zabbix Cloud is designed to provide the Zabbix features our community members know and love, but with easier deployment and management as well as automatic upgrades and easier scalability.

To celebrate the release itself, we held a release party at our Riga HQ with members of our global community who were in town for Zabbix Summit 2024, which kicked off a few days later. The release definitely got our community talking – the level of interest in this new “portable” version of Zabbix exceeded even our highest expectations.

Our team also released Zabbix 7.0 LTS on June 4, packed full of improvements and upgrades that our users have been asking for, including upgraded performance and scalability, new ways to visualize data, faster network discovery speed, and more. We followed that in December with the release of Zabbix 7.2, which added improved monitoring features and workflows as well as a host of new templates.

It can’t be stressed enough – all these new products, innovations, and updates were the result of feedback and suggestions from our global community. We listen, we learn, and we take your ideas to heart!

Security first

In 2024, Zabbix transitioned to the ISO/IEC 27001:2022 certification, with an extended scope to cover Zabbix Cloud. This milestone also includes compliance with ISO/IEC 27017:2015, further enhancing cloud-specific security controls.

Meanwhile, the HackerOne bug bounty program continues to be a success. 2024 brought us 33 valid submissions, and we paid $35,000 in bounties. Out of those, we have already fixed and published 24 vulnerabilities for source code.

The Zabbix CVE (Common Vulnerabilities and Exposures) program and processes are also continuing to mature. Recently, an audit was performed against our organization’s CVE submission for 40 submissions in the NIST NVD (National Vulnerability Database). Not only did we pass the audit and gain contributor status, but Zabbix is currently the only CVE Numbering Authorities (CNA) in Latvia.

Making our presence felt

Our community members piled up the frequent flier miles as we traveled the globe to keep in touch with our ever-expanding community and win over new converts. The events we took part in this year included the following:

• 31 meetings (with first-time visits to many destinations in North America)
• 1 forum in Mexico City
• 18 meetups (both online and in a variety of global locations)
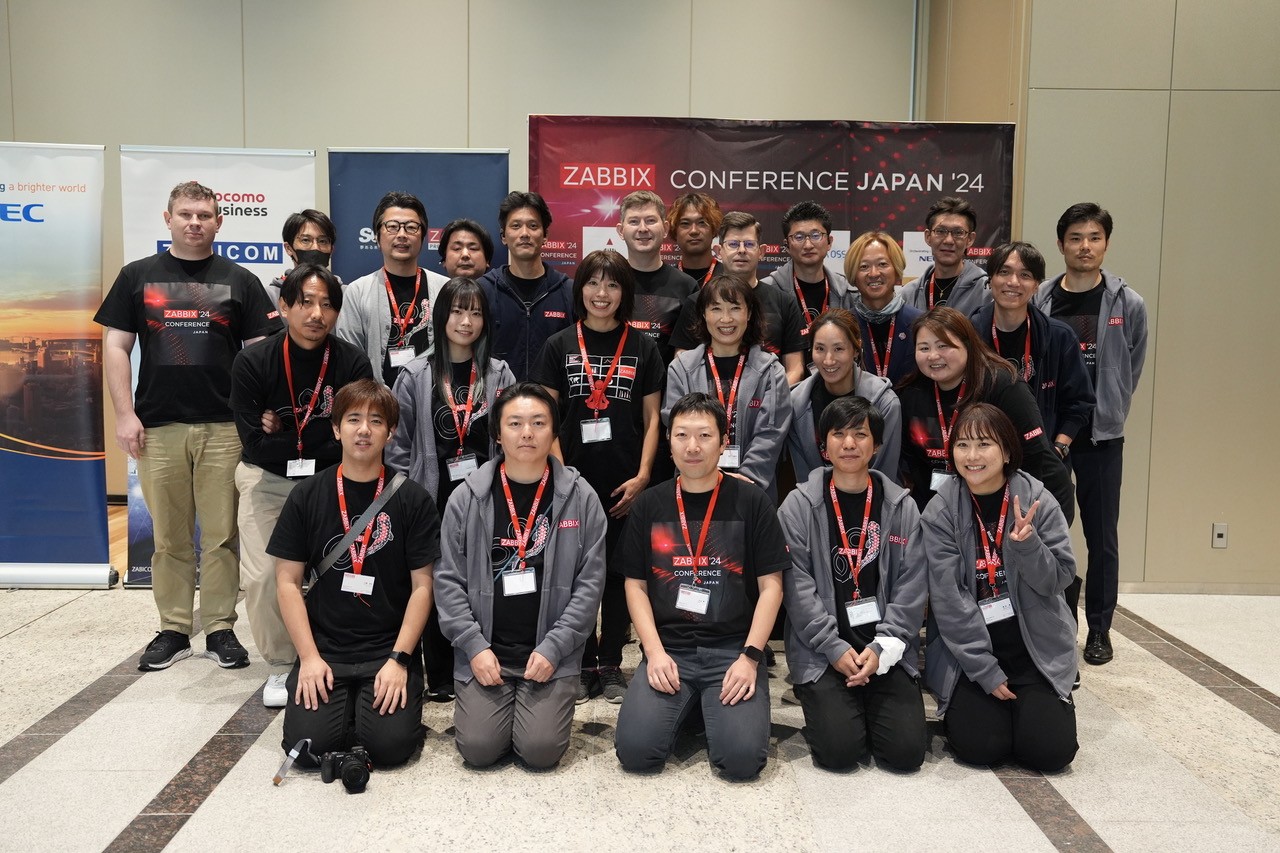
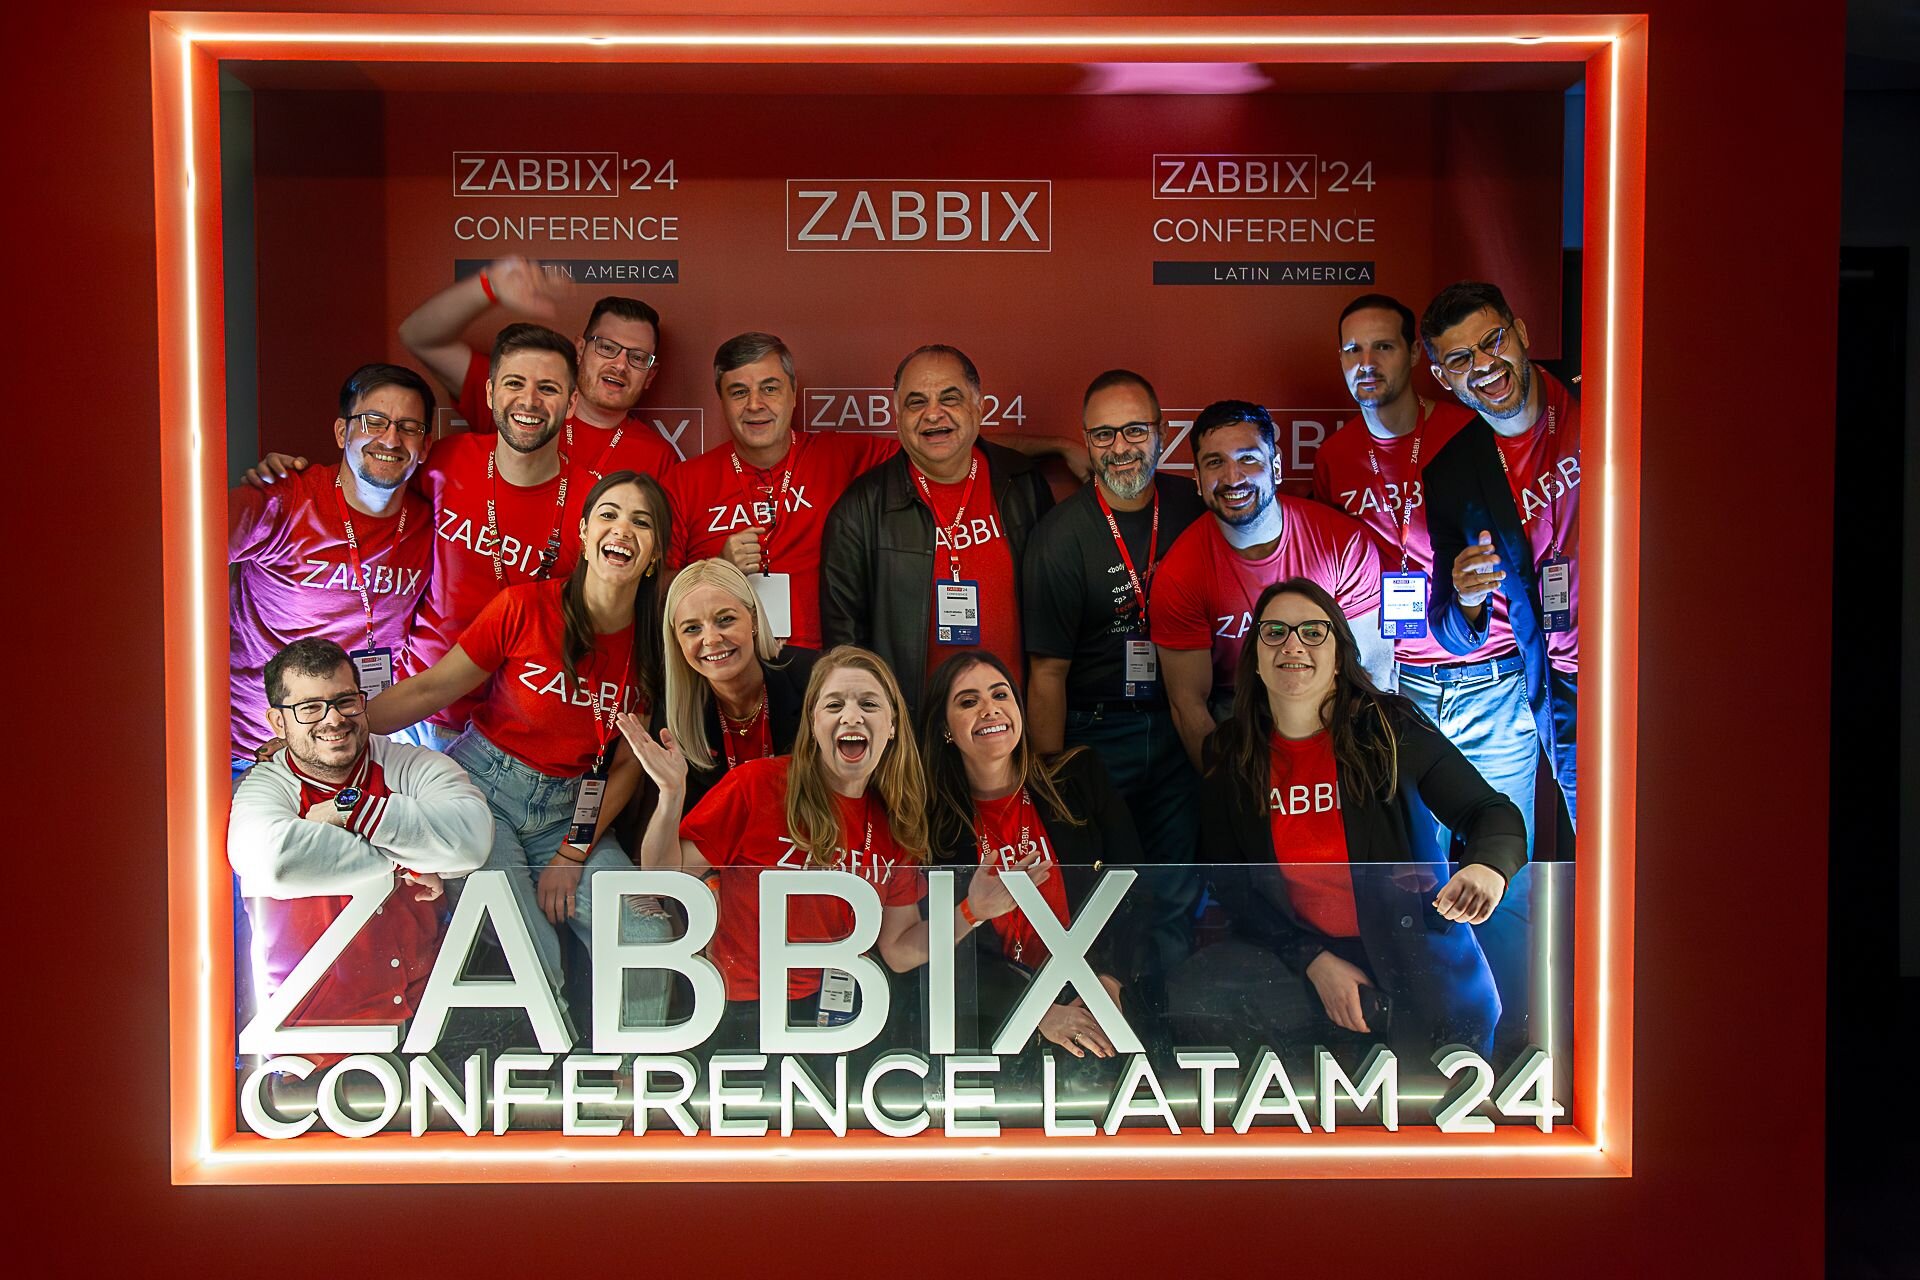
• 4 conferences (Benelux, China, Japan, and Latin America)
• Far too many exhibitions, trade fairs, and expos to list conveniently
• One extremely successful Zabbix Summit in Riga

“The long hours and even longer flights really paid off, as this year was our most successful yet in terms of new business. The events we held in North America were especially helpful in terms of breaking new ground. We understood that we have an amazing Zabbix community in the United States and a much bigger market to work with.” – Ronalds Sulcs, Zabbix Head of Sales

A year of continuous growth

2024 saw us add new team members in every location we operate in, while also recruiting remote workers from nearly every corner of the globe. All told, the team grew by 30 people, which means we are now almost 200 strong! Meanwhile, the Partners team was also operating at full throttle, adding 12 new highly-skilled Certified Partners and 16 Resellers in locations from Australia to Morocco. All partners and resellers were chosen for their unique blend of experience and expertise, and we’re confident that they’ll provide best-in-class knowledge where it’s needed most.

The fact that we’ve managed to build on our status as an employer of choice across three continents while adding an ever-increasing number of quality partners in every corner of the globe speaks to the hard work and competence of our colleagues as well as the quality of the products and services we provide. Congratulations to everyone who did their part to make sure we continue to add talent and expertise!

Giving back

2024 was an exceptionally successful year in terms of bringing our products and services to the world, but we’re proud of the fact that we also managed to export our values of openness, transparency, and a desire to give back to the communities we live and work in. This took multiple forms throughout the year:

• The LatAm team worked with the DEDICA Foundation – Foundation for Digital Development and Open Knowledge to create the Zabbix Innova Challenge. The challenge is designed to encourage creativity and stimulate technological development in local communities through a Hackathon and other activities, with the goal of introducing Zabbix to a new generation of tech talent.
• In December, we made a generous donation to Pārtikas banka “Paēdušai Latvijai” (Food Bank “For a Full Latvia”) in support of their mission of getting nutritious food to communities in need. We also gave to support Bērnu slimnīcas fonds, Latvijas Bērnu fonds, Autisma atbalsta punkts, and Ziedot.lv – all with the goal of supporting children’s health, while our employees in the Riga office prepared gifts for senior citizens at the Rīga Social Care Center Mežciems as part of the “Eņģeļa pasts (Angel’s Mail)” charity project, Santa’s Workshop.
• The end of the year also saw us contribute €50,000 to Dod pieci!, the Latvian charity marathon organized by Latvijas Radio, Latvijas Televīzija, LSM.lv, and Ziedot.lv. The marathon helps make life-saving cancer treatment more affordable.

It’s been our experience that making a difference and donating to good causes reinforces a shared commitment to the company as well as to each other. We’d like to thank and congratulate everyone who took part in our outreach efforts over the past year!

Getting noticed

The news about what we got up to in 2024 seemed to be everywhere, as tech journals, newspapers, and global organizations showered us with positive publicity. At Interop Tokyo 2024, the Zabbix Japan team picked up the prestigious “Best of Show” Grand Prize in the Management and Monitoring category for the Zabbix 7.0 LTS release. The award is granted by a jury made up of some of the world’s most knowledgeable IT and monitoring experts, so recognition was truly an honor.

In Latin America, Milenio published a profile of our CEO and Founder Alexei Vladishev that brought the Zabbix story to thousands of new readers, while Mexico’s Encuentro Vidal marked the occasion of Zabbix Conference Mexico in November with a look at how Zabbix is helping countries in the region on their journey to digital transformation.

Globo published a well-written and informative piece that explored how the Brazilian city of Extrema has been investing in new technologies (with Zabbix prominent among them) in order to better serve the population of the city and make its administration more efficient and transparent.

Carrying our momentum into 2025

As 2025 gets underway, remember to stay on top of Zabbix news by following us on social media, reading our blog, and checking our forum.

“2024 was an eventful year that was full of excitement, growth, and change. It was the year we made Zabbix Cloud a reality, and a true milestone in the growth of our company and our community. I’m sure that everyone in the Zabbix family is excited to see what our 20th Anniversary year of 2025 will bring!” – Alexei Vladishev, Zabbix Founder and CEO


The post Change is the Only Constant: 2024 in Review appeared first on Zabbix Blog.
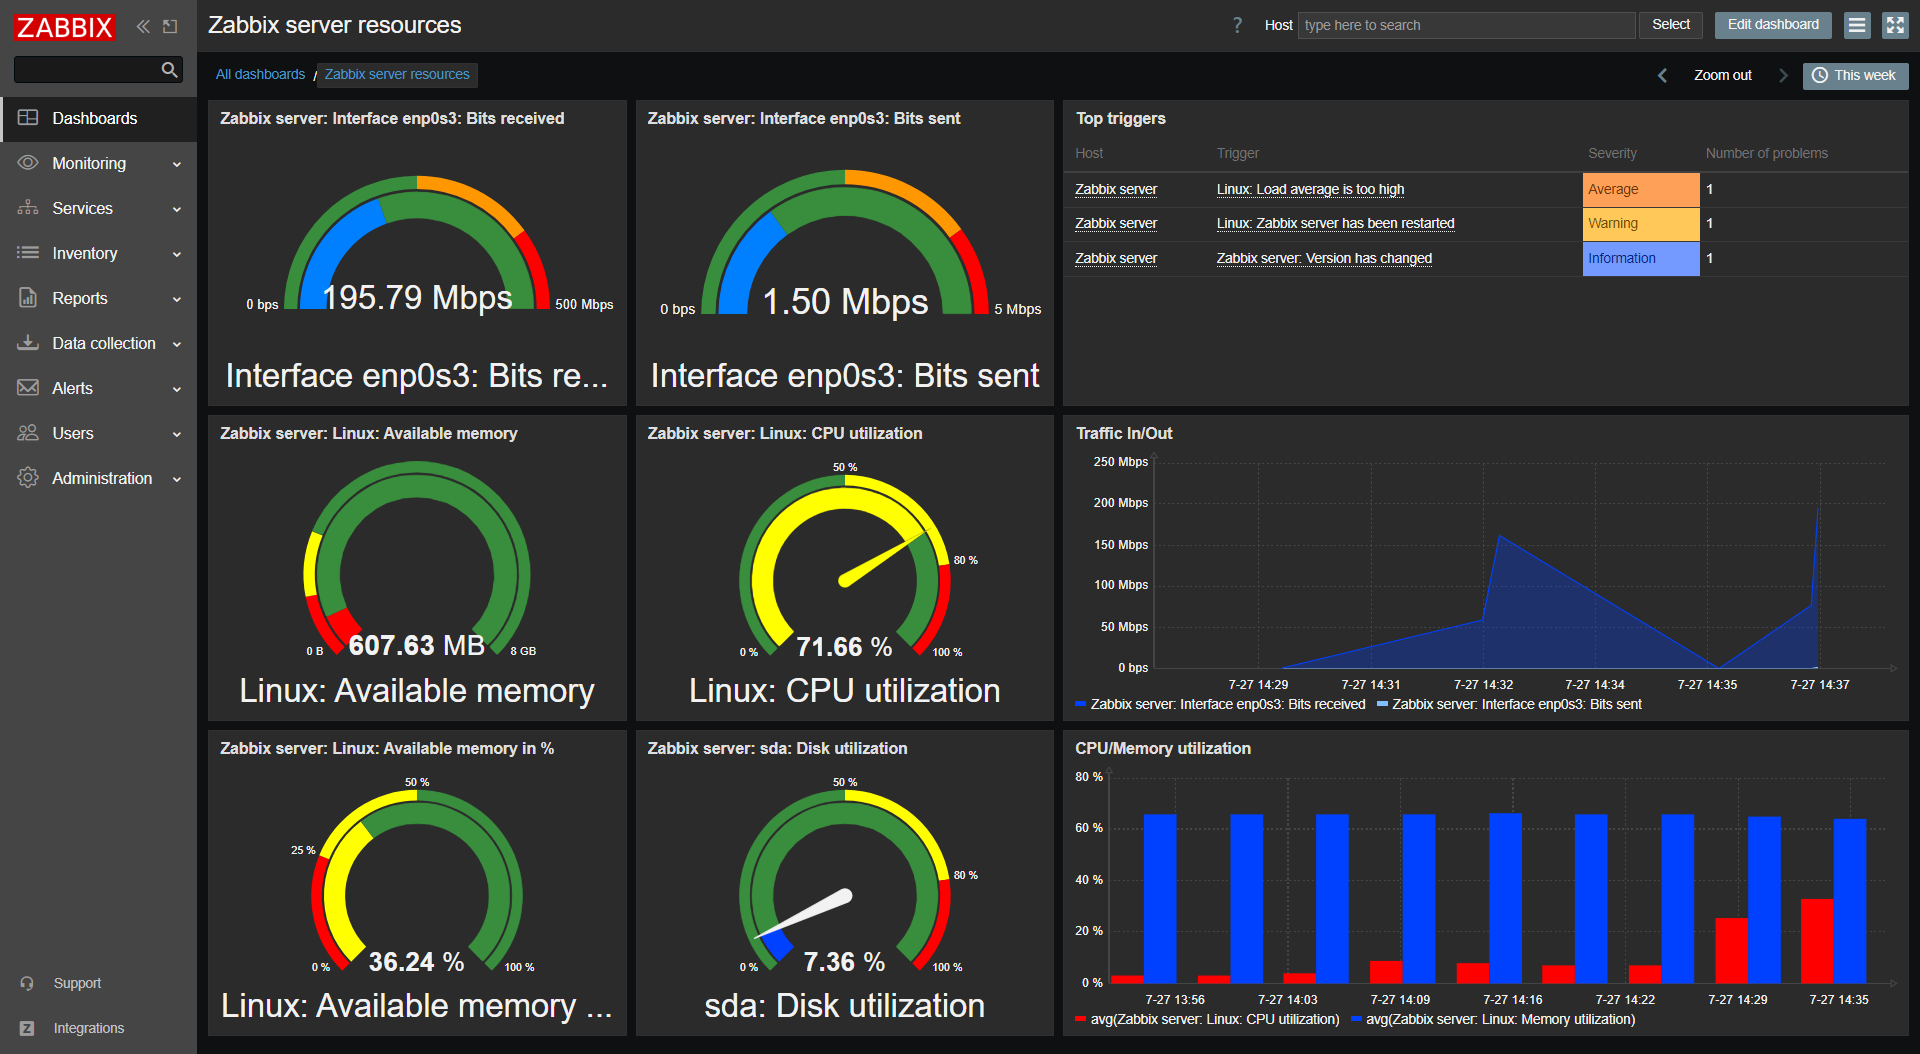
Zabbix Summit 2024 in Review

Post Syndicated from Michael Kammer original https://blog.zabbix.com/zabbix-summit-2024-in-review/28901/

In what has become a highly anticipated annual tradition, Zabbix employees, partners, users, and just plain fans from every corner of the globe showed up in Riga on October 4 and 5 for Zabbix Summit 2024, celebrating a very special open-source monitoring solution that unites us all.

The 12th in-person version of our premier yearly event saw delegates arrive from 48 different countries, and just as every year the atmosphere was like a family reunion, with old friends reconnecting, remote colleagues meeting for the first time in person, and plenty of good vibes all around.

In case you couldn’t manage to make it to Riga and participate, fear not – we’ve put together this post to try to give you a taste of what Zabbix Summit 2024 was all about. As long-time Zabbix veterans say, “There’s nothing like a Zabbix Summit!”

And now, a word from our sponsors

Zabbix Summit 2024 could never have happened without the assistance of our featured sponsors, all part of Zabbix’s official partner network:

initMAX – Diamond Sponsor
IntelliTrend – Platinum Sponsor
IZI-IT – Platinum Sponsor
Quadrata – Platinum Sponsor
Allenta – Gold Sponsor
Metricio – Gold Sponsor
Docomo Business – Gold Sponsor
SRA OSS – Silver Sponsor
Inqbeo – Lunch and coffee break sponsor

Opening doors and minds alike

The day before the Summit, our team welcomed dozens of guests to our office for the traditional pre-Summit Open-Door day. We provided a whiteboard where attendees could leave their thoughts about Zabbix, set up a special Zabbix quiz, and organized a guided tour of the office. Countless questions were asked and answered, endless cups of coffee were poured, and a friendly, welcoming vibe was established that lasted through the end of the Summit and beyond.

Live from the main stage

This year’s Summit hosted 36 speakers who gave 34 speeches. Allowing our audience to ask questions during live Q&A sessions proved so popular last year that there was little doubt we’d continue it this year, as it promotes audience participation and keeps the speakers themselves on their toes. Here are brief recaps of a few of the standout speeches:

Zabbix Cloud and the way forward

Our CEO and Founder Alexei Vladishev kicked off the presentations with a keynote speech that introduced Zabbix Cloud and listed all the features that make it a secure, flexible, and functional alternative to the Zabbix we all know and love. Alexei also gave a short preview of the upcoming Zabbix 7.2 version. Stay tuned!

An intro to Zabbix Cloud

Zabbix Head of Product Dmitrijs Lamberts provided a deeper dive into Zabbix Cloud, sharing detailed information on how Zabbix Cloud works, providing insight into the pricing tiers, and explaining all the features and benefits that have the Zabbix community buzzing with excitement, whetting the audience’s appetite for a live demo he conducted on Day 2 of the Summit.

Using Zabbix to monitor solar energy

Mitsuhiro Ono of the Toyota Motor Corporation and Toshihiro Akamatsu of SRA OSS showed how they achieve distributed monitoring with Zabbix. They also demonstrated a case study that showed exactly how they use their Zabbix dashboard to provide the kind of detailed solar energy oversight that makes the adoption of green power in Japan possible.

Keeping tabs on MariaDB

On Day 2 of the Summit, Anders Karlsson of the MariaDB Corporation discussed how to monitor and manage MariaDB Server Clusters running with the MariaDB MaxScale database proxy. He also demonstrated how MariaDB MaxScale (which also monitors the MariaDB Servers) comes into the picture and touched on topics like managing failover, monitoring database traffic, and routing and load balancing.

Meeting security challenges with Zabbix

Gabriele Minniti and Vincenzo Morrone of Whysecurity demonstrated how the power of the Zabbix API can combine with the APIs of the vendors they work with to create centralized dashbords for controlling the cybersecurity posture of all their customers, no matter what technologies are being used.

The business track

For the first time at Zabbix Summit 2024, we constructed a second stage for slightly less technical, more business-oriented presentations. The speeches delivered there were among the most thought-provoking and fascinating of the Summit, and did much to help us reach new audiences. Here are a few highlights:

An evolving IT monitoring landscape

Zabbix LatAm CEO Luciano Alves gave a well-received talk that focused on the latest trends in the global monitoring market, presenting the results of a survey that took the pulse of over 100 global enterprise organizations.

Zabbix for managed service providers (MSPs)

Andre Morton of AGM Network Consultancy explained why having a flexible and scalable monitoring solution is extremely vital for MSPs and showed how a variety of different features, from authentication mechanisms to automatic remediation and visualization, work together to make Zabbix the perfect monitoring solution for MSPs.

Yes, we still had time for fun!

The Zabbix community works together, innovates together, and when it’s time to let off steam they have fun together at our Summit networking events, of which there were three this year:

  • This year’s welcome event was held at the architecturally stunning National Library of Latvia – or as Latvians call it, “The Castle of Light.” Tasty beverages and delicious food were on the menu, as was a guided tour of the library itself.
  • The main event was held at Riga’s famed Fantadroms Concert and Event Space, where attendees could dance to live music and enjoy more food and drinks as they caught up with friends and forged valuable connections with their counterparts in other organizations.
  • We sent the community on their way with a closing event at the Burzma food hall in Riga’s old town, with a cornucopia of food and music from around the world as well as plenty of opportunities for attendees to relive the Summit, have a few laughs, and wish each other well until next year!

Couldn’t make it this year? No problem!

At this point, you’re probably regretting that you didn’t manage to attend the Summit, but don’t worry – you can recreate the atmosphere in the privacy of your own home or office!

Recordings of both days are available on Zabbix’s YouTube channel:

Streaming – Zabbix Summit 2024 Day 1 
Streaming – Zabbix Summit 2024 Day 2

The slides and texts of the presentations are also available for reference and download here as well.

Whether you attended in person or streamed the Summit online, we hope that you had a great time, learned a lot, and are eager to do it all again in 2025!

The post Zabbix Summit 2024 in Review appeared first on Zabbix Blog.
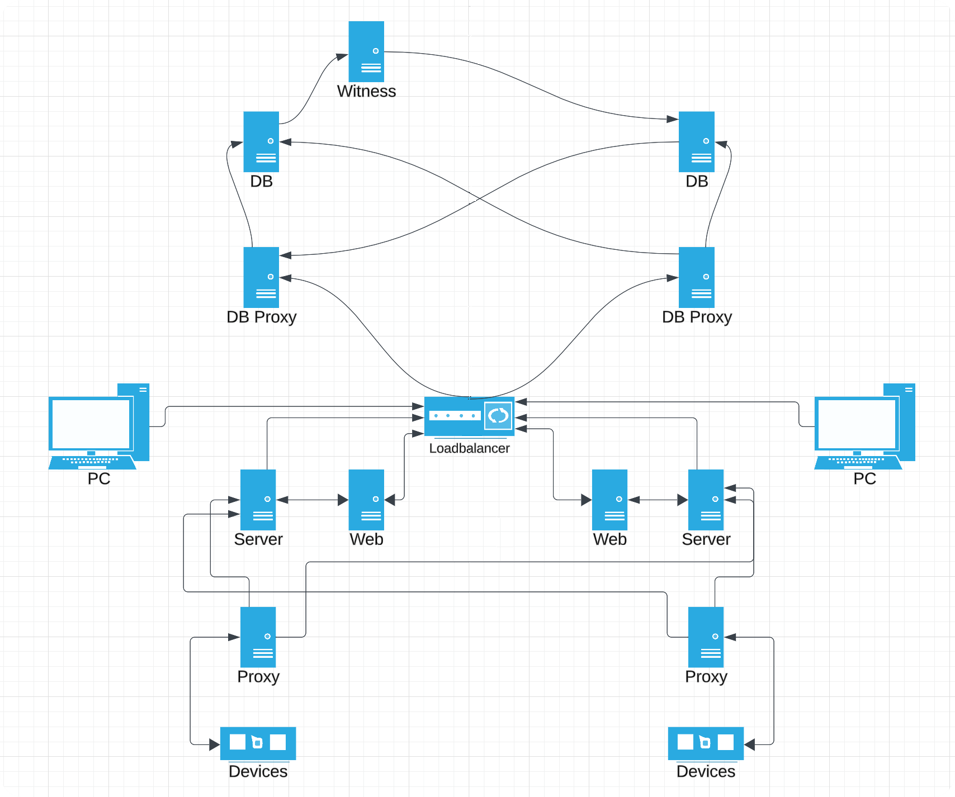
Blending Zabbix and AI with Tomáš Heřmánek

Post Syndicated from Michael Kammer original https://blog.zabbix.com/blending-zabbix-and-ai-with-tomas-hermanek/28832/

Zabbix Summit 2024 is only a few days away, which means that it’s time for the last of our interviews with Summit speakers. Our final chat this year is with Tomáš Heřmánek, the CEO and Founder of initMAX s.r.o. We asked him about his beginnings in the tech industry, how he got started with Zabbix, and how AI will change the game for monitoring in general and Zabbix in particular.

Please tell us a bit about yourself and the journey that led you to initMAX.

My journey in the IT field started with small ISPs and later took a significant leap into the world of Linux and application management, where the need for effective monitoring became evident. I worked for a company that prioritized high-quality open-source solutions, and it was during this time that we adopted Zabbix version 1.8 as a replacement for Nagios, which we found to be inflexible. Shortly after our deployment, Zabbix 2.0 was released. It introduced JMX monitoring, which was crucial for us. Since then, Zabbix has been our go-to solution for monitoring.

I set a personal goal to master this outstanding monitoring system and participated in the first official Zabbix training in the Czech Republic, where I earned my initial certifications as a Zabbix Specialist and Professional on version 3.0. The training experience drew me deeper into the world of Zabbix, especially after meeting a burgeoning group of enthusiasts in the country. I felt compelled to give back to the community that had supported me.

How long have you been using Zabbix? What kind of Zabbix-related tasks does your team tackle on a daily basis?

When I started my own company, becoming a Zabbix partner was a natural choice. To further contribute to the community, I pursued the Expert and Trainer certifications. It was the most challenging 14 days of my life, but it was worth it. For anyone serious about Zabbix, I highly recommend participating in official training sessions and actively engaging with the community through forums, local groups, Telegram, WhatsApp, blogs, and forums. This commitment to support and strengthen the community further.is also why we created our own wiki, which is accessible to everyone without restrictions.

Can you give us a few clues about what we can expect to hear during your Zabbix Summit presentation?

This year, I have prepared a demonstration for the Zabbix Summit showcasing how we integrate AI into our operations, including various modifications to the web interface that allow us to automate and streamline routine tasks. Besides showcasing these innovations, we will also be making some parts of our work available to the public. The main focus of my presentation will be on problem identification, automating the creation of preprocessing steps, and using a chatbot for creating hosts, reading configurations, and making modifications. Essentially, it’s a smart assistant and guide all in one.

The final section, which we find the most challenging, deals with automated event correlation and the creation of a topology, from which correlations partially derive and evaluate. We are using the new Zabbix 7.0 feature – root cause and symptoms – for visualization in Zabbix. Our goal is to showcase not only the capabilities of Zabbix in combination with AI, but also to contribute back to the community by sharing some of these developments freely.

In your experience, does Zabbix lend itself easily to enhancement via AI?

AI is something that truly fascinates us and is currently shaping the world. From our experience, we believe that the possibilities are limited only by our imagination. In the future, I can envision AI autonomously discovering elements that need to be monitored, integrating them into Zabbix, and configuring everything necessary for effective monitoring.

What changes do you think AI will bring to the world of monitoring in general over the next decade or so?

I foresee a shift in our roles, moving away from traditional IT tasks towards a focus on idea generation, control, and the customization of artificial intelligence. As AI continues to evolve, it will not only enhance automation but also empower us to explore and implement innovative solutions more effectively.

The post Blending Zabbix and AI with Tomáš Heřmánek appeared first on Zabbix Blog.

Zabbix for MSPs with Andre Morton

Post Syndicated from Michael Kammer original https://blog.zabbix.com/zabbix-for-msps-with-andre-morton/28748/

To help make sure that everyone’s up to speed with Zabbix Summit 2024 speakers and their topics, we’re continuing our series of interviews with Andre Morton of AGM Network Consultancy LTD. Keep reading to learn how he feels Zabbix can alleviate the typical pain points of managed service providers (MSPs), see how he uses Zabbix to maintain control of his network, and find out what he appreciates most about Zabbix.

Please tell us a bit about yourself and the journey that led you to AGM Network Consultancy LTD.

I started out studying Network Engineering at the University of Greenwich, and then went on to undertake a Masters of Networks and Security at the University of Kent. During my Masters, I was the a one-man IT Team for a Child Care agency spanning the UK. I then went on to work at three small IT companies/MSPs, being the only Network Engineer at each company and managing networks with 80 – 200 customers.

How long have you been using Zabbix? How has it impacted your everyday tasks?

I have been using Zabbix for about 10 years now. At first, I just used it to get insights via SNMP. Then I began using it to create visual troubleshooting aids for myself and non-networking team members. Finally, I began using Zabbix as my main inventory gathering tool for networking and infrastructure devices. When it comes to that, Zabbix has enabled me to control how I want to monitor the network, avoiding vendor limitations and allowing me to build my own scripts to run tests and actions that I would not otherwise be able to do.

Can you give us a few clues about what we can expect to hear during your Zabbix Summit presentation?

I may have to condense some things, as I don’t want to be too technical or take too long! I’ll definitely talk about what drew me to Zabbix, how I used Zabbix to turn problems that require a large amount of attention and time into scripts that can identify the problems and capture the problem states, and how Zabbix dashboards help me to get a clear overview of customer and site problems/general status. I’ll also speak about scripts that we now use to troubleshoot and undertake remote actions, give examples of what the value of the monitoring data is to MSPs before and after the problem, and let everyone in on my upcoming plans for Zabbix, which include webhooks from the map, scripts; Zabbix’s place in our bespoke systems, and network automation.

What, in your opinion, are the biggest pain points MSPs have, and how can Zabbix help alleviate them?

I’d say that there are two big pain points that Zabbix is of assistance with – providing troubleshooting time for big problems, and making sure that historical data is ready for troubleshooting.

What do you appreciate the most about Zabbix in your role?

Zabbix allows me to drastically reduce the amount of administration and troubleshooting that I have to undertake and provides a live inventory of devices (software/firmware details). Thanks to Zabbix, I don’t have to use multiple tools or log into multiple devices to get software and firmware version details.

The post Zabbix for MSPs with Andre Morton appeared first on Zabbix Blog.

Monitoring MariaDB Clusters and MaxScale with Anders Karlsson

Post Syndicated from Michael Kammer original https://blog.zabbix.com/monitoring-mariadb-clusters-and-maxscale-with-anders-karlsson/28718/

The heart and soul of a Zabbix Summit is the wide range of expert speakers who show up each year to share their experience, knowledge, and discoveries. Accordingly, we’re continuing our series of interviews with Summit 2024 speakers by having a chat with MariaDB Sales Engineer Anders Karlsson. He’ll grace our stage at Summit 2024  to talk about his 4 decades of work experience and share how he uses a variety of Zabbix features to monitor MariaDB clusters and MariaDB MaxScale.

Please tell us a bit about yourself and the journey that led you to MariaDB.

I have been working with databases nearly all of my professional life, which is more than 40 years by now. My first IT job was as a system administrator on a development system for Telco equipment running UNIX on a PDP/11 70. This was fun, and I got to use Unix very early (the early 1980’s) and I was also there at the start of the Internet (by emailing through UUCP to the US and then through what was then the Internet).

Following that, I joined another Telco company, which used a rather unknown database technology called Oracle (version 4.1.4). When this company moved their operations from Stockholm (where I lived) to Luxembourg, I decided to leave and look for other opportunities. I heard that Oracle was looking for people and I got a job there as a support engineer. At Oracle I soon got involved with lots of things beyond Tech Support – I was a trainer, a consultant, and eventually a sales engineer.

I left Oracle in the early 1990’s to join a small application development company as a developer, but this really wasn’t for me, so I soon left and joined Informix instead. I was at Informix until 1996 or so and then I worked for some other small companies around the end of the millennium. Next, I joined forces with a couple of old friends to develop a database solution. This wasn’t very successful, and I still needed a job.

I first ended up with TimesTen before they ran out of luck. After a year or so of freelancing, I was approached by an old friend from the Informix days who was now the sales manager for MySQL in Scandinavia. I joined MySQL in 2004 as a sales engineer and was there until Oracle took over. I then worked for a small Swedish startup for a couple of years, but I missed sales engineering, so when I got an offer to join MariaDB in 2012 I said yes.

How long have you been using Zabbix? What kind of Zabbix tasks do you get up to on a daily basis?

I have known about Zabbix and used it occasionally for a while, but while preparing for Zabbix Summit 2024 I have gotten to use it “in anger” a bit more. There are pros and cons to it, but in general I like it. It does have a lot of “Open Source” feel to it, but that is not really an issue for me.

Can you give us a few clues about what we can expect to hear during your Zabbix Summit presentation?

I will focus on monitoring MariaDB Clusters running Galera Cluster and the MariaDB MaxScale database proxy. Monitoring individual MariaDB servers is easy out of the box with Zabbix, but when you have a cluster you have to monitor certain cluster-wide attributes. MariaDB MaxScale keeps track of the state of the server in the cluster in detail and the cluster as whole, and I will show how to pull cluster-wide data from MaxScale using the MaxScale REST/JSON API and how to use that to build triggers and graphs in Zabbix. I will finish up by doing a demo of this with MariaDB MaxScale and a Galera Cluster.

What led you to the topic of Monitoring MariaDB Clusters and MariaDB MaxScale with Zabbix?

The main thing was that although there are community provided Zabbix templates for MariaDB MaxScale, and Galera can be monitored largely by the Zabbix agent, using these typically does not provide as much in terms of cluster-wide monitoring as I would like. It’s important to know how the reads and writes are distributed, what the state of the database cluster is, etc.

How do you see the role of Zabbix in MariaDB in the near future? Are you planning to use it for any other new tasks?

My next goal is to see if I can write a blog for MariaDB on Zabbix monitoring with some emphasis on MariaDB MaxScale.

The post Monitoring MariaDB Clusters and MaxScale with Anders Karlsson appeared first on Zabbix Blog.