Post Syndicated from Jeremy Makowski original https://www.rapid7.com/blog/post/tr-building-construction-sector-threat-landscape-initial-access-supply-chain-iot
In 2025, the construction industry stands at the crossroads of digital transformation and evolving cybersecurity risks, making it a prime target for threat actors. Cyber adversaries, including ransomware operators, organized cybercriminal networks, and state-sponsored APT groups from countries such as China, Russia, Iran, and North Korea, are increasingly focusing their attacks on the building and construction sector.
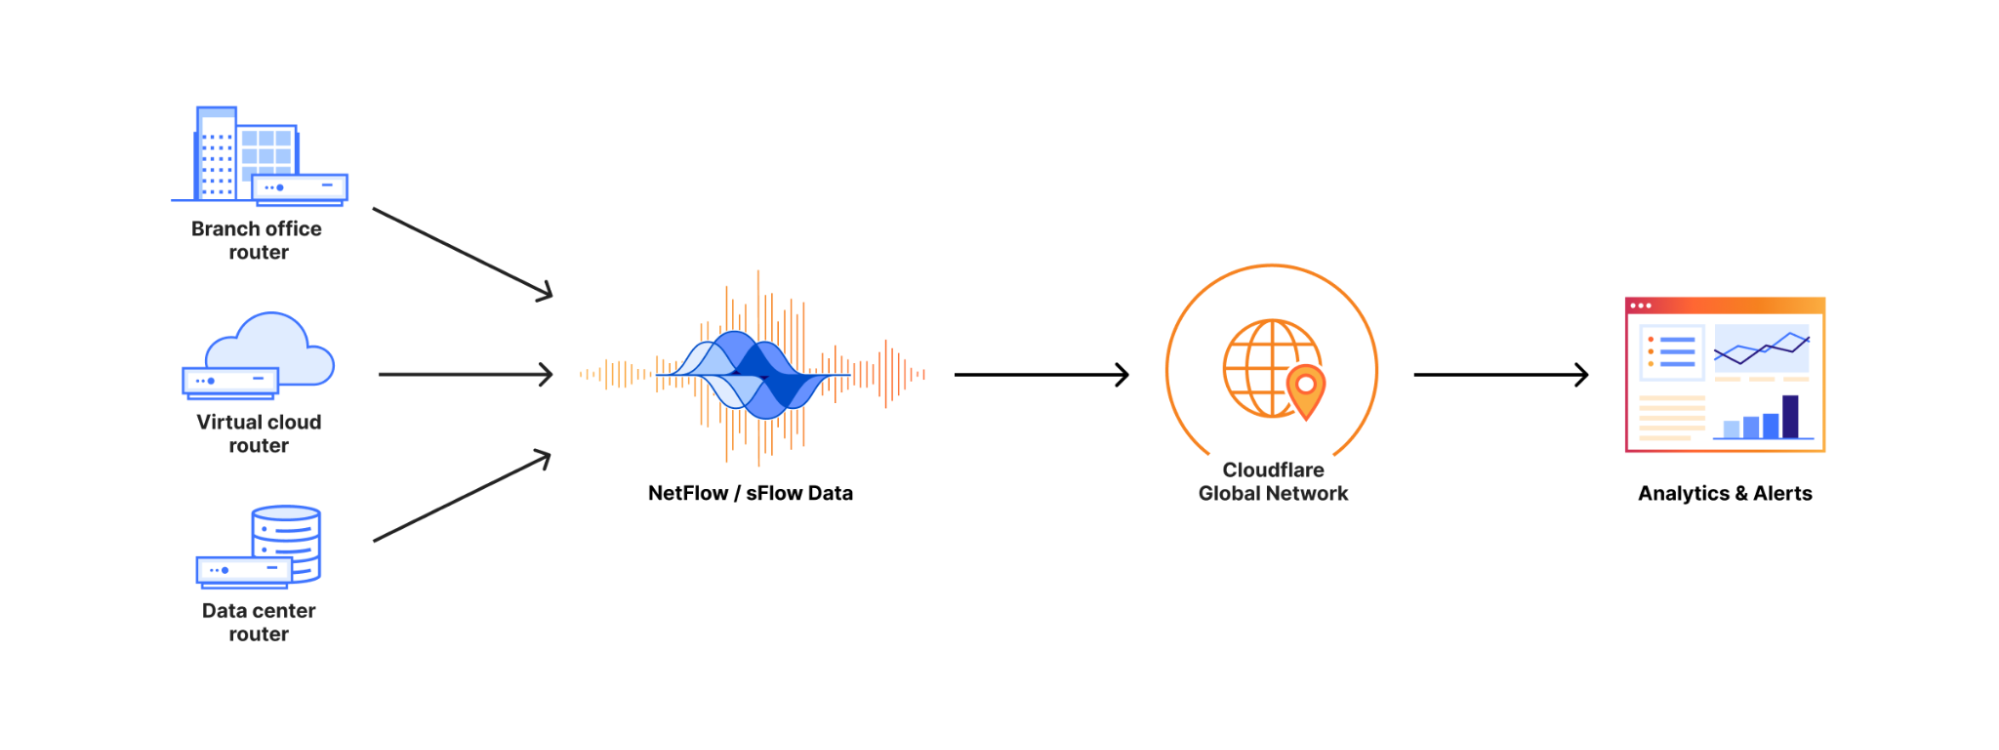
These actors exploit the industry’s growing dependence on vulnerable IoT‑enabled heavy machinery, Building Information Modeling (BIM) systems, and cloud‑based project management platforms.
Ransomware campaigns designed to disrupt project timelines, supply chain attacks exploiting third‑party software and equipment vendors, and social engineering schemes targeting on‑site personnel pose substantial operational and financial risks. Compounding this, data privacy mandates and regulatory scrutiny have intensified globally, pressing construction companies to implement robust cybersecurity measures.
In this two-part series, Rapid7 is looking at the threats the construction industry faces, how threat actors are entering their networks, and the most common vulnerabilities construction industry security professionals should remediate now.
⠀
Initial access and data leaks
The construction sector faces escalating cyber threats as rapid digital transformation and heavy reliance on third-party vendors expose firms to new vulnerabilities. Cybercriminals increasingly target construction companies for initial access and data leaks, exploiting weak security practices, outdated legacy systems, and widespread use of cloud-based project management tools. Attackers commonly employ phishing email messages, compromised credentials, and supply chain attacks, taking advantage of insufficient employee training and lax vendor risk management.
Notably, gaining initial access to a corporate network can be resource-intensive, prompting many threat actors to seek more accessible routes: purchasing access from underground forums where intermediaries and brokers sell credentials to previously breached networks across all industries, including construction. Access types traded, such as VPN, RDP, SSH, Citrix, SMTP, and FTP, are priced based on the target’s size and network complexity.
Once inside, cybercriminals leverage interconnected systems to move laterally and exfiltrate valuable data, including blueprints, contracts, financial records, and personal information. The complex, collaborative nature of construction projects and the frequent exchange of sensitive documents amplify the risk, making the sector a prime target for corporate espionage, financial gain, and extortion through ransomware. This evolving threat landscape underscores the urgent need for robust cybersecurity measures and comprehensive vendor risk management within the industry.
⠀

Construction company network access for sale on the dark web
⠀
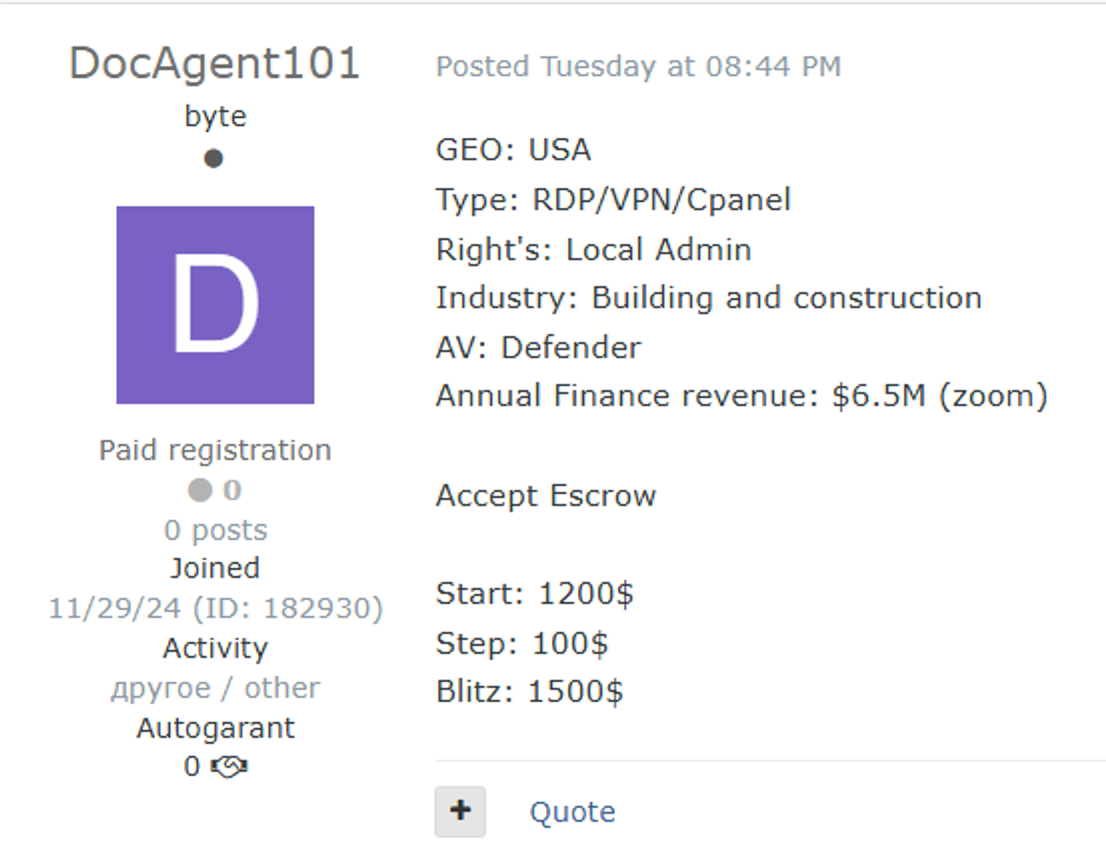
VPN/RDP/Cpanel access to a construction company for sale on the dark web
⠀
Social engineering and phishing campaigns
Social engineering and phishing campaigns are particularly effective in the building and construction industry as attackers exploit the industry’s workflow and human vulnerabilities. Cybercriminals frequently use phishing emails, SMS messages, and phone calls to impersonate project managers, suppliers, or executives. These communications often appear urgent, requesting immediate payment, sensitive information, or login credentials, making them difficult for busy staff to ignore.
Common attack vectors
-
Vendor impersonation: Attackers pose as legitimate suppliers to request changes in payment details or deliver fake invoices, exploiting the sector’s reliance on a broad network of subcontractors and vendors.
-
Executive impersonation (“CEO fraud”): Criminals spoof senior management to pressure employees into transferring funds or divulging confidential information.
-
Malicious attachments and links: Phishing messages often contain fake contracts, blueprints, or project documents, which, when opened, compromise credentials or deploy malware.
-
Compromised trusted platforms: Attackers exploit open redirects or compromised accounts on construction management tools to distribute phishing links that bypass basic email security checks.
Due to several unique operational challenges, the building and construction sector is particularly vulnerable to social engineering and phishing attacks. A dispersed and mobile workforce, with employees often working remotely or across multiple job sites, makes it challenging to verify unexpected requests or consult with IT and security teams in real time.
The urgency to complete high-value transactions under tight project deadlines can encourage employees to bypass verification procedures and overlook warning signs of suspicious communications. Additionally, the sector’s complex supply chains, which involve frequent interactions with unfamiliar subcontractors, provide ample opportunities for attackers to infiltrate ongoing conversations unnoticed.
This risk is compounded by varying levels of cybersecurity awareness among employees, particularly in smaller firms where consistent training is less common. These factors make the industry an attractive target for attackers and highlight the critical need for enhanced employee awareness, rigorous verification processes, and sector-specific cybersecurity measures.
Supply chain and third‑party risks
The construction sector’s dependence on a vast network of subcontractors, vendors, and technology providers has intensified its exposure to supply chain and third‑party cyber threats. Construction projects often involve dozens, sometimes hundreds, of different partners, each bringing their systems and security practices to the table. Unlike more centralized industries, construction companies rarely have complete visibility or control over the cybersecurity standards of every third party involved.
This lack of uniformity creates significant blind spots that attackers can exploit. For example, a breach within a third-party software update or a compromised equipment supplier can quickly propagate throughout an entire project, causing costly delays, data loss, or operational paralysis.
With tight deadlines and complex, geographically dispersed operations, construction firms may deprioritize cybersecurity vetting in favor of speed and cost, further compounding their risk. Effective mitigation now demands ongoing risk assessments, precise contractual cybersecurity requirements for all partners, real-time monitoring, and a collaborative approach to incident response, ensuring vulnerabilities are identified and addressed before they can impact critical projects.
⠀
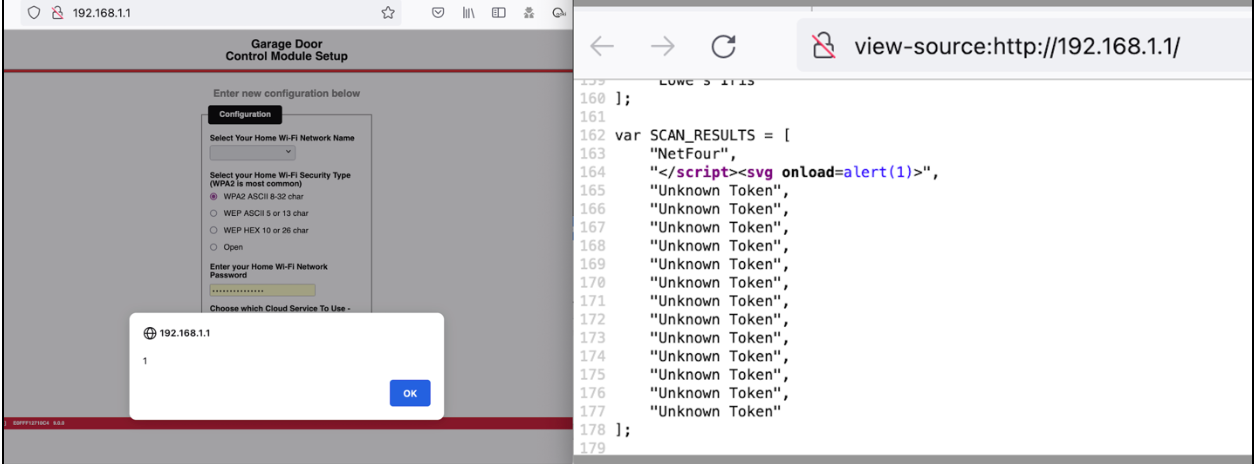
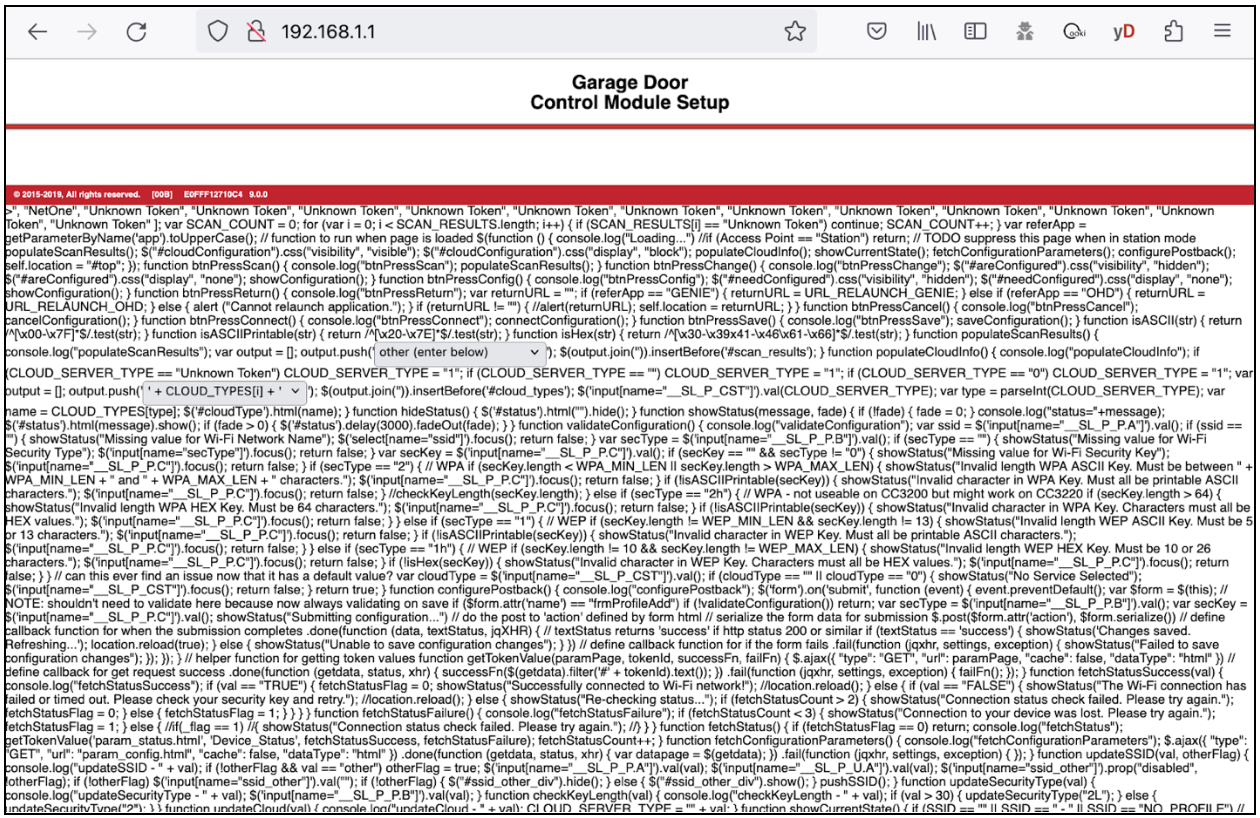
Emerging threats: The Internet of Things (IoT) and Building Information Modeling (BIM)
The rapid adoption of IoT‑enabled machinery and Building Information Modeling (BIM) has transformed the construction landscape, enhancing efficiency and collaboration across project teams. However, these advances have also created new and unique points of vulnerability.
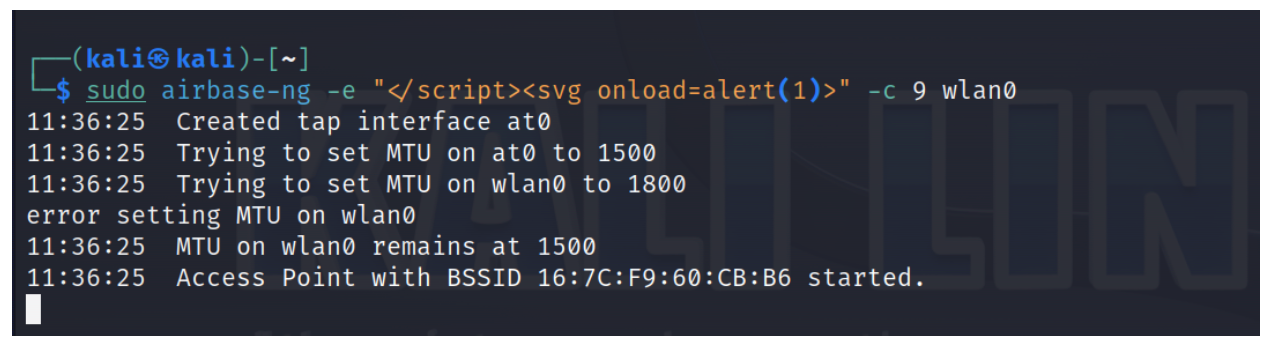
The sector’s use of connected devices such as smart cranes, on-site sensors, and drones often operate in environments where cybersecurity is not traditionally a primary concern, and where devices may be physically accessible to outsiders or not consistently updated. Many IoT devices lack built-in security features, making them easy entry points for cyberattacks that could disrupt operations or threaten worker safety.
Similarly, BIM platforms that centralize and share sensitive design and project data are now high-value targets, as a single compromise can reveal blueprints, project timelines, and operational details to attackers. Construction firms are particularly at risk because project sites frequently change, IT resources may be stretched thin, and digital assets are constantly being moved and accessed by different parties.
Protecting these new technologies requires a shift in mindset: from viewing cybersecurity as a back-office concern to treating it as an essential component of on-site and digital operations, including secure device management, strong access controls, regular updates, and robust encryption practices.
Key threats and vulnerable points in IoT and BIM for construction:
-
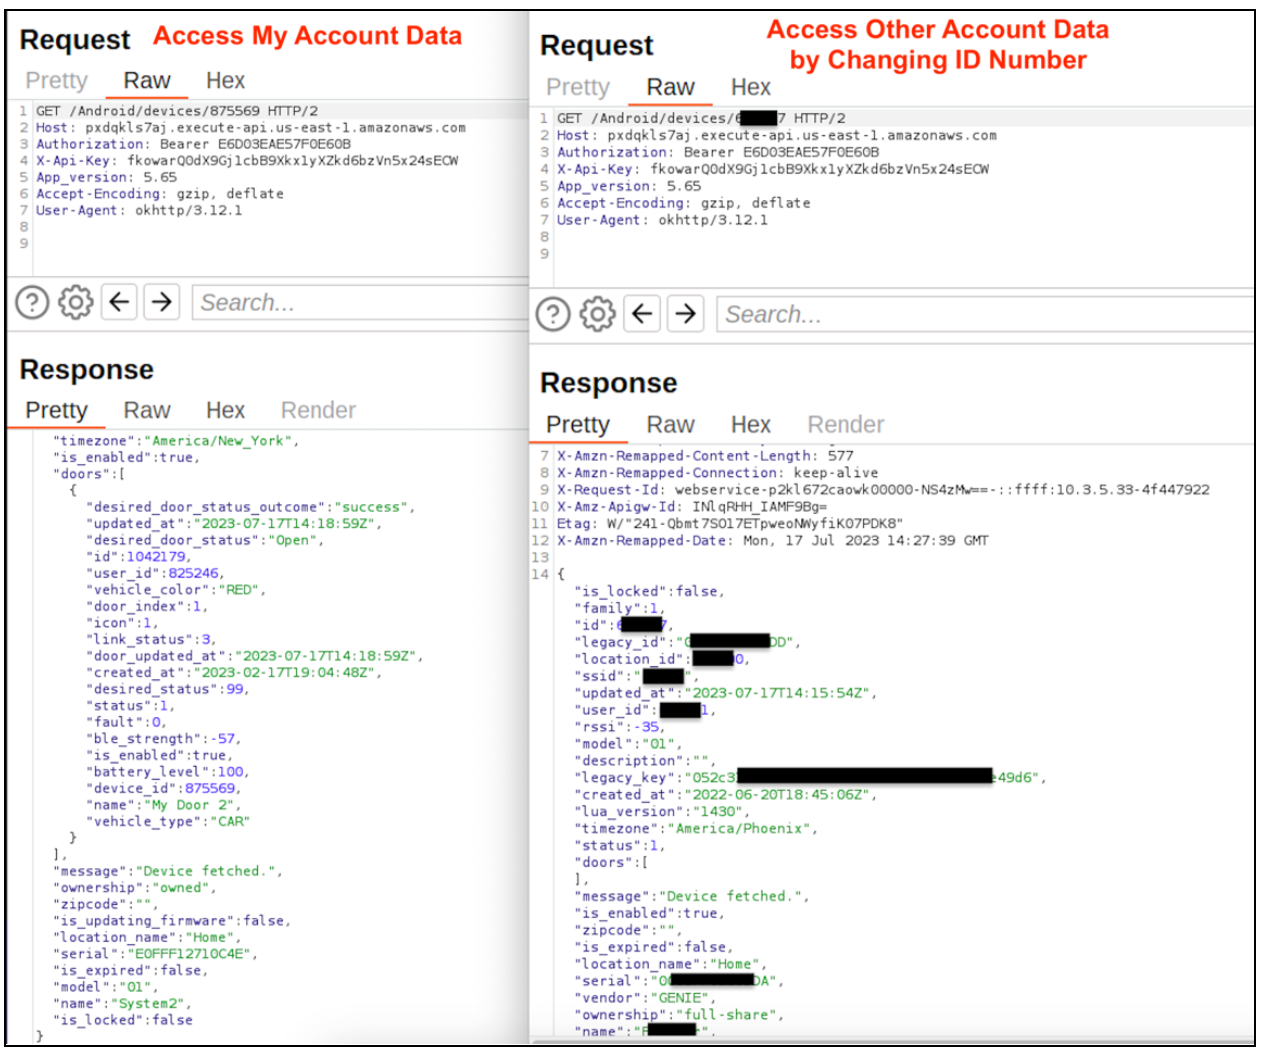
IoT device vulnerabilities:
-
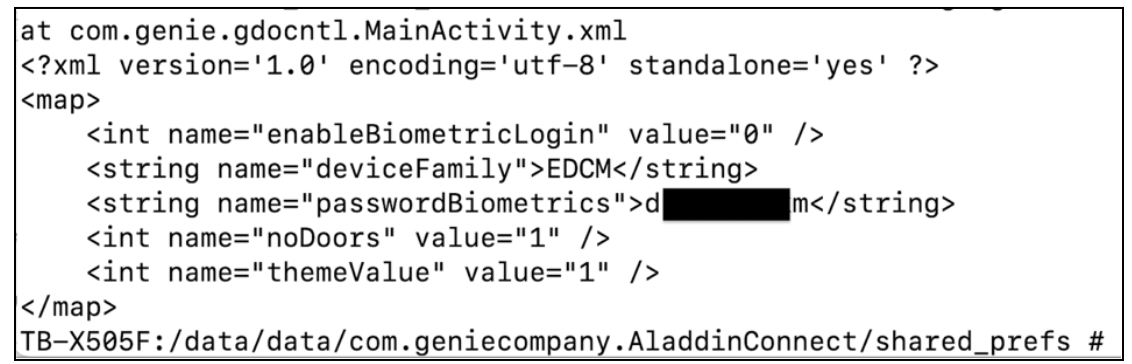
Weak authentication: Many IoT devices use default or weak passwords, making unauthorized access easier.
-
Unpatched firmware: Devices often lack regular updates, leaving known vulnerabilities open to exploitation.
-
Physical access risks: Construction sites are less secure environments, allowing attackers to tamper with or steal devices.
-
Insecure communication protocols: Data sent between IoT devices and central systems may be unencrypted or poorly secured, exposing sensitive information.
-
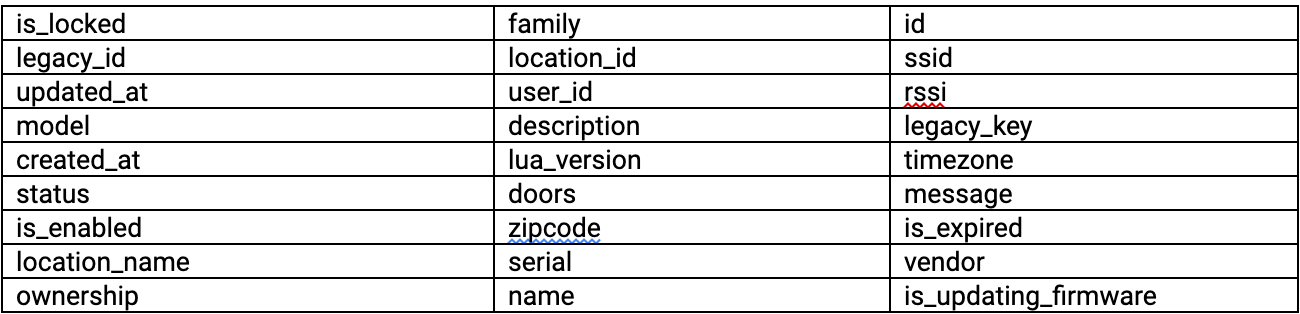
BIM threats:
Centralized data breaches: BIM platforms hold all project data in one place so that a single breach can expose blueprints, schedules, and operational details. -
Unauthorized access: Weak access controls or shared credentials can let unauthorized users download, alter, or leak sensitive project files.
-
Third-party collaboration risks: Multiple subcontractors or vendors may have access to BIM, increasing the risk of compromised accounts or insider threats.
⠀
Taking proactive steps to enhance cybersecurity
As the building and construction industry digitalizes, strengthening cybersecurity has become a business-critical priority. The following strategies address the sector’s unique challenges and offer a roadmap for reducing cyber risk.
Elevate cybersecurity to a core business priority
Historically, cybersecurity has been an afterthought in many construction firms. To change this, leadership must treat cybersecurity as essential to project delivery and business continuity. This requires investing in dedicated IT security staff, integrating cybersecurity into board-level discussions, and establishing clear policies for digital risk management throughout the organization.
Secure the digital supply chain
Given the sector’s reliance on a complex network of subcontractors and vendors, assessing and strengthening supply chain security is crucial. Firms should require vendors to meet baseline cybersecurity standards, conduct regular audits of third-party security practices, and ensure that project documents and data are shared through secure and encrypted channels. Construction companies can reduce the risk of supply chain-based attacks by holding all partners to strong security protocols.
Upgrade and harden legacy systems
Outdated software and systems remain prime targets for cybercriminals. Construction companies must thoroughly assess their IT environments, identify and replace unsupported or vulnerable technologies, and maintain a regular schedule of software updates and patching. Modern firewalls and endpoint protection further help to close critical security gaps.
Protect IoT devices and smart technology
Securing these devices is essential with the rapid adoption of IoT sensors, connected machinery, and advanced project management platforms. This means changing default passwords, disabling unnecessary services, and keeping IoT devices on networks separate from core business systems. Ongoing monitoring for unauthorized access or unusual activity helps to detect and respond to threats targeting these new endpoints.
Foster a security-aware culture
Human error is still a leading cause of cyber incidents, so regular cybersecurity training should be mandatory for all employees and contractors. Staff should be equipped to recognize phishing attempts, follow secure password practices, and report security incidents. Construction firms can strengthen their defense by building a culture where everyone understands their role in protecting digital assets.
Safeguard sensitive data and intellectual property
Protecting sensitive information such as blueprints, bids, client data, and proprietary designs is crucial. Data should be encrypted at rest and in transit, with strict access controls and permissions. Regular data backups and recovery testing are also important, along with using secure platforms for managing and sharing documents. These measures help prevent unauthorized access, data loss, and reputational harm.
As the industry reckons with its expanding digital footprint, understanding and mitigating the unique tactics and motivations of these threat actors in 2025 is prudent and imperative for ensuring project continuity, workforce safety, and reputational resilience.
In the concluding installment of this two-part series, Rapid7 will look at how ransomware actors exploit many of the same weaknesses mentioned here. Stay tuned.


 Çağrı Çakır is the Lead Software Engineer for the PostNL IoT platform, where he manages the architecture that processes billions of events each day. As an AWS Certified Solutions Architect Professional, he specializes in designing and implementing event-driven architectures and stream processing solutions at scale. He is passionate about harnessing the power of real-time data, and dedicated to optimizing operational efficiency and innovating scalable systems.
 Özge Kavalcı works as Senior Solution Engineer for the PostNL IoT platform and loves to build cutting-edge solutions that integrate with the IoT landscape. As an AWS Certified Solutions Architect, she specializes in designing and implementing highly scalable serverless architectures and real-time stream processing solutions that can handle unpredictable workloads. To unlock the full potential of real-time data, she is dedicated to shaping the future of IoT integration.
 Amit Singh works as a Senior Solutions Architect at AWS with enterprise customers on the value proposition of AWS, and participates in deep architectural discussions to make sure solutions are designed for successful deployment in the cloud. This includes building deep relationships with senior technical individuals to enable them to be cloud advocates. In his free time, he likes to spend time with his family and learn more about everything cloud.
 Lorenzo Nicora works as Senior Streaming Solutions Architect at AWS helping customers across EMEA. He has been building cloud-centered, data-intensive systems for several years, working in the finance industry both through consultancies and for fintech product companies. He has used open-source technologies extensively and contributed to several projects, including Apache Flink.