Post Syndicated from MJ Kubba original https://aws.amazon.com/blogs/devops/monitoring-amazon-devops-guru-insights-using-amazon-managed-grafana/
As organizations operate day-to-day, having insights into their cloud infrastructure state can be crucial for the durability and availability of their systems. Industry research estimates[1] that downtime costs small businesses around $427 per minute of downtime, and medium to large businesses an average of $9,000 per minute of downtime. Amazon DevOps Guru customers want to monitor and generate alerts using a single dashboard. This allows them to reduce context switching between applications, providing them an opportunity to respond to operational issues faster.
DevOps Guru can integrate with Amazon Managed Grafana to create and display operational insights. Alerts can be created and communicated for any critical events captured by DevOps Guru and notifications can be sent to operation teams to respond to these events. The key telemetry data types of logs and metrics are parsed and filtered to provide the necessary insights into observability.
Furthermore, it provides plug-ins to popular open-source databases, third-party ISV monitoring tools, and other cloud services. With Amazon Managed Grafana, you can easily visualize information from multiple AWS services, AWS accounts, and Regions in a single Grafana dashboard.
In this post, we will walk you through integrating the insights generated from DevOps Guru with Amazon Managed Grafana.
Solution Overview:

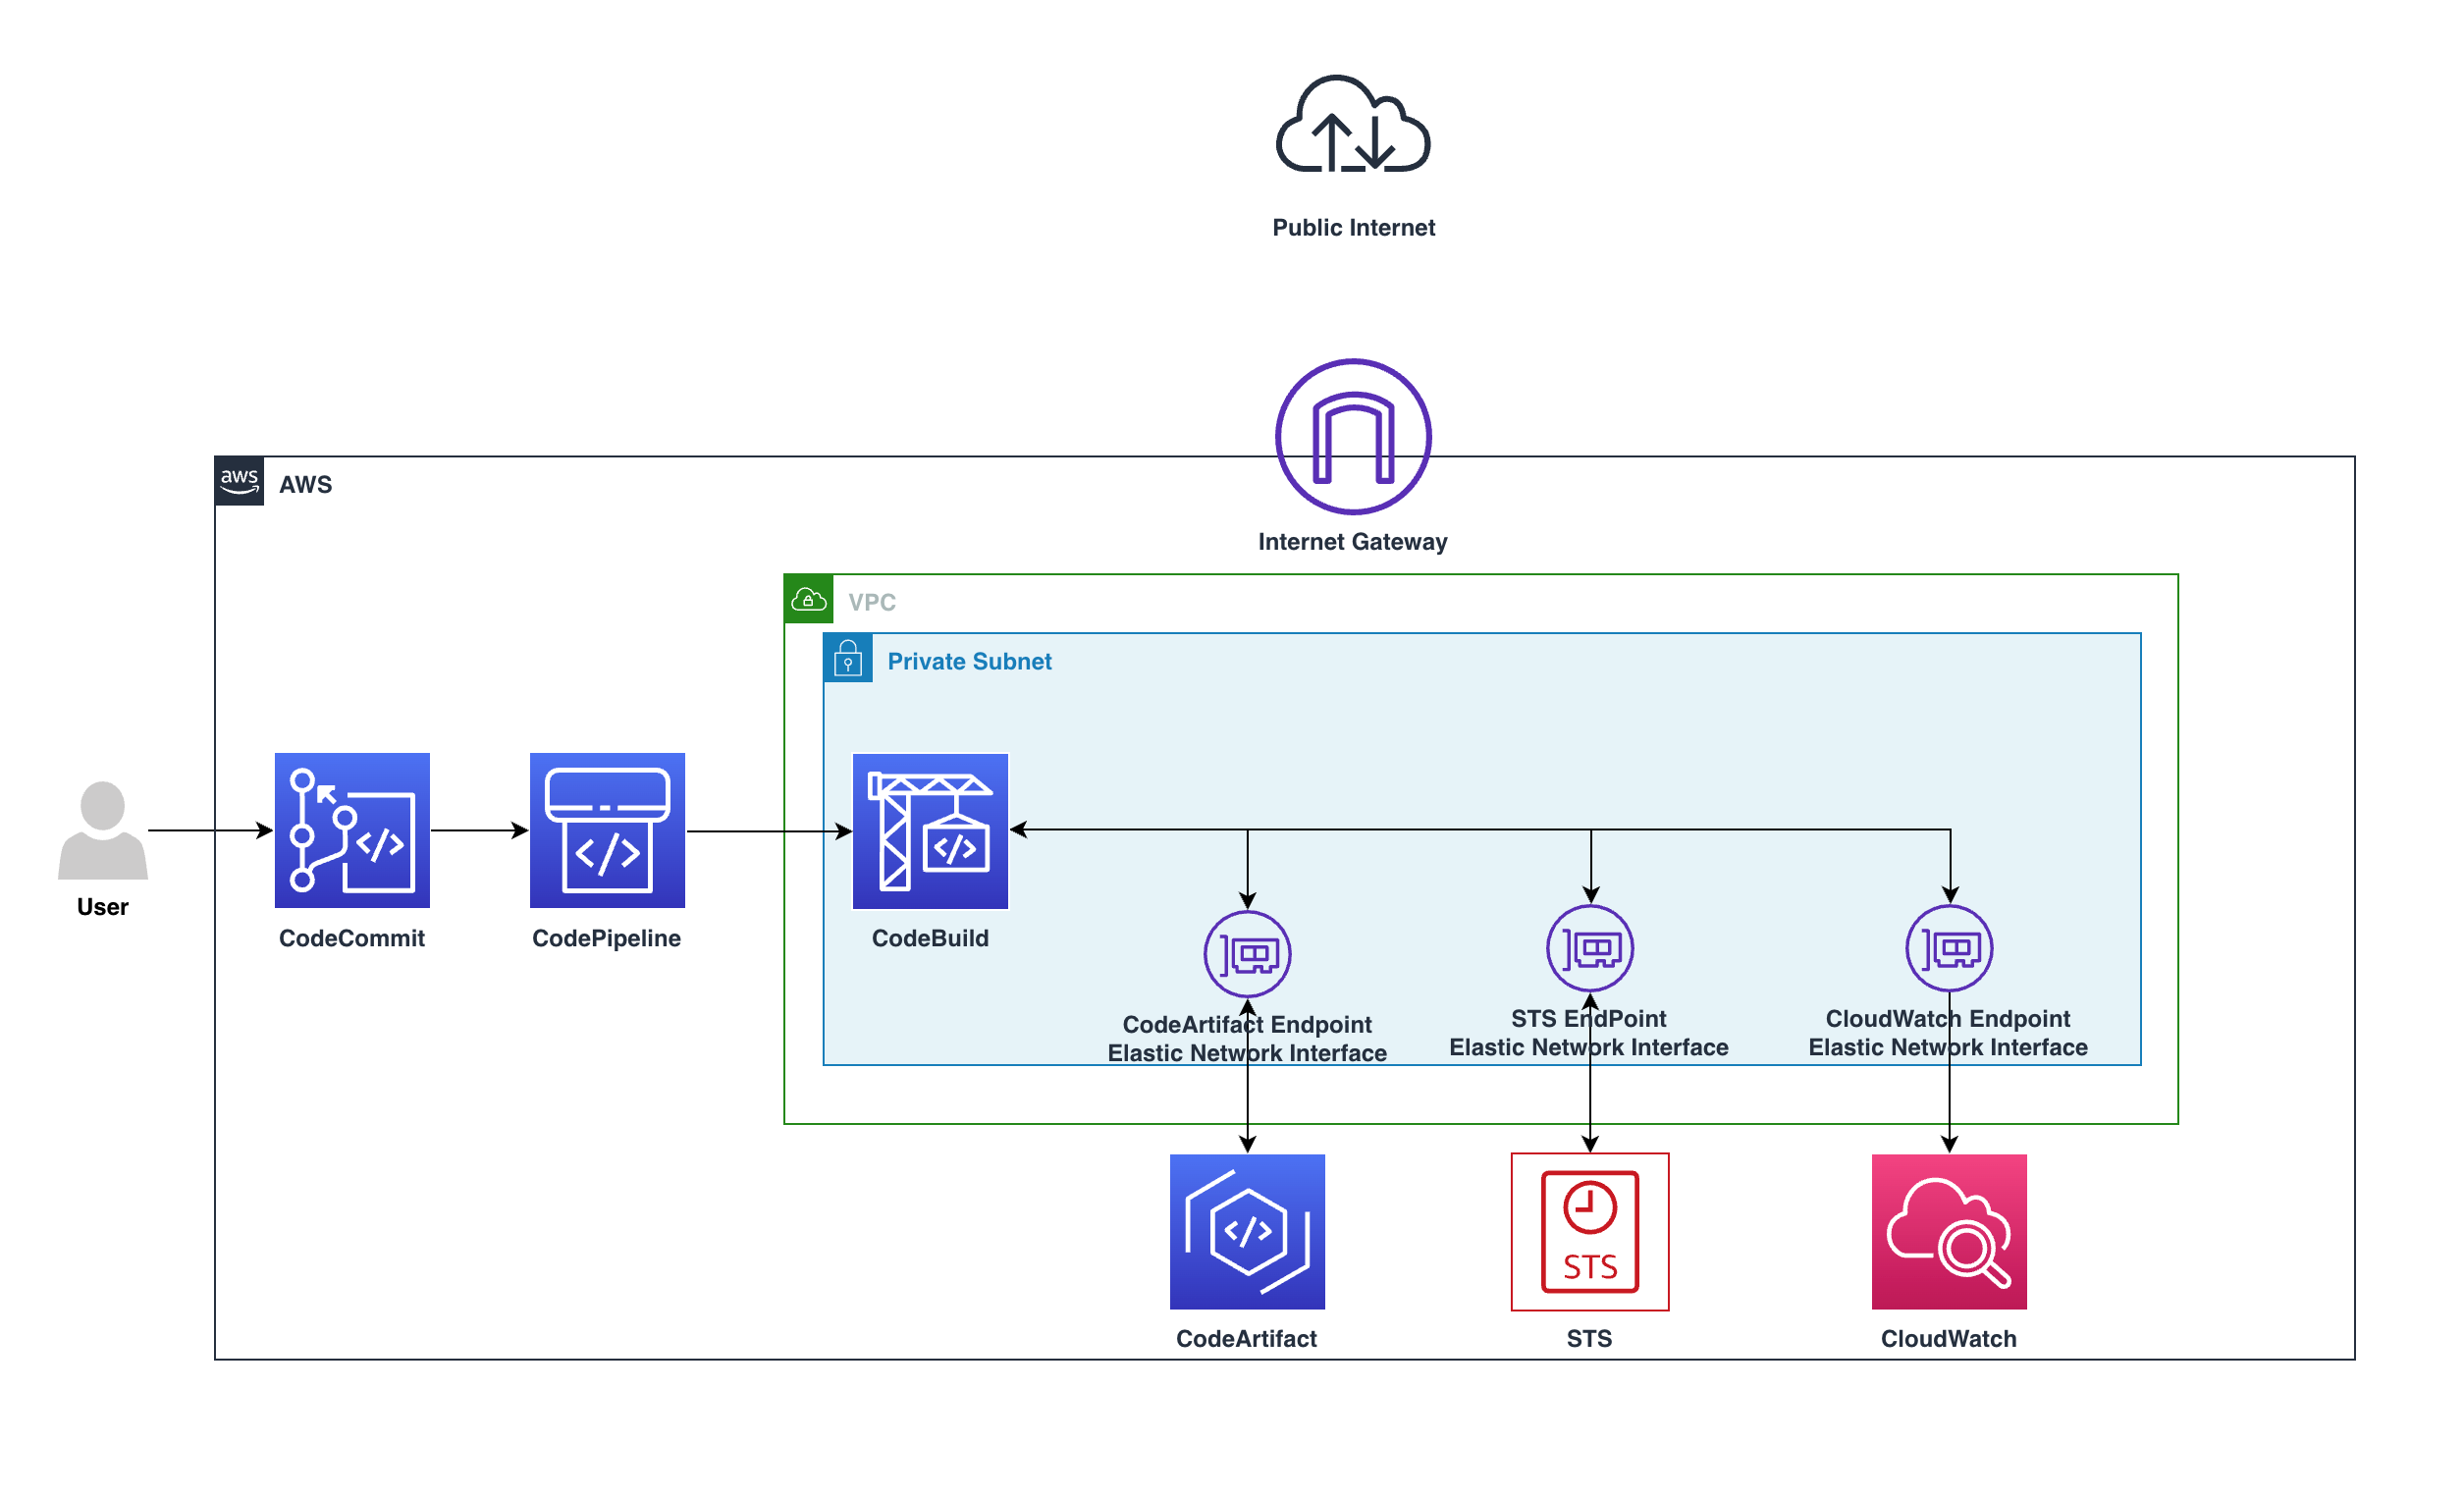
This architecture diagram shows the flow of the logs and metrics that will be utilized by Amazon Managed Grafana, starting with DevOps Guru and then using Amazon EventBridge to save the insight event logs to Amazon CloudWatch Log Group DevOps Guru service metrics to be parsed by Amazon Managed Grafana and create new dashboards in Grafana from these logs and Metrics.
Now we will walk you through how to do this and set up notifications to your operations team.
Prerequisites:
The following prerequisites are required for this walkthrough:
- An AWS Account
- Enabled DevOps Guru on your account with CloudFormation stack, or tagged resources monitored.
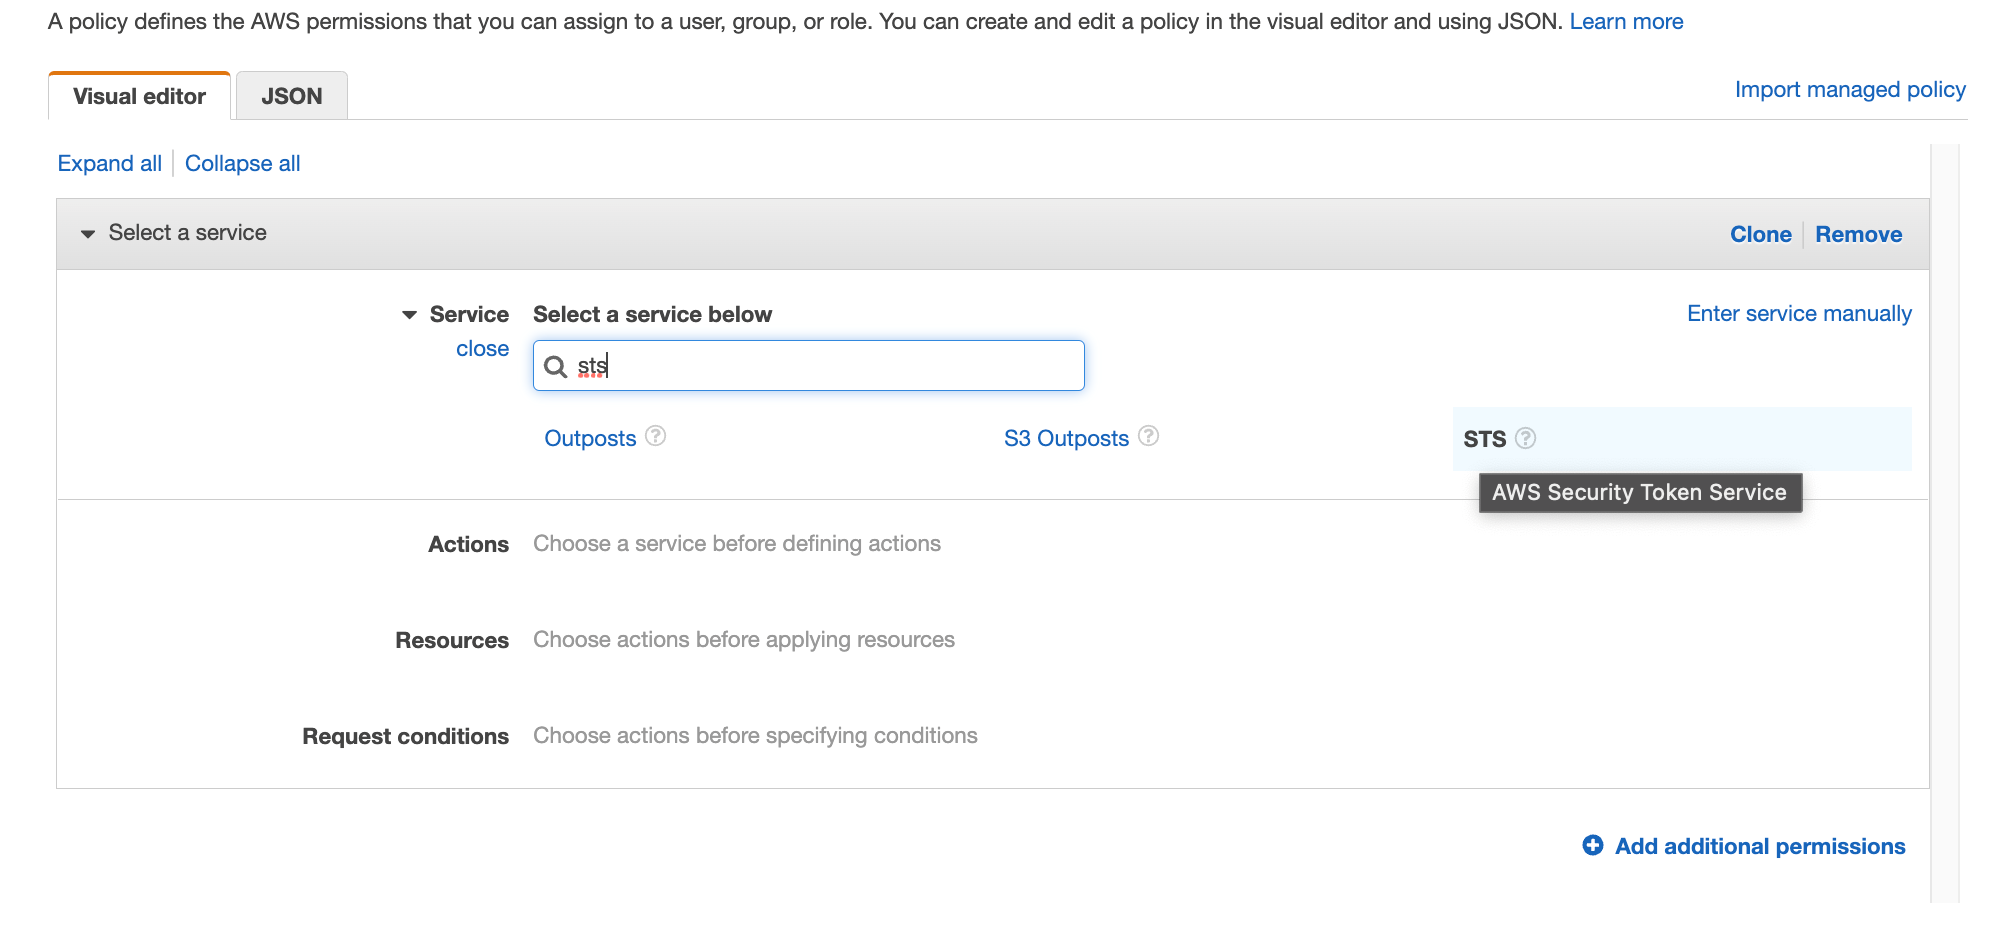
Using Amazon CloudWatch Metrics
DevOps Guru sends service metrics to CloudWatch Metrics. We will use these to track metrics for insights and metrics for your DevOps Guru usage; the DevOps Guru service reports the metrics to the AWS/DevOps-Guru namespace in CloudWatch by default.
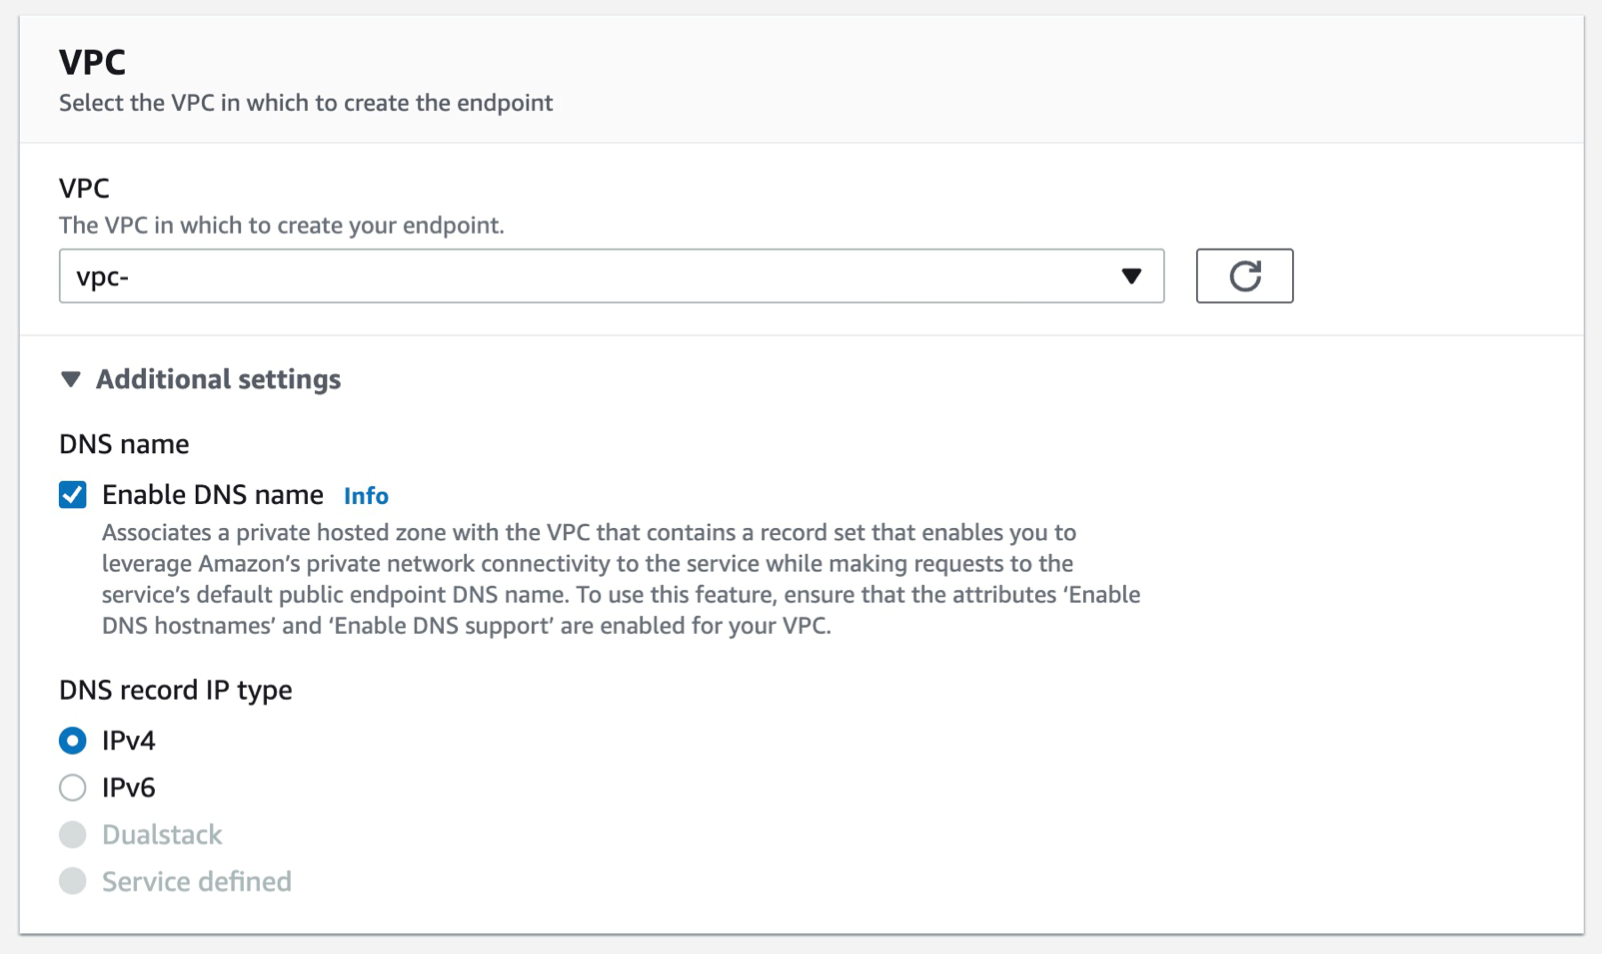
First, we will provision an Amazon Managed Grafana workspace and then create a Dashboard in the workspace that uses Amazon CloudWatch as a data source.
Setting up Amazon CloudWatch Metrics
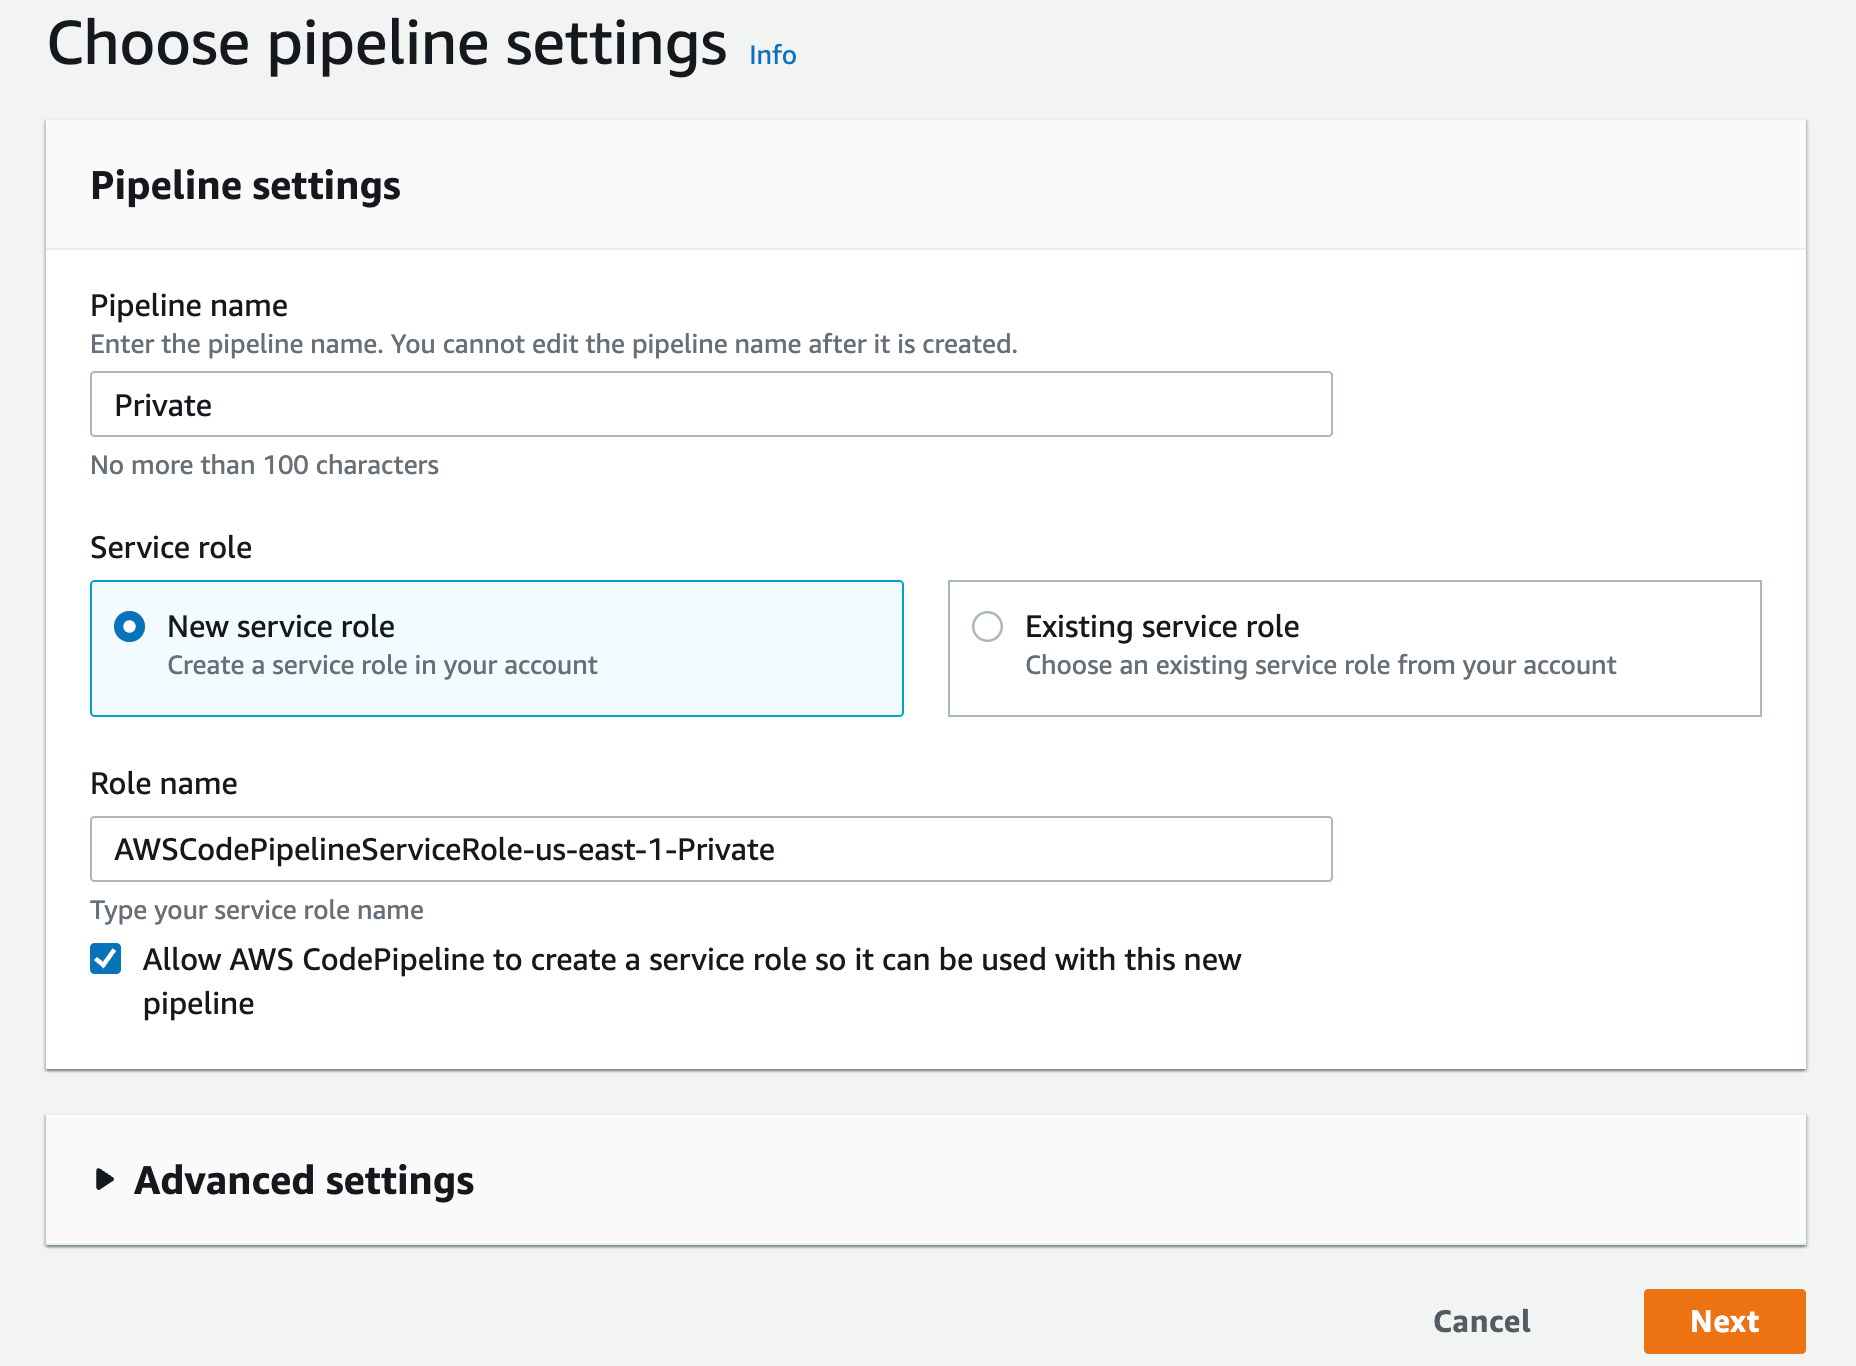
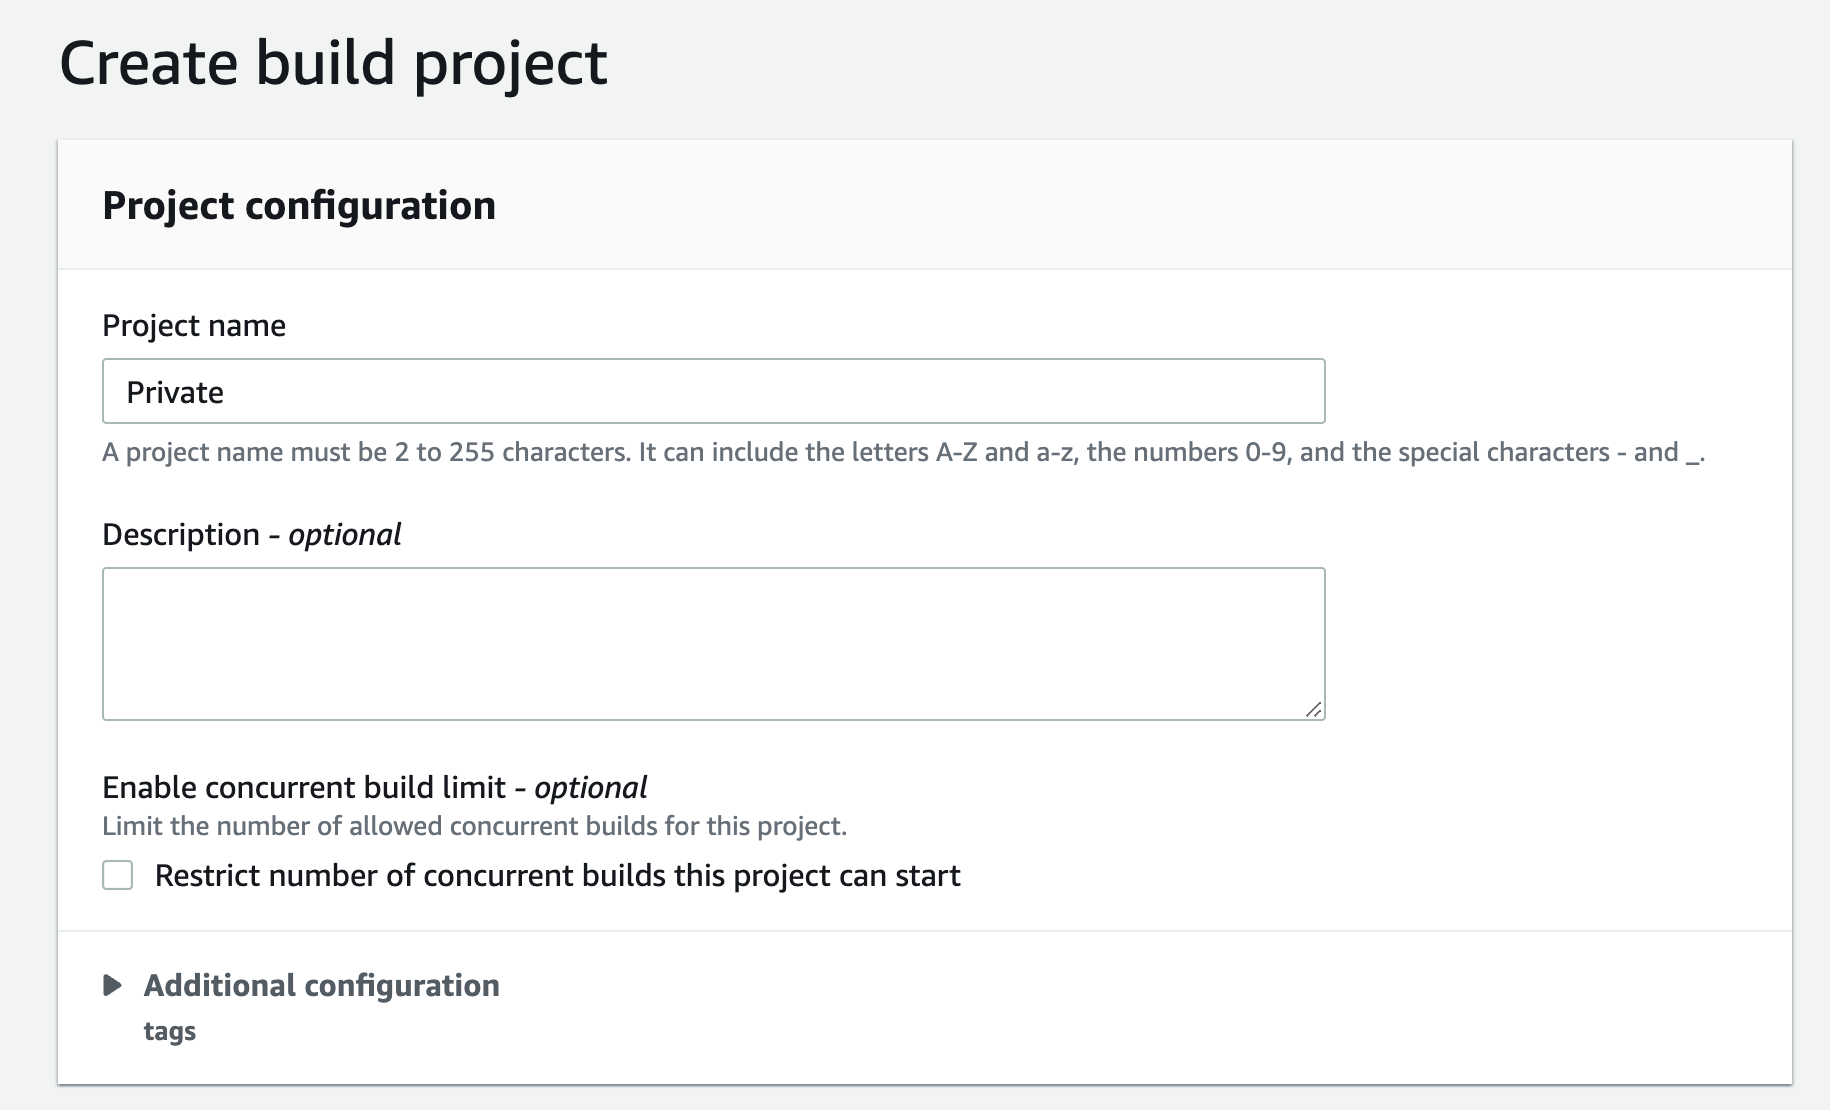
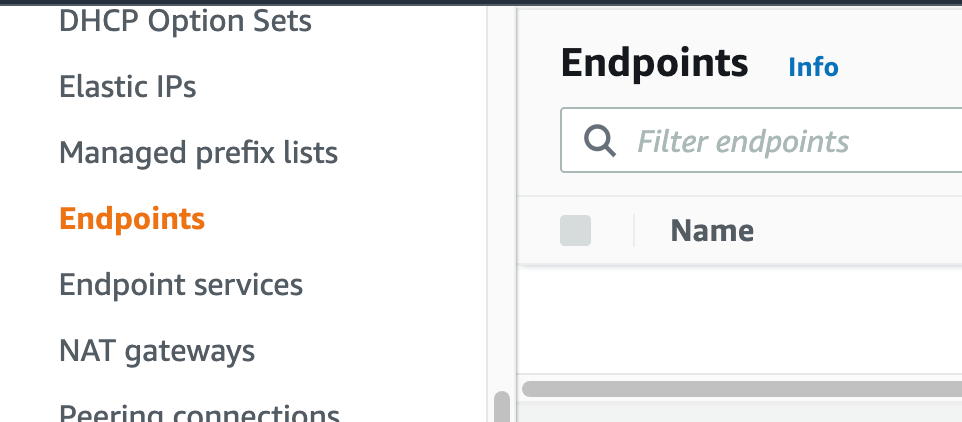
- Create Grafana Workspace
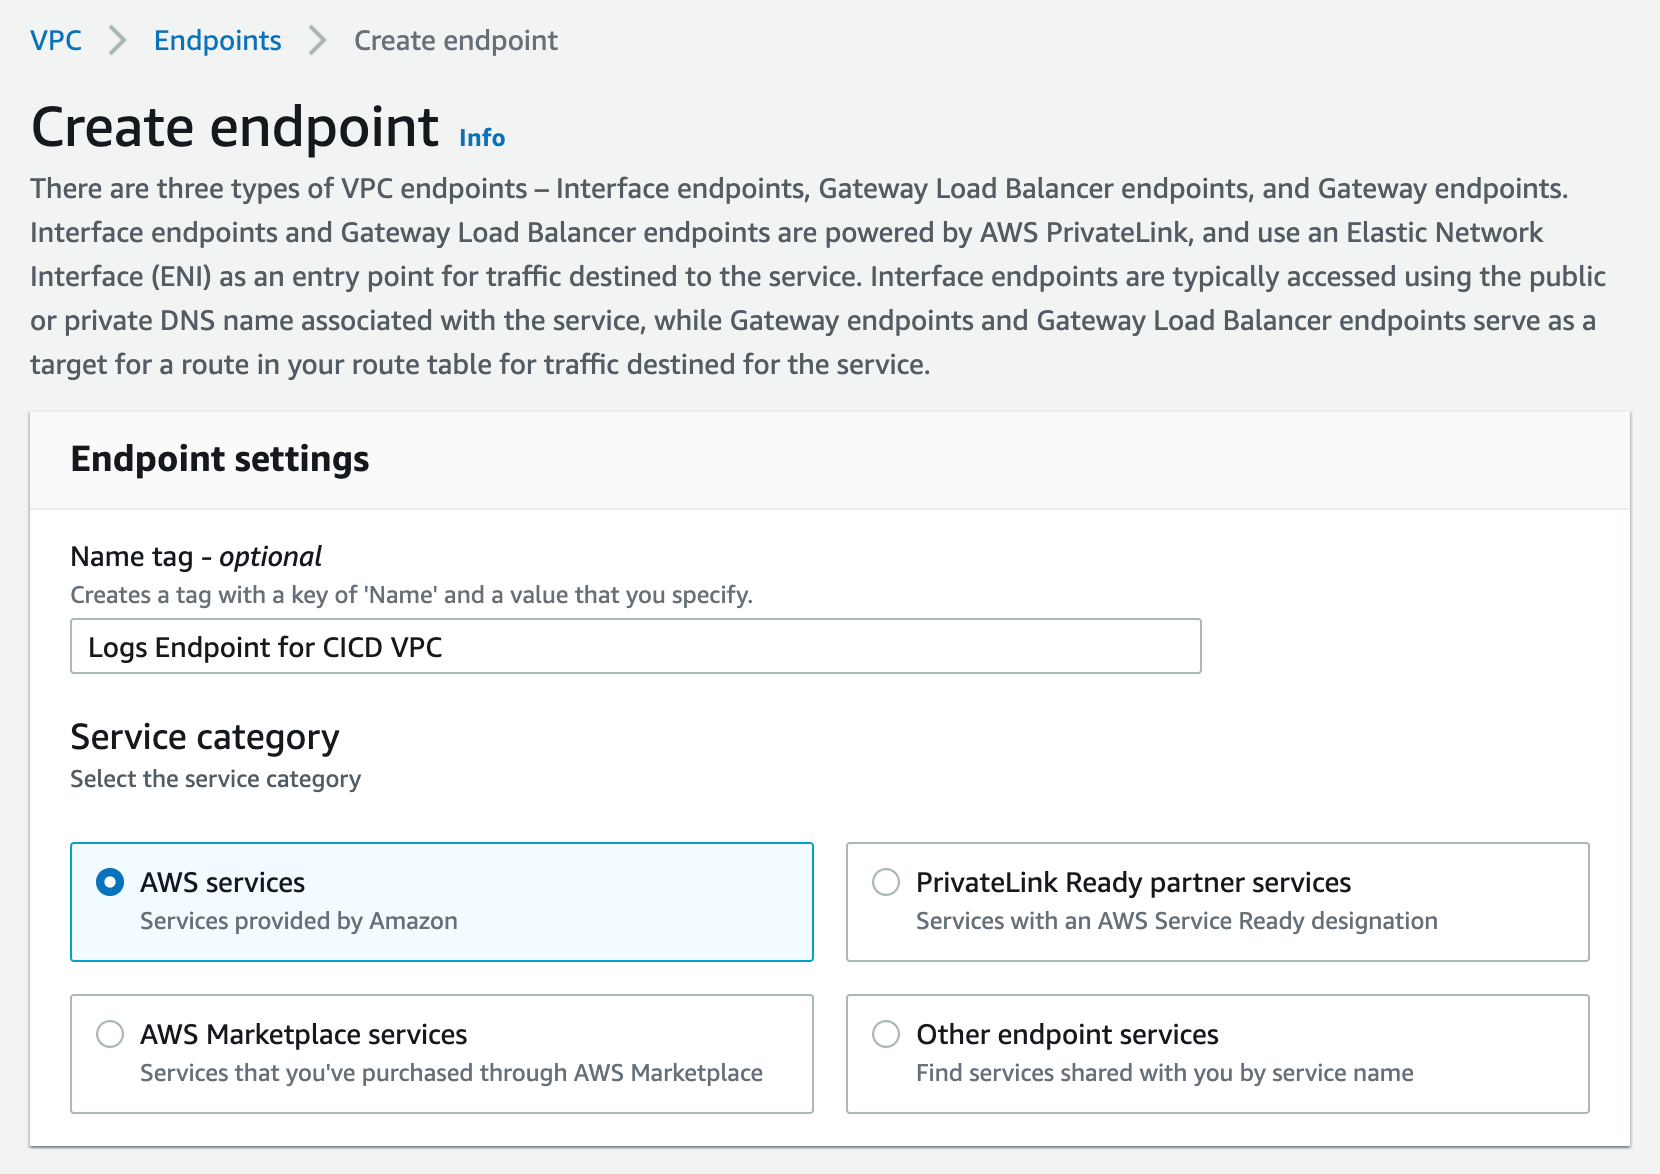
Navigate to Amazon Managed Grafana from AWS console, then click Create workspace
a. Select the Authentication mechanism
i. AWS IAM Identity Center (AWS SSO) or SAML v2 based Identity Providers
ii. Service Managed Permission or Customer Managed
iii. Choose Next
b. Under “Data sources and notification channels”, choose Amazon CloudWatch
c. Create the Service.
You can use this post for more information on how to create and configure the Grafana workspace with SAML based authentication.
Next, we will show you how to create a dashboard and parse the Logs and Metrics to display the DevOps Guru insights and recommendations.
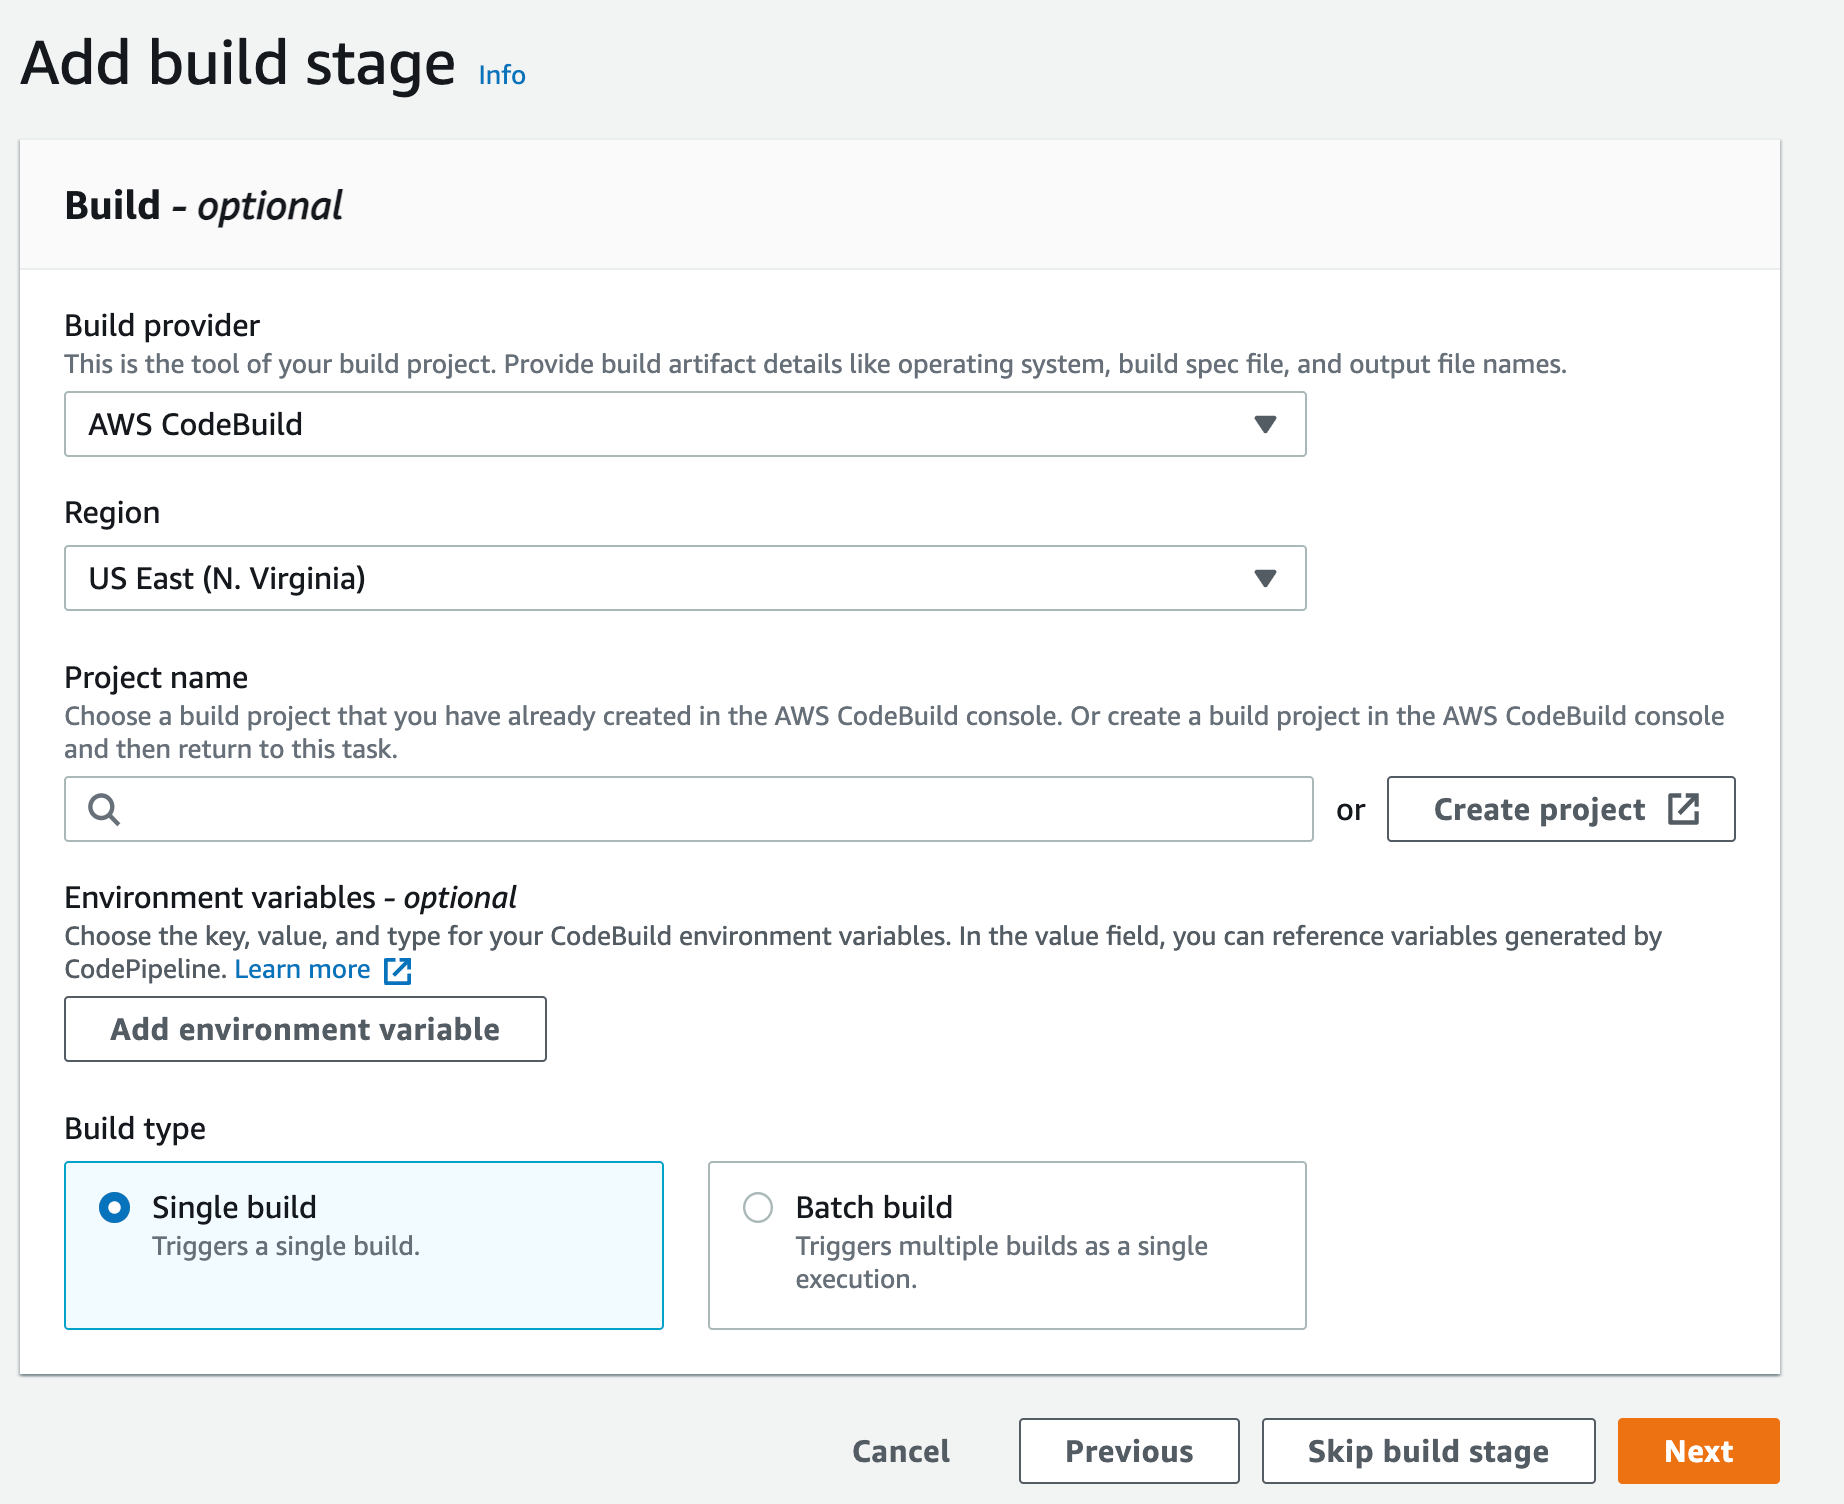
2. Configure Amazon Managed Grafana
a. Add CloudWatch as a data source:
From the left bar navigation menu, hover over AWS and select Data sources.
b. From the Services dropdown select and configure CloudWatch.
3. Create a Dashboard
a. From the left navigation bar, click on add a new Panel.
b. You will see a demo panel.
c. In the demo panel – Click on Data source and select Amazon CloudWatch.

d. For this panel we will use CloudWatch metrics to display the number of insights.
e. From Namespace select the AWS/DevOps-Guru name space, Insights as Metric name and Average for Statistics.

click apply

f. This is our first panel. We can change the panel name from the right-side bar under Title. We will name this panel “Insights”
g. From the top right menu, click save dashboard and give your new dashboard a name
Using Amazon CloudWatch Logs via Amazon EventBridge
For other insights outside of the service metrics, such as a number of insights per specific service or the average for a region or for a specific AWS account, we will need to parse the event logs. These logs first need to be sent to Amazon CloudWatch Logs. We will go over the details on how to set this up and how we can parse these logs in Amazon Managed Grafana using CloudWatch Logs Query Syntax. In this post, we will show a couple of examples. For more details, please check out this User Guide documentation. This is not done by default and we will need to use Amazon EventBridge to pass these logs to CloudWatch.
DevOps Guru logs include other details that can be helpful when building Dashboards, such as region, Insight Severity (High, Medium, or Low), associated resources, and DevOps guru dashboard URL, among other things. For more information, please check out this User Guide documentation.
EventBridge offers a serverless event bus that helps you receive, filter, transform, route, and deliver events. It provides one to many messaging solutions to support decoupled architectures, and it is easy to integrate with AWS Services and 3rd-party tools. Using Amazon EventBridge with DevOps Guru provides a solution that is easy to extend to create a ticketing system through integrations with ServiceNow, Jira, and other tools. It also makes it easy to set up alert systems through integrations with PagerDuty, Slack, and more.
Setting up Amazon CloudWatch Logs
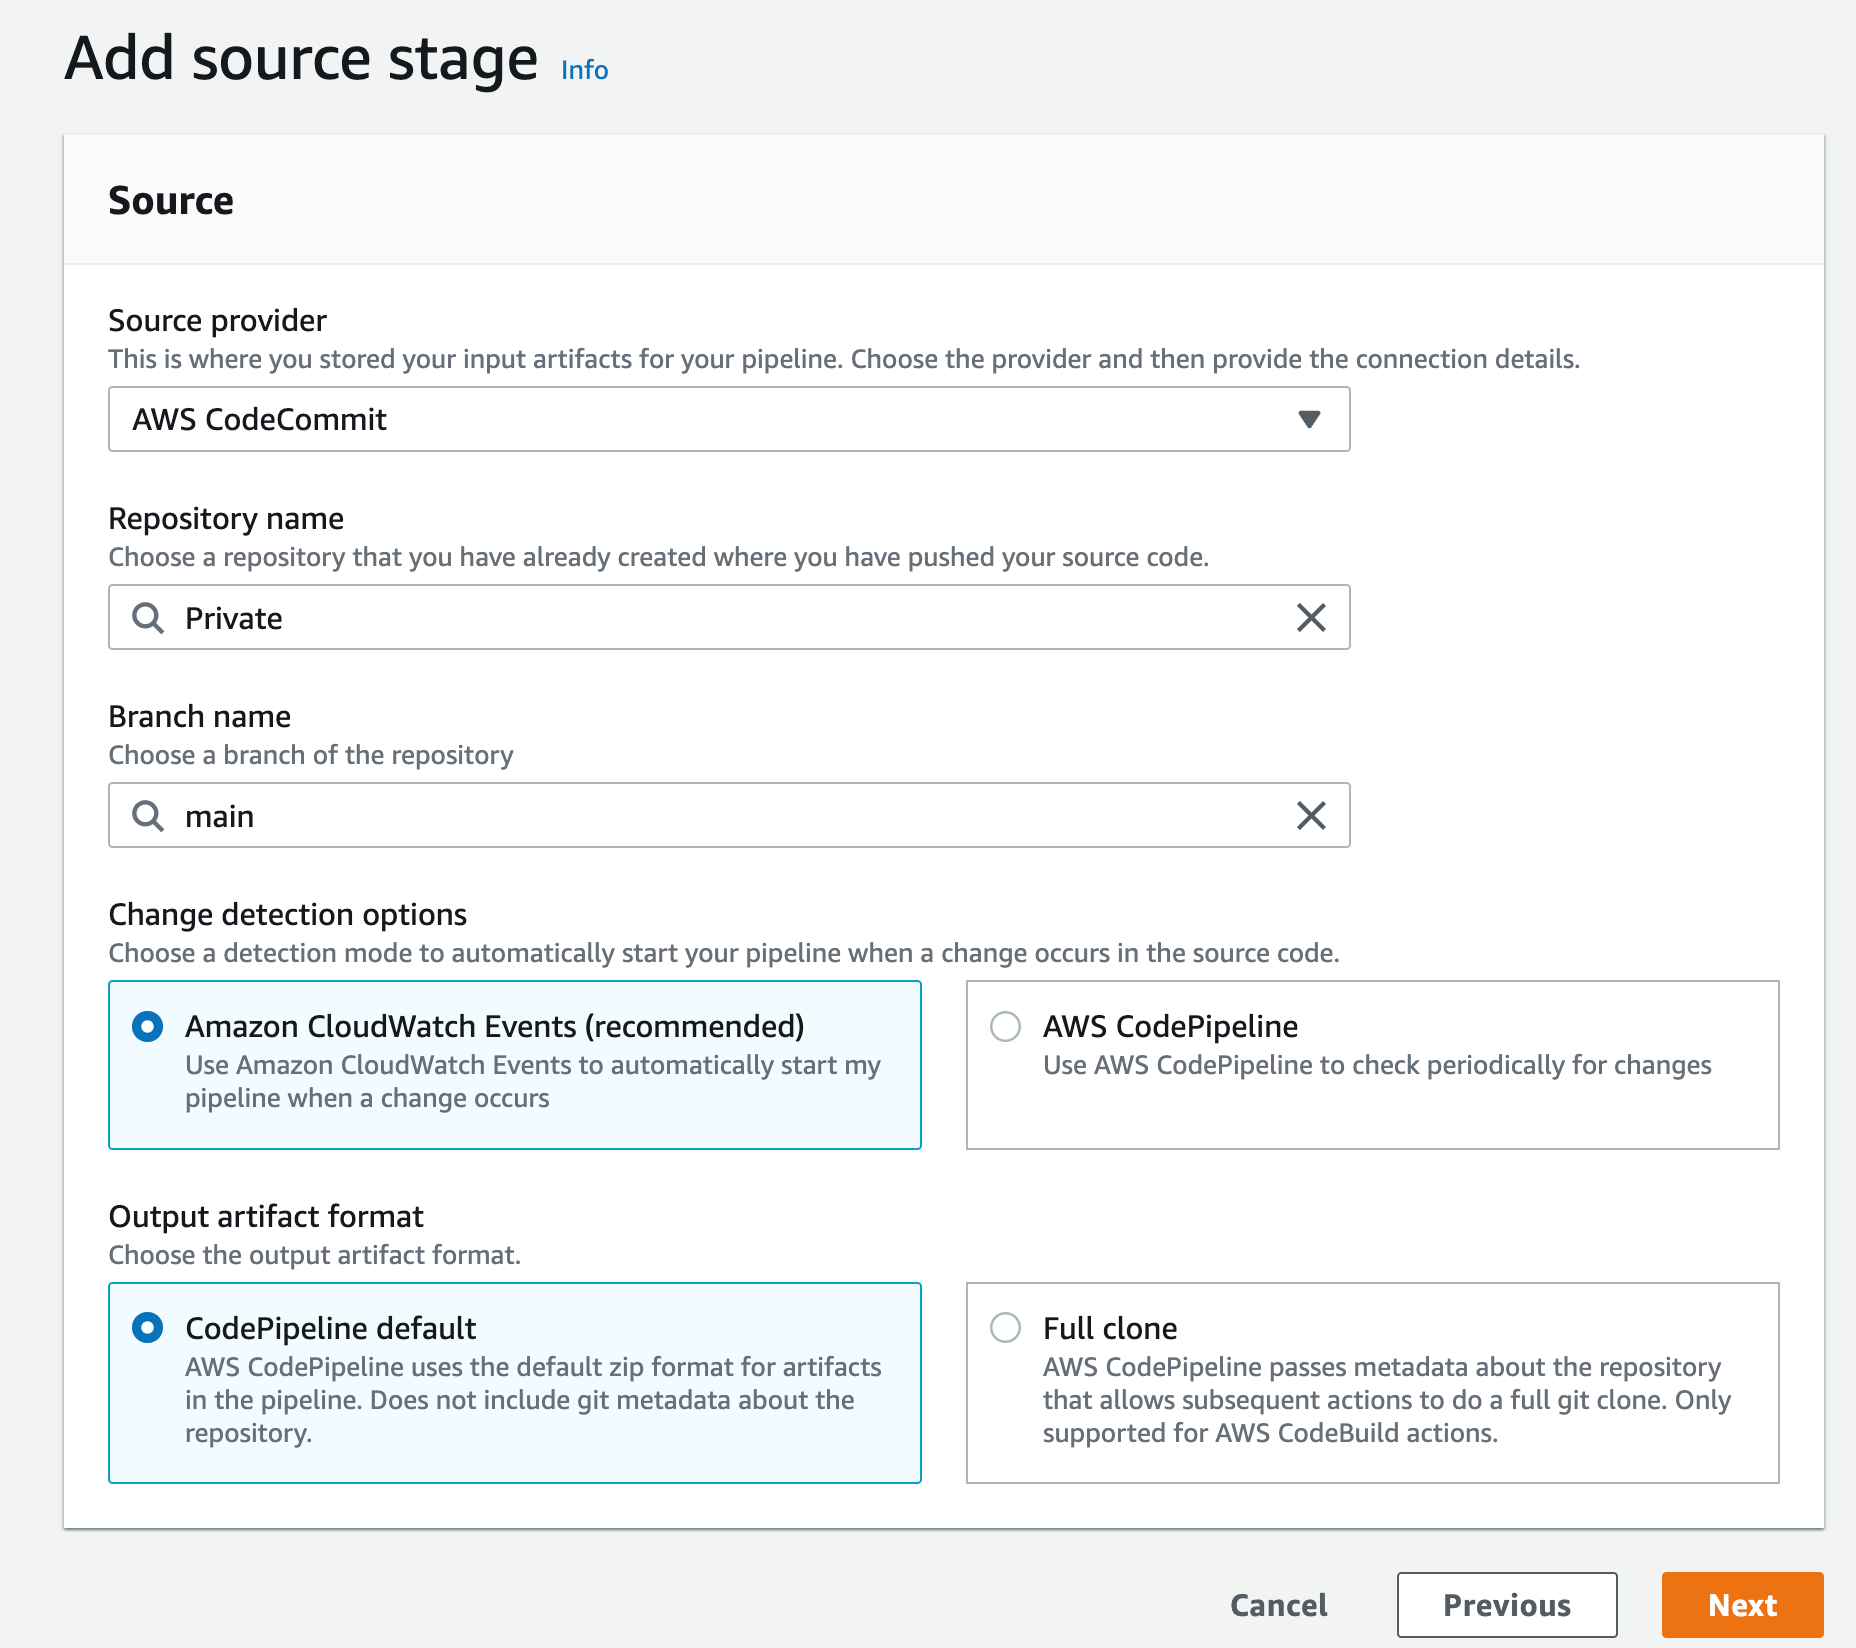
- Let’s dive in to creating the EventBridge rule and enhance our Grafana dashboard:
a. First head to Amazon EventBridge in the AWS console.
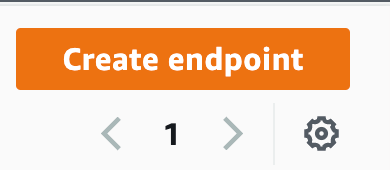
b. Click Create rule.
Type in rule Name and Description. You can leave the Event bus to default and Rule type to Rule with an event pattern.
c. Select AWS events or EventBridge partner events.
For event Pattern change to Customer patterns (JSON editor) and use:
{"source": ["aws.devops-guru"]}This filters for all events generated from DevOps Guru. You can use the same mechanism to filter out specific messages such as new insights, or insights closed to a different channel. For this demonstration, let’s consider extracting all events.
![As the user configures their EventBridge Rule, for the Creation method they have chosen "Custom pattern (JSON editor) write an event pattern in JSON." For the Event pattern editor just below they have entered {"source":["aws.devops-guru"]}](https://d2908q01vomqb2.cloudfront.net/7719a1c782a1ba91c031a682a0a2f8658209adbf/2023/04/19/eventbridge.png)
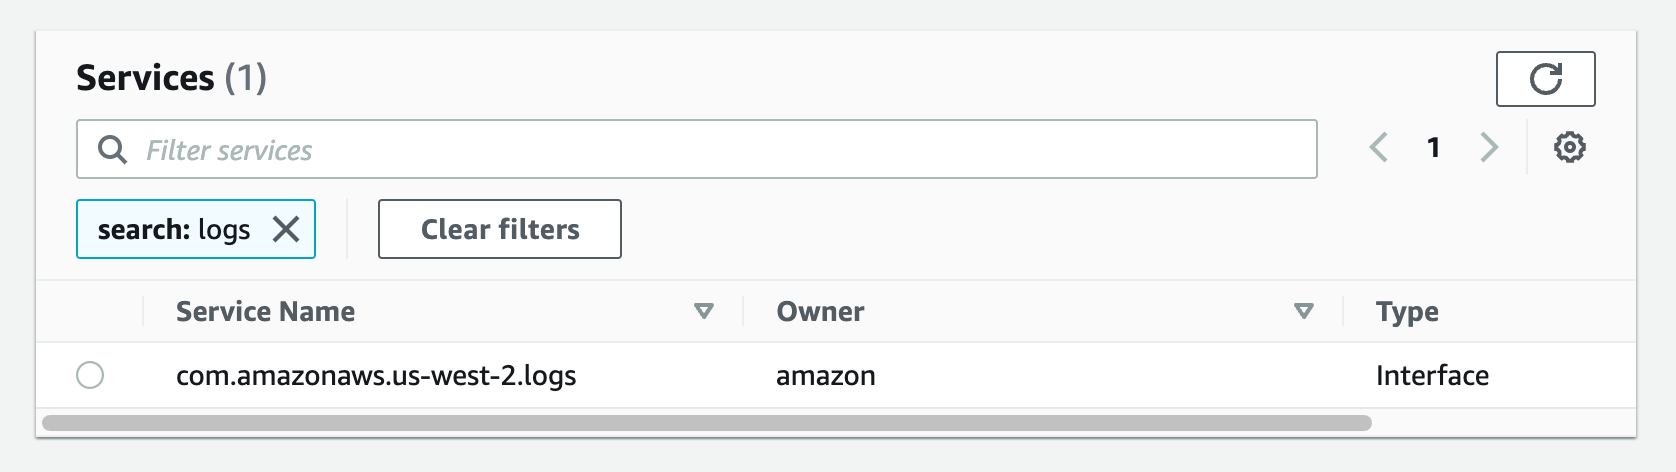
d. Next, for Target, select AWS service.
Then use CloudWatch log Group.
For the Log Group, give your group a name, such as “devops-guru”.

e. Click Create rule.
f. Navigate back to Amazon Managed Grafana.
It’s time to add a couple more additional Panels to our dashboard. Click Add panel.
Then Select Amazon CloudWatch, and change from metrics to CloudWatch Logs and select the Log Group we created previously.

g. For the query use the following to get the number of closed insights:
You’ll see the new dashboard get updated with “Data is missing a time field”.

You can either open the suggestions and select a gauge that makes sense;

Or choose from multiple visualization options.
Now we have 2 panels:

h. You can repeat the same process. To create 3rd panel for the new insights using this query:
Now we have 3 panels:

Next, depending on the visualizations, you can work with the Logs and metrics data types to parse and filter the data.

i. For our fourth panel, we will add DevOps Guru dashboard direct link to the AWS Console.
Repeat the same process as demonstrated previously one more time with this query:
Switch to table when prompted on the panel.

This will give us a direct link to the DevOps Guru dashboard and help us get to the insight details and Recommendations.

Save your dashboard.
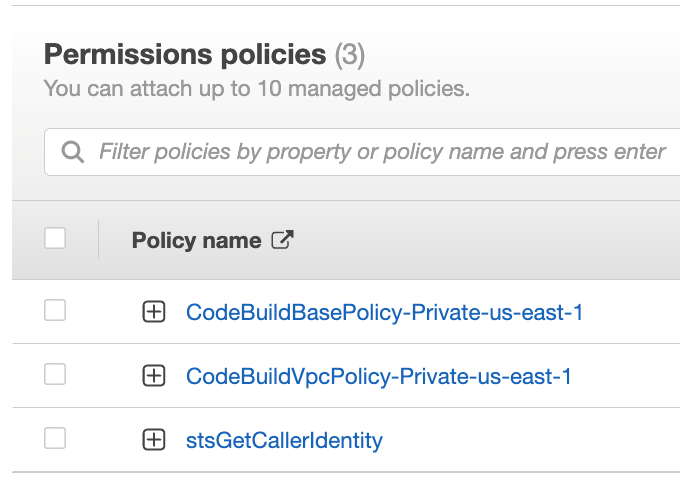
- You can extend observability by sending notifications through alerts on dashboards of panels providing metrics. The alerts will be triggered when a condition is met. The Alerts are communicated with Amazon SNS notification mechanism. This is our SNS notification channel setup.

A previously created notification is used next to communicate any alerts when the condition is met across the metrics being observed.

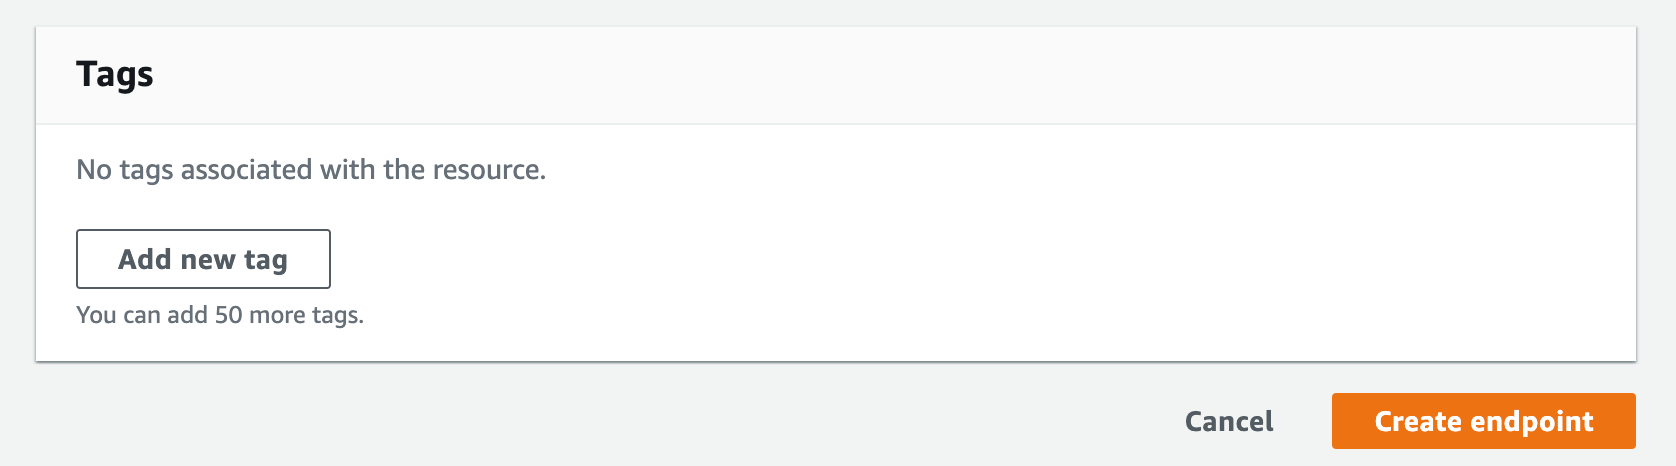
Cleanup
To avoid incurring future charges, delete the resources.
- Navigate to EventBridge in AWS console and delete the rule created in step 4 (a-e) “devops-guru”.
- Navigate to CloudWatch logs in AWS console and delete the log group created as results of step 4 (a-e) named “devops-guru”.
- Amazon Managed Grafana: Navigate to Amazon Managed Grafana service and delete the Grafana services you created in step 1.
Conclusion
In this post, we have demonstrated how to successfully incorporate Amazon DevOps Guru insights into Amazon Managed Grafana and use Grafana as the observability tool. This will allow Operations team to successfully observe the state of their AWS resources and notify them through Alarms on any preset thresholds on DevOps Guru metrics and logs. You can expand on this to create other panels and dashboards specific to your needs. If you don’t have DevOps Guru, you can start monitoring your AWS applications with AWS DevOps Guru today using this link.
[1] https://www.atlassian.com/incident-management/kpis/cost-of-downtime
About the authors: