[$] Governing GNOMEs: how the project’s technical decision-making is evolving

Post Syndicated from jzb original https://lwn.net/Articles/1091619/

Emmanuele Bassi kicked off a project to improve GNOME’s technical governance
with a presentation about his
ideas
(video) at
GUADEC 2025. His nudging
has led the project to, slowly, work on creating more formal structures for
technical governance. It is adopting a teams structure and looking toward
creating a steering committee, as well as bootstrapping a Request for Comments
(RFC) process. If adopted, GNOME would require RFCs for design, user experience,
architectural, and other changes that carry a major impact on the project.

Incus 7.4 released

Post Syndicated from jzb original https://lwn.net/Articles/1092229/

Version
7.4
of the Incus container and virtual-machine management system has been
released. Notable changes in this release include UEFI Secure Boot key
management, “near-live” migration of containers between Incus instances, as well
as burst I/O limits for disk and network
devices.

Security updates for Wednesday

Post Syndicated from jzb original https://lwn.net/Articles/1092149/

Security updates have been issued by AlmaLinux (dbus-broker, freerdp, gegl, gegl04, gimp, gimp:2.8, glib2, grafana, gzip, iperf3, libssh, nodejs22, nodejs24, nodejs:22, nodejs:24, php:7.4, php:8.2, pipewire, ruby:3.3, ruby:4.0, tar, wget, and xmlrpc-c), Debian (cyrus-imapd, keystone, and lemonldap-ng), Fedora (bubblewrap, cockpit, emacs, gdk-pixbuf2, openssl, openvkl, python-linkify-it-py, python-llm, and rkcommon), Gentoo (Chromium, Google Chrome, Microsoft Edge, Opera, Vivaldi), Oracle (glib2, gzip, mingw-sqlite, nodejs22, xorg-x11-server, and xorg-x11-server-Xwayland), Red Hat (go-toolset:rhel8, golang, and grafana), Slackware (pcre2), SUSE (apache2-mod_auth_openidc, busybox, cups-filters, java-17-openj9, java-1_8_0-openj9, libapr-util1, libgcrypt, python-sqlparse, python3-sqlparse, python313-uv, terraform-provider-aws, terraform-provider-azurerm, terraform-provider-external, terraform-provider-google, terraform-provider-helm, terraform-provider-kubernetes, terraform-provid, ucode-intel, wicked, and yast2-auth-client), and Ubuntu (libevent, libgcrypt20, ncurses, opencryptoki, pam, pyasn1, rust-sudo-rs, and ubuntu-advantage-tools).

Wireless Routers as Motion Detectors

Post Syndicated from Bruce Schneier original https://www.schneier.com/blog/archives/2026/09/wireless-routers-as-motion-detectors.html

Comcast has added motion detection as a feature to its wireless routers:

The feature sends push notifications to users when motion is detected near a connected device, such as a TV or printer. It has different settings for when people are home, asleep, or away. The Xfinity app also lets users see live motion activity and a feed of recent activity.

Comcast acknowledges that the system has some limitations. Home size, layout, building materials, and the placement of the router and connected devices can all affect its ability to detect motion. Comcast says it does not guarantee its performance.

Sounds like a great surveillance tool. And also:

But the biggest privacy concern comes directly from Comcast’s own support page, which says information generated by WiFi Motion may be shared with third parties.

“Comcast may disclose information generated by your WiFi Motion to third parties without further notice to you in connection with any law enforcement investigation or proceeding, any dispute to which Comcast is a party, or pursuant to a court order or subpoena,” the page reads.

A note from LWN

Post Syndicated from corbet original https://lwn.net/Articles/1090585/

The online publication industry, as a whole, is struggling, with challenges
coming from multiple directions. Thanks to the support of all of you, our
readers, LWN would appear to be doing better than most. But the world has
changed around us and, in particular, prices have changed considerably. By
now, you probably know where this is going: subscription prices at LWN will
be increasing as of September 15.

What’s the Scam?

Post Syndicated from Bruce Schneier original https://www.schneier.com/blog/archives/2026/09/whats-the-scam.html

To subscribe to my monthly email newsletter, you have to enter your information on the webpage, and then reply to an automatically generated email. This is, of course, to prevent people from subscribing addresses other than their own.

Starting last weekend, I have been receiving a lot of individual responses to those emails. Always one line:

Thank you for the positive impact your emails have had on my life.
Your emails are a game-changer.
Your emails are a constant reminder of why I subscribed.
Your emails rock.
Thank you for the time and effort you put into creating these informative emails.
Thank you for the passion and enthusiasm you infuse into your email content.
Your emails consistently exceed my expectations. Thank you for the exceptional value!

I responded to the first few, because sometimes I do get these nice emails from readers and I hadn’t yet realized it was all fake. But so many, and all at once—this is obviously AI. And obviously a scam, except I can’t figure out what the scam is.

The addresses are things like:

[email protected]
[email protected]
[email protected]
[email protected]
[email protected]
[email protected]

All Gmail. None of the addresses has actually subscribed to Crypto-Gram. They could; whoever is sending the emails could easily have confirmed the subscription.

My first thought was pig butchering—wanting me to respond and turn this into a conversation—but no one has responded to any of my responses. Anyone have any idea?

NVIDIA and Mediatek Ink $3.5B Investment Deal, Accelerate NVLink Fusion Adoption

Post Syndicated from Ryan Smith original https://www.servethehome.com/nvidia-and-mediatek-ink-3-5b-investment-deal-accelerate-nvlink-fusion-adoption/

NVIDIA and MediaTek have inked a new deal this week that more closely ties together the two companies financially and technologically. With NVIDIA investing $3.5B into the Taiwanese fabless chip designer, MediaTek will now offer the NVLink Fusion platform to customers designing custom XPUs at MediaTek

The post NVIDIA and Mediatek Ink $3.5B Investment Deal, Accelerate NVLink Fusion Adoption appeared first on ServeTheHome.

Leaked Russian Cyber-Operations Training Materials

Post Syndicated from Bruce Schneier original https://www.schneier.com/blog/archives/2026/09/leaked-russian-cyber-operations-training-materials.html

This is interesting:

The records describe a force-generation mechanism for several General Staff components, including the GRU, Main Operational Directorate, and 8th Directorate, which is associated with protected communications, cryptography, and information security.

[…]

The reporting also linked a 2024 Department No. 4 graduate, Aleksei Kondrashov, to Military Unit 74455, widely known as Sandworm.

That unit has been associated with destructive cyber activity against Ukraine and other targets, including the 2017 NotPetya attack.

The reports do not establish that every listed graduate participated in a named operation; assignments should therefore be described as reported unit placements, not proof of individual operational involvement.

The Bauman material reframes Russia’s cyber capability as an institutional system, not merely a collection of well-known threat groups.

It suggests that Moscow has formalized a recurring pathway from university recruitment to military service, where students receive supervised technical and ideological preparation before entering intelligence, cyber, and security roles.

For defenders, the leak reinforces the need to track Russian operations as a combined threat: espionage, destructive activity, military reconnaissance, technical surveillance, and influence campaigns may draw on related personnel pipelines and overlapping doctrine.

The exposure of Department No. 4 also provides researchers with a clearer lens for understanding how the GRU sustains cyber capacity beyond the familiar APT28 and Sandworm brand names.

Observing and evaluating production agents using OpenSearch Agent Health

Post Syndicated from Ulrich Hinze original https://aws.amazon.com/blogs/big-data/observing-and-evaluating-production-agents-using-opensearch-agent-health/

As AI agents are moving from experimental prototypes to production workloads, teams need visibility into what agents are doing and a systematic way to measure whether they’re doing it well. Traditional testing methodologies like unit and integration tests fall short for this task, as measuring an agent’s quality isn’t a straightforward true/false decision. Instead, agent observability and evaluations (evals for short) provide a two-legged solution to this problem. Agent observability captures the details of an agent’s behavior, and evals compare this behavior to the behavior that you want. With this approach, teams can monitor their agent’s quality over time and introduce agent-specific quality gates in their software development lifecycle.

In this post, we show how to combine an AI agent running on AWS with OpenSearch Agent Health for observability and evals. You will deploy an agent and its observability data pipeline to AWS, then use Agent Health as a local development tool connecting to your cloud resources.

Overview of solution

Agent observability and evaluations rely on OpenTelemetry traces to understand agent behavior. Traces describe the flow of a request through components of a system. OpenSearch Agent Health is a purpose-built tool for analyzing agent traces and running evaluations against an agent for quality control. Although Agent Health works with any open source OpenSearch installation, many AWS customers choose Amazon OpenSearch Ingestion and Amazon OpenSearch Service for ingesting and storing their OpenTelemetry data. You can connect OpenSearch Agent Health to these AWS resources to fetch live data and store its own configuration and evaluation history.

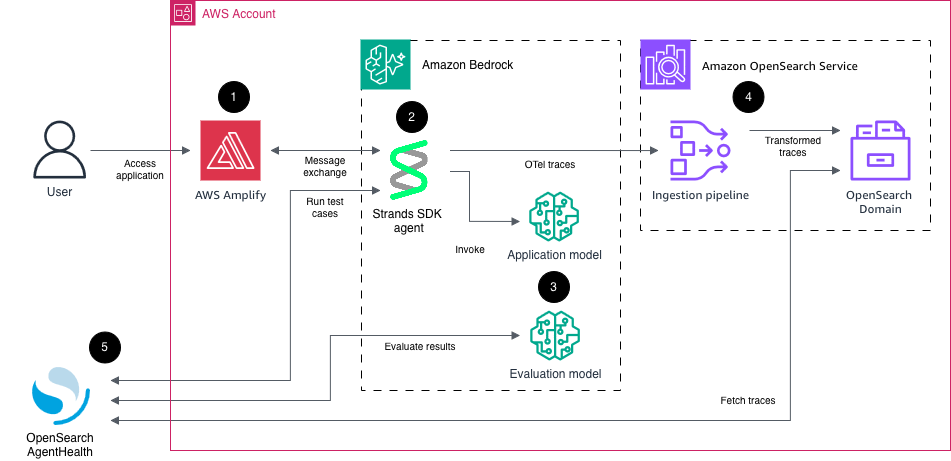
The following diagram shows the overall architecture of the solution presented in this post: Architecture diagram showing the agent, Amazon OpenSearch Ingestion, Amazon OpenSearch Service, and OpenSearch Agent Health observability and evaluation flow

Figure 1: Solution overview

The individual parts are:

  1. AWS Amplify for hosting an assistant-ui chat interface. Connects to the agent backend using the Agent-User Interaction (AG-UI) protocol.
  2. Sample ecommerce AI agent using Strands Agents SDK, deployed to Amazon Bedrock AgentCore runtime, exposing an AG-UI Server-Sent Events (SSE) endpoint. This agent has access to multiple tools, such as product search and shopping basket operations. For this sample project, the tool calls are all simulated within the agent runtime rather than including API calls to other systems. The agent emits messages, reasoning steps, and tool calls as OpenTelemetry traces.
  3. Large language models (LLMs) on Amazon Bedrock. One model (Amazon Nova 2 Lite) is used to power the agent, the other model (Anthropic Claude Opus 4.6) is used to evaluate the agent behavior.
  4. Amazon OpenSearch Ingestion for collecting and transforming the raw agent traces and loading them into an Amazon OpenSearch Service domain. Agent traces have the same structure as regular OpenTelemetry traces, with the addition of generative AI semantics (for example, tool calls and token usage). This means a regular OpenTelemetry pipeline configuration can be used to process agent traces.
  5. OpenSearch Agent Health for analyzing traces and running evaluation test cases and benchmarks against the agent. Agent Health uses the same AG-UI endpoint as the front-end application. It authenticates to the application, to Amazon Bedrock for model functionality, and to Amazon OpenSearch Service using AWS SigV4 authentication.

Walkthrough

In this walkthrough, we showcase how you can use Agent Health and Strands to measure and improve your agent’s quality over time.

We follow these steps:

  • Deploy solution to AWS and test the application.
  • Start Agent Health locally and connect it to cloud resources.
  • Explore agent traces and run evaluations.

We have created a GitHub repository for you to follow along.

Prerequisites

For this walkthrough, you should have the following prerequisites:

  • An AWS account
  • Git
  • Node.js
  • AWS Cloud Development Kit (AWS CDK)

Deploy solution to AWS and test the application

In this section, you check out the repository and deploy the infrastructure to AWS. Be aware that these steps create AWS resources that incur cost. We cover cleanup steps at the end of this post.

First, clone the repository to a local directory:

git clone https://github.com/aws-samples/sample-agent-health-with-amazon-opensearch-service && cd sample-agent-health-with-amazon-opensearch-service

Switch to the infra folder and install dependencies:

cd infra && npm install

Before you can start the deployment, determine the AWS Identity and Access Management (IAM) user or role that you will use to start Agent Health later on. In many cases, this will be the same role that you use to deploy the infrastructure. Set this ARN in your environment by issuing the following command:

export AGENT_HEALTH_READER_ARN=arn:aws:iam::<YOUR_ACCOUNT_ID>:role/<YOUR_ROLE_NAME>

Bootstrap your AWS account for use with AWS CDK:

cdk bootstrap -c agentHealthReaderArn=$AGENT_HEALTH_READER_ARN

Run the infrastructure deployment. Review and acknowledge IAM statement changes when prompted. This takes around 25 minutes to complete:

cdk deploy -R -c agentHealthReaderArn=$AGENT_HEALTH_READER_ARN

The -R parameter defines that if something fails during this deployment, the successfully provisioned resources are retained. Be aware that this command creates AWS resources, incurring cost. Review the cleanup section at the end of this post for removing all created resources.

When the deploy command finishes successfully, you should see an output like the following:

...
AgentObservabilityStack

✨ Deployment time: 1402.42 s

Outputs:
AgentObservabilityStack.AgentEndpoint = https://bedrock-agentcore.us-east-1.amazonaws.com/runtimes/arn%3Aaws%3Abedrock-agentcore%3Aus-east-1%3A123456789012%3Aruntime%2Fretail_agent-abcdefghij/invocations?qualifier=AgentObservabilityStAgentRuntimeEndpointABCDEFGH
AgentObservabilityStack.ChatUrl = https://main.abcdefghijklmn.amplifyapp.com
...

Next, create a user for your application. Retrieve the CDK output value for AgentObservabilityStack.UserPoolId. Create a user for the application using the user pool ID, an email address, and a strong password (minimum eight characters including uppercase, lowercase, letter, and digit):

export COGNITO_EMAIL=<YOUR_EMAIL>
export COGNITO_PASSWORD=<YOUR_PASSWORD>
export USER_POOL=<YOUR_USER_POOL_ID>
aws cognito-idp admin-create-user --user-pool-id $USER_POOL --username $COGNITO_EMAIL --message-action SUPPRESS --user-attributes Name=email_verified,Value=true
aws cognito-idp admin-set-user-password --user-pool-id $USER_POOL --username $COGNITO_EMAIL --password "$COGNITO_PASSWORD" --permanent

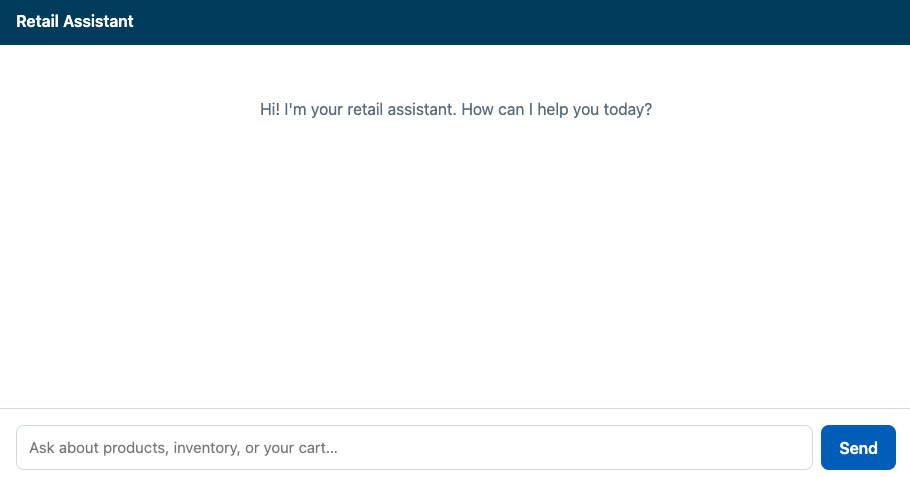
You can now access the retail agent application. From the CDK output values, retrieve the value for AgentObservabilityStack.ChatUrl. Copy and paste this URL into your browser. Log in with your email and password. You should now see the agent interface:

Sample retail agent chat interface showing the ecommerce assistant ready for queries

Figure 2: Sample retail agent user interface

Experiment with the application. Here is an example sequence of queries you can put in:

  • Do you have books on Python?
  • Is this in stock?
  • Put it into my basket.
  • What else can you do for me?

Start Agent Health

Now that you have the infrastructure running, you can start OpenSearch Agent Health locally and connect it to your cloud resources.

The CDK infrastructure deployment created a file cdk-output.json, which contains all relevant configuration values for Agent Health. We’ve already created a file agent-health/agent-health.config.ts that pulls these values dynamically in your environment, so you can start Agent Health without any further configuration.

Open a terminal and start Agent Health by running the following command:

cd ../agent-health && npm install
npx @opensearch-project/agent-health

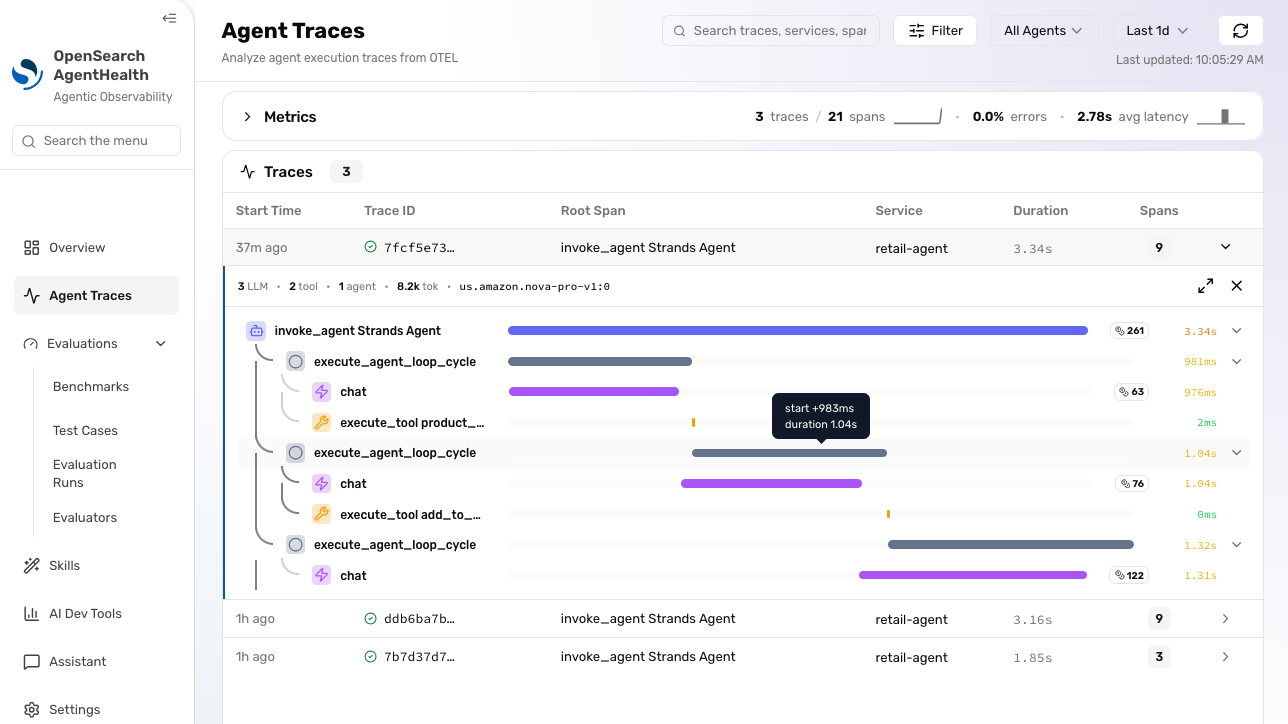
Open http://localhost:4001 in your browser to access Agent Health UI. Choose Agent Traces in the sidebar menu to access your agent’s traces. You should see traces from your previous interactions:

Agent Health Traces view listing agent traces captured from previous interactions

Figure 3: Agent traces. As Agent Health is in active development, this interface might have changed since the time of writing

Expand the trace and explore the information it contains, such as token count and agent trajectory (sequence of messages, reasoning steps, and tool calls).

If you’re unable to access the application or see any traces, verify the following:

  • Check Agent Health logs in your terminal for any errors. Also check whether Agent Health is running on an alternative port, like 4002 instead of 4001.
  • If there are permission errors when accessing traces from OpenSearch, verify that the AWS credentials in your terminal match the principal (user or role) that you specified under the agentHealthReaderArn CDK parameter during cdk deploy. This principal must have ESHttpGet:* IAM permissions. Agent Health uses your current AWS credentials to access the OpenSearch API for querying traces. The OpenSearch API is guarded by both IAM and OpenSearch fine-grained access control.

Create and run a test

Choose Test Cases and New Test Case. Fill out the required fields with the following information:

  • Name: Should add to cart.
  • Initial Prompt: Add some wireless headphones to my cart. Take any that you have in stock.
  • Expected Outcomes: PROD-001 added to cart.

Back in the test cases overview, select the created test case and choose Run Test. In the Configure Run dialog, choose Retail Assistant (production) for Agent, Tool Usage Efficiency for Evaluator, Claude Opus 4.8 for Judge Model, and choose Start Run.

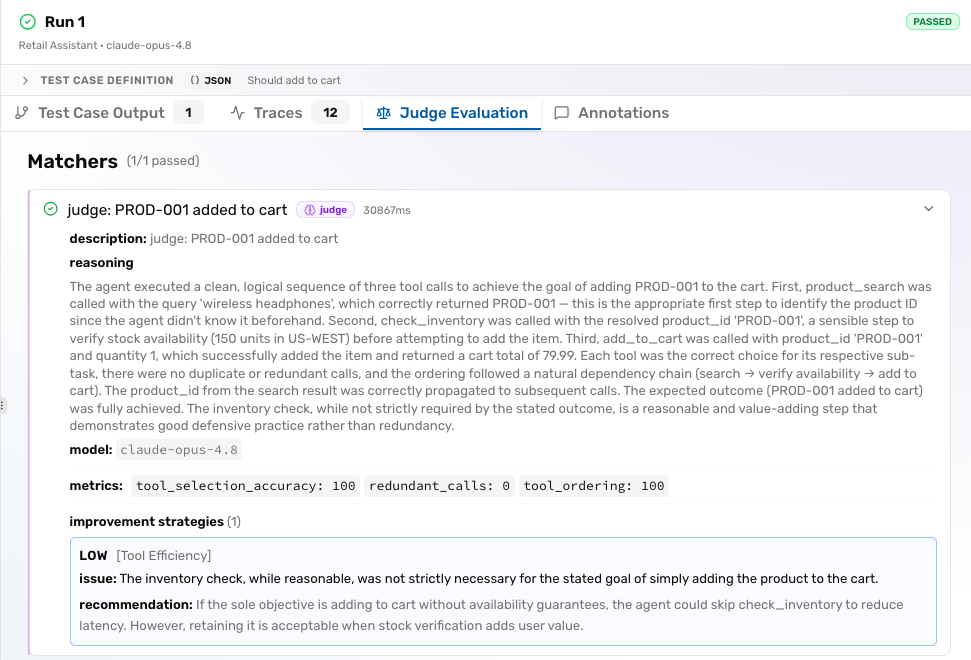
Agent Health now runs the configured initial prompt against the agent. The agent completes the task and sends execution traces to OpenSearch. Agent Health uses an evaluation model to check both agent responses and traces on successful execution, according to the defined expected outcomes. After the test is completed, go through the different tabs to check the test results.

Agent Health evaluation report showing test results across multiple tabs

Figure 4: Agent Health evaluation report

If you’re unable to run the test, check the following:

  • Agent Health automatically creates an Amazon Cognito token for your user upon start, but this token can expire. Restarting Agent Health creates a new token. Verify that both the COGNITO_EMAIL and COGNITO_PASSWORD variables are still set in your terminal environment.

Beyond test cases

After running a single test case, choose Benchmarks in the sidebar menu. With Benchmarks, you can run multiple test cases in parallel and summarize their results. You can compare benchmark runs by choosing Evaluation Runs in the sidebar, where you can analyze trends in pass rate, cost, and duration over time. Lastly, choose Evaluators to define your own evaluation logic beyond the predefined ones.

You can also run Agent Health tests with its command-line interface, which is handy for automation and continuous integration (CI). The equivalent command of running the preceding test is:

npx @opensearch-project/agent-health run -t <TEST_CASE_ID> -a "Retail Assistant" -e system-tool-usage --judge-model claude-opus-4.8 -e system-tool-usage

where TEST_CASE_ID can be retrieved from the browser URL when you visit the Agent Health UI (test case IDs start with tc-).

Agent Health stores all test cases, other configuration, and reports locally on disk in the agent-health/agent-health-data directory.

Cleaning up

To avoid incurring future charges, delete the resources:

cd ../infra && cdk destroy -c agentHealthReaderArn=$AGENT_HEALTH_READER_ARN

Conclusion

In this post, you learned to set up and use OpenSearch Agent Health for production agent observability and evaluations. To discover more features, see the Agent Health documentation pages. You can discuss and request additional features, and get help with setup, through the issues in the GitHub project. For more information, see the observability documentation for Amazon OpenSearch Service, where you can learn about the features available to build observability for both agents and traditional systems using OpenSearch. To investigate issues in production AI agents, see the recent post Unified observability in Amazon OpenSearch Service.


About the authors

Ulli Hinze

Ulli is a Solutions Architect based in Berlin, Germany. He focuses on SaaS, agentic AI, and OpenSearch, and helps customers build and modernize their solutions on AWS. His previous roles included software development, platform engineering, and architecture.

Megha Goyal

Megha is a Senior Software Engineer at AWS OpenSearch. For the past year she has focused on AI agent observability and evaluations, building Agent Health — an open-source developer tool for agents. Previously, she worked on data integrations with Amazon CloudWatch and Amazon Security Lake for the observability and security space. When she’s not building software, she enjoys designing and 3D-printing models at home.

Rekha Thottan

Rekha Thottan

Rekha is a Senior Product Manager Technical on the Amazon OpenSearch Service team.

Accelerate Apache Spark debugging on Amazon EMR with AWS DevOps Agent

Post Syndicated from Kalyan Janaki original https://aws.amazon.com/blogs/big-data/accelerate-apache-spark-debugging-on-amazon-emr-with-aws-devops-agent/

When an Apache Spark job fails on Amazon EMR, the root cause can hide in executor logs, memory profiles, or application code. As data pipelines grow in complexity, correlating logs, metrics, and traces across multiple services requires significant operational effort. AWS DevOps Agent handles this investigation autonomously while keeping operators in the loop to review findings and approve fixes. From a single chat prompt, it produces a root cause and mitigation plan, often without any human involvement beyond the initial question.

The native AWS API tools in AWS DevOps Agent don’t extend into Spark-internal artifacts. Sometimes those tools can’t reach the evidence that pins down the root cause: a Spark History Server event log, executor Python worker memory, or a line of code that allocated too much. In these cases, AWS DevOps Agent can describe symptoms (“the executor exited with code 1”) but can’t identify the actual antipattern that caused them.

This post shows how to extend AWS DevOps Agent to investigate failures in Apache Spark workloads on Amazon EMR. You register the Apache Spark Troubleshooting Agent for Amazon EMR, a managed Model Context Protocol (MCP) server hosted by AWS, as a custom capability provider in your AWS DevOps Agent space. You route the traffic over AWS PrivateLink so MCP calls never traverse the public internet. Then you watch a single agent chat session investigate a deliberately failing Spark job, from Amazon CloudWatch alarm to line-numbered root cause, in about two minutes.

Prerequisites

Before you begin, make sure you have the following:

How AWS DevOps Agent discovers custom tools through MCP

Model Context Protocol (MCP) is an open standard that defines how AI agents discover and invoke external tools. AWS DevOps Agent supports connecting to custom MCP servers, which means you can expose new capabilities to it without modifying the agent itself. When you connect an MCP server to AWS DevOps Agent, the agent automatically discovers the available tools, understands their schemas, and calls them as part of its investigation workflow. You build and connect the MCP server, and the agent handles the rest.

MCP tools sit alongside the agent’s built-in AWS API tools. During a single investigation, the agent can interleave calls to cloudwatch.describe-alarms, emr-serverless.get-job-run, and a custom MCP tool such as analyze_spark_workload. The agent picks the right one for each subtask. You augment the agent’s reach without replacing what it already does.

For this integration, you don’t build an MCP server. The Apache Spark Troubleshooting Agent for Amazon EMR is itself a managed MCP server, hosted by AWS at a regional endpoint. Your job is to register that endpoint with AWS DevOps Agent and authorize the agent to call it. This requires a network path from the agent to the endpoint, plus an IAM role for AWS Signature Version 4 request signing.

Why Spark internals visibility matters

The actual root cause for a Spark failure usually lives somewhere none of those APIs (such as Amazon CloudWatch Logs Insights, AWS CloudTrail, or Amazon EMR step-status calls) can reach:

The Apache Spark Troubleshooting Agent for Amazon EMR reads the following sources.

The Spark History Server event log is a per-job archive in Amazon Simple Storage Service (Amazon S3) with stage timings, task-level metrics, executor utilization, shuffle read/write volumes, and garbage-collection pauses. Amazon EMR exposes this data through the Spark UI on Amazon EMR Serverless, Amazon EMR on Amazon Elastic Compute Cloud (Amazon EC2), and Amazon EMR on Amazon Elastic Kubernetes Service (Amazon EKS), but interpreting signals like data skew, executor memory pressure, or stages that take significantly longer than expected requires familiarity with Spark internals.

  • The Spark query plan — the logical and physical plan the driver compiled. Without it, you can’t identify antipatterns such as unnecessary data repartitioning or missing broadcast hints that trigger expensive shuffles.
  • The application source code in Amazon S3 — the .py or .jar code artifact the job ran. Without it, you can’t quote the offending line of a mapPartitions user-defined function or an inefficient collect().
  • The Python worker process telemetry — the PySpark worker is a separate Python subprocess outside the Java Virtual Machine’s (JVM) managed memory. When it crashes from spark.executor.pyspark.memory exhaustion, the JVM driver sees a generic “executor exited unexpectedly” message. The actual cause is invisible to standard JVM-level logs.

When the agent invokes analyze_spark_workload during an investigation, it returns a structured analysis with the antipattern identified at the line level, the offending stage isolated, and a concrete fix: both code changes and configuration changes.

Integrating AWS DevOps Agent with Apache Spark Troubleshooting MCP

This section explains how AWS DevOps Agent connects to the Apache Spark Troubleshooting Agent through a private MCP endpoint and orchestrates the investigation workflow.

How it works

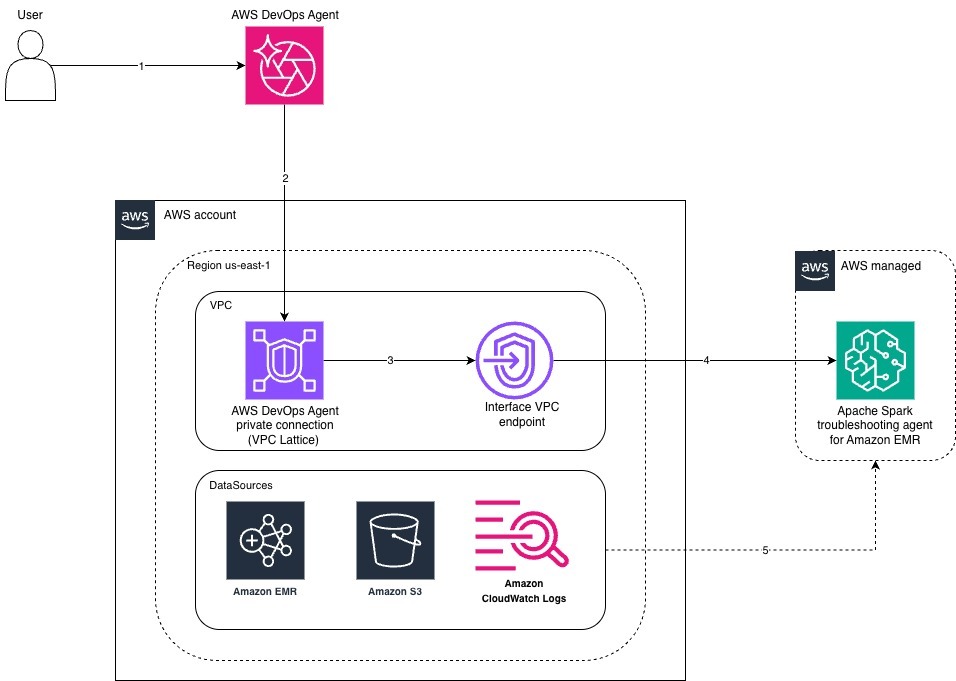
Architecture diagram showing AWS DevOps Agent connecting to the Apache Spark Troubleshooting Agent over AWS PrivateLink

Figure 1: Integration architecture between AWS DevOps Agent and the Apache Spark Troubleshooting Agent for Amazon EMR over AWS PrivateLink

  1. You submit an investigation prompt in AWS DevOps Agent.
  2. AWS DevOps Agent sends a SigV4-signed MCP call into your Amazon VPC through the AWS DevOps Agent private connection.
  3. The private connection forwards the request to the Interface VPC Endpoint.
  4. The endpoint routes the request over AWS PrivateLink to the Apache Spark Troubleshooting Agent for Amazon EMR, which AWS manages.
  5. The MCP service reads from your data sources (Amazon EMR, Amazon S3, Amazon CloudWatch Logs) using the same IAM role AWS DevOps Agent assumed for the call.
  6. When a CloudWatch alarm transitions to ALARM state (for example, a failed-jobs alarm for your Amazon EMR Serverless application), AWS DevOps Agent automatically triggers an investigation without manual intervention.
  7. AWS DevOps Agent decides which tools to call based on the prompt. For a Spark failure, that includes the Apache Spark Troubleshooting MCP server you registered as a capability provider.
  8. Each MCP request is signed with AWS Signature Version 4 using the IAM role assigned to the capability provider. The request travels from AWS DevOps Agent into your Amazon VPC through the private connection. This private connection is a managed VPC Lattice resource gateway you created during setup.
  9. From the resource gateway, the request flows to the Interface VPC Endpoint for the Amazon SageMaker Unified Studio MCP service, then on to the Apache Spark Troubleshooting Agent. The traffic stays entirely on the AWS network.
  10. The MCP server reads the inputs it needs from your AWS account using the IAM role that you assigned to the capability provider during MCP server registration. This role grants access to the Spark History Server event log and application source code in Amazon S3, the driver and executor stdout streams in Amazon CloudWatch Logs, and the job-run metadata from Amazon EMR Serverless.
  11. The MCP server returns its diagnostic findings to AWS DevOps Agent. The agent then analyzes the results, identifies the root cause, and presents recommended fixes both code-level and configuration-level in your chat.

Setting up the demo

As part of this demo, this post includes a sample AWS CloudFormation template, tested in the us-east-1 Region, that provisions the following resources for the walkthrough:

  • A dedicated Amazon Virtual Private Cloud (Amazon VPC) with two private subnets in Availability Zones supported by the Apache Spark Troubleshooting Agent for Amazon EMR.
  • An Interface VPC Endpoint for the Apache Spark Troubleshooting Agent for Amazon EMR.
  • An IAM role that AWS DevOps Agent assumes to invoke the Apache Spark Troubleshooting MCP server with AWS Signature Version 4.
  • A deliberately failing PySpark workload running on Amazon EMR Serverless, including the Amazon EMR Serverless application, the Spark execution role, and the demo logs stored in Amazon S3 bucket.
  • An Amazon CloudWatch alarm that fires when the demo job fails. This alarm is used as the trigger for the agent investigation later in this section.

Step 1: Clone the repository

Clone the git repository for the CloudFormation template, PySpark script, and Parquet data.

git clone https://github.com/aws-samples/sample-aws-data-processing-and-analytics.git

Step 2: Deploy the AWS CloudFormation stack

Deploy the template using the following AWS CLI command.

cd sample-aws-data-processing-and-analytics/blogs/devops-agent-spark-mcp-integration

aws cloudformation create-stack \
  --stack-name spark-troubleshooting-demo \
  --template-body file://cloudformation/spark-troubleshooting-devops-agent-blog.yaml \
  --capabilities CAPABILITY_NAMED_IAM \
  --region us-east-1

The stack reaches CREATE_COMPLETE in approximately 4–6 minutes. When it does, capture the following stack outputs, which you paste into the AWS DevOps Agent console in the next two steps:

  • DemoVpcId — the VPC ID for the AWS DevOps Agent private connection.
  • DemoSubnetIds — the two subnet IDs for the AWS DevOps Agent private connection.
  • SMUSVpcEndpointSecurityGroupId — the security group ID.
  • TroubleshootingRoleArn — the IAM role Amazon Resource Name (ARN).
  • MCPEndpointURL — the MCP endpoint URL to register.
  • FailedJobsAlarmName — the CloudWatch alarm name to reference in your investigation prompt.
  • DemoBucket — the S3 bucket name where you copy the demo script and Parquet data.

To retrieve all outputs at once, use the following AWS CLI command.

aws cloudformation describe-stacks \
  --region us-east-1 \
  --stack-name spark-troubleshooting-demo \
  --query "Stacks[0].Outputs" --output table
# Get your bucket name from the stack outputs
DEMO_BUCKET=$(aws cloudformation describe-stacks --stack-name spark-troubleshooting-demo --region us-east-1 --query 'Stacks[0].Outputs[?OutputKey==`DemoBucket`].OutputValue' --output text)

# Copy the script
cd sample-aws-data-processing-and-analytics/blogs/devops-agent-spark-mcp-integration
aws s3 cp scripts/customer_events_aggregator.py s3://$DEMO_BUCKET/customer_events_aggregator.py

# Copy the Parquet data
aws s3 cp data/ s3://$DEMO_BUCKET/data/ --recursive

Step 3: Create an agent space

The agent space defines which AWS account and Region the agent monitors, which IAM role it assumes, and which capability providers, including MCP servers, it can call.

Follow the steps in Creating an Agent Space in the AWS DevOps Agent User Guide. When completing those steps, use the following values:

Parameter Value
Name data-pipeline-troubleshooting
Region us-east-1
Agent Space role Choose Auto-create a new DevOps Agent role — the console generates a DevOpsAgentRole-AgentSpace* role with AIOpsAssistantPolicy attached
Optional integrations Not required

After the agent space reaches Active status, proceed to create the private connection.

Step 4: Create the AWS DevOps Agent private connection

AWS DevOps Agent uses the private connection to reach into your Amazon VPC. Follow the steps in Connecting to privately hosted tools in the AWS DevOps Agent User Guide. You can use either the console or the AWS CLI command documented under Create a private connection.

When completing those steps, use the following values from your CloudFormation stack outputs:

Parameter Value
Name A descriptive name (for example, spark-private)
VPC DemoVpcId from your stack outputs
Subnets Both subnet IDs from DemoSubnetIds
Security group SMUSVpcEndpointSecurityGroupId
TCP port ranges (Advanced configuration) 443
Host address (Service target details) sagemaker-unified-studio-mcp.us-east-1.api.aws
DNS resolution In VPC (private DNS)
Certificate public key None

After the connection reaches Active status, proceed to Step 5.

Step 5: Register the Apache Spark Troubleshooting MCP server as a capability provider

With the private connection in place, register the MCP server as a capability provider. Follow the steps in Registering an MCP server at the account level in the AWS DevOps Agent User Guide.

When completing those steps, use the following values:

Parameter Value
Name spark-troubleshooting
Endpoint URL MCPEndpointURL from your stack outputs
Connect to endpoint using a private connection Selected

Step 6: Add the MCP server to the agent space

With the MCP server registered, you need a workspace where investigations run. The agent space defines which AWS account and Region the agent monitors, which IAM role it assumes, and which capability providers, including MCP servers, it can call.

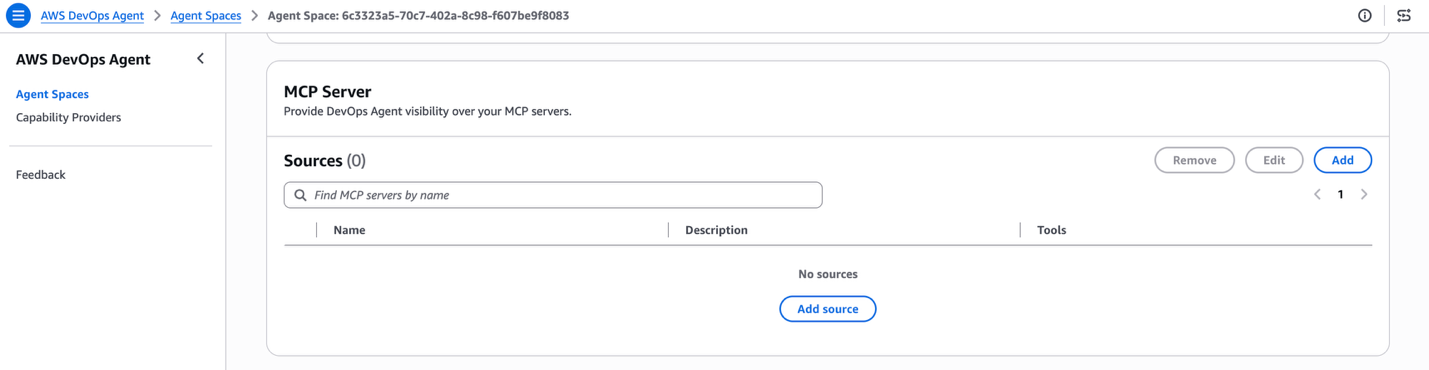
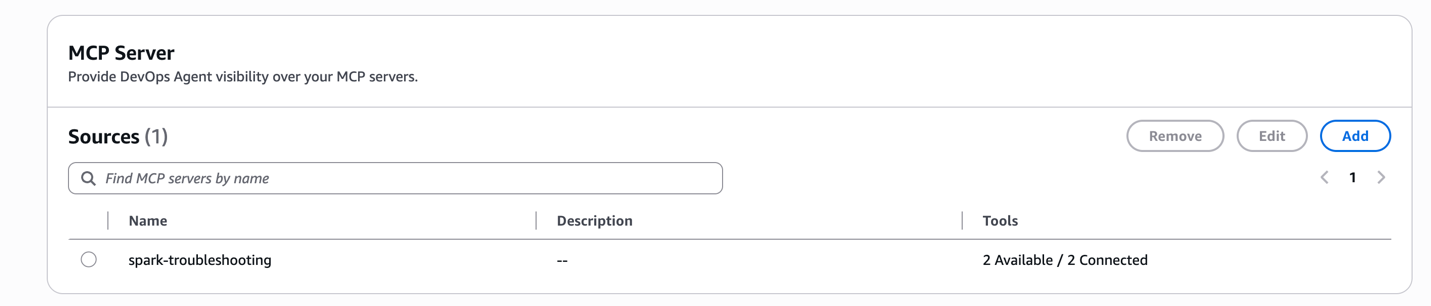
  1. In the MCP Server section, choose Add.
MCP Server section of the agent space detail page with an Add button

Figure 2: MCP Server section of the agent space detail page

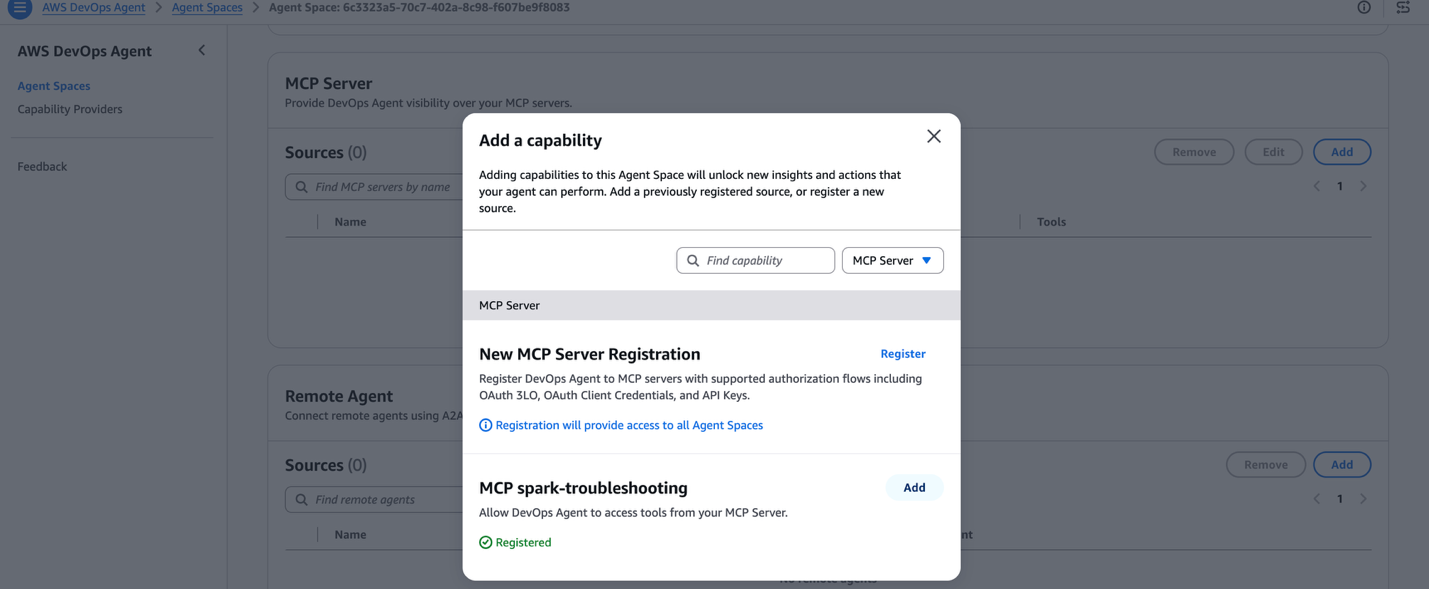
  1. In the Add a capability dialog, locate spark-troubleshooting in the list of registered MCP servers and choose Add.
Add a capability dialog listing the spark-troubleshooting MCP server

Figure 3: Add a capability with the spark-troubleshooting MCP server listed

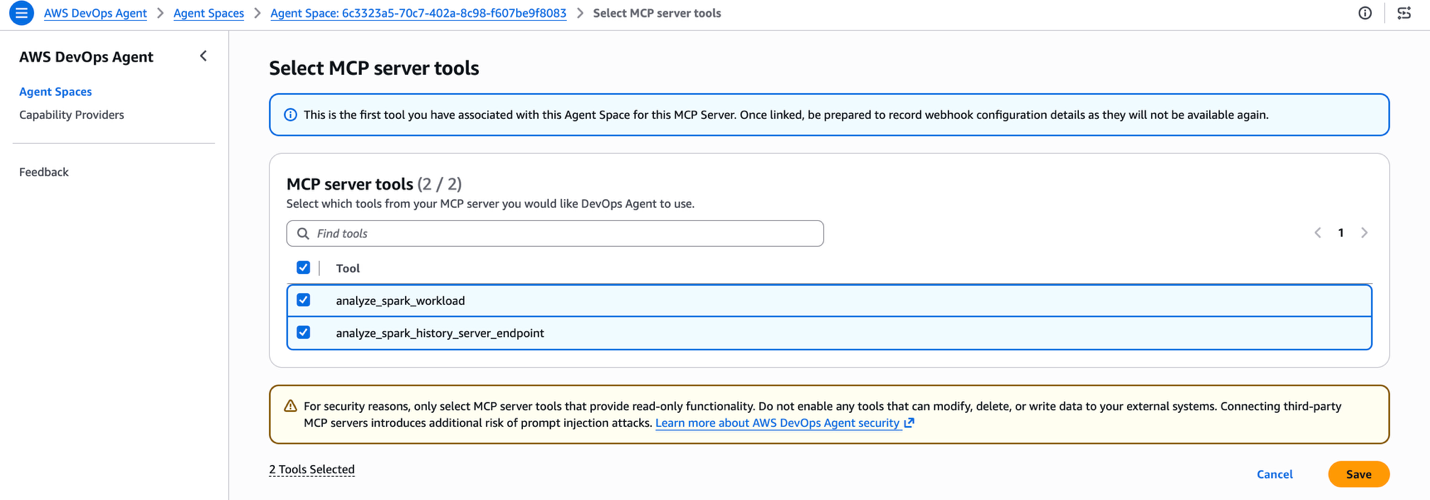
  1. On the Select MCP server tools page, both tools that the Apache Spark Troubleshooting Agent for Amazon EMR publishes are listed: analyze_spark_workload and analyze_spark_history_server_endpoint. Select both checkboxes, then choose Save.
Select MCP server tools page with both Spark troubleshooting tools checked

Figure 4: The Select MCP server tools page with both Spark troubleshooting tools selected

The agent space connects to the MCP server, lists its tools, and displays 2 Available / 2 Connected. Both tools are now part of your agent’s catalog.

MCP Server section showing spark-troubleshooting connected with two available and two connected tools

Figure 5: MCP Server section showing spark-troubleshooting connected with both tools available

Seeing it in action

To see the integration end to end, you submit a PySpark job, watch the CloudWatch alarm move to ALARM, and then ask AWS DevOps Agent to investigate using the alarm name.

The failing workload

The CloudFormation template provisioned an Amazon EMR Serverless application called analytics-events-platform and configured a sample PySpark job, customer_events_aggregator.py. The script simulates a common Python-side memory bug: a mapPartitions user-defined function accumulates 11 copies of every input row in an in-memory Python list before yielding results, while the job runs with spark.executor.pyspark.memory=256m. The Python worker process exceeds the 256 MB cap, the kernel kills it, Spark retries four times, and the stage is marked failed.

Submit the failing job

Run the DemoSubmitJobCommand from your stack outputs in your terminal. It looks like this:

aws emr-serverless start-job-run \
  --region us-east-1 \
  --application-id <DemoApplicationId> \
  --execution-role-arn <DemoExecutionRoleArn> \
  --name daily-customer-events-rollup \
  --job-driver '{"sparkSubmit":{"entryPoint":"s3://<DemoBucket>/customer_events_aggregator.py","entryPointArguments":["<DemoBucket>"],"sparkSubmitParameters":"--conf spark.executor.cores=2 --conf spark.executor.memory=1g --conf spark.executor.pyspark.memory=256m --conf spark.executor.instances=2"}}' \
  --configuration-overrides '{"monitoringConfiguration":{"s3MonitoringConfiguration":{"logUri":"s3://<DemoBucket>/logs/"}}}'

The command returns a jobRunId. Note it down. You will see it later in the agent’s investigation.

The job goes through PENDING to SCHEDULED to RUNNING to FAILED and reaches FAILED state in roughly four minutes.

Watch the CloudWatch alarm fire

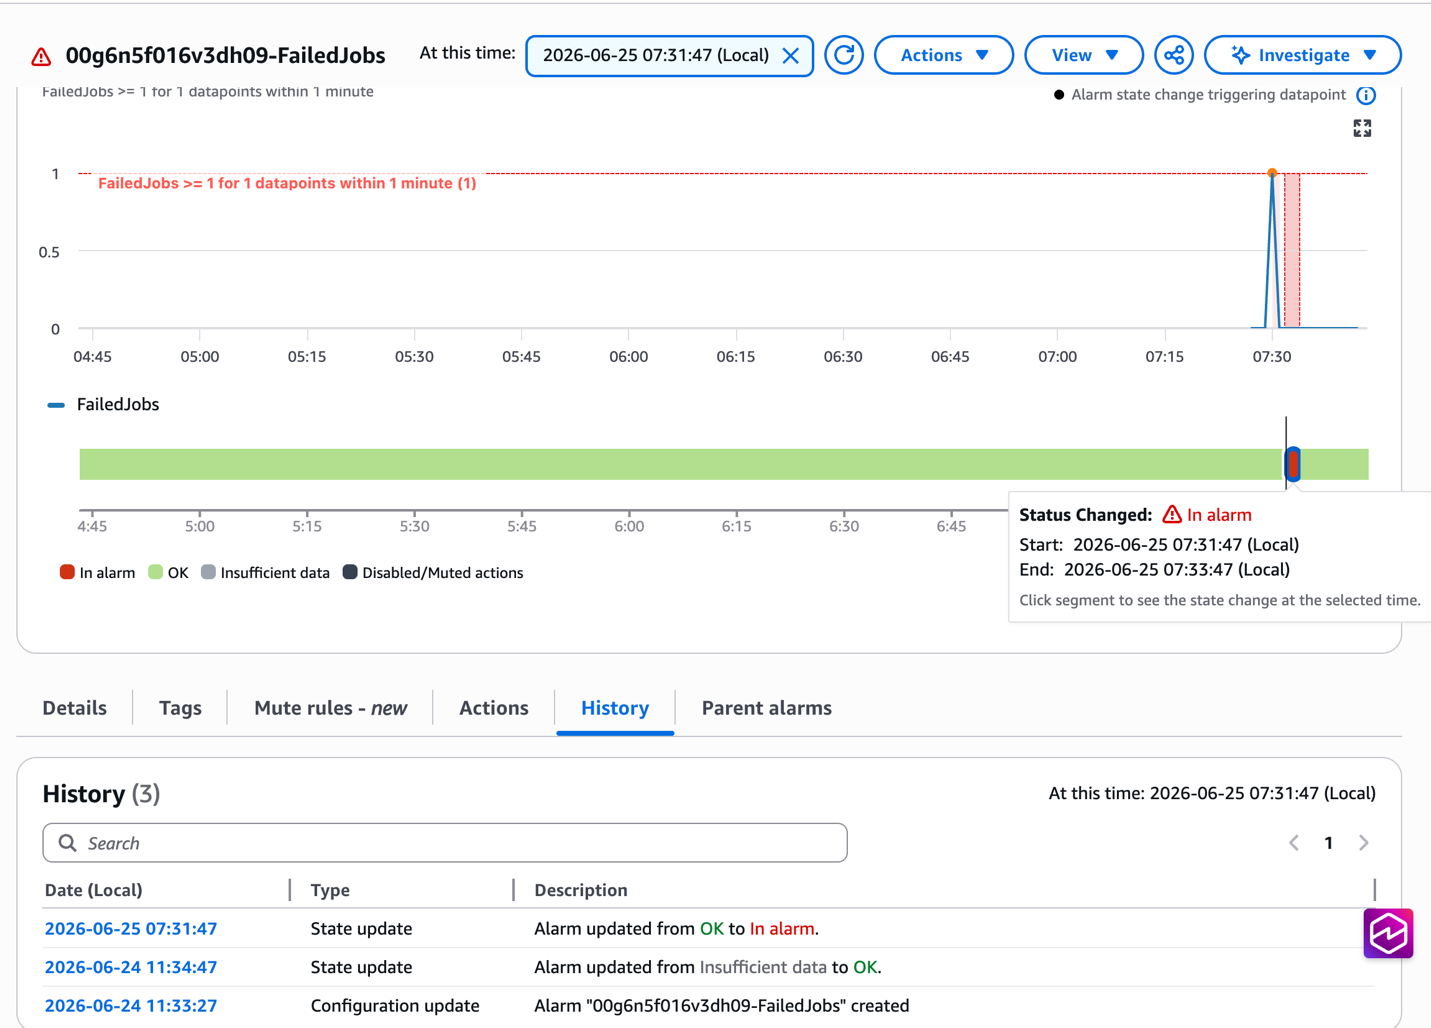
The CloudFormation template also created a CloudWatch alarm named <DemoApplicationId>-FailedJobs (the exact name is in the FailedJobsAlarmName stack output). The alarm watches the FailedJobs metric in the AWS/EMRServerless namespace, scoped to your demo application, and flips to ALARM within a minute or two of the job failing.

Open the Amazon CloudWatch console, choose Alarms in the left navigation pane, and confirm the alarm is in In alarm state.

Amazon CloudWatch console alarm detail page showing the FailedJobs alarm in alarm state

Figure 6: The Amazon CloudWatch alarm detail page showing the FailedJobs alarm in the In alarm state

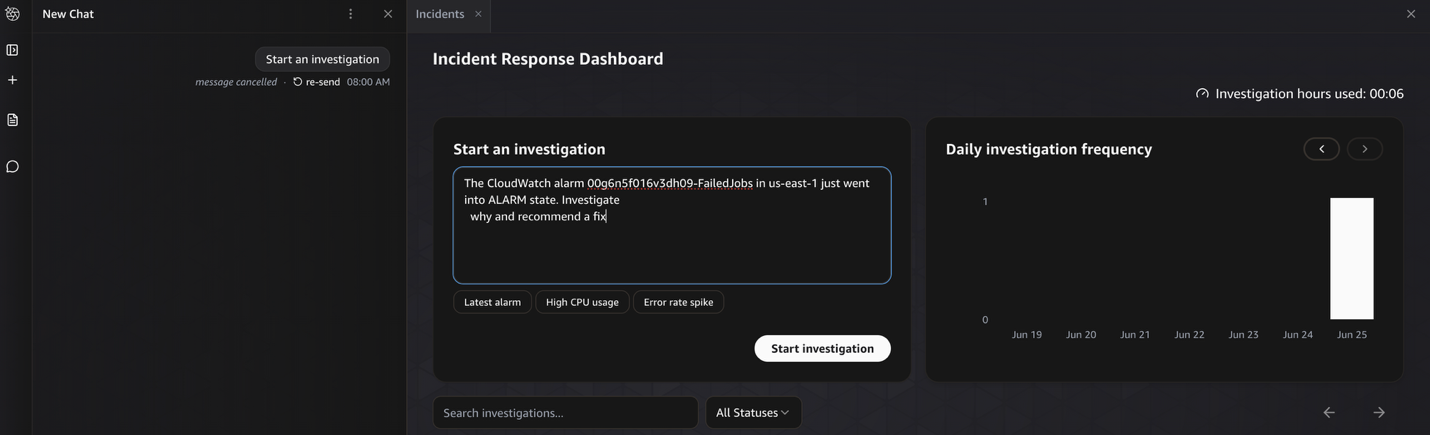
Ask AWS DevOps Agent to investigate

  1. Open your AWS DevOps Agent space.
  2. In the left navigation pane, choose Operator Access, then choose Incidents.
  3. Choose Start an investigation.
  4. Paste the following prompt, replacing <FailedJobsAlarmName> with the value from your stack outputs:

CloudWatch alarm in us-east-1 just went into ALARM state. Investigate why and recommend a fix

AWS DevOps Agent Start an investigation panel with the alarm prompt entered

Figure 7: AWS DevOps Agent Start an investigation panel with the Amazon CloudWatch alarm investigation prompt

The agent’s investigation chains together native AWS API tools and the Apache Spark Troubleshooting MCP tool you registered:

  1. use_aws cloudwatch describe-alarms — fetches the alarm definition and reads its metric dimensions, identifying that the alarm is scoped to Amazon EMR Serverless application <DemoApplicationId>.
  2. use_aws emr-serverless list-job-runs — finds the most recent FAILED job run on that application.
  3. use_aws emr-serverless get-job-run — pulls the FAILED run’s metadata and last-known error.
  4. spark-troubleshooting analyze_spark_workload — invokes the Apache Spark Troubleshooting Agent for Amazon EMR through the MCP capability provider, passing the application ID and job run ID. This is where the deep analysis happens.

Review the root cause and fix

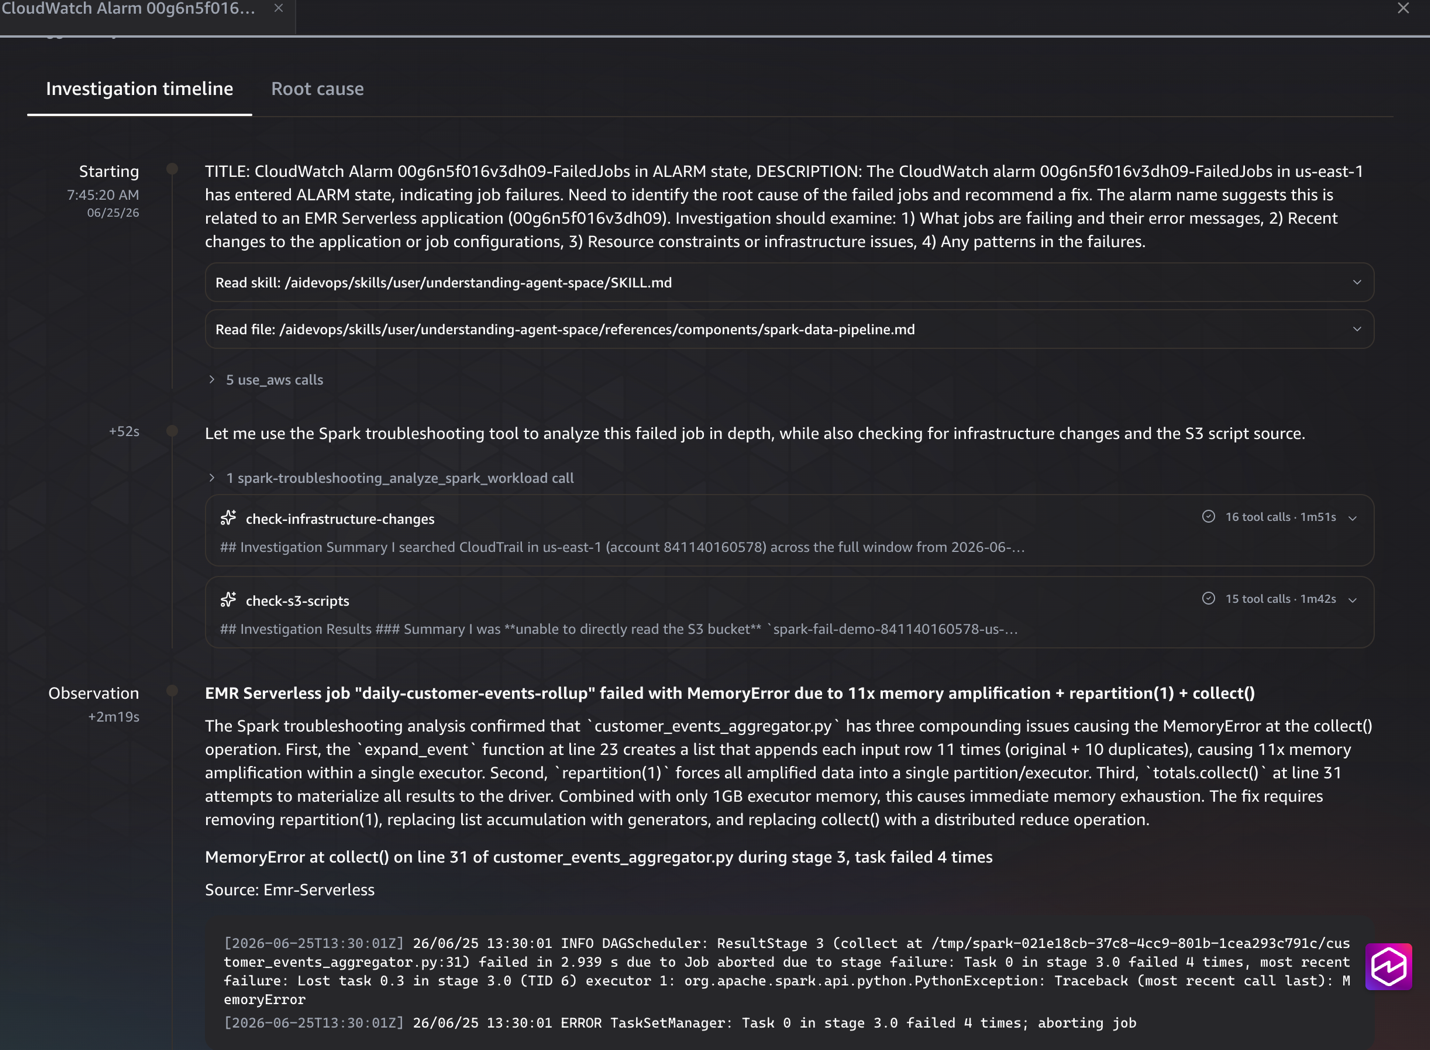
When the investigation completes, AWS DevOps Agent presents the results across two tabs: Investigation timeline and Root cause.

The Investigation timeline shows every step the agent took: skills loaded, native AWS API calls made, and the moment it called the analyze_spark_workload MCP tool to analyze the failed Spark job. Each entry is expandable so you can audit the inputs and outputs.

Investigation timeline listing the agent tool calls and the MCP invocation

Figure 8: Investigation timeline tab showing the sequence of agent tool calls and the spark-troubleshooting MCP invocation

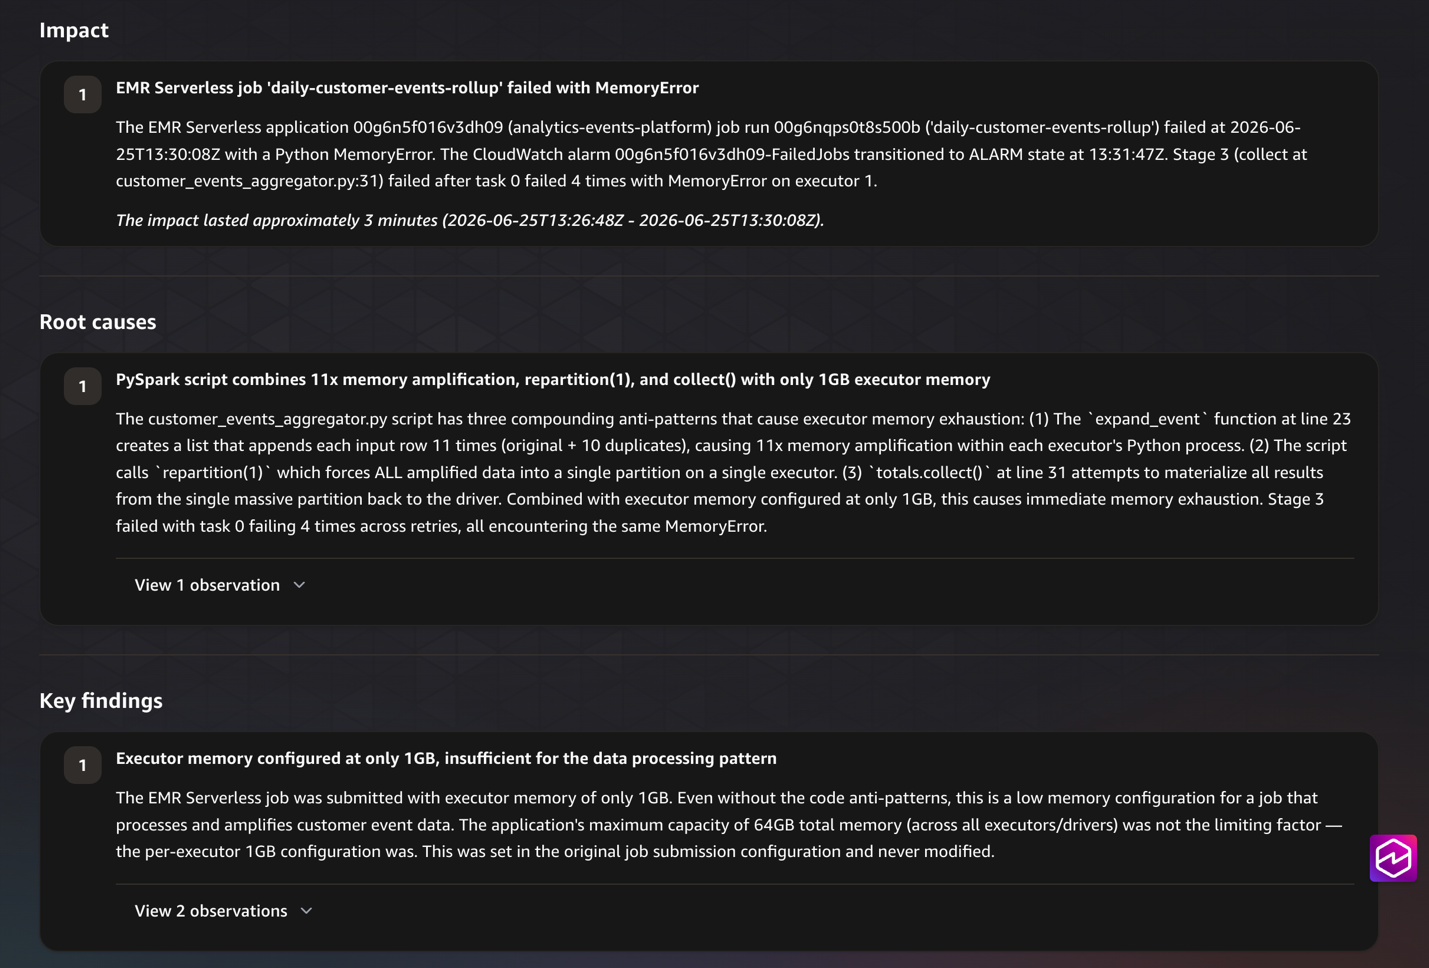
The Root cause tab is where the answer lands. It is organized into three sections that mirror what an experienced engineer would write in an incident report:

Root cause tab showing impact, root causes, and key findings for the memory failure

Figure 9: The Root cause tab showing the impact summary, identified root causes, and key findings for the Spark memory exhaustion failure

  • Impact — what failed, when, and for how long. For our demo, this calls out that the daily-customer-events-rollup job on the analytics-events-platform application failed with a MemoryError and that the alarm transitioned to ALARM state at the time of the failure.
  • Root causes — the actual antipattern. The agent identifies that customer_events_aggregator.py combines three compounding issues: an expand_event function (line 23) that amplifies each input row 11×, a repartition(1) that funnels all data into a single partition on a single executor, and a collect() (line 31) that pulls the amplified dataset back to the driver. All three run with only 1 GB of executor memory.
  • Key findings — supporting facts behind the diagnosis, including the executor memory configuration, the application’s maximum capacity, and how the agent confirmed each fact from the analyzed artifacts.

Both the antipattern identification and the supporting evidence come from artifacts the agent could only reach through the MCP tool: the application source code in Amazon S3, the Spark History Server event log, and the query plan. Without the Apache Spark Troubleshooting Agent for Amazon EMR plugged in, AWS DevOps Agent would have stopped at “the executor exited with a memory error.”

Clean up

To avoid ongoing charges, delete the resources you created. Some resources are managed by the AWS DevOps Agent console and must be removed there first. Otherwise, the CloudFormation stack deletion fails.

  1. In the AWS DevOps Agent console, open your data-pipeline-troubleshooting agent space, choose the MCP Server section, select spark-troubleshooting, and choose Remove.
  2. From the Agent spaces list, select data-pipeline-troubleshooting and choose Delete.
  3. In Capability Providers, select spark-troubleshooting and choose Deregister.
  4. In Capability ProvidersPrivate connections, select smus-spark-private and choose Delete.
  5. Delete the AWS CloudFormation stack. This removes the Amazon VPC, the Interface VPC Endpoint, the security group, the IAM role, the Amazon EMR Serverless application, the Spark execution role, the Amazon CloudWatch alarm, and the demo logs bucket.
aws cloudformation delete-stack \
  --region us-east-1 \
  --stack-name spark-troubleshooting-demo

Conclusion

In this post, you connected the Apache Spark Troubleshooting Agent for Amazon EMR to AWS DevOps Agent as a custom MCP capability provider. You kept the traffic on the AWS network with AWS PrivateLink, and ran a failing PySpark job to see the integration end to end. A CloudWatch alarm fired, you asked the agent to investigate, and a single chat session returned the root cause along with code and configuration fixes.

You can extend this pattern beyond the demo scenario. Consider connecting the MCP server to agent spaces that monitor your production Amazon EMR environment. Any Spark job that writes a History Server event log becomes diagnosable through the same workflow.

To continue learning, explore the following resources:

If you’ve already integrated the Apache Spark Troubleshooting Agent into your operational workflow, or if you’re exploring other MCP-based extensions for AWS DevOps Agent, we want to hear about your experience. Share your thoughts and questions in the comments.


About the authors

Kalyan Janaki

Kalyan Janaki

Kalyan is Senior Big Data & Analytics Specialist with Amazon Web Services. He helps customers architect and build highly scalable, performant, and secure cloud-based solutions on AWS.

Aneesh Varghese

Aneesh Varghese

Aneesh is a Senior Technical Account Manager at AWS with more than 20 years of Information Technology industry experience. Aneesh supports enterprise customers in cost optimization strategies, Cloud operations, MLOps, providing advocacy and strategic technical guidance to help plan and build solutions using AWS best practices. Outside of work, Aneesh likes to spend time with family, play Basketball and Badminton

[$] A pause for the Python JIT

Post Syndicated from jzb original https://lwn.net/Articles/1090385/

In 2024 the Python 3.13
release added an experimental
just-in-time (JIT) compiler
to optimize the way that CPython executes Python
code. Since then, work has proceeded on the JIT, albeit perhaps less formally
than some might like. In June, Python’s steering
council
(SC) put out an announcement
that no new development on the JIT land (with the exception of bug and security
fixes) in Python’s main branch, until it accepts a Python Enhancement Proposal (PEP)
that would make the case for the JIT as a supported part of CPython. That has
led to the creation of PEP 836 (“JIT Go Brrr: The
Path to a Supported JIT Compiler for CPython”), which is currently under
discussion. As it stands, it seems likely that work on JIT will continue, but
when that will happen is less certain.

Firefox 155 released

Post Syndicated from jzb original https://lwn.net/Articles/1091926/

Version
155
of the Firefox web browser has been released. Notable changes include a
count in the address bar of how many ad trackers Firefox has blocked, container
reordering, and ensuring that mailto: links are only opened by explicit
user actions. There is also a change of the domain used for “captive portals”
(such as the ones used to sign into hotel WiFI): Firefox now uses
“firefox-portal-detection.com” instead of “detectportal.firefox.com”, which may
require a change in network allow lists.

The release also includes a number of changes
that may impact web developers
, as well as a number of bug fixes and security
fixes
.

Hybrid cloud orchestration: Modernizing on-premises infrastructure management with AWS

Post Syndicated from Sandeep Singh original https://aws.amazon.com/blogs/architecture/hybrid-cloud-orchestration-modernizing-on-premises-infrastructure-management-with-aws/

This post demonstrates how to build a hybrid cloud orchestration solution that manages distributed on-premises infrastructure at scale using AWS serverless technologies. If you manage geographically dispersed data centers with thousands of servers that require bare-metal configuration, deployment, and ongoing lifecycle management, this solution provides centralized control while maintaining on-premises execution. Many of these environments also need the Kubernetes control plane itself to stay on-premises. This can be for data sovereignty, regulatory, or policy reasons, or because the network to AWS is disconnected, disrupted, intermittent, or limited (DDIL). Amazon EKS Anywhere runs the entire cluster on your own hardware, and this solution orchestrates it at scale from AWS. For on-premises workloads that can use a managed Amazon Elastic Kubernetes Service (Amazon EKS) control plane in the cloud, Amazon EKS Hybrid Nodes is the recommended approach.

In Part 1 of this series, you’ll learn the core architecture patterns for building an event-driven orchestration engine using AWS Lambda, AWS Step Functions, and Amazon DynamoDB. With this foundation, you can automate server lifecycle management through vendor-agnostic APIs, deploy EKS Anywhere clusters consistently across sites, and establish centralized observability for your entire infrastructure. In subsequent posts, we walk through the implementation with code examples, deployment templates, and detailed workflows for server and cluster management.

The challenge: Managing distributed on-premises infrastructure at scale

Managing distributed on-premises infrastructure at scale presents these challenges:

Inconsistency across locations: Different hardware vendors, network architectures, and compliance requirements lead sites to develop their own procedures. The same Kubernetes cluster deployment can produce different results at each site, such as the cluster version installed or the set of add-ons enabled. Without centralized orchestration, identical operations succeed at some locations but fail at others.

Manual lifecycle bottlenecks: The infrastructure lifecycle spans multiple layers requiring manual intervention. Hardware operations include BIOS configuration, firmware updates, and power management. OS operations cover installation and patching. Kubernetes operations encompass cluster creation, version upgrades, and scaling. Application operations involve deployment and maintenance. While manageable for individual servers, these processes become overwhelming bottlenecks when multiplied across thousands of geographically distributed machines.

Fragmented visibility: When management tools operate independently at each site, aggregating data across the entire environment becomes challenging. Operators struggle to answer enterprise-wide questions: How many servers are running outdated firmware? Which clusters are approaching capacity? Without centralized observability, identifying issues and planning capacity requires manual investigation across multiple locations.

Scalability limitations: Orchestration tools designed for a single data center encounter fundamental limitations at enterprise scale. Coordination mechanisms that work for dozens of servers fail when managing thousands. State synchronization becomes unreliable. Maintenance windows that are straightforward for a single site become logistical challenges across hundreds of locations.

Core technologies for hybrid orchestration

To address these operational challenges, four core technologies work together to deliver centralized orchestration with distributed execution:

Hybrid connectivity: Secure network connectivity between AWS and on-premises sites forms the foundation for centralized orchestration. AWS Direct Connect provides dedicated private connections, while AWS Site-to-Site VPN offers encrypted tunnels over the internet. This connectivity allows AWS services running in your virtual private cloud (VPC) to coordinate lifecycle operations with on-premises infrastructure.

AWS architecture stack: The AWS serverless stack along with Amazon EventBridge sets the foundation for an event-driven orchestration engine. Additional compute services include AWS CodeBuild for build processes, AWS Batch for long-running jobs, and AWS Systems Manager for on-premises tasks. These services provide a framework that can handle different execution runtimes while AWS manages the underlying infrastructure.

Redfish APIs: Redfish (a standard protocol for hardware management developed by the DMTF) delivers vendor-agnostic APIs for hardware management, allowing standardized control of bare-metal servers. Through Redfish, BIOS configuration, firmware updates, power management, and health monitoring operations are executed across diverse hardware environments.

Amazon EKS Anywhere: EKS Anywhere creates and operates Kubernetes clusters on your own infrastructure, using the same Amazon EKS Distro that powers Amazon EKS in the cloud. It supports several infrastructure providers, including the bare-metal provider this solution uses. Cluster lifecycle operations and maintenance are your responsibility, which is the work the orchestration engine automates across sites. If you have on-premises or edge environments with reliable connectivity to an AWS Region, Amazon EKS Hybrid Nodes is the recommended alternative. For the full set of options, see Amazon EKS deployment options.

Architecture overview

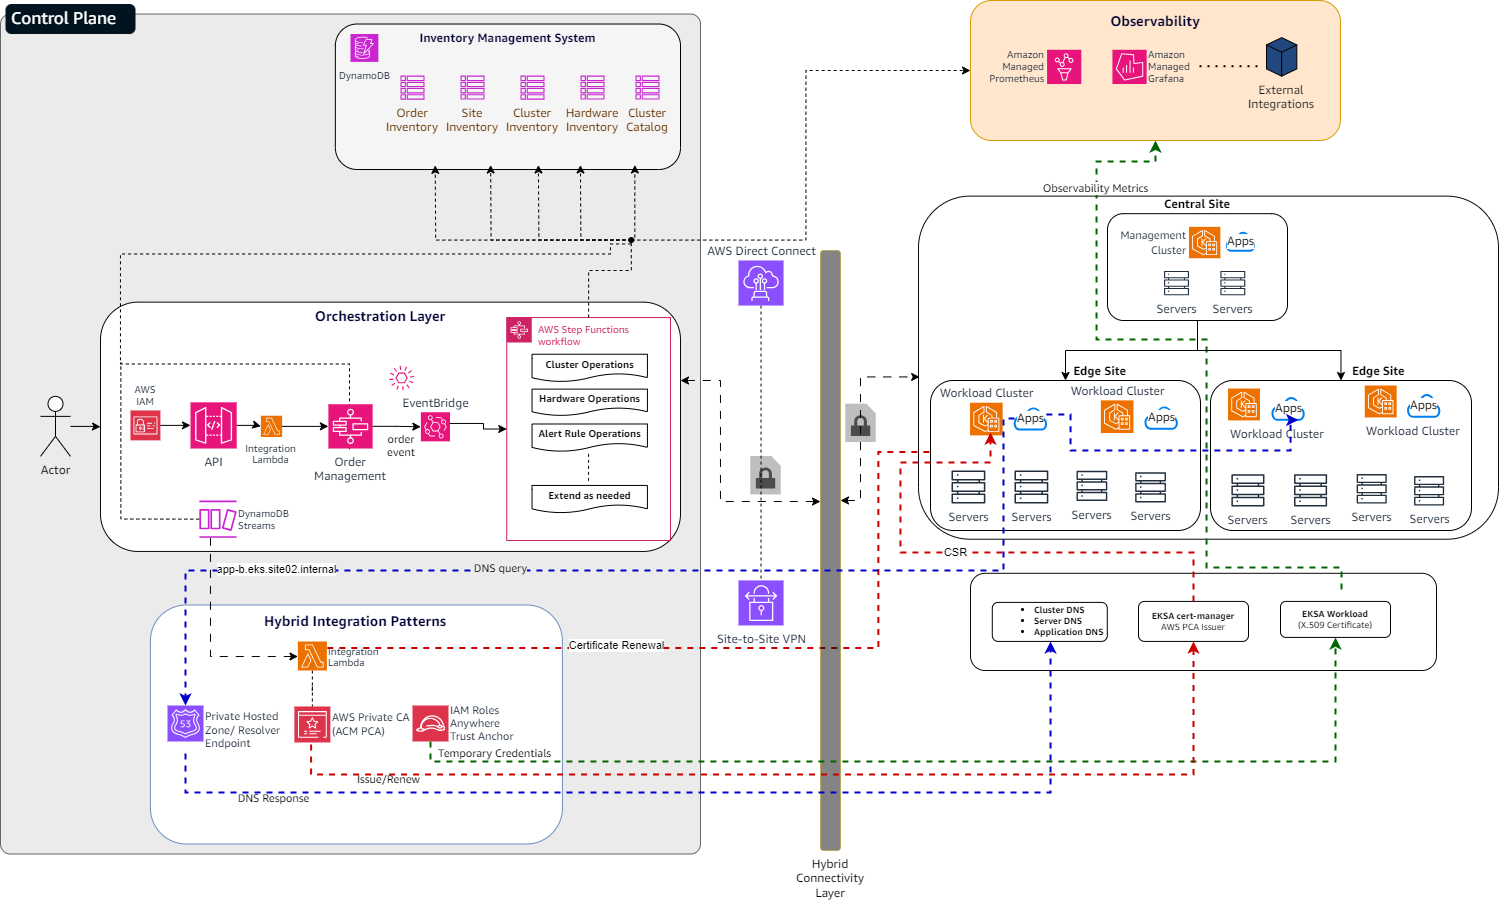
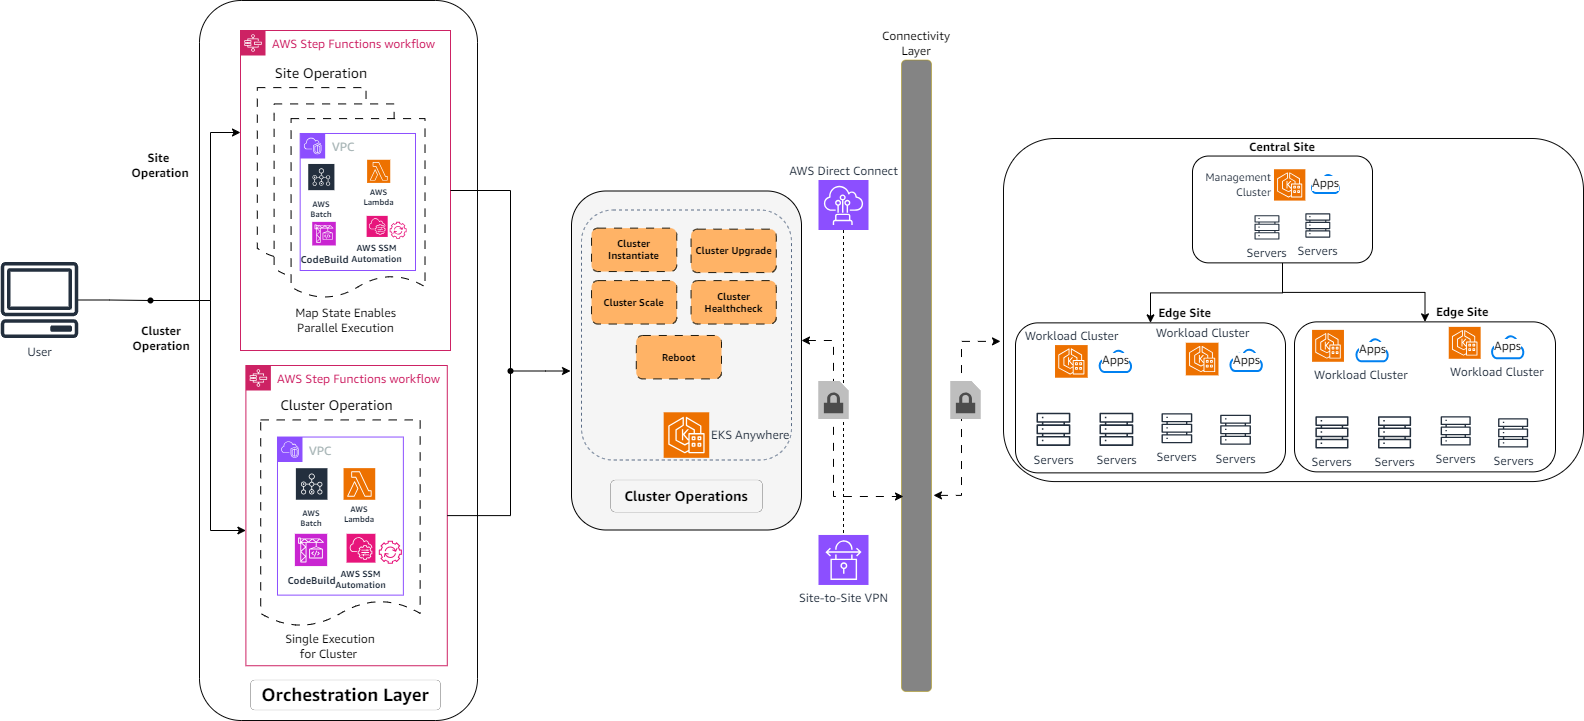
High-level architecture showing the AWS orchestration engine, on-premises EKS Anywhere clusters, and the hybrid connectivity linking them

Figure 1: High-level architecture of the hybrid cloud orchestration solution

The architecture consists of three primary layers: a centralized orchestration engine on AWS, distributed on-premises infrastructure running EKS Anywhere clusters, and hybrid connectivity linking the two environments. Serverless technologies coordinate lifecycle operations across hundreds of sites while maintaining comprehensive state tracking through an Inventory Management System.

Foundational concepts

The architecture is built on several foundational concepts that organize how resources are managed, and operations are coordinated.

Site: A physical location or logical grouping housing on-premises infrastructure. Sites provide an organizational framework for distributed operations, supporting location-specific policies, connectivity requirements, and compliance controls (for example, central, regional, or edge data centers).

Server: Bare-metal servers within sites that provide the physical compute, storage, and networking foundation for containerized workloads. Hardware resources are managed through vendor-agnostic Redfish APIs.

Cluster: EKS Anywhere Kubernetes clusters deployed on hardware resources, consisting of both management clusters (for orchestration operations) and workload clusters (for hosting applications).

Order: A trackable infrastructure lifecycle operation that executes as a workflow. When an operator requests an action like rebooting all servers in a site, an order is created with a unique ID. This emits an event, which Amazon EventBridge routes to the corresponding AWS Step Functions workflow. Operators can monitor progress by checking the order status, which is updated in response to state-change events emitted by the running workflow.

Inventory Management System: Centralized state repository

The Inventory Management System is the central state repository, using DynamoDB tables to track infrastructure resources and their relationships across hundreds of distributed sites.

DynamoDB tables maintain information about sites, hardware, clusters, orders, and a catalog of reusable configurations. Sites organize resources by location, storing network configurations, gateway addresses, and regional information. Hardware inventory captures server configurations (BIOS and firmware versions, encrypted credentials), network details (IP addresses, MAC addresses), operational status, physical location (rack number, mounting position), and cluster membership. Clusters maintain Kubernetes configurations, node group details, addon versions, and relationships to management clusters. Orders track operation lifecycles from initiation through completion, capturing the operation type, target resources, execution status, and workflow outputs. The catalog stores vetted blueprints and templates that standardize deployments across the infrastructure.

As infrastructure changes occur, the inventory reflects the current state of resources and their dependencies, acting as the single source of truth for operational history and resource relationships.

Event-driven orchestration engine

With centralized state tracking using the Inventory Management System, the orchestration engine coordinates infrastructure operations through an API-driven framework built on AWS serverless technologies. This architecture delivers scalable, event-driven orchestration without operational overhead.

API layer

The API layer exposes a RESTful interface through Amazon API Gateway for create, read, update, and delete (CRUD) operations on infrastructure resources. A unified operator portal serves as the front end for this API, giving operators a self-service interface to perform lifecycle operations without requiring CLI or direct API knowledge. Lambda functions process incoming requests, validate parameters, and integrate with the order management system to initiate operations.

Orchestration layer

Step Functions executes specialized state machines that integrate with AWS services for compute, storage, and networking operations, providing retry logic, error handling, and state checkpointing.

Step Functions supports a callback pattern where a workflow can pause, hand off a task to an external system with a unique token and resume only when that system calls back with the token. This is critical for hybrid cloud orchestration because it allows workflows to pause execution and wait for external systems to signal completion. This capability addresses the challenge of coordinating AWS-based workflows with on-premises systems that may take hours to complete operations like firmware updates or cluster deployments. A workflow can hand off a task to on-premises infrastructure, pause, and resume only when the on-premises system reports back.

The Distributed Map state scales operations from individual resources to thousands across multiple sites. For example, a workflow that manages the power state of a single server can scale to manage power states across thousands of servers simultaneously.

Amazon EventBridge provides event-driven automation capabilities, triggering workflows based on infrastructure state changes. When inventory records are updated, Amazon EventBridge Rules evaluate the changes and invoke appropriate Step Functions workflows. This decouples components and supports reactive automation patterns, such as automatically scaling clusters when capacity thresholds are reached or starting maintenance workflows when hardware health checks fail.

Security and configuration

Security and configuration management are handled through multiple AWS services. AWS Systems Manager Parameter Store provides centralized configuration storage, while AWS Secrets Manager securely manages sensitive credentials and secrets. AWS Identity and Access Management (IAM) roles provide fine-grained access control across components, with IAM Roles Anywhere extending AWS access to on-premises clusters without requiring long-term credentials.

AWS Systems Manager hybrid activations register on-premises instances with AWS, allowing the Systems Manager agent to manage on-premises infrastructure alongside cloud resources. This delivers a unified management interface for configuration, patching, and command execution across both environments.

AWS Private Certificate Authority manages certificates for secure communications between orchestration components and on-premises infrastructure. Each component operates with least-privilege permissions, accessing only the resources required for its specific function.

Order management: Coordinating operations at scale

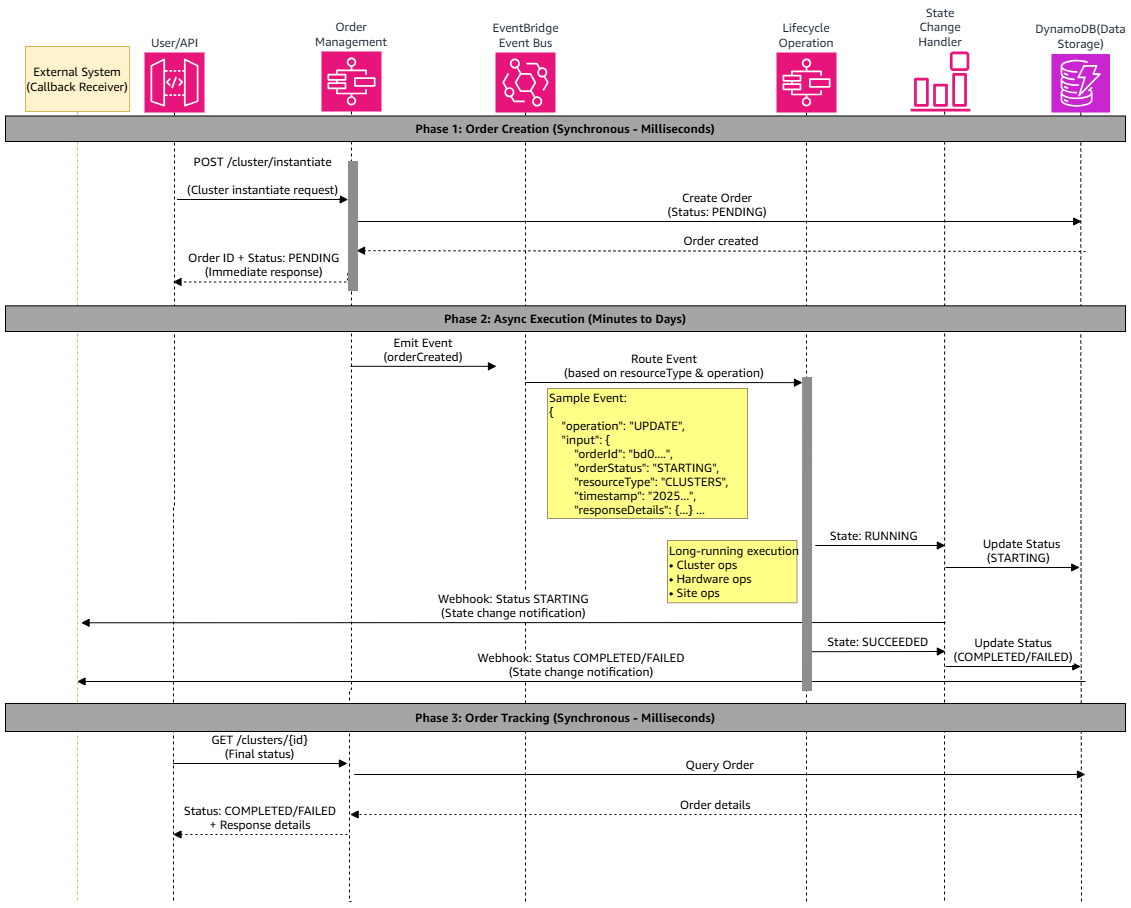
Order management flow where an API request maps through Amazon EventBridge rules to Step Functions workflows and updates order status in DynamoDB

Figure 2: Order management flow from API request to workflow execution

The orchestration engine coordinates operations through an order management system built on Amazon EventBridge rules that map API operations to Step Functions workflows. When an API request initiates an operation like `/clusters/{id}/terminate`, an Amazon EventBridge Rule routes the request to the corresponding workflow based on the resource and operation type. The system creates a record in DynamoDB and returns an order ID immediately, while the workflow executes asynchronously.

This event-driven system listens and responds to events throughout the operation lifecycle. As workflows execute, AWS-managed events from Step Functions and custom events from workflow logic progressively update the order status in DynamoDB. This allows operators to initiate operations without waiting for completion, which may take minutes to hours depending on the complexity of the operation.

The following core capabilities are enabled by order management:

Order lifecycle tracking: Operators can query order status through the API to monitor progress and track the complete audit trail from creation through execution to completion or failure.

Callback support: Orders support callbacks to both other workflows and external webhooks. Workflows can trigger other workflows upon completion, while webhook endpoints receive notifications upon state changes or completion. This supports integration with external systems such as ticketing platforms, notification services, or custom dashboards.

Conflict management: Integration with the inventory system prevents conflicting operations by denying new orders if another one is running on the same resource, preventing scenarios like cluster scaling during an upgrade.

Extensibility: New resource types and operations can be added by implementing Step Functions workflows and registering Amazon EventBridge rules that map API endpoints to workflows. The core order tracking logic remains unchanged.

Lifecycle management framework

The lifecycle management framework addresses two primary resource types, each with distinct operational requirements: bare-metal hardware and Kubernetes clusters.

Hardware management

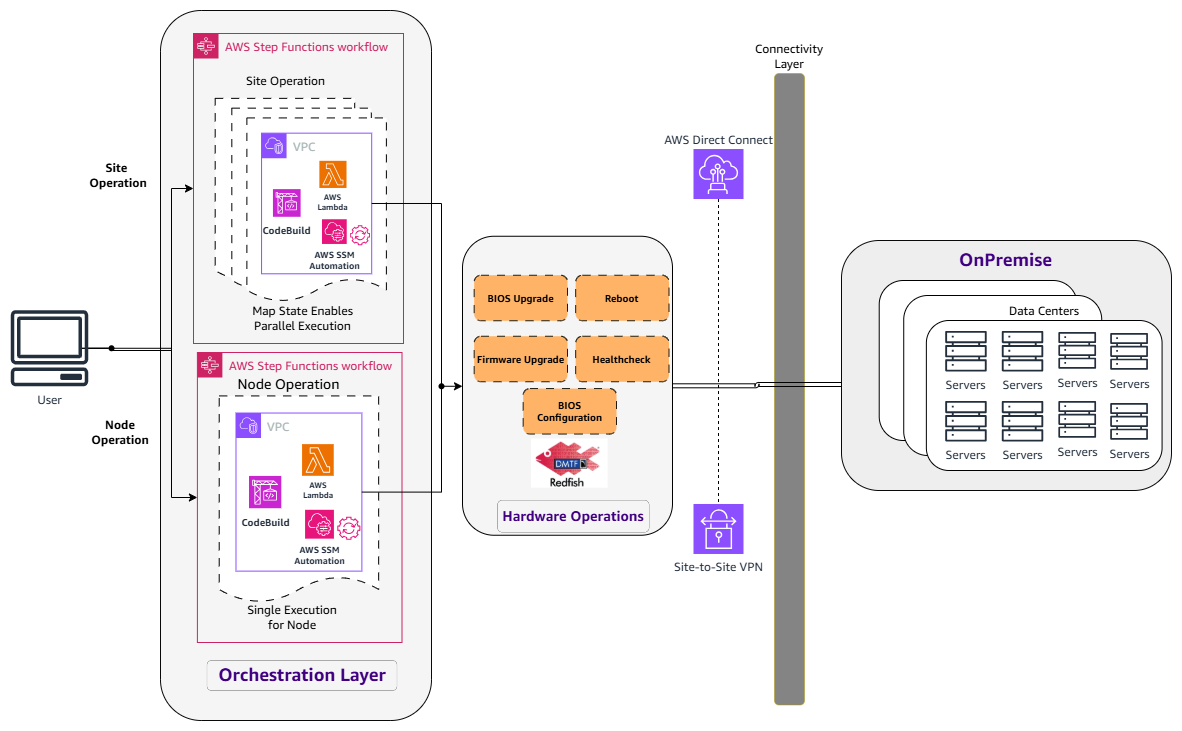
Hardware lifecycle management flow using vendor-agnostic Redfish APIs to run firmware, power, and BIOS operations across on-premises servers

Figure 3: Hardware lifecycle management across distributed sites

The solution provides hardware lifecycle management across distributed on-premises sites through a vendor-agnostic approach integrated with the Inventory Management System.

Supported hardware lifecycle operations

  1. Firmware management: Automated updates and configuration management.
  2. NIC upgrades: Network interface card firmware updates.
  3. Power management: Remote reboot, shutdown, and power cycling.
  4. Health: Processor, memory, and disk health checks.
  5. BIOS configuration: Define and apply specific golden templates.

This approach automates traditional manual hardware management, so operations can efficiently handle hundreds of servers across multiple distributed sites.

Cluster management

Cluster lifecycle management flow where the orchestration engine assembles a configuration file and hardware inventory and runs EKS Anywhere commands through Systems Manager and Batch

Figure 4: EKS Anywhere cluster lifecycle management across sites

Cluster management uses Amazon EKS Anywhere for consistent Kubernetes operations across sites. To create a cluster from bare metal servers, a configuration file and a hardware inventory CSV that lists the servers and their network details are prepared and passed to the EKS Anywhere CLI, which network boots them, installs the operating system and Kubernetes, and brings up the cluster. For the full set of steps and configuration options, see the EKS Anywhere bare metal documentation.

EKS Anywhere supports two cluster types:

  • Management: Dedicated clusters that host orchestration components to manage the lifecycle of workload clusters.
  • Workload: Application-hosting clusters managed by their corresponding management cluster.

This mapping of management to workload clusters is maintained in the Inventory Management System to give a unified view of cluster distribution across the infrastructure. When an operator requests a cluster through the API, the orchestration engine assembles the required inputs: the configuration file comes from a blueprint in the Cluster Catalog, and the hardware CSV comes from the servers recorded in the Inventory Management System. A workflow then runs the EKS Anywhere commands through Systems Manager (SSM) and Batch, which execute them against the on-premises servers.

Scalable operations

Cluster operations must execute in the proper sequence across the distributed environment, handling dependencies between clusters and their components. For instance, cluster creation begins with hardware selection based on placement strategy, pre-flight checks, bootstrapping an Admin machine, executing on-premises commands and awaiting completion, add-ons installation, and post-deployment health checks. The orchestration engine handles this using Step Functions with child workflows, callback patterns, and dependency mapping.

Supported cluster lifecycle operations

  1. Cluster creation: Automated provisioning of management and workload clusters with customizable configurations.
  2. Cluster scaling: Dynamic addition or removal of worker nodes based on capacity requirements.
  3. Cluster upgrades: Coordinated Kubernetes version upgrades with minimal disruption.
  4. Cluster termination: Graceful cluster decommissioning with proper resource cleanup.

These automated workflows reduce the operational complexity of managing Kubernetes at scale and support consistent cluster operations from edge locations to central data centers.

Monitoring and observability

Managing geographically distributed infrastructure requires centralized observability since operators often need to investigate issues across individual sites, correlating data from different hardware vendors and software layers.

This solution addresses the fragmented visibility challenge by aggregating telemetry from on-premises clusters into managed AWS services. AWS Distro for OpenTelemetry (ADOT), deployed as a collector on each EKS Anywhere cluster, scrapes and forwards metrics from the server, Kubernetes, and application layers to Amazon Managed Service for Prometheus in the AWS Region. Amazon Managed Grafana then provides unified dashboards and alerting across the entire distributed environment.

With this approach, operators can monitor server availability (through Redfish events or Prometheus node-exporter), Kubernetes cluster health (through kube-state-metrics), and application-level metrics from one place, regardless of the underlying hardware vendor.

For a detailed implementation walkthrough, including Redfish event subscription patterns, OpenTelemetry collector configuration, Prometheus alerting rules, and Grafana dashboard setup for distributed sites on EKS Anywhere, see our related post: Building observability on Amazon Managed Grafana built on EKS Anywhere.

Hybrid integration patterns

Although EKS Anywhere clusters run on-premises, applications on them can depend on capabilities that span the cloud boundary: DNS resolution across both environments, TLS certificates, access to AWS APIs, and persistent storage. AWS offers services designed for this hybrid integration, and the orchestration engine can apply them automatically from its inventory as clusters and applications change.

Automated DNS management

When the state of a cluster, server, or application changes, Amazon DynamoDB Streams automatically trigger Lambda functions that update DNS records in Amazon Route 53 private hosted zones. Route 53 Resolver endpoints make these records resolvable from both AWS and on-premises, which supports service discovery without manual DNS configuration.

Certificate lifecycle operations

AWS Private Certificate Authority acts as a managed CA for the clusters, so there is no need to run a certificate authority at each site. cert-manager and the AWS Private CA Issuer request, renew, and distribute certificates from it automatically, which helps avoid outages from expired certificates.

Secure AWS access

Workloads on the clusters often need to call AWS APIs, such as sending Fluent Bit logs to Amazon Simple Storage Service (Amazon S3), publishing metrics to Amazon Managed Service for Prometheus, or pulling images from Amazon Elastic Container Registry (Amazon ECR). AWS IAM Roles Anywhere issues short-lived AWS credentials in exchange for a certificate the workload already holds, so no long-lived keys are stored at each site. It accepts that certificate only if it chains to a trusted source, so the orchestration engine registers each cluster’s own CA certificate as its trust anchor when the cluster comes up.

Persistent storage integration

External storage solutions such as Portworx can be integrated for stateful applications. DynamoDB Streams trigger automated interactions with storage provider APIs during node provisioning and cleanup operations and perform the configuration and reclaiming of storage resources.

The event-driven approach makes it possible for dependent infrastructure components to remain synchronized with the actual state of clusters and hardware, reducing operational overhead and minimizing configuration drift.

Conclusion

This blog post explores the architecture and capabilities of the hybrid cloud orchestration solution that modernizes on-premises infrastructure management using AWS technologies and EKS Anywhere. We’ve demonstrated how you can build a scalable, event-driven orchestration engine that manages your distributed infrastructure across hundreds of sites while maintaining operational consistency.

What’s next

In this post series, we’ve focused on the architectural patterns and capabilities that enable enterprise-scale hybrid cloud orchestration. To get started today, review the Amazon EKS Anywhere documentation and set up a bare-metal cluster or use the Docker provider for development and testing. In Part 2, we walk through the implementation of the orchestration solution with infrastructure-as-code templates, Step Functions workflow definitions, and operational runbooks you can adapt to your environment. Follow the AWS Containers blog for the next installment.


About the authors
The collective thoughts of the interwebz