A zero-day vulnerability in WinRAR is being exploited by at least two Russian criminal groups:
The vulnerability seemed to have super Windows powers. It abused alternate data streams, a Windows feature that allows different ways of representing the same file path. The exploit abused that feature to trigger a previously unknown path traversal flaw that caused WinRAR to plant malicious executables in attacker-chosen file paths %TEMP% and %LOCALAPPDATA%, which Windows normally makes off-limits because of their ability to execute code.
Since June 9, 2025, Internet users located in Russia and connecting to web services protected by Cloudflare have been throttled by Russian Internet Service Providers (ISPs).
As the throttling is being applied by local ISPs, the action is outside of Cloudflare’s control and we are unable, at this time, to restore reliable, high performance access to Cloudflare products and protected websites for Russian users in a lawful manner.
Internal data analysis suggests that the throttling allows Internet users to load only the first 16 KB of any web asset, rendering most web navigation impossible.
Cloudflare has not received any formal outreach or communication from Russian government entities about the motivation for such an action. Unfortunately, the actions are consistent with longstanding Russian efforts to isolate the Internet within its borders and reduce reliance on Western technology by replacing it with domestic alternatives. Indeed, Russian President Vladimir Putin recently publicly threatened to throttle US tech companies operating inside Russia.
External reports corroborate our analysis, and further suggest that a number of other service providers are also affected by throttling or other disruptive actions in Russia, including at least Hetzner, DigitalOcean, and OVH.
The impact
Cloudflare is seeing disruptions across connections initiated from inside Russia, even when the connection reaches our servers outside of Russia. Consistent with public reporting on Russia’s practices, this suggests that the disruption is happening inside Russian ISPs, close to users.
Russian Internet Services Providers (ISPs) confirmed to be implementing these disruptive actions include, but are not limited to, Rostelecom, Megafon, Vimpelcom, MTS, and MGTS.
Based on our observations, Russian ISPs are using several throttling and blocking mechanisms affecting sites protected by Cloudflare, including injected packets to halt the connection and blocking packets so the connection times out. A new tactic that began on June 9 limits the amount of content served to 16 KB, which renders many websites barely usable.
The throttling affects all connection methods and protocols, including HTTP/1.1 and HTTP/2 on TCP and TLS, as well as HTTP/3 on QUIC.
The view from Cloudflare data
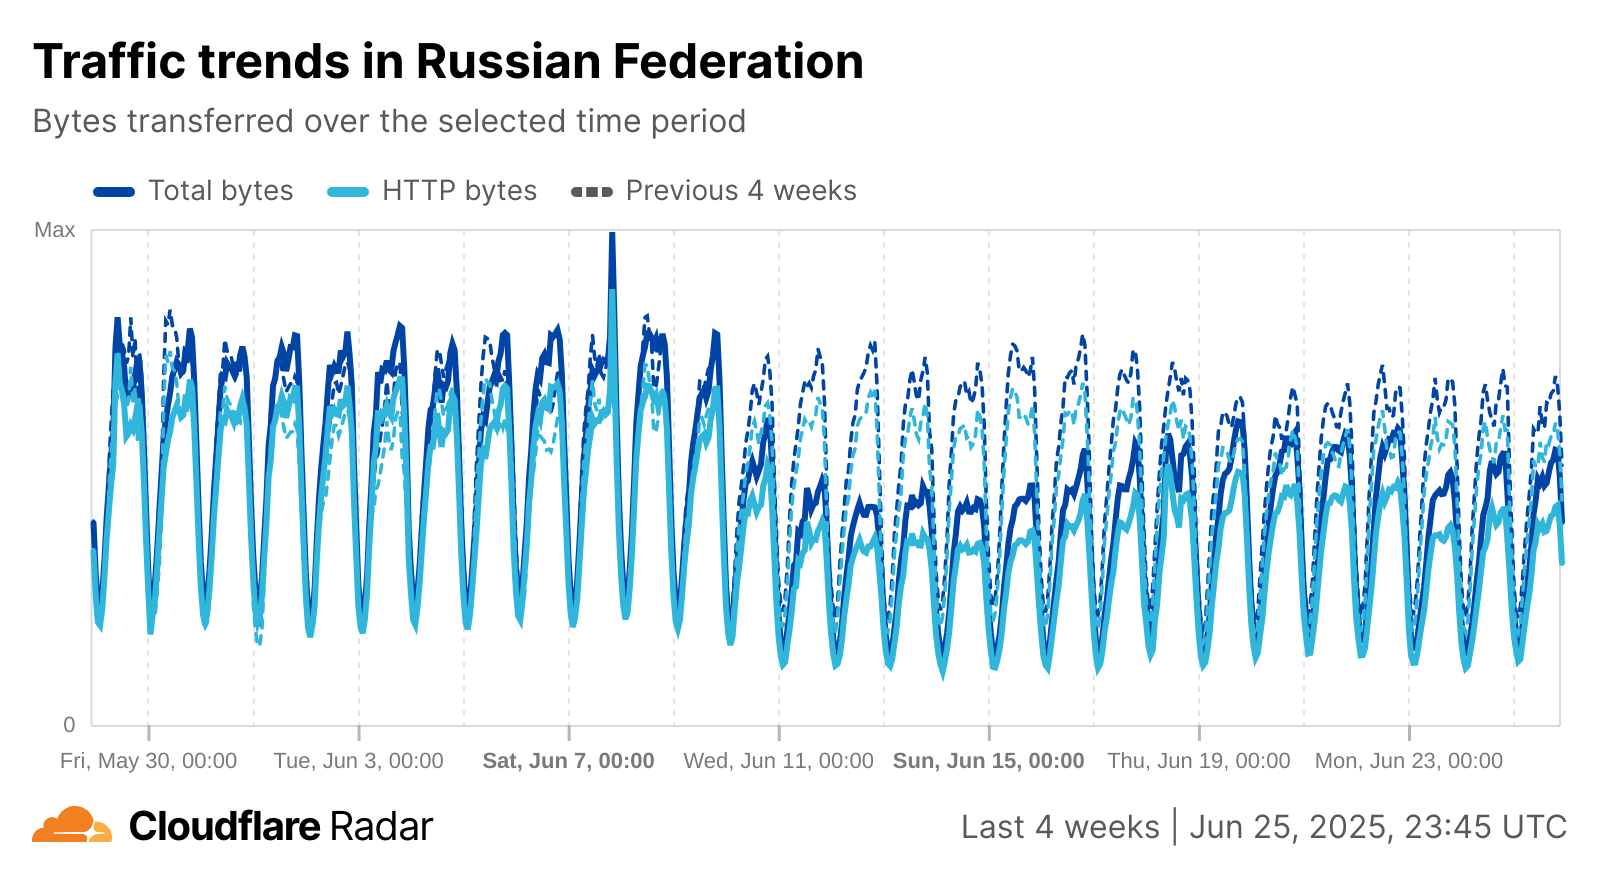
Traffic trends
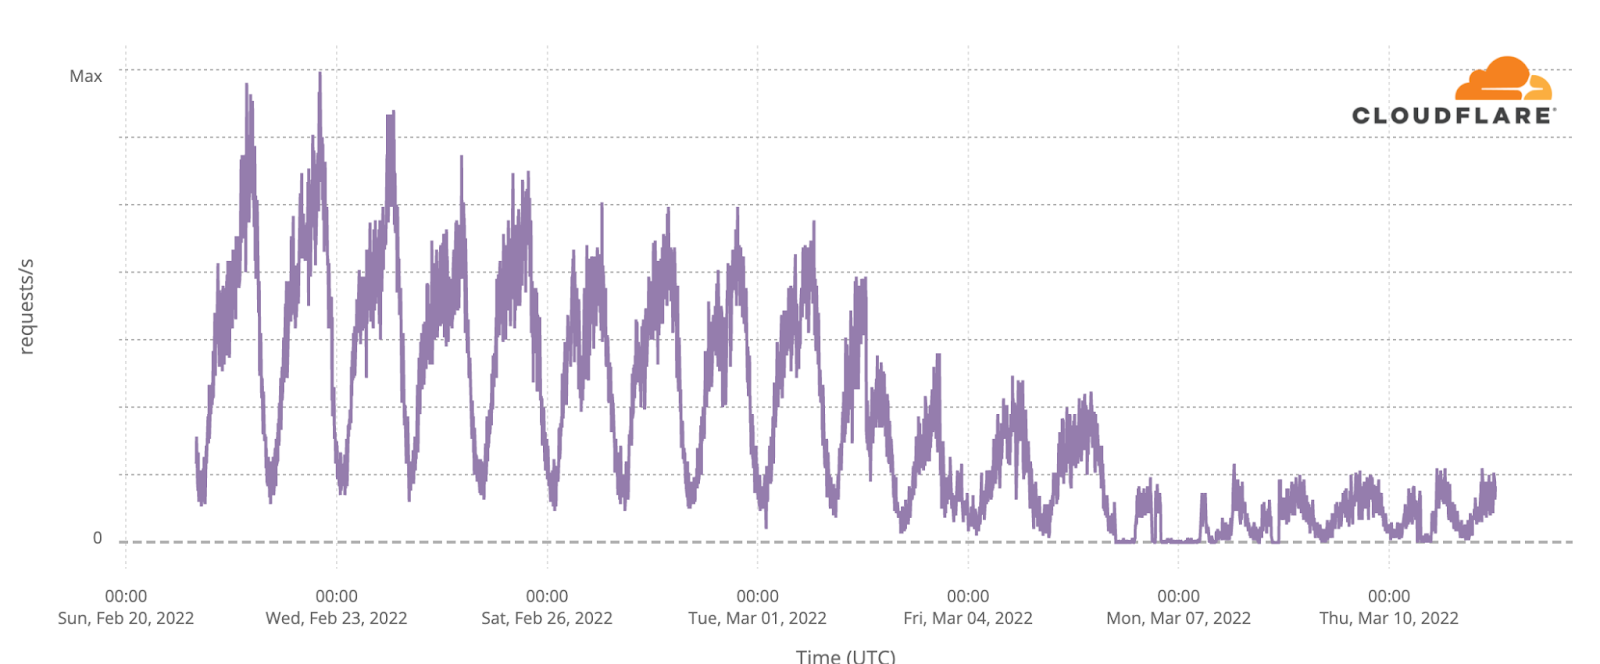
Cloudflare Radar exists to share insights and bring transparency to Internet trends. The high rate of connectivity errors to all our data centers has resulted in an overall decrease in traffic served to Russian users. The reduction in traffic can be observed on Cloudflare Radar:
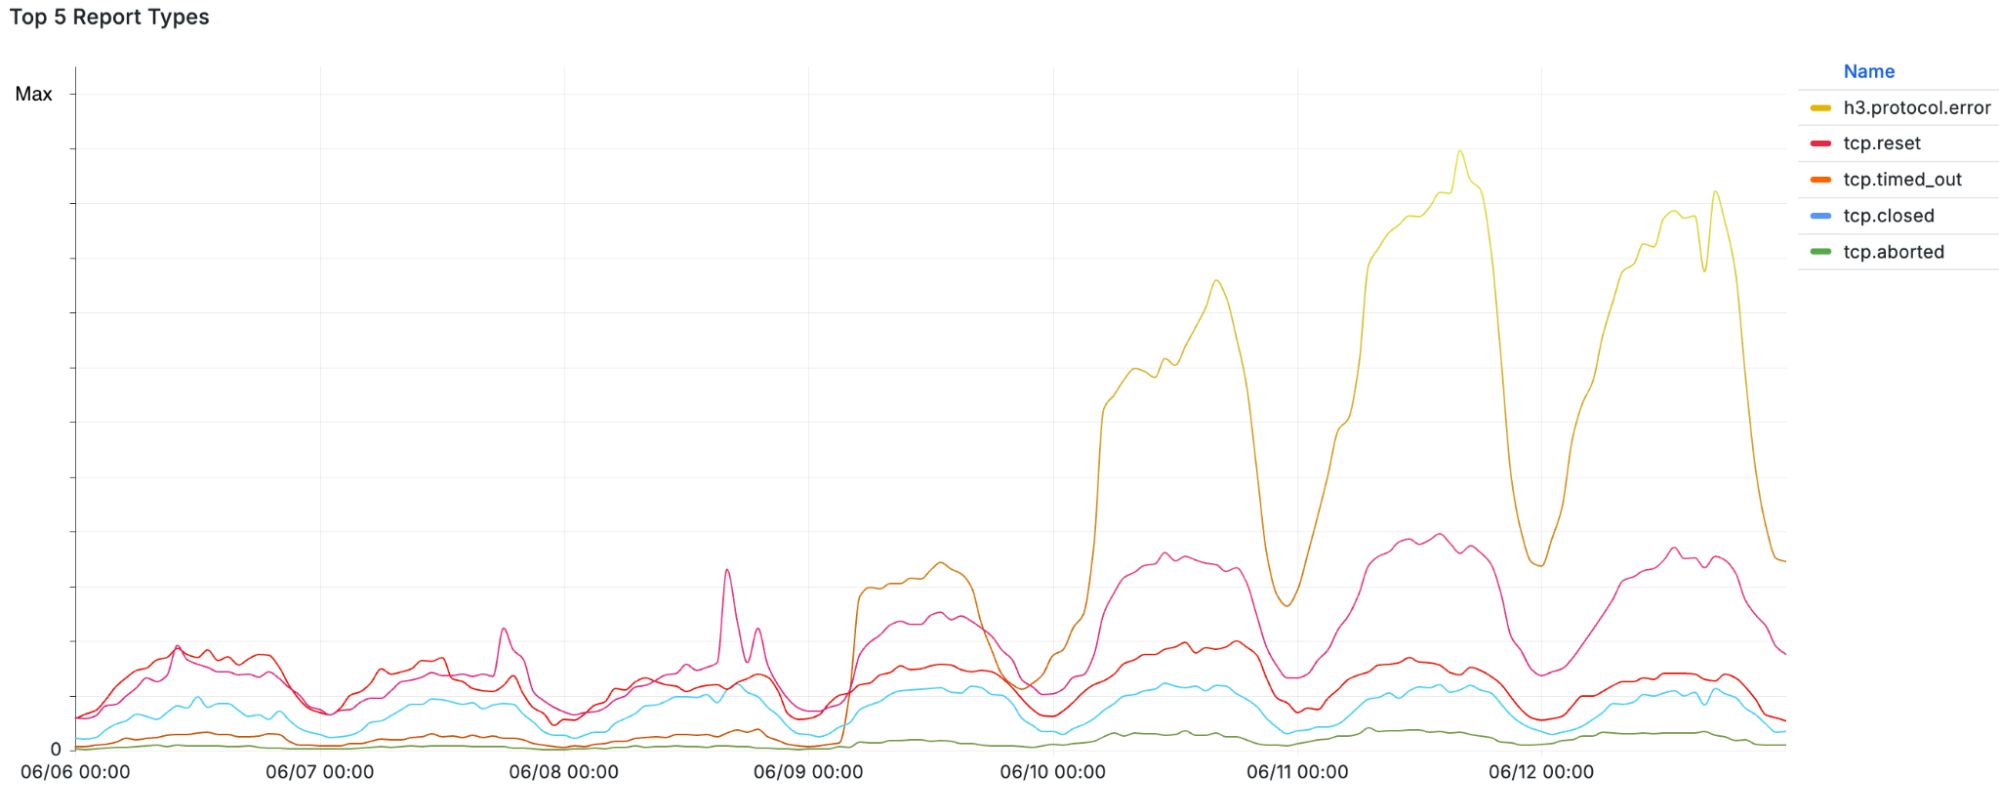
Client-side reports via Network Error Logging
Some customers elect to enable W3C-defined Network Error Logging (NEL), a feature that embeds error-reporting instructions inside the headers of web content that users request. The instructions tell web browsers what errors to report, and how to do so. Below is a view of NEL reports that show an increase of TCP connections being ‘reset’ prematurely (as explained in our tampering and Radar resets blogs). Separately, the large growth in h3.protocol.error shows that QUIC connections have been greatly affected:
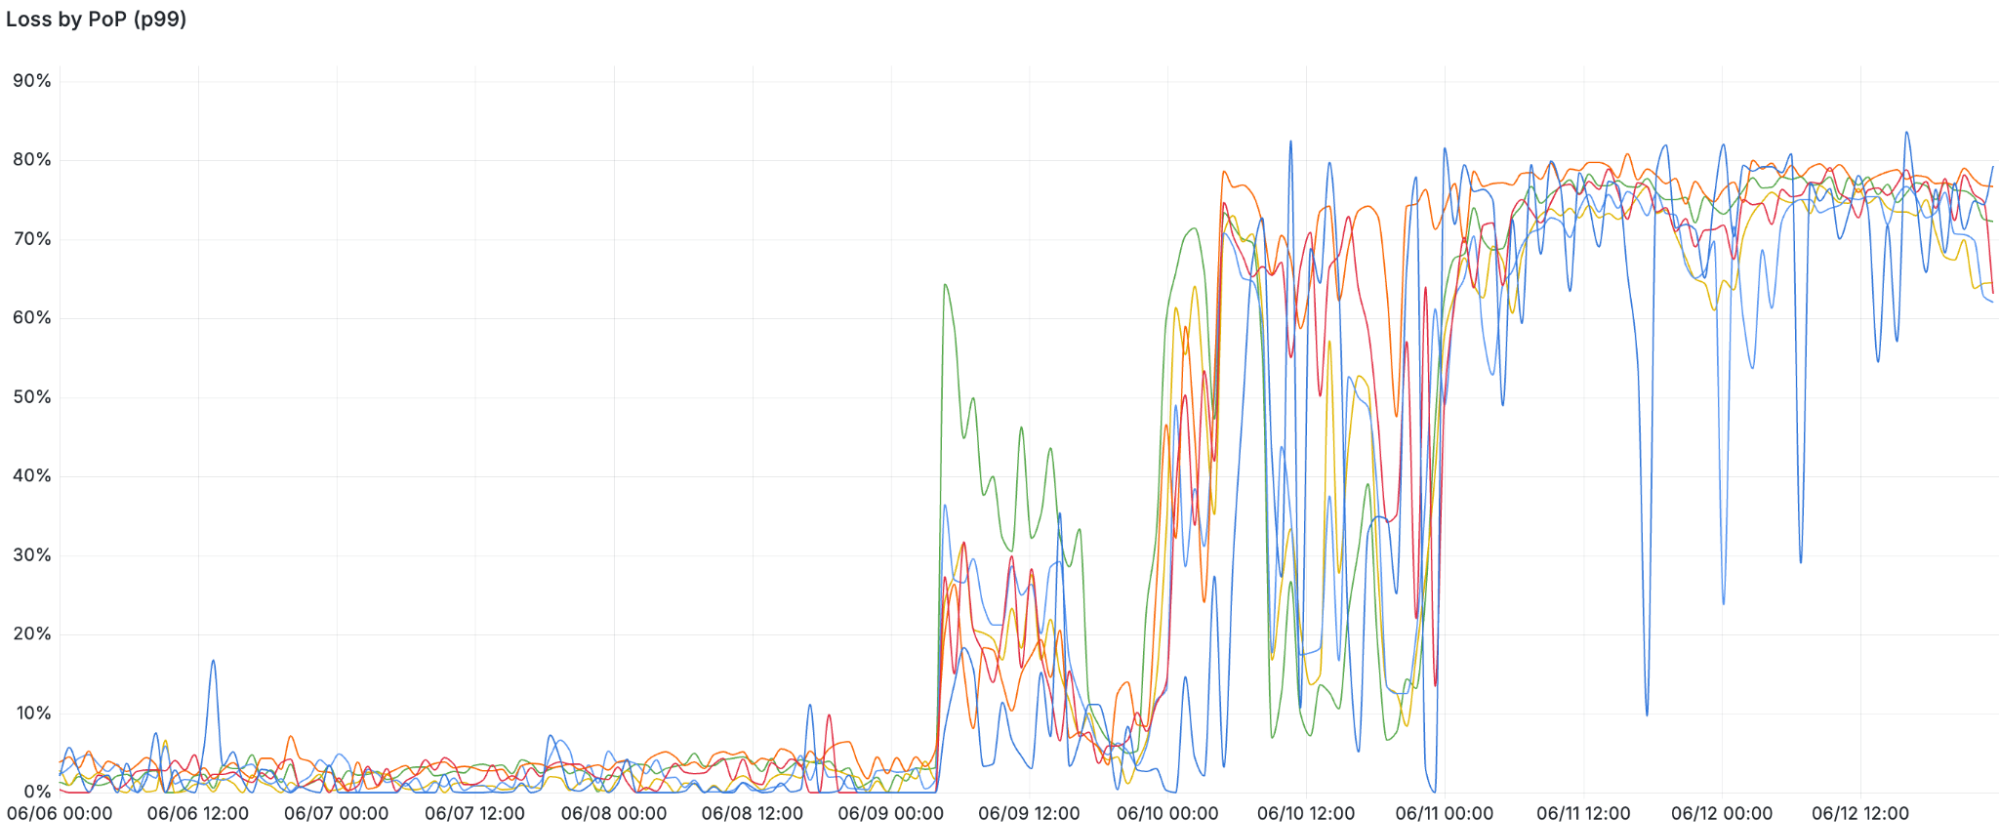
Corroboration of throttling using internal data
The effects of the throttling can also be observed in our internal tooling. The chart below shows packet loss to our Russian data centers, each data center represented by a different line. The Y-axis is the proportion of packet loss:
High packet loss is a strong signal but does not on its own indicate throttling, since there might be other explanations. For example, an explanation may be our servers trying to resend packets multiple times in during some other mass failure that hinders, but does not completely halt, communication.
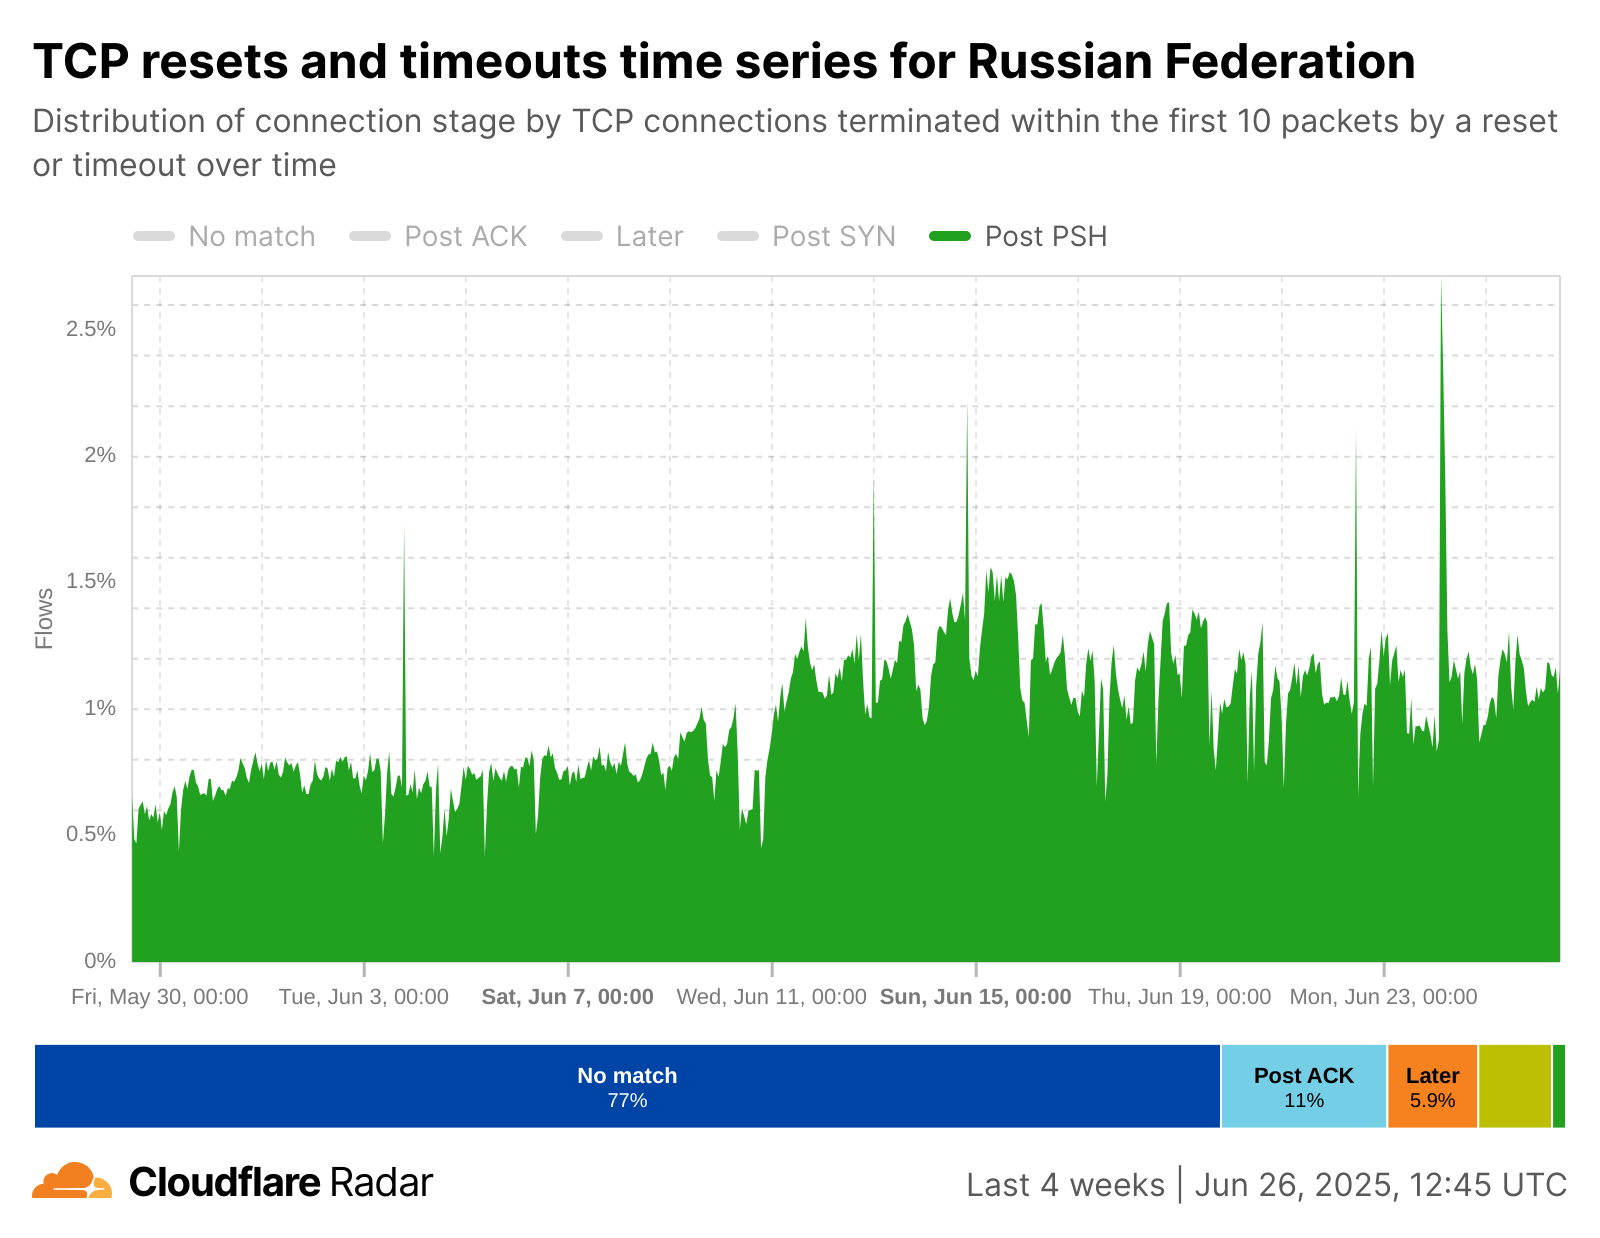
However, we have two additional pieces of information to work with. The first consists of public reports that “throttling” in this case means blocking all connections after 16 KB of data has been transmitted, which takes 10 to 14 packets (depending on the underlying technology). Second, we have our recently deployed “Resets and Timeouts” data that captures anomalous behaviour in TCP when it occurs within the first 10 packets. Since 10 packets can contain 16 KB of data, some connections that are blocked around 16 KB will be visible at the “Post PSH” stage in the Radar data. In TCP, the ‘PSH’ message means Cloudflare got the initial request and data transfer has begun. If the connection is blocked at this stage, then many of the sent packets will be lost.
The graph below uses Radar’s Data Explorer to focus on just the Post-PSH stage, where there is a dip followed by an immediate and proportionally large increase before June 11. This pattern corresponds closely with the loss data seen above:
If you run Internet sites for Russian users
If you are using Cloudflare to protect your sites, unfortunately, at this time, Cloudflare does not have the ability to restore Internet connectivity for Russia-based users. We advise you to reach out and solicit Russian entities to lift the throttling measures that have been put in place.
If you are a Cloudflare enterprise customer, please reach out to your account team for further assistance.
Access to a free and open Internet is critical for individual rights and economic development. We condemn any attempt to prevent Russian citizens from accessing it.
You can read the details of Operation Spiderweb elsewhere. What interests me are the implications for future warfare:
If the Ukrainians could sneak drones so close to major air bases in a police state such as Russia, what is to prevent the Chinese from doing the same with U.S. air bases? Or the Pakistanis with Indian air bases? Or the North Koreans with South Korean air bases? Militaries that thought they had secured their air bases with electrified fences and guard posts will now have to reckon with the threat from the skies posed by cheap, ubiquitous drones that can be easily modified for military use. This will necessitate a massive investment in counter-drone systems. Money spent on conventional manned weapons systems increasingly looks to be as wasted as spending on the cavalry in the 1930s.
There’s a balance between the cost of the thing, and the cost to destroy the thing, and that balance is changing dramatically. This isn’t new, of course. Here’s an article from last year about the cost of drones versus the cost of top-of-the-line fighter jets. If $35K in drones (117 drones times an estimated $300 per drone) can destroy $7B in Russian bombers and other long-range aircraft, why would anyone build more of those planes? And we can have this discussion about ships, or tanks, or pretty much every other military vehicle. And then we can add in drone-coordinating technologies like swarming.
Clearly we need more research on remotely and automatically disablingdrones.
Russia is proposing a rule that all foreigners in Moscow install a tracking app on their phones.
Using a mobile application that all foreigners will have to install on their smartphones, the Russian state will receive the following information:
Residence location
Fingerprint
Face photograph
Real-time geo-location monitoring
This isn’t the first time we’ve seen this. Qatar did it in 2022 around the World Cup:
“After accepting the terms of these apps, moderators will have complete control of users’ devices,” he continued. “All personal content, the ability to edit it, share it, extract it as well as data from other apps on your device is in their hands. Moderators will even have the power to unlock users’ devices remotely.”
Former CISA Director Jen Easterly writes about a new international intelligence sharing co-op:
Historically, China, Russia, Iran & North Korea have cooperated to some extent on military and intelligence matters, but differences in language, culture, politics & technological sophistication have hindered deeper collaboration, including in cyber. Shifting geopolitical dynamics, however, could drive these states toward a more formalized intell-sharing partnership. Such a “Four Eyes” alliance would be motivated by common adversaries and strategic interests, including an enhanced capacity to resist economic sanctions and support proxy conflicts.
The technique is known as device code phishing. It exploits “device code flow,” a form of authentication formalized in the industry-wide OAuth standard. Authentication through device code flow is designed for logging printers, smart TVs, and similar devices into accounts. These devices typically don’t support browsers, making it difficult to sign in using more standard forms of authentication, such as entering user names, passwords, and two-factor mechanisms.
Rather than authenticating the user directly, the input-constrained device displays an alphabetic or alphanumeric device code along with a link associated with the user account. The user opens the link on a computer or other device that’s easier to sign in with and enters the code. The remote server then sends a token to the input-constrained device that logs it into the account.
Device authorization relies on two paths: one from an app or code running on the input-constrained device seeking permission to log in and the other from the browser of the device the user normally uses for signing in.
ProPublica has a long investigative article on how the Cyber Safety Review Board failed to investigate the SolarWinds attack, and specifically Microsoft’s culpability, even though they were directed by President Biden to do so.
Cloudforce One is publishing the results of our investigation and real-time effort to detect, deny, degrade, disrupt, and delay threat activity by the Russia-aligned threat actor FlyingYeti during their latest phishing campaign targeting Ukraine. At the onset of Russia’s invasion of Ukraine on February 24, 2022, Ukraine introduced a moratorium on evictions and termination of utility services for unpaid debt. The moratorium ended in January 2024, resulting in significant debt liability and increased financial stress for Ukrainian citizens. The FlyingYeti campaign capitalized on anxiety over the potential loss of access to housing and utilities by enticing targets to open malicious files via debt-themed lures. If opened, the files would result in infection with the PowerShell malware known as COOKBOX, allowing FlyingYeti to support follow-on objectives, such as installation of additional payloads and control over the victim’s system.
Since April 26, 2024, Cloudforce One has taken measures to prevent FlyingYeti from launching their phishing campaign – a campaign involving the use of Cloudflare Workers and GitHub, as well as exploitation of the WinRAR vulnerability CVE-2023-38831. Our countermeasures included internal actions, such as detections and code takedowns, as well as external collaboration with third parties to remove the actor’s cloud-hosted malware. Our effectiveness against this actor prolonged their operational timeline from days to weeks. For example, in a single instance, FlyingYeti spent almost eight hours debugging their code as a result of our mitigations. By employing proactive defense measures, we successfully stopped this determined threat actor from achieving their objectives.
Executive Summary
On April 18, 2024, Cloudforce One detected the Russia-aligned threat actor FlyingYeti preparing to launch a phishing espionage campaign targeting individuals in Ukraine.
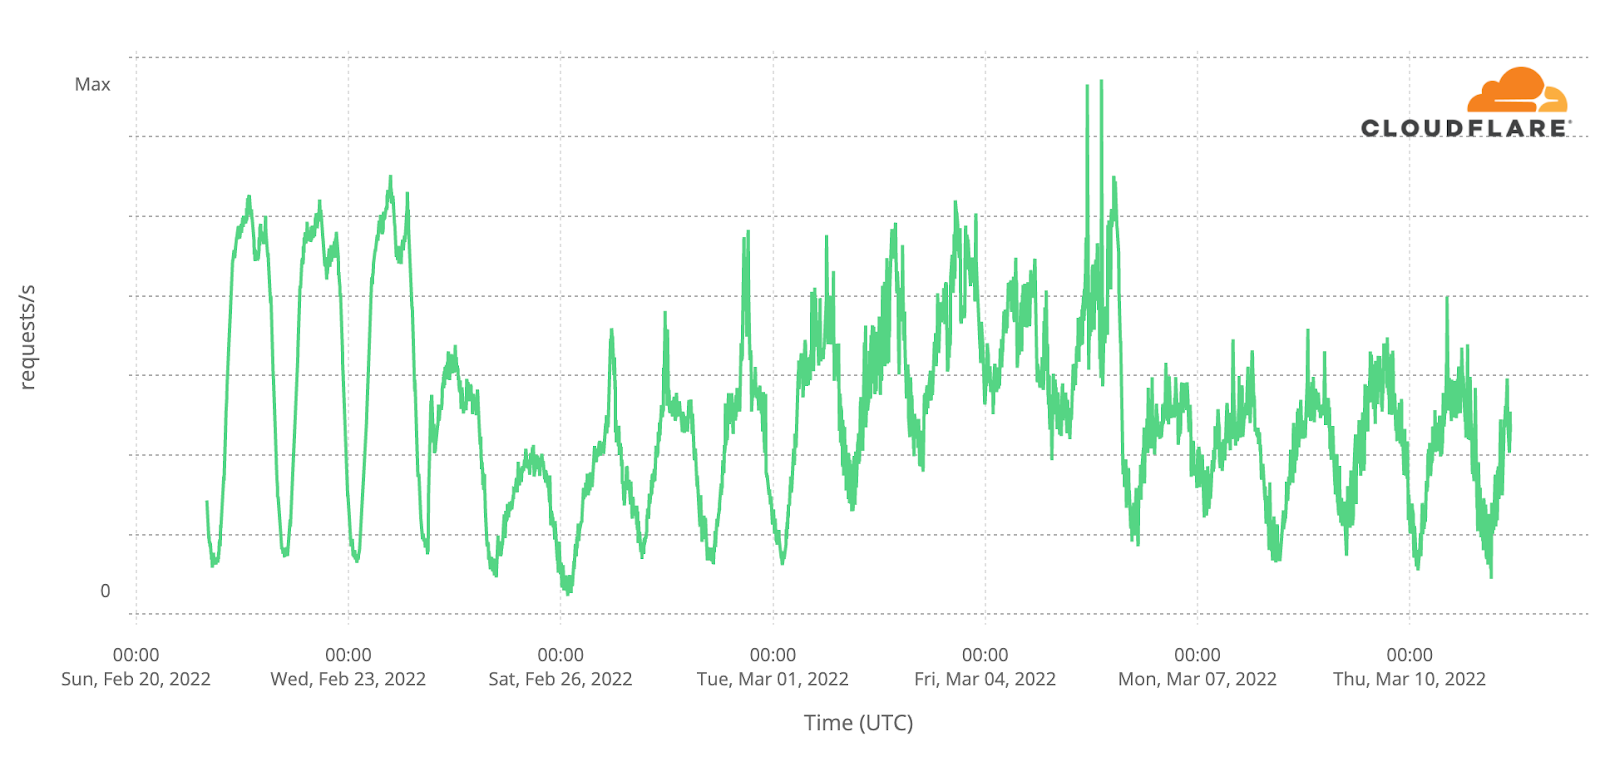
From mid-April to mid-May, we observed FlyingYeti conduct reconnaissance activity, create lure content for use in their phishing campaign, and develop various iterations of their malware. We assessed that the threat actor intended to launch their campaign in early May, likely following Orthodox Easter.
After several weeks of monitoring actor reconnaissance and weaponization activity (Cyber Kill Chain Stages 1 and 2), we successfully disrupted FlyingYeti’s operation moments after the final COOKBOX payload was built.
The payload included an exploit for the WinRAR vulnerability CVE-2023-38831, which FlyingYeti will likely continue to use in their phishing campaigns to infect targets with malware.
We offer steps users can take to defend themselves against FlyingYeti phishing operations, and also provide recommendations, detections, and indicators of compromise.
Who is FlyingYeti?
FlyingYeti is the cryptonym given by Cloudforce One to the threat group behind this phishing campaign, which overlaps with UAC-0149 activity tracked by CERT-UA in February and April 2024. The threat actor uses dynamic DNS (DDNS) for their infrastructure and leverages cloud-based platforms for hosting malicious content and for malware command and control (C2). Our investigation of FlyingYeti TTPs suggests this is likely a Russia-aligned threat group. The actor appears to primarily focus on targeting Ukrainian military entities. Additionally, we observed Russian-language comments in FlyingYeti’s code, and the actor’s operational hours falling within the UTC+3 time zone.
Campaign background
In the days leading up to the start of the campaign, Cloudforce One observed FlyingYeti conducting reconnaissance on payment processes for Ukrainian communal housing and utility services:
April 22, 2024 – research into changes made in 2016 that introduced the use of QR codes in payment notices
April 22, 2024 – research on current developments concerning housing and utility debt in Ukraine
April 25, 2024 – research on the legal basis for restructuring housing debt in Ukraine as well as debt involving utilities, such as gas and electricity
Cloudforce One judges that the observed reconnaissance is likely due to the Ukrainian government’s payment moratorium introduced at the start of the full-fledged invasion in February 2022. Under this moratorium, outstanding debt would not lead to evictions or termination of provision of utility services. However, on January 9, 2024, the government lifted this ban, resulting in increased pressure on Ukrainian citizens with outstanding debt. FlyingYeti sought to capitalize on that pressure, leveraging debt restructuring and payment-related lures in an attempt to increase their chances of successfully targeting Ukrainian individuals.
Analysis of the Komunalka-themed phishing site
The disrupted phishing campaign would have directed FlyingYeti targets to an actor-controlled GitHub page at hxxps[:]//komunalka[.]github[.]io, which is a spoofed version of the Kyiv Komunalka communal housing site https://www.komunalka.ua. Komunalka functions as a payment processor for residents in the Kyiv region and allows for payment of utilities, such as gas, electricity, telephone, and Internet. Additionally, users can pay other fees and fines, and even donate to Ukraine’s defense forces.
Based on past FlyingYeti operations, targets may be directed to the actor’s Github page via a link in a phishing email or an encrypted Signal message. If a target accesses the spoofed Komunalka platform at hxxps[:]//komunalka[.]github[.]io, the page displays a large green button with a prompt to download the document “Рахунок.docx” (“Invoice.docx”), as shown in Figure 1. This button masquerades as a link to an overdue payment invoice but actually results in the download of the malicious archive “Заборгованість по ЖКП.rar” (“Debt for housing and utility services.rar”).
Figure 1: Prompt to download malicious archive “Заборгованість по ЖКП.rar”
A series of steps must take place for the download to successfully occur:
The target clicks the green button on the actor’s GitHub page hxxps[:]//komunalka.github[.]io
The target’s device sends an HTTP POST request to the Cloudflare Worker worker-polished-union-f396[.]vqu89698[.]workers[.]dev with the HTTP request body set to “user=Iahhdr”
The Cloudflare Worker processes the request and evaluates the HTTP request body
If the request conditions are met, the Worker fetches the RAR file from hxxps[:]//raw[.]githubusercontent[.]com/kudoc8989/project/main/Заборгованість по ЖКП.rar, which is then downloaded on the target’s device
Cloudforce One identified the infrastructure responsible for facilitating the download of the malicious RAR file and remediated the actor-associated Worker, preventing FlyingYeti from delivering its malicious tooling. In an effort to circumvent Cloudforce One’s mitigation measures, FlyingYeti later changed their malware delivery method. Instead of the Workers domain fetching the malicious RAR file, it was loaded directly from GitHub.
Analysis of the malicious RAR file
During remediation, Cloudforce One recovered the RAR file “Заборгованість по ЖКП.rar” and performed analysis of the malicious payload. The downloaded RAR archive contains multiple files, including a file with a name that contains the unicode character “U+201F”. This character appears as whitespace on Windows devices and can be used to “hide” file extensions by adding excessive whitespace between the filename and the file extension. As highlighted in blue in Figure 2, this cleverly named file within the RAR archive appears to be a PDF document but is actually a malicious CMD file (“Рахунок на оплату.pdf[unicode character U+201F].cmd”).
Figure 2: Files contained in the malicious RAR archive “Заборгованість по ЖКП.rar” (“Housing Debt.rar”)
FlyingYeti included a benign PDF in the archive with the same name as the CMD file but without the unicode character, “Рахунок на оплату.pdf” (“Invoice for payment.pdf”). Additionally, the directory name for the archive once decompressed also contained the name “Рахунок на оплату.pdf”. This overlap in names of the benign PDF and the directory allows the actor to exploit the WinRAR vulnerability CVE-2023-38831. More specifically, when an archive includes a benign file with the same name as the directory, the entire contents of the directory are opened by the WinRAR application, resulting in the execution of the malicious CMD. In other words, when the target believes they are opening the benign PDF “Рахунок на оплату.pdf”, the malicious CMD file is executed.
The CMD file contains the FlyingYeti PowerShell malware known as COOKBOX. The malware is designed to persist on a host, serving as a foothold in the infected device. Once installed, this variant of COOKBOX will make requests to the DDNS domain postdock[.]serveftp[.]com for C2, awaiting PowerShell cmdlets that the malware will subsequently run.
Alongside COOKBOX, several decoy documents are opened, which contain hidden tracking links using the Canary Tokens service. The first document, shown in Figure 3 below, poses as an agreement under which debt for housing and utility services will be restructured.
Figure 3: Decoy document Реструктуризація боргу за житлово комунальні послуги.docx
The second document (Figure 4) is a user agreement outlining the terms and conditions for the usage of the payment platform komunalka[.]ua.
The use of relevant decoy documents as part of the phishing and delivery activity are likely an effort by FlyingYeti operators to increase the appearance of legitimacy of their activities.
The phishing theme we identified in this campaign is likely one of many themes leveraged by this actor in a larger operation to target Ukrainian entities, in particular their defense forces. In fact, the threat activity we detailed in this blog uses many of the same techniques outlined in a recent FlyingYeti campaign disclosed by CERT-UA in mid-April 2024, where the actor leveraged United Nations-themed lures involving Peace Support Operations to target Ukraine’s military. Due to Cloudforce One’s defensive actions covered in the next section, this latest FlyingYeti campaign was prevented as of the time of publication.
Mitigating FlyingYeti activity
Cloudforce One mitigated FlyingYeti’s campaign through a series of actions. Each action was taken to increase the actor’s cost of continuing their operations. When assessing which action to take and why, we carefully weighed the pros and cons in order to provide an effective active defense strategy against this actor. Our general goal was to increase the amount of time the threat actor spent trying to develop and weaponize their campaign.
We were able to successfully extend the timeline of the threat actor’s operations from hours to weeks. At each interdiction point, we assessed the impact of our mitigation to ensure the actor would spend more time attempting to launch their campaign. Our mitigation measures disrupted the actor’s activity, in one instance resulting in eight additional hours spent on debugging code.
Due to our proactive defense efforts, FlyingYeti operators adapted their tactics multiple times in their attempts to launch the campaign. The actor originally intended to have the Cloudflare Worker fetch the malicious RAR file from GitHub. After Cloudforce One interdiction of the Worker, the actor attempted to create additional Workers via a new account. In response, we disabled all Workers, leading the actor to load the RAR file directly from GitHub. Cloudforce One notified GitHub, resulting in the takedown of the RAR file, the GitHub project, and suspension of the account used to host the RAR file. In return, FlyingYeti began testing the option to host the RAR file on the file sharing sites pixeldrain and Filemail, where we observed the actor alternating the link on the Komunalka phishing site between the following:
We notified GitHub of the actor’s evolving tactics, and in response GitHub removed the Komunalka phishing site. After analyzing the files hosted on pixeldrain and Filemail, we determined the actor uploaded dummy payloads, likely to monitor access to their phishing infrastructure (FileMail logs IP addresses, and both file hosting sites provide view and download counts). At the time of publication, we did not observe FlyingYeti upload the malicious RAR file to either file hosting site, nor did we identify the use of alternative phishing or malware delivery methods.
A timeline of FlyingYeti’s activity and our corresponding mitigations can be found below.
Event timeline
Date
Event Description
2024-04-18 12:18
Threat Actor (TA) creates a Worker to handle requests from a phishing site
2024-04-18 14:16
TA creates phishing site komunalka[.]github[.]io on GitHub
2024-04-25 12:25
TA creates a GitHub repo to host a RAR file
2024-04-26 07:46
TA updates the first Worker to handle requests from users visiting komunalka[.]github[.]io
2024-04-26 08:24
TA uploads a benign test RAR to the GitHub repo
2024-04-26 13:38
Cloudforce One identifies a Worker receiving requests from users visiting komunalka[.]github[.]io, observes its use as a phishing page
2024-04-26 13:46
Cloudforce One identifies that the Worker fetches a RAR file from GitHub (the malicious RAR payload is not yet hosted on the site)
2024-04-26 19:22
Cloudforce One creates a detection to identify the Worker that fetches the RAR
2024-04-26 21:13
Cloudforce One deploys real-time monitoring of the RAR file on GitHub
2024-05-02 06:35
TA deploys a weaponized RAR (CVE-2023-38831) to GitHub with their COOKBOX malware packaged in the archive
2024-05-06 10:03
TA attempts to update the Worker with link to weaponized RAR, the Worker is immediately blocked
2024-05-06 10:38
TA creates a new Worker, the Worker is immediately blocked
2024-05-06 11:04
TA creates a new account (#2) on Cloudflare
2024-05-06 11:06
TA creates a new Worker on account #2 (blocked)
2024-05-06 11:50
TA creates a new Worker on account #2 (blocked)
2024-05-06 12:22
TA creates a new modified Worker on account #2
2024-05-06 16:05
Cloudforce One disables the running Worker on account #2
2024-05-07 22:16
TA notices the Worker is blocked, ceases all operations
2024-05-07 22:18
TA deletes original Worker first created to fetch the RAR file from the GitHub phishing page
2024-05-09 19:28
Cloudforce One adds phishing page komunalka[.]github[.]io to real-time monitoring
2024-05-13 07:36
TA updates the github.io phishing site to point directly to the GitHub RAR link
2024-05-13 17:47
Cloudforce One adds COOKBOX C2 postdock[.]serveftp[.]com to real-time monitoring for DNS resolution
2024-05-14 00:04
Cloudforce One notifies GitHub to take down the RAR file
2024-05-15 09:00
GitHub user, project, and link for RAR are no longer accessible
2024-05-21 08:23
TA updates Komunalka phishing site on github.io to link to pixeldrain URL for dummy payload (pixeldrain only tracks view and download counts)
2024-05-21 08:25
TA updates Komunalka phishing site to link to FileMail URL for dummy payload (FileMail tracks not only view and download counts, but also IP addresses)
2024-05-21 12:21
Cloudforce One downloads PixelDrain document to evaluate payload
2024-05-21 12:47
Cloudforce One downloads FileMail document to evaluate payload
2024-05-29 23:59
GitHub takes down Komunalka phishing site
2024-05-30 13:00
Cloudforce One publishes the results of this investigation
Coordinating our FlyingYeti response
Cloudforce One leveraged industry relationships to provide advanced warning and to mitigate the actor’s activity. To further protect the intended targets from this phishing threat, Cloudforce One notified and collaborated closely with GitHub’s Threat Intelligence and Trust and Safety Teams. We also notified CERT-UA and Cloudflare industry partners such as CrowdStrike, Mandiant/Google Threat Intelligence, and Microsoft Threat Intelligence.
Hunting FlyingYeti operations
There are several ways to hunt FlyingYeti in your environment. These include using PowerShell to hunt for WinRAR files, deploying Microsoft Sentinel analytics rules, and running Splunk scripts as detailed below. Note that these detections may identify activity related to this threat, but may also trigger unrelated threat activity.
PowerShell hunting
Consider running a PowerShell script such as this one in your environment to identify exploitation of CVE-2023-38831. This script will interrogate WinRAR files for evidence of the exploit.
CVE-2023-38831
Description:winrar exploit detection
open suspios (.tar / .zip / .rar) and run this script to check it

function winrar-exploit-detect(){
$targetExtensions = @(".cmd" , ".ps1" , ".bat")
$tempDir = [System.Environment]::GetEnvironmentVariable("TEMP")
$dirsToCheck = Get-ChildItem -Path $tempDir -Directory -Filter "Rar*"
foreach ($dir in $dirsToCheck) {
    $files = Get-ChildItem -Path $dir.FullName -File
    foreach ($file in $files) {
        $fileName = $file.Name
        $fileExtension = [System.IO.Path]::GetExtension($fileName)
        if ($targetExtensions -contains $fileExtension) {
            $fileWithoutExtension = [System.IO.Path]::GetFileNameWithoutExtension($fileName); $filename.TrimEnd() -replace '\.$'
            $cmdFileName = "$fileWithoutExtension"
            $secondFile = Join-Path -Path $dir.FullName -ChildPath $cmdFileName

            if (Test-Path $secondFile -PathType Leaf) {
                Write-Host "[!] Suspicious pair detected "
                Write-Host "[*]  Original File:$($secondFile)" -ForegroundColor Green
                Write-Host "[*] Suspicious File:$($file.FullName)" -ForegroundColor Red

                # Read and display the content of the command file
                $cmdFileContent = Get-Content -Path $($file.FullName)
                Write-Host "[+] Command File Content:$cmdFileContent"
            }
        }
    }
}
}
winrar-exploit-detect
Microsoft Sentinel
In Microsoft Sentinel, consider deploying the rule provided below, which identifies WinRAR execution via cmd.exe. Results generated by this rule may be indicative of attack activity on the endpoint and should be analyzed.
DeviceProcessEvents
| where InitiatingProcessParentFileName has @"winrar.exe"
| where InitiatingProcessFileName has @"cmd.exe"
| project Timestamp, DeviceName, FileName, FolderPath, ProcessCommandLine, AccountName
| sort by Timestamp desc
Splunk
Consider using this script in your Splunk environment to look for WinRAR CVE-2023-38831 execution on your Microsoft endpoints. Results generated by this script may be indicative of attack activity on the endpoint and should be analyzed.
| tstats `security_content_summariesonly` count min(_time) as firstTime max(_time) as lastTime from datamodel=Endpoint.Processes where Processes.parent_process_name=winrar.exe `windows_shells` OR Processes.process_name IN ("certutil.exe","mshta.exe","bitsadmin.exe") by Processes.dest Processes.user Processes.parent_process_name Processes.parent_process Processes.process_name Processes.process Processes.process_id Processes.parent_process_id
| `drop_dm_object_name(Processes)`
| `security_content_ctime(firstTime)`
| `security_content_ctime(lastTime)`
| `winrar_spawning_shell_application_filter`
Cloudflare product detections
Cloudflare Email Security
Cloudflare Email Security (CES) customers can identify FlyingYeti threat activity with the following detections.
CVE-2023-38831
FLYINGYETI.COOKBOX
FLYINGYETI.COOKBOX.Launcher
FLYINGYETI.Rar
Recommendations
Cloudflare recommends taking the following steps to mitigate this type of activity:
Implement Zero Trust architecture foundations:
Deploy Cloud Email Security to ensure that email services are protected against phishing, BEC and other threats
Leverage browser isolation to separate messaging applications like LinkedIn, email, and Signal from your main network
Scan, monitor and/or enforce controls on specific or sensitive data moving through your network environment with data loss prevention policies
Ensure your systems have the latest WinRAR and Microsoft security updates installed
Consider preventing WinRAR files from entering your environment, both at your Cloud Email Security solution and your Internet Traffic Gateway
Run an Endpoint Detection and Response (EDR) tool such as CrowdStrike or Microsoft Defender for Endpoint to get visibility into binary execution on hosts
Search your environment for the FlyingYeti indicators of compromise (IOCs) shown below to identify potential actor activity within your network.
If you’re looking to uncover additional Threat Intelligence insights for your organization or need bespoke Threat Intelligence information for an incident, consider engaging with Cloudforce One by contacting your Customer Success manager or filling out this form.
Microsoft is reporting that a Russian intelligence agency—the same one responsible for SolarWinds—accessed the email system of the company’s executives.
Beginning in late November 2023, the threat actor used a password spray attack to compromise a legacy non-production test tenant account and gain a foothold, and then used the account’s permissions to access a very small percentage of Microsoft corporate email accounts, including members of our senior leadership team and employees in our cybersecurity, legal, and other functions, and exfiltrated some emails and attached documents. The investigation indicates they were initially targeting email accounts for information related to Midnight Blizzard itself.
This is nutty. How does a “legacy non-production test tenant account” have access to executive e-mails? And why no try-factor authentication?
The Solntsepek group has takencreditfortheattack. They’re linked to the Russian military, so it’s unclear whether the attack was government directed or freelance.
This is one of the most significant cyberattacks since Russia invaded in February 2022.
A new worm that spreads via USB sticks is infecting computers in Ukraine and beyond.
The group—known by many names, including Gamaredon, Primitive Bear, ACTINIUM, Armageddon, and Shuckworm—has been active since at least 2014 and has been attributed to Russia’s Federal Security Service by the Security Service of Ukraine. Most Kremlin-backed groups take pains to fly under the radar; Gamaredon doesn’t care to. Its espionage-motivated campaigns targeting large numbers of Ukrainian organizations are easy to detect and tie back to the Russian government. The campaigns typically revolve around malware that aims to obtain as much information from targets as possible.
One of those tools is a computer worm designed to spread from computer to computer through USB drives. Tracked by researchers from Check Point Research as LitterDrifter, the malware is written in the Visual Basic Scripting language. LitterDrifter serves two purposes: to promiscuously spread from USB drive to USB drive and to permanently infect the devices that connect to such drives with malware that permanently communicates with Gamaredon-operated command-and-control servers.
Turns out that it’s easy to broadcast radio commands that force Polish trains to stop:
…the saboteurs appear to have sent simple so-called “radio-stop” commands via radio frequency to the trains they targeted. Because the trains use a radio system that lacks encryption or authentication for those commands, Olejnik says, anyone with as little as $30 of off-the-shelf radio equipment can broadcast the command to a Polish train—sending a series of three acoustic tones at a 150.100 megahertz frequency—and trigger their emergency stop function.
“It is three tonal messages sent consecutively. Once the radio equipment receives it, the locomotive goes to a halt,” Olejnik says, pointing to a document outlining trains’ different technical standards in the European Union that describes the “radio-stop” command used in the Polish system. In fact, Olejnik says that the ability to send the command has been described in Polish radio and train forums and on YouTube for years. “Everybody could do this. Even teenagers trolling. The frequencies are known. The tones are known. The equipment is cheap.”
Even so, this is being described as a cyberattack.
Reuters is reporting that the FBI “had identified and disabled malware wielded by Russia’s FSB security service against an undisclosed number of American computers, a move they hoped would deal a death blow to one of Russia’s leading cyber spying programs.”
The headline says that the FBI “sabotaged” the malware, which seems to be wrong.
EDITED TO ADD: Maybe “sabotaged” is the right word. The FBI hacked the malware so that it disabled itself.
Despite the bravado of its developers, Snake is among the most sophisticated pieces of malware ever found, the FBI said. The modular design, custom encryption layers, and high-caliber quality of the code base have made it hard if not impossible for antivirus software to detect. As FBI agents continued to monitor Snake, however, they slowly uncovered some surprising weaknesses. For one, there was a critical cryptographic key with a prime length of just 128 bits, making it vulnerable to factoring attacks that expose the secret key. This weak key was used in Diffie-Hellman key exchanges that allowed each infected machine to have a unique key when communicating with another machine.
In the early stages of the war in Ukraine in 2022, PIPEDREAM, a known malware was quietly on the brink of wiping out a handful of critical U.S. electric and liquid natural gas sites. PIPEDREAM is an attack toolkit with unmatched and unprecedented capabilities developed for use against industrial control systems (ICSs).
The malware was built to manipulate the network communication protocols used by programmable logic controllers (PLCs) leveraged by two critical producers of PLCs for ICSs within the critical infrastructure sector, Schneider Electric and OMRON.
Thousands of pages of secret documents reveal how Vulkan’s engineers have worked for Russian military and intelligence agencies to support hacking operations, train operatives before attacks on national infrastructure, spread disinformation and control sections of the internet.
The company’s work is linked to the federal security service or FSB, the domestic spy agency; the operational and intelligence divisions of the armed forces, known as the GOU and GRU; and the SVR, Russia’s foreign intelligence organisation.
Lots more at the link.
The documents are in Russian, so it will be a while before we get translations.
Since 2008, Former colonel of the Ministry of Internal Affairs (MIA) of the Russian Federation, Andrey Valeryevich Kashtanov, has held a passport of the Republic of Bulgaria under the notorious…
The Internet has become a significant factor in geopolitical conflicts, such as the ongoing war in Ukraine. Tomorrow marks one year since the Russian invasion of that country. This post reports on Internet insights and discusses how Ukraine’s Internet remained resilient in spite of dozens of disruptions in three different stages of the conflict.
Key takeaways:
Internet traffic shifts in Ukraine are clearly visible from east to west as Ukrainians fled the war, with country-wide traffic dropping as much as 33% after February 24, 2022.
Air strikes on energy infrastructure starting in October led to widespread Internet disruptions that continue in 2023.
Application-layer cyber attacks in Ukraine rose 1,300% in early March 2022 compared to pre-war levels.
Government administration, financial services, and the media saw the most attacks targeting Ukraine.
Traffic from a number of networks in Kherson was re-routed through Russia between June and October, subjecting traffic to Russia’s restrictions and limitations, including content filtering. Even after traffic ceased to reroute through Russia, those Ukrainian networks saw major outages through at least the end of the year, while two networks remain offline.
Through efforts on the ground to repair damaged fiber optics and restore electrical power, Ukraine’s networks have remained resilient from both an infrastructure and routing perspective. This is partly due to Ukraine’s widespread connectivity to networks outside the country and large number of IXPs.
Starlink traffic in Ukraine grew over 500% between mid-March and mid-May, and continued to grow from mid-May through mid-November, increasing nearly 300% over that six-month period. For the full period from mid-March (two weeks after it was made available) to mid-December, it was over a 1,600% increase, dropping a bit after that.
Internet changes and disruptions
An Internet shock after February 24, 2022
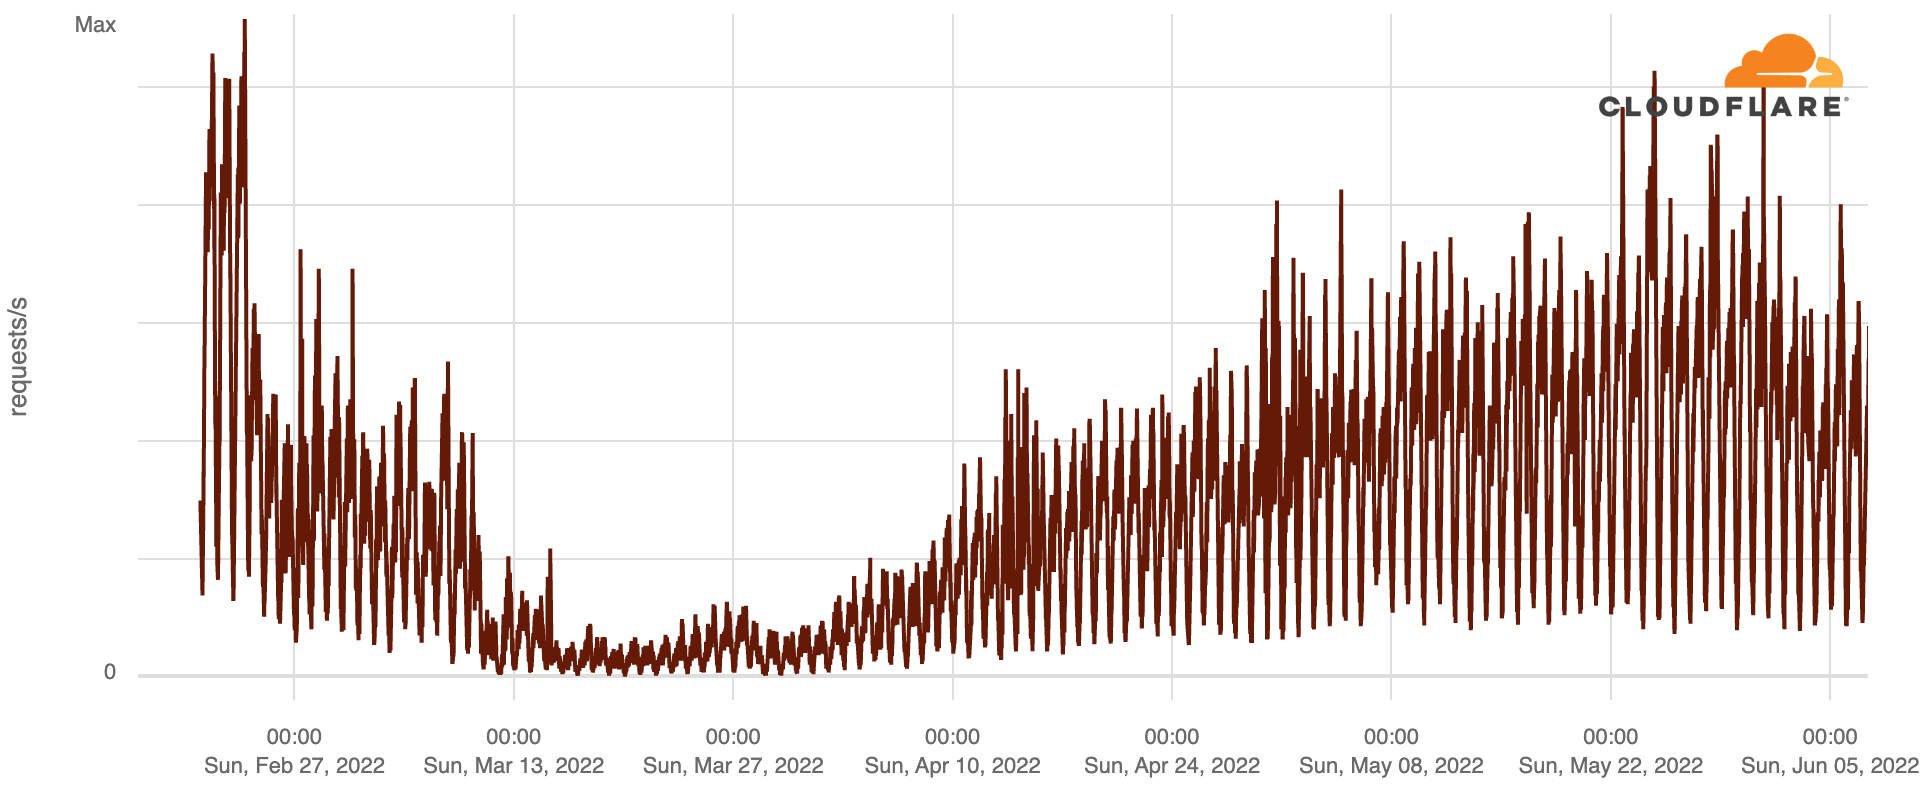
In Ukraine, human Internet traffic dropped as much as 33% in the weeks following February 24. The following chart shows Cloudflare’s perspective on daily traffic (by number of requests).
Internet traffic levels recovered over the next few months, including strong growth seen in September and October, when many Ukrainian refugees returned to the country. That said, there were also country-wide outages, mostly after October, that are discussed below.
14% of total traffic from Ukraine (including traffic from Crimea and other occupied regions) was mitigated as potential attacks, while 10% of total traffic to Ukraine was mitigated as potential attacks in the last 12 months.
Before February 24, 2022, typical weekday Internet traffic in Ukraine initially peaked after lunch, around 15:00 local time, dropped between 17:00 and 18:00 (consistent with people leaving work), and reached the biggest peak of the day at around 21:00 (possibly after dinner for mobile and streaming use).
After the invasion started, we observed less variation during the day in a clear change in the usual pattern given the reported disruption and “exodus” from the country. During the first few days after the invasion began, peak traffic occurred around 19:00, at a time when nights for many in cities such as Kyiv were spent in improvised underground bunkers. By late March, the 21:00 peak had returned, but the early evening drop in traffic did not return until May.
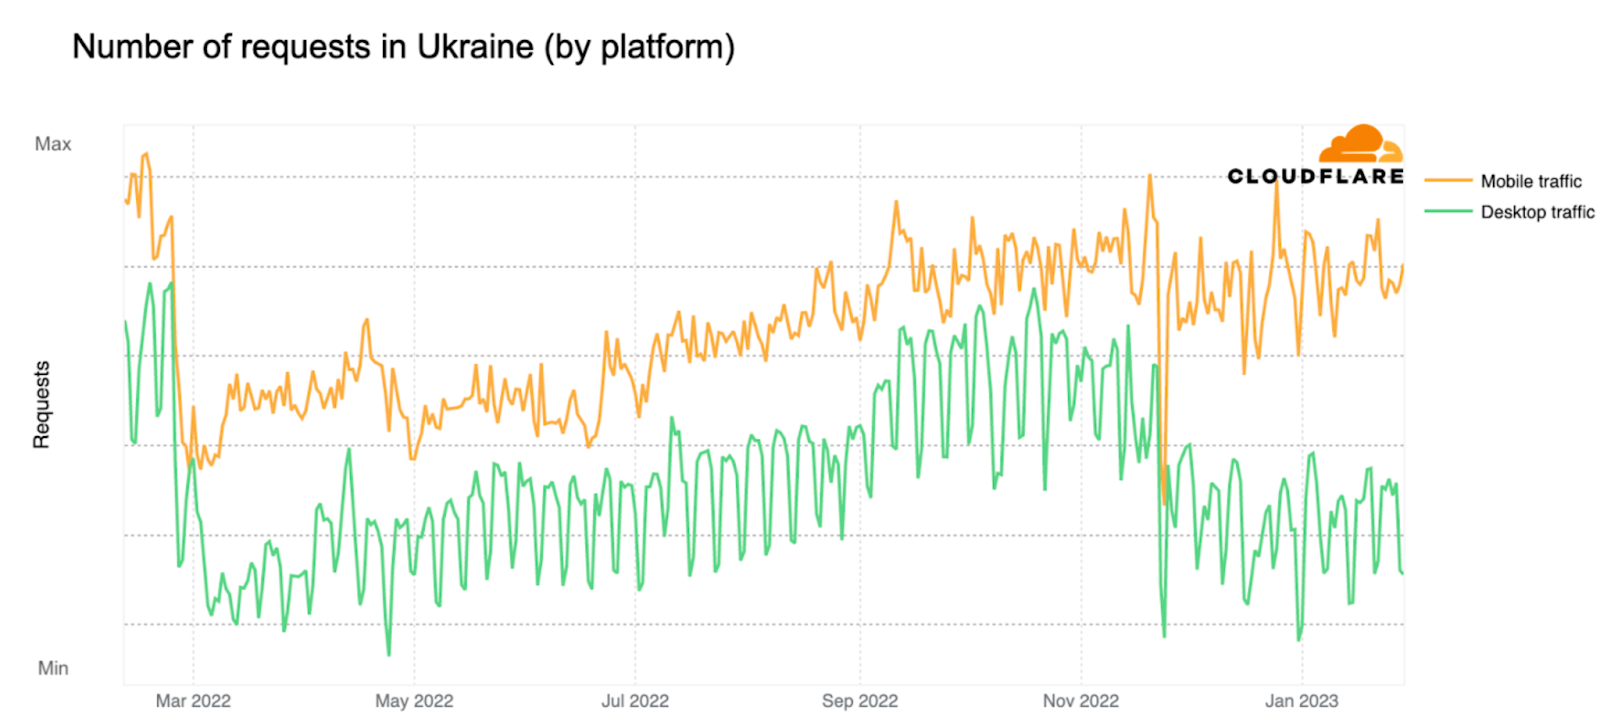
When looking at Ukraine Internet requests by type of trafficin the chart below (from February 10, 2022, through February 2023), we observe that while traffic from both mobile and desktop devices dropped after the invasion, request volume from mobile devices has remained higher over the past year. Pre-war, mobile devices accounted for around 53% of traffic, and grew to around 60% during the first weeks of the invasion. By late April, it had returned to typical pre-war levels, falling back to around 54% of traffic. There’s also a noticeable December drop/outage that we’ll go over below.
Millions moving from east to west in Ukraine
The invasion brought attacks and failing infrastructure across a number of cities, but the target in the early days wasn’t the country’s energy infrastructure, as it was in October 2022. In the first weeks of the war, Internet traffic changes were largely driven by people evacuating conflict zones with their families. Over eight million Ukrainians left the country in the first three months, and many more relocated internally to safer cities, although many returned during the summer of 2022. The Internet played a critical role during this refugee crisis, supporting communications and access to real-time information that could save lives, as well as apps providing services, among others.
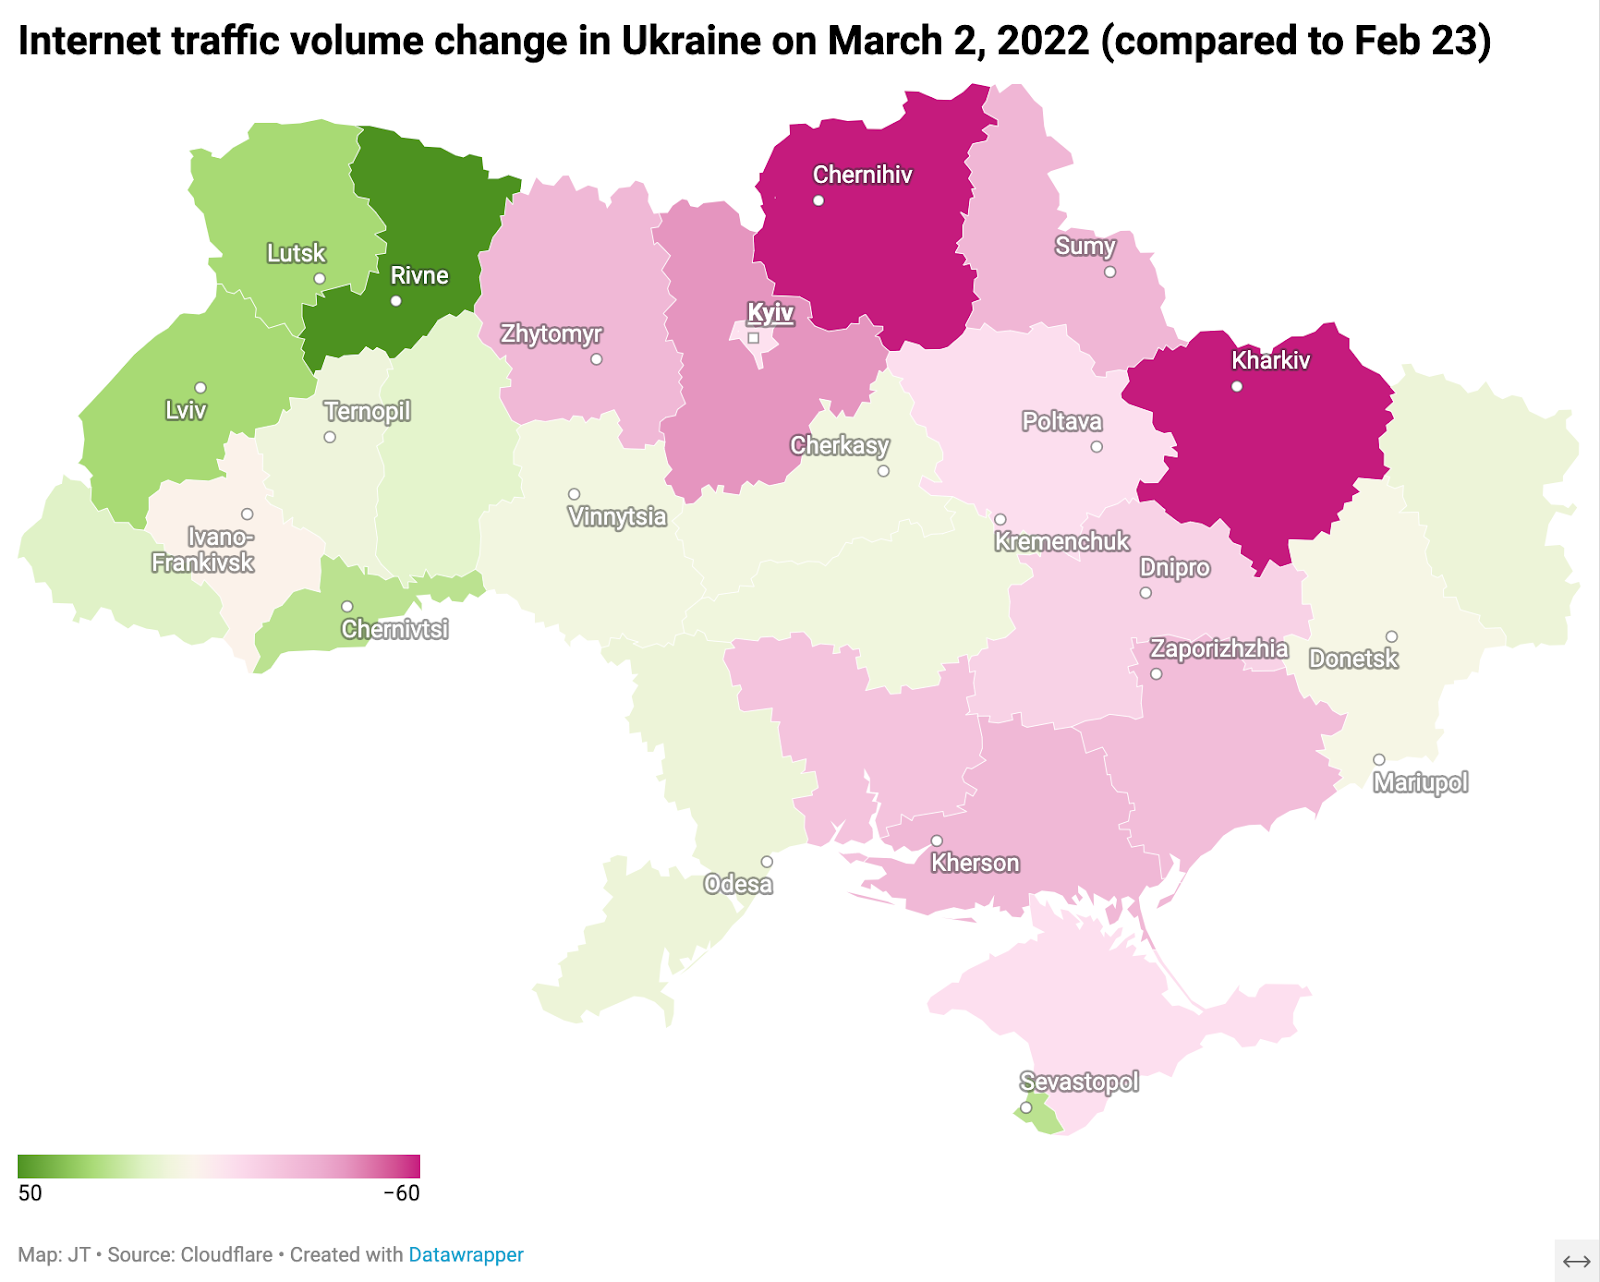
There was also an increase in traffic in the western part of Ukraine, in areas such as Lviv (further away from the conflict areas), and a decrease in the east, in areas like Kharkiv, where the Russian military was arriving and attacks were a constant threat. The figure below provides a view of how Internet traffic across Ukraine changed in the week after the war began (a darker pink means a drop in traffic — as much as 60% — while a darker green indicates an increase in Internet traffic — as much as 50%).
The biggest drops in Internet traffic observed in Ukraine in the first days of the war were in Kharkiv Oblast in the east, and Chernihiv in the north, both with a 60% decrease, followed by Kyiv Oblast, with traffic 40% lower on March 2, 2022, as compared with February 23.
In western Ukraine, traffic surged. The regions with the highest observed traffic growth included Rivne (50%), Volyn (30%), Lviv (28%), Chernivtsi (25%), and Zakarpattia (15%).
At the city level, analysis of Internet traffic in Ukraine gives us some insight into usage of the Internet and availability of Internet access in those first weeks, with noticeable outages in places where direct conflict was going on or that was already occupied by Russian soldiers.
North of Kyiv, the city of Chernihiv had a significant drop in traffic the first week of the war and residual traffic by mid-March, with traffic picking up only after the Russians retreated in early April.
In the capital city of Kyiv, there is a clear disruption in Internet traffic right after the war started, possibly caused by people leaving, attacks and use of underground shelters.
Near Kyiv, we observed a clear outage in early March in Bucha. After April 1, when the Russians withdrew, Internet traffic started to come back a few weeks later.
In Irpin, just outside Kyiv, close to the Hostomel airport and Bucha, a similar outage pattern to Bucha was observed. Traffic only began to come back more clearly in late May.
In the east, in the city of Kharkiv, traffic dropped 50% on March 3, with a similar scenario seen not far away in Sumy. The disruption was related to people leaving and also by power outages affecting some networks.
Other cities in the south of Ukraine, like Berdyansk, had outages. This graph shows Enerhodar, the small city where Europe’s largest nuclear plant, Zaporizhzhya NPP, is located, with residual traffic compared to before.
In the cities located in the south of Ukraine, there were clear Internet disruptions. The Russians laid siege to Mariupol on February 24. Energy infrastructure strikes and shutdowns had an impact on local networks and Internet traffic, which fell to minimal levels by March 1. Estimates indicate that 95% of the buildings in the city were destroyed, and by mid-May, the city was fully under Russian control. While there was some increase in traffic by the end of April, it reached only ~22% of what it was before the war’s start.
When looking at Ukrainian Internet Service Providers (ISPs) or the autonomous systems (ASNs) they use, we observed more localized disruptions in certain regions during the first months of the war, but recovery was almost always swift. AS6849 (Ukrtel) experienced problems with very short-term outages in mid-March. AS13188 (Triolan), which services Kyiv, Chernihiv, and Kharkiv, was another provider experiencing problems (they reported a cyberattack on March 9), as could be observed in the next chart:
We did not observe a clear national outage in Ukraine’s main ISP, AS15895 (Kyivstar) until the October-November attacks on energy infrastructure, which also shows some early resilience of Ukrainian networks.
Ukraine’s counteroffensive and its Internet impact
As Russian troops retreated from the northern front in Ukraine, they shifted their efforts to gain ground in the east (Battle of Donbas) and south (occupation of the Kherson region) after late April. This resulted in Internet disruptions and traffic shifts, which are discussed in more detail in a section below. However, Internet traffic in the Kherson region was intermittent and included outages after May, given the battle for Internet control. News reports in June revealed that ISP workers damaged their own equipment to thwart Russia’s efforts to control the Ukrainian Internet.
Before the September Ukrainian counteroffensive, another example of the war’s impact on a city’s Internet traffic occurred during the summer, when Russian troops seized Lysychansk in eastern Ukraine in early July after what became known as the Battle of Lysychansk. Internet traffic in Lysychansk clearly decreased after the war started. That slide continues during the intense fighting that took place after April, which led to most of the city’s population leaving. By May, traffic was almost residual (with a mid-May few days short term increase).
In early September the Ukrainian counteroffensive took off in the east, although the media initially reported a south offensive in Kherson Oblast that was a “deception” move. The Kherson offensive only came to fruition in late October and early November. Ukraine was able to retake in September over 500 settlements and 12,000 square kilometers of territory in the Kharkiv region. At that time, there were Internet outages in several of those settlements.
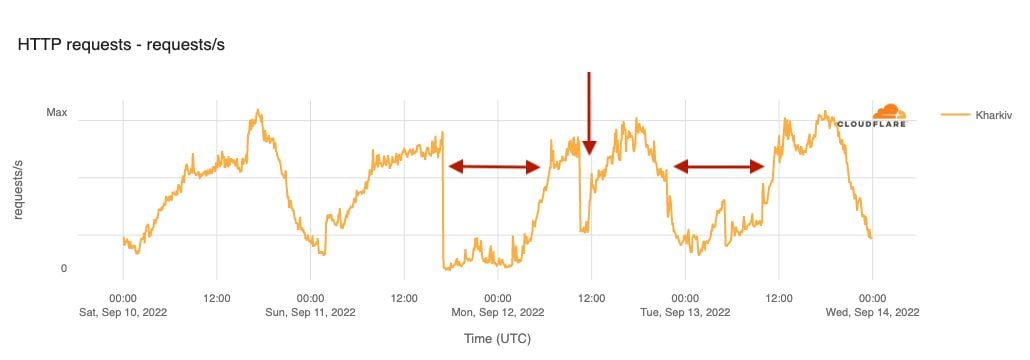
In response to the successful Ukrainian counteroffensive, Russian airstrikes caused power outages and Internet disruptions in the region. That was the case in Kharkiv on September 11, 12, and 13. The figure below shows a 12-hour near-complete outage on September 11, followed by two other periods of drop in traffic.
When nuclear inspectors arrive, so do Internet outages
In the Zaporizhzhia region, there were also outages. On September 1, 2022, the day the International Atomic Energy Agency (IAEA) inspectors arrived at the Russian-controlled Zaporizhzhia nuclear power plant in Enerhodar, there were Internet outages in two local ASNs that service the area: AS199560 (Engrup) and AS197002(OOO Tenor). Those outages lasted until September 10, as shown in the charts below.
More broadly, the city of Enerhodar, where the nuclear power plant is located, experienced a four-day outage after September 6.
Mid-September traffic drop in Crimea
In mid-September, following Ukraine’s counteroffensive, there were questions as to when Crimea might be targeted by Ukrainian forces, with news reports indicating that there was an evacuation of the Russian population from Crimea around September 13. We saw a clear drop in traffic on that Tuesday, compared with the previous day, as seen in the map of Crimea below (red is decrease in traffic, green is increase).
October brings energy infrastructure attacks and country-wide disruptions
As we have seen, the Russian air strikes targeting critical energy infrastructure began in September as a retaliation to Ukraine’s counteroffensive. The following month, the Crimean Bridge explosion on Saturday, October 8 (when a truck-borne bomb destroyed part of the bridge) led to more air strikes that affected networks and Internet traffic across Ukraine.
On Monday, October 10, Ukraine woke up to air strikes on energy infrastructure and experienced severe electricity and Internet outages. At 07:35 UTC, traffic in the country was 35% below its usual level compared with the previous week and only fully recovered more than 24 hours later. The impact was particularly significant in regions like Kharkiv, where traffic was down by around 80%, and Lviv, where it dropped by about 60%. The graph below shows how new air strikes in Lviv Oblast the following day affected Internet traffic.
There were clear disruptions in Internet connectivity in several regions on October 17, but also on October 20, when the destruction of several power stations in Kyiv resulted in a 25% drop in Internet traffic from Kyiv City as compared to the two previous weeks. It lasted 12 hours, and was followed the next day by a shorter partial outage as seen in the graph below.
In late October, according to Ukrainian officials, 30% of Ukraine’s power stations were destroyed. Self-imposed power limitations because of this destruction resulted in drops in Internet traffic observed in places like Kyiv and the surrounding region.
The start of a multi-week Internet disruption in Kherson Oblast can be seen in the graph below, showing ~70% lower traffic than in previous weeks. The disruption began on Saturday, October 22, when Ukrainians were gaining ground in the Kherson region.
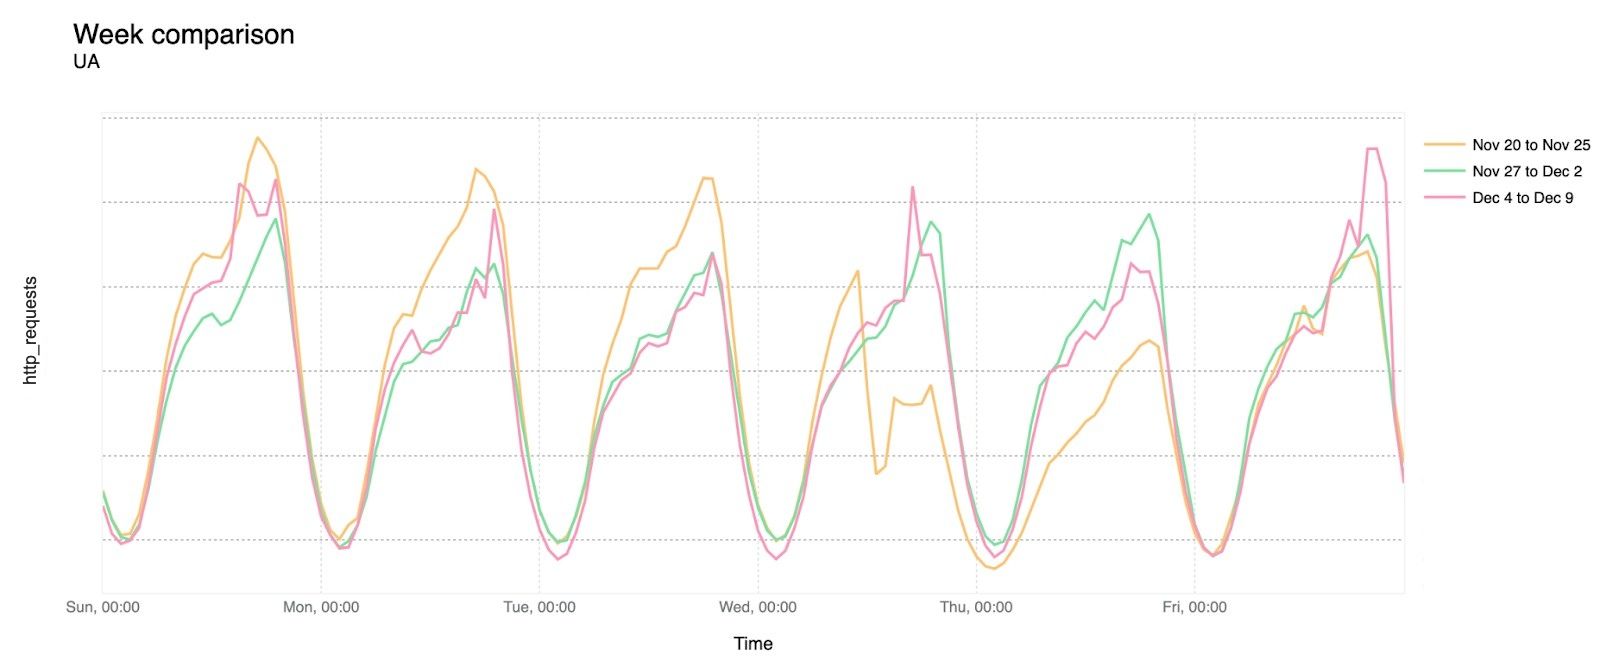
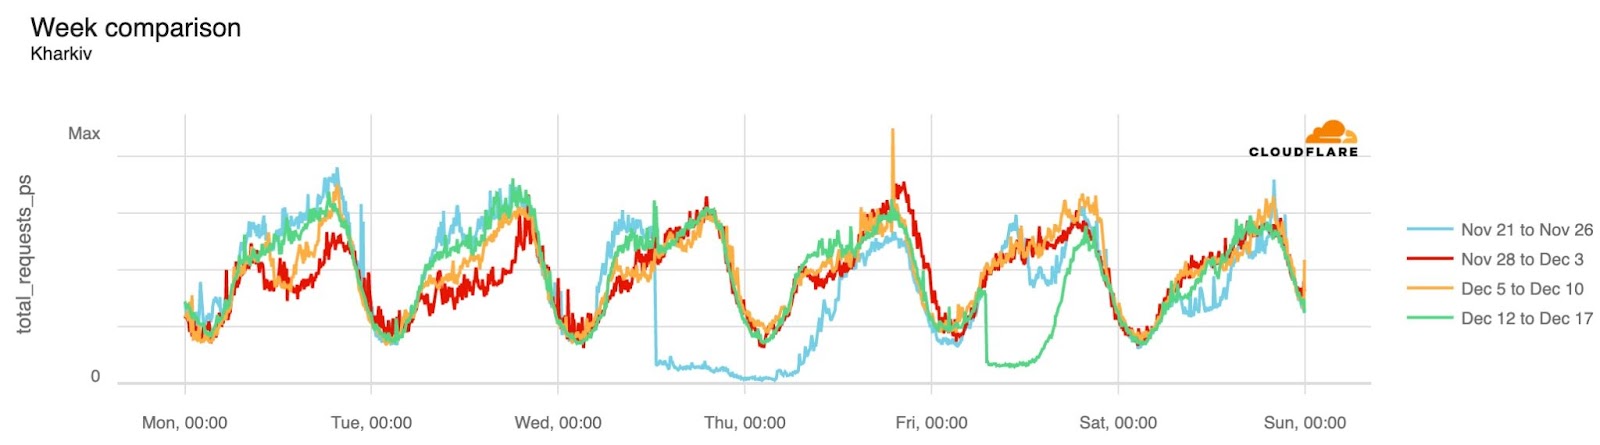
Traffic began to return after Ukrainian forces took Kherson city on November 11, 2022. The graph below shows a week-over-week comparison for Kherson Oblast for the weeks of November 7, November 28, and December 19 for better visualization in the chart while showing the evolution through a seven-week period.
Ongoing strikes and Internet disruptions
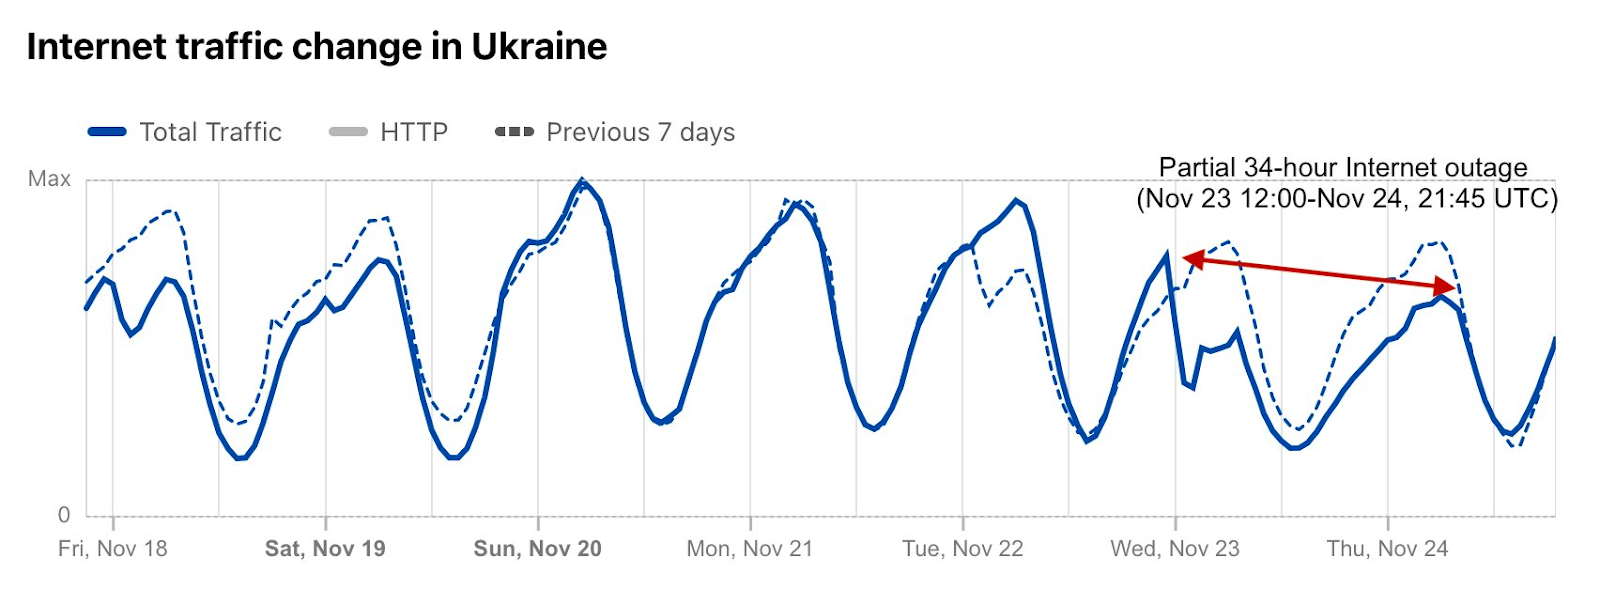
Throughout the rest of the year and into 2023, Ukraine has continued to face intermittent Internet disruptions. On November 23, 2022, the country experienced widespread power outages after Russian strikes, causing a nearly 50% decrease in Internet traffic in Ukraine. This disruption lasted for almost a day and a half, further emphasizing the ongoing impact of the conflict on Ukraine’s infrastructure.
Although there was a recovery after that late November outage, only a few days later traffic seemed closer to normal levels. Below is a chart of the week-over-week evolution of Internet traffic in Ukraine at both a national and local level during that time:
In Kyiv Oblast:
In the Odessa region:
And Kharkiv (where a December 16 outage is also clear — in the green line):
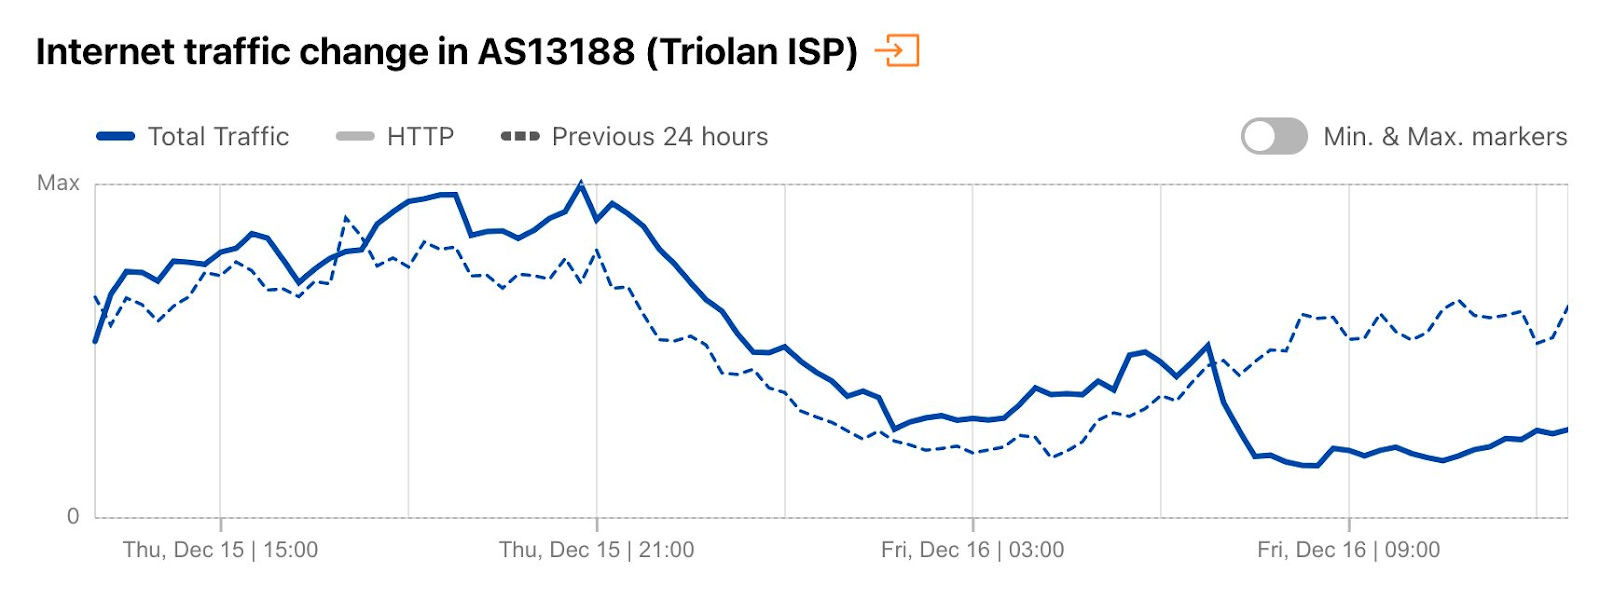
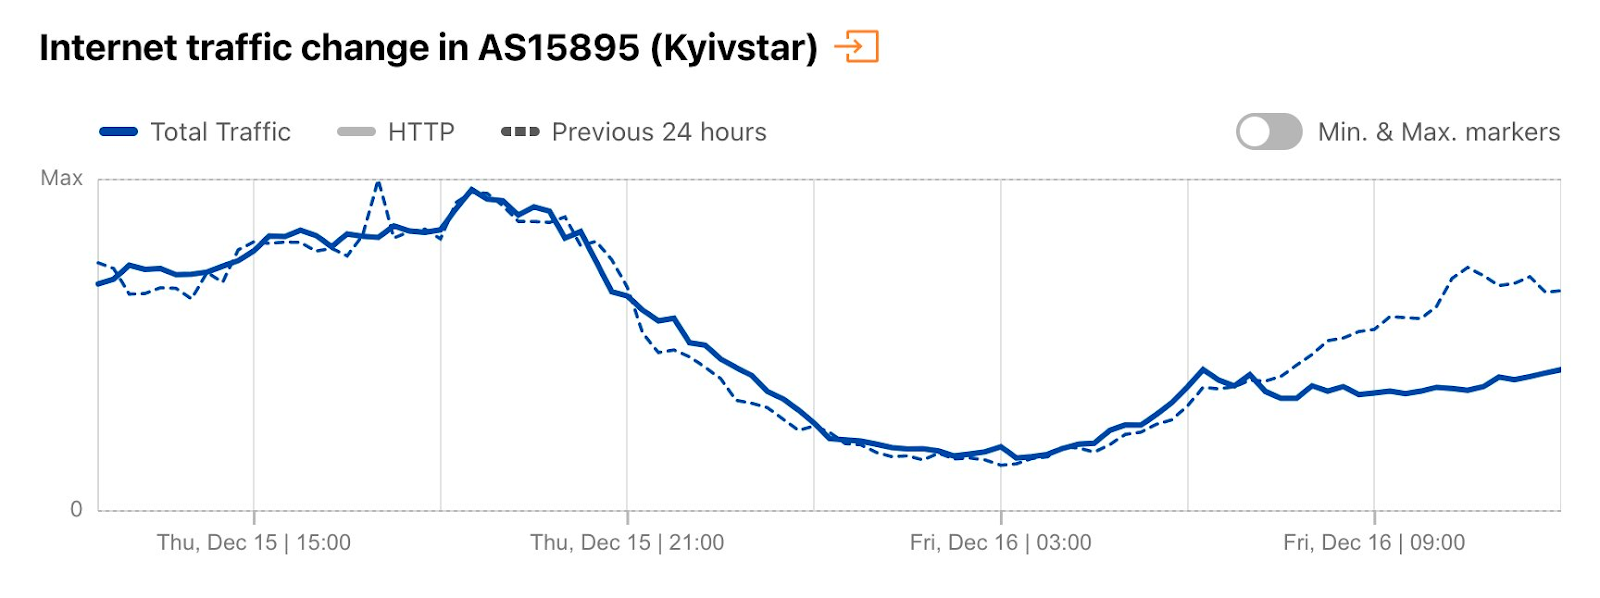
On December 16, there was another country-level Internet disruption caused by air strikes targeting energy infrastructure. Traffic at a national level dropped as much as 13% compared with the previous week, but Ukrainian networks were even more affected. AS13188 (Triolan) had a 70% drop in traffic, and AS15895 (Kyivstar) a 40% drop, both shown in the figures below.
In January 2023, air strikes caused additional Internet disruptions. One such recent event was in Odessa, where traffic dropped as low as 54% compared with the previous week during an 18-hour disruption.
A cyber war with global impact
“Shields Up” on cyber attacks
The US government and the FBI issued warnings in March to all citizens, businesses, and organizations in the country, as well as allies and partners, to be aware of the need to “enhance cybersecurity.” The US Cybersecurity and Infrastructure Security Agency (CISA) launched the Shields Up initiative, noting that “Russia’s invasion of Ukraine could impact organizations both within and beyond the region.” The UK and Japan, among others, also issued warnings.
Below, we discuss Web Application Firewall (WAF) mitigations and DDoS attacks. A WAF helps protect web applications by filtering and monitoring HTTP traffic between a web application and the Internet. A WAF is a protocol layer 7 defense (in the OSI model), and is not designed to defend against all types of attacks. Distributed Denial of Service (DDoS) attacks are cyber attacks that aim to take down Internet properties and make them unavailable for users.
Cyber attacks rose 1,300% in Ukraine by early March
The charts below are based on normalized data, and show threats mitigated by our WAF.
Mitigated application-layer threats blocked by our WAF skyrocketed after the war started on February 24. Mitigated requests were 105% higher on Monday, February 28 than in the previous (pre-war) Monday, and peaked on March 8, reaching 1,300% higher than pre-war levels.
Between February 2022 and February 2023, an average of 10% of all traffic to Ukraine was mitigations of potential attacks.
The graph below shows the daily percentage of application layer traffic to Ukraine that Cloudflare mitigated as potential attacks. In early March, 30% of all traffic was mitigated. This fell in April, and remained low for several months, but it picked up in early September around the time of the Ukrainian counteroffensive in east and south Ukraine. The peak was reached on October 29 when DDoS attack traffic constituted 39% of total traffic to Cloudflare’s Ukrainian customer websites.
This trend is more evident when looking at all traffic to sites on the “.ua” top-level domain (from Cloudflare’s perspective). The chart below shows that DDoS attack traffic accounted for over 80% of all traffic by early March 2022. The first clear spikes occurred on February 16 and 19, with around 25% of traffic mitigated. There was no moment of rest after the war started, except towards the end of November and December, but the attacks resumed just before Christmas. An average of 13% of all traffic to “.ua”, between February 2022 and February 2023 was mitigations of potential attacks. The following graph provides a comprehensive view of DDoS application layer attacks on “.ua” sites:
Moving on to types of mitigations of product groups that were used (related to “.ua” sites), as seen in the next chart, around 57% were done by the ruleset which automatically detects and mitigates HTTP DDoS attacks (DDoS Mitigation), 31% were being mitigated by firewall rules put in place (WAF), and 10% were blocking requests based on our IP threat reputation database (IP Reputation).
It’s important to note that WAF rules in the graph above are also associated with custom firewall rules created by customers to provide a more tailored protection. “DDoS Mitigation” (application layer DDoS protection) and “Access Rules” (rate limiting) are specifically used for DDoS protection.
In contrast to the first graph shown in this section, which looked at mitigated attack traffic targeting Ukraine, we can also look at mitigated attack traffic originating in Ukraine. The graph below also shows that the share of mitigated traffic from Ukraine also increased considerably after the invasion started.
Top attacked industries: from government to news media
The industries sectors that had a higher share of WAF mitigations were government administration, financial services, and the media, representing almost half of all WAF mitigations targeting Ukraine during 2022.
Looking at DDoS attacks, there was a surge in attacks on media and publishing companies during 2022 in Ukraine. Entities targeting Ukrainian companies appeared to be focused on information-related websites. The top five most attacked industries in the Ukraine in the first two quarters of 2022 were all in broadcasting, Internet, online media, and publishing, accounting for almost 80% of all DDoS attacks targeting Ukraine.
In a more focused look at the type of websites Cloudflare has protected throughout the war, the next two graphs provide a view of mitigated application layer attacks by the type of “.ua” sites we helped to protect. In the first days of the war, mitigation spikes were observed at a news service, a TV channel, a government website, and a bank.
In July, spikes in mitigations we observed across other types of “.ua” websites, including food delivery, e-commerce, auto parts, news, and government.
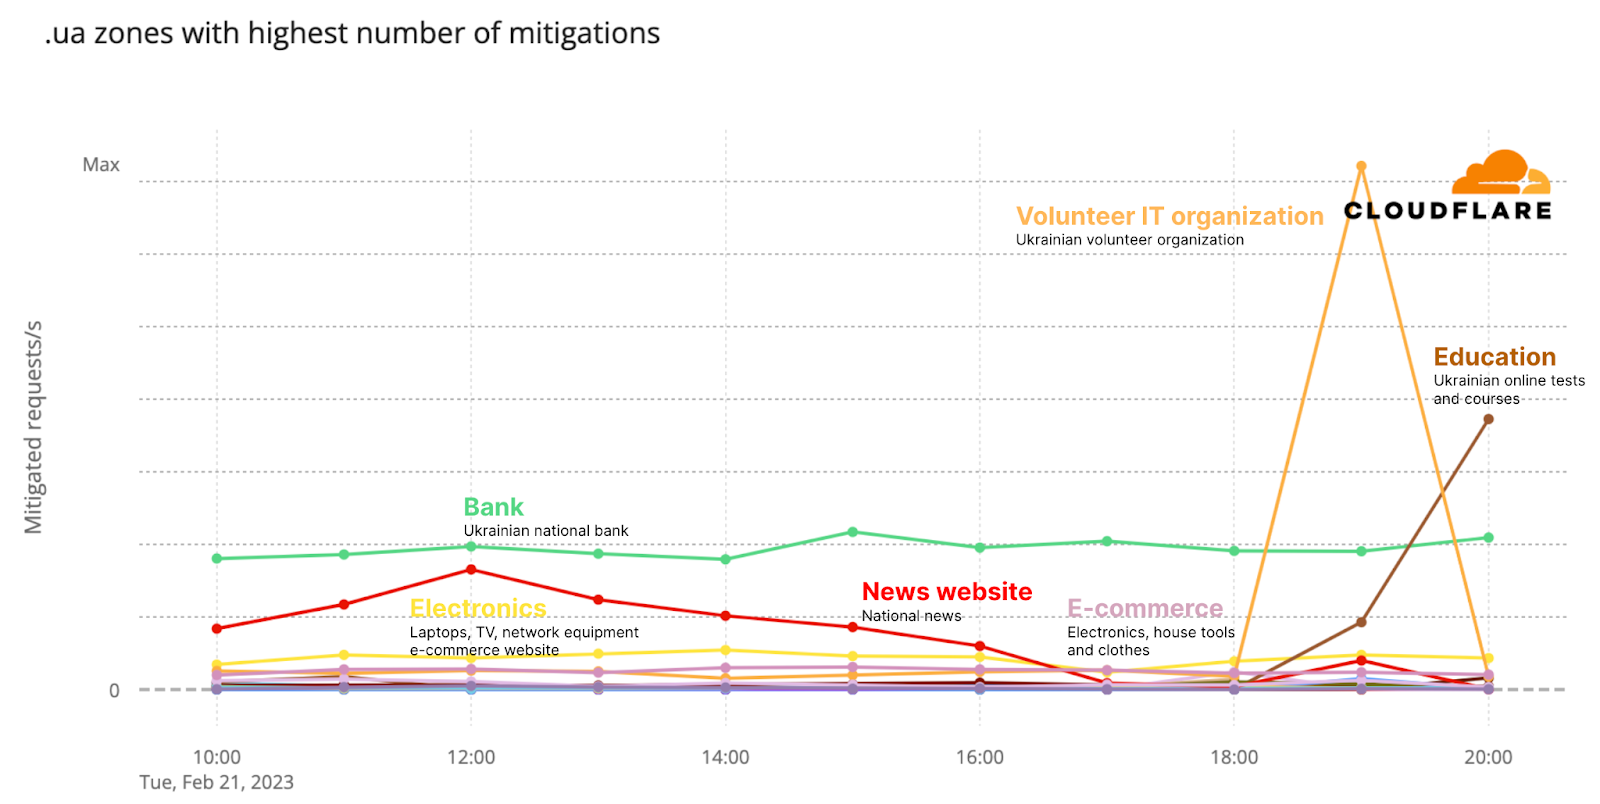
More recently, in February 2023, the spikes in mitigations were somewhat similar to what we saw one year ago, including electronics, e-commerce, IT, and education websites.
12.6% of network-layer traffic was DDoS activity in Q1 2022
Network-layer (layer 3 and 4) traffic is harder to attribute to a specific domain or target because IP addresses are shared across different customers. Looking at network-level DDoS traffic hitting our Kyiv data center, we saw peaks of DDoS traffic higher than before the war in early March, but they were much higher in June and August.
Several of our quarterly DDoS reports from 2022 include attack trends related to the war in Ukraine, with quarter over quarter interactive comparisons.
Network re-routing in Kherson
On February 24, 2022, Russian forces invaded Ukraine’s Kherson Oblast region. The city of Kherson was captured on March 2, as the first major city and only regional capital to be captured by Russian forces during the initial invasion. The Russian occupation of Kherson Oblast continued until Ukrainian forces resumed control on November 11, after launching a counteroffensive at the end of August.
On May 4, 2022, we published Tracking shifts in Internet connectivity in Kherson, Ukraine, a blog post that explored a re-routing event that impacted AS47598 (Khersontelecom), a telecommunications provider in Kherson Oblast. Below, we summarize this event, and explore similar activity across other providers in Kherson that has taken place since then.
On May 1, 2022, we observed a shift in routing for the IPv4 prefix announced by Ukrainian network AS47598 (Khersontelecom). During April, it reached the Internet through several other Ukrainian network providers, including AS12883 (Vega Telecom) and AS3326 (Datagroup). However, after the shift, its routing path now showed a Russian network, AS201776 (Miranda-Media), as the sole upstream provider. With traffic from KhersonTelecom passing through a Russian network, it was subject to the restrictions and limitations imposed on any traffic transiting Russian networks, including content filtering.
The flow of traffic from Khersontelecom before and after May 1, with rerouting through Russian network provider Miranda-Media, is illustrated in the chart below. This particular re-routing event was short-lived, as a routing update for AS47598 on May 4 saw it return to reaching the Internet through other Ukrainian providers.
As a basis for our analysis, we started with a list of 15 Autonomous System Numbers (ASNs) belonging to networks in Kherson Oblast. Using that list, we analyzed routing information collected by route-views2 over the past year, from February 1, 2022, to February 15, 2023. route-views2 is a BGP route collector run by the University of Oregon Route Views Project. Note that with respect to the discussions of ASNs in this and the following section, we are treating them equally, and have not specifically factored estimated user population into these analyses.
The figure below illustrates the result of this analysis, showing that re-routing of Kherson network providers (listed along the y-axis) through Russian upstream networks was fairly widespread, and for some networks, has continued into 2023. During the analysis time frame, there were three primary Russian networks that appeared as upstream providers: AS201776 (Miranda-Media), AS52091 (Level-MSK Ltd.), and AS8492 (OBIT Ltd.).
Within the graph, black bars indicate periods when the ASN effectively disappeared from the Internet; white segments indicate the ASN was dependent on other Ukraine networks as immediate upstreams; and red indicates the presence of Russian networks in the set of upstream providers. The intensity of the red shading corresponds to the percentage of announced prefixes for which a Russian network provider is present in the routing path as observed from networks outside Ukraine. Bright red shading, equivalent to “1” in the legend, indicates the presence of a Russian provider in all routing paths for announced prefixes.
In the blog post linked above, we referenced an outage that began on April 30. This is clearly visible in the figure as a black bar that runs for several days across all the listed ASNs. In this instance, AS47598 (KhersonTelecom) recovered a day later, but was sending traffic through AS201776 (Miranda-Media), a Russian provider, as discussed above.
Another Ukrainian network, AS49168 (Brok-X), recovered from the outage on May 2, and was also sending traffic through Miranda-Media. By May 4, most of the other Kherson networks recovered from the outage, and both AS47598 and AS49168 returned to using Ukrainian networks as immediate upstream providers. Routing remained “normal” until May 30. Then, a more widespread shift to routing traffic through Russian providers began, although it appears that this shift was preceded by a brief outage for a few networks. For the most part, this re-routing lasted through the summer and into October. Some networks saw a brief outage on October 17, but most stopped routing directly through Russia by October 22.
However, this shift away from Russia was followed by periods of extended outages. KhersonTelecom suffered such an outage, and has remained offline since October, except for the first week of November when all of its traffic routed through Russia. Many other networks rejoined the Internet in early December, relying mostly on other Ukrainian providers for Internet connectivity. However, since early December, AS204485 (PE Berislav Cable Television), AS56359 (CHP Melnikov Roman Sergeevich), and AS49465 (Teleradiocompany RubinTelecom Ltd.) have continued to use Miranda-Media as an upstream provider, in addition to experiencing several brief outages. In addition, over the last several months, AS25082 (Viner Telecom) has used both a Ukrainian network and Miranda-Media as upstream providers.
Internet resilience in Ukraine
In the context of the Internet, “resilience” refers to the ability of a network to operate continuously in a manner that is highly resistant to disruption. This includes the ability of a network to: (1) operate in a degraded mode if damaged, (2) rapidly recover if failure does occur, and (3) scale to meet rapid or unpredictable demands. Throughout the Russia-Ukraine conflict, media coverage (VICE, Bloomberg, Washington Post) has highlighted the work done in Ukraine to repair damaged fiber-optic cables and mobile network infrastructure to keep the country online. This work has been critically important to maintaining the resilience of Ukrainian Internet infrastructure.
According to PeeringDB, as of February 2023, there are 25 Internet Exchange Points (IXPs) in Ukraine and 50 interconnection facilities. (An IXP may span multiple physical facilities.) Within this set of IXPs, Autonomous Systems (ASes) belonging to international providers are currently present in over half of them. The number of facilities, IXPs, and international ASes present in Ukraine points to a resilient interconnection fabric, with multiple locations for both domestic and international providers to exchange traffic.
To better understand these international interconnections, we first analyze the connectivity of ASes in Ukraine, and we classify the links to domestic networks (links where both ASes are registered in Ukraine) and international networks (links between ASes in Ukraine and ASes outside Ukraine). To determine which ASes are domestic in Ukraine, we can use information from the extended delegation reports from the Réseaux IP Européens Network Coordination Centre (RIPE NCC), the Regional Internet Registry that covers Ukraine. We also parsed collected BGP data to extract the AS-level links between Ukrainian ASes and ASes registered in a different country, and we consider these the international connectivity of the domestic ASes.
A March 2022 article in The Economist noted that “For one thing, Ukraine boasts an unusually large number of internet-service providers—by one reckoning the country has the world’s fourth-least-concentrated Internet market. This means the network has few choke points, so is hard to disable.” As of the writing of this blog post, there are 2,190 ASes registered in Ukraine (UA ASes), and 1,574 of those ASes appear in the BGP routing table as active. These counts support the article’s characterization, and below we discuss several additional observations that reinforce Ukraine’s Internet resilience.
The figure above is a cumulative distribution function showing the fraction of domestic Ukrainian ASes that have direct connections to international networks. In February 2023, approximately 50% had more than one (100) international link, while approximately 10% had more than 10, and approximately 2% had 100 or more. Although these numbers have dropped slightly over the last year, they underscore the lack of centralized choke points in the Ukrainian Internet.
For the networks with international connectivity, we can also look at the distribution of “next-hop” countries – countries with which those international networks are associated. (Note that some networks may have a global footprint, and for these, the associated country is the one recorded in their autonomous system registration.) Comparing the choropleth maps below illustrates how this set of countries, and their fraction of international paths, have changed between February 2022 and February 2023. The data underlying these maps shows that international connectivity from Ukraine is distributed across 18 countries — unsurprisingly, mostly in Europe.
In February 2022, these countries/locations accounted for 77% of Ukraine’s next-hop international paths. The top four all had 7.8% each. However, in February 2023, the top 10 next-hop countries/locations dropped slightly to 76% of international paths. While just a slight change from the previous year, the set of countries/locations and many of their respective fractions saw considerable change.
February 2022
February 2023
1
Germany
7.85%
Russia
11.62%
2
Netherlands
7.85%
Germany
11.43%
3
United Kingdom
7.83%
Hong Kong
8.38%
4
Hong Kong
7.81%
Poland
7.93%
5
Sweden
7.77%
Italy
7.75%
6
Romania
7.72%
Turkey
6.86%
7
Russia
7.67%
Bulgaria
6.20%
8
Italy
7.64%
Netherlands
5.31%
9
Poland
7.60%
United Kingdom
5.30%
10
Hungary
7.54%
Sweden
5.26%
Russia’s share grew by 50% year to 11.6%, giving it the biggest share of next-hop ASes. Germany also grew to account for more than 11% of paths.
Satellite Internet connectivity
Cloudflare observed a rapid growth in Starlink’s ASN (AS14593) traffic to Ukraine during 2022 and into 2023. Between mid-March and mid-May, Starlink’s traffic in the country grew over 530%, and continued to grow from mid-May up until mid-November, increasing nearly 300% over that six-month period — from mid-March to mid-December the growth percentage was over 1600%. After that, traffic stabilized and even dropped a bit during January 2023.
Our data shows that between November and December 2022, Starlink represented between 0.22% and 0.3% of traffic from Ukraine, but that number is now lower than 0.2%.
Conclusion
One year in, the war in Ukraine has taken an unimaginable humanitarian toll. The Internet in Ukraine has also become a battleground, suffering attacks, re-routing, and disruptions. But it has proven to be exceptionally resilient, recovering time and time again from each setback.
We know that the need for a secure and reliable Internet there is more critical than ever. At Cloudflare, we’re committed to continue providing tools that protect Internet services from cyber attack, improve security for those operating in the region, and share information about Internet connectivity and routing inside Ukraine.
Cyber defense assistance in Ukraine is working. The Ukrainian government and Ukrainian critical infrastructure organizations have better defended themselves and achieved higher levels of resiliency due to the efforts of CDAC and many others. But this is not the end of the road—the ability to provide cyber defense assistance will be important in the future. As a result, it is timely to assess how to provide organized, effective cyber defense assistance to safeguard the post-war order from potential aggressors.
The conflict in Ukraine is resetting the table across the globe for geopolitics and international security. The US and its allies have an imperative to strengthen the capabilities necessary to deter and respond to aggression that is ever more present in cyberspace. Lessons learned from the ad hoc conduct of cyber defense assistance in Ukraine can be institutionalized and scaled to provide new approaches and tools for preventing and managing cyber conflicts going forward.
I am often asked why where weren’t more successful cyberattacks by Russia against Ukraine. I generally give four reasons: (1) Cyberattacks are more effective in the “grey zone” between peace and war, and there are better alternatives once the shooting and bombing starts. (2) Setting these attacks up takes time, and Putin was secretive about his plans. (3) Putin was concerned about attacks spilling outside the war zone, and affecting other countries. (4) Ukrainian defenses were good, aided by other countries and companies. This paper gives a fifth reasons: they were technically successful, but keeping them out of the news made them operationally unsuccessful.
“You still have a lot of soldiers bringing cellphones to the frontline who want to talk to their families and they are either being intercepted as they go through a Ukrainian telecommunications provider or intercepted over the air,” said Alperovitch. “That doesn’t pose too much difficulty for the Ukrainian security services.”
[…]
“Security has always been a mess, both in the army and among defence officials,” the source said. “For example, in 2013 they tried to get all the staff at the ministry of defence to replace our iPhones with Russian-made Yoto smartphones.
“But everyone just kept using the iPhone as a second mobile because it was much better. We would just keep the iPhone in the car’s glove compartment for when we got back from work. In the end, the ministry gave up and stopped caring. If the top doesn’t take security very seriously, how can you expect any discipline in the regular army?”
This isn’t a new problem and it isn’t a Russian problem. Here’s a more general article on the problem from 2020.
The collective thoughts of the interwebz
Manage Consent
To provide the best experiences, we use technologies like cookies to store and/or access device information. Consenting to these technologies will allow us to process data such as browsing behavior or unique IDs on this site. Not consenting or withdrawing consent, may adversely affect certain features and functions.
Functional
Always active
The technical storage or access is strictly necessary for the legitimate purpose of enabling the use of a specific service explicitly requested by the subscriber or user, or for the sole purpose of carrying out the transmission of a communication over an electronic communications network.
Preferences
The technical storage or access is necessary for the legitimate purpose of storing preferences that are not requested by the subscriber or user.
Statistics
The technical storage or access that is used exclusively for statistical purposes.The technical storage or access that is used exclusively for anonymous statistical purposes. Without a subpoena, voluntary compliance on the part of your Internet Service Provider, or additional records from a third party, information stored or retrieved for this purpose alone cannot usually be used to identify you.
Marketing
The technical storage or access is required to create user profiles to send advertising, or to track the user on a website or across several websites for similar marketing purposes.