We pointed a commercial-off-the-shelf satellite dish at the sky and carried out the most comprehensive public study to date of geostationary satellite communication. A shockingly large amount of sensitive traffic is being broadcast unencrypted, including critical infrastructure, internal corporate and government communications, private citizens’ voice calls and SMS, and consumer Internet traffic from in-flight wifi and mobile networks. This data can be passively observed by anyone with a few hundred dollars of consumer-grade hardware. There are thousands of geostationary satellite transponders globally, and data from a single transponder may be visible from an area as large as 40% of the surface of the earth.
„Американците искат умереност и баланс както в живота си, така и у лидерите, които водят държавата – не конфликти и поляризация. Ние не сме нация от фанатици, твърдо решени да превърнат „другите във врагове“. Ние сме общество, което всеки път, когато е било изправено пред криза, рано или късно е намирало общ път напред в името на споделеното ни наследство“, казва политологът Алън Улф, автор на книгата „В крайна сметка една нация. Какво всъщност мислят американците за Бог, държавата, семейството, расизма, помощите, имиграцията, хомосексуалността, работата, дясното, лявото и един за друг“ (One Nation, After All: What Americans Really Think About God, Country, Family, Racism, Welfare, Immigration, Homosexuality, Work, The Right, The Left and Each Other).
През 2006 г. Улф е един от интелектуалците, които спорят по въпроса има ли, или няма културни войни. На пръв поглед абсурден почти 20 години по-късно, въпросът продължава да е все така актуален във време, в което очевидно неморалното или неправилното лесно се пречупват през призмата на определена културно-политическа идеология и стават основателни, искани, оправдани. Независимо дали говорим за дебати за бъдещето на платформата TikTok в САЩ, за подкрепата за улесняване на пътя на висококвалифицирани имигранти до американско гражданство, или за митата (които дори спечелиха на Тръмп акронима TACO – от Trump Always Chickens Out, или „Тръмп винаги го хваща шубето“), подкрепата или опозицията по даден въпрос обикновено сравнително бързо се разделят по идеологическа линия – докато партията/президентът не промени мнението си.
Що е то „културна война“?
Както всяка друга война, и културната цели власт. Словосъчетанието е буквална заемка от немски (Kulturkampf) и набира популярност през 70-те години на XIX в., когато губещата влияние и власт Католическа църква под водачеството на папа Пий IX се изправя срещу зараждащата се идеология на националната държава, в случая Кралство Прусия под властта на Ото фон Бисмарк. Ценностите на Просвещението – не само национализмът, но и секуларизмът, либерализмът и научният реализъм – са в директен конфликт с църковната власт, която от векове държи контрола над държавните работи, образованието и вярата, простичко казано – над обществения ред.
Пренареждането на обществото от монархия, в която кралят е божи избраник, подкрепян от църквата, към национална държава настъпва не само през зараждането на нови идеологии, методи на мислене и навици, но и с възникването на нова, по-заможна търговска и гражданска класа на фона на обедняването на монархиите и църквата.
Процесът е хем съпоставим с настоящето, хем трудно разбираем от днешна гледна точка: живеем във време, в което държавата и националната принадлежност като обединител на обществото са поставени под въпрос, а корпорации и частни лица имат много по-голям капитал от БВП на множество държави, което им позволява да упражняват и много по-голяма власт, включително през медиите. В такива времена се зараждат нови идеологии и нови идеи как трябва да живеем заедно. Какво точно кристализира накрая, показва само времето.
В опита си да опази влиянието си Католическата църква се опитва да наложи по-строг контрол над сфери като брака, семейството, образованието. Основават се асоциации, вестници, училища, групи и ордени, които насърчават определени религиозни практики. Католическата пропаганда – включително и за ежедневни събития – се разпространява чрез местни и национални органи из цяла Западна Европа. Папите издават енциклики (папски послания до всички католици), в които заклеймяват либерализма, свободата на пресата, свободата на религиите, разделението между църквата и държавата, гражданския брак, идеята, че народът може да бъде суверен и др. Църквата издава и дълги списъци със забранени книги. Ако ви звучи познато, има причина. От своя страна зараждащият се европейски либерализъм приема църковните догми като война срещу модерната държава, науката и духовната свобода.
Културната война: на Западния фронт нищо ново
През 1991 г. излиза от печат книгата „Културните войни. Борбата за значението на Америка“(Culture wars: the struggle to define America) от Джеймс Хънтър, професор във Вирджинския университет. Тезата му е, че е налице война между „традиционалисти“ и „прогресивисти“ – първите поддържат морални идеали, наследени от миналото, а вторите се стремят към промяна и гъвкавост. Тези различни гледни точки са в основата на все по-нажежени дискусии по теми като абортите, сексуалността, образованието и ролята на религиозните институции в обществото. Дебатите се водят от различни групи и проникват чак до нивото на институциите, поради което все по-често се поставя под въпрос какви всъщност са ценностите на САЩ и как трябва да бъде „подредено“ американското общество.
Няколко години по-късно излиза и книгата на Алън Улф, който изказва противоположна теза: ако изобщо има културна война, повечето американци (обикновените хора) изобщо не се вълнуват от нея:
Американците вярват както в традиционните религиозни ценности, така и в правото на лична свобода, така че невинаги е лесно да се каже кое от двете е по-важно за тях.
Още през 80-те години на миналия век Хънтър забелязва сходни тактики при леви и десни активисти, които се занимават с редица ключови въпроси: аборти, гей права, пушене и протести срещу ядреното оръжие. Според него много от конфликтите се разиграват на местно ниво, без връзка помежду си, но разделителните линии са едни и същи, със силно сходство между използваните културни символи и реторика.
Според Улф пък става въпрос за процес, който се движи отгоре надолу: политическите партии робуват на все по-екстремни идеологии, позволявайки на най-шумните активисти да задават тона. Въпреки че консервативната партия по онова време е силна, казва Улф, те се възприемат като по-слабата страна, тъй като политическите им победи не успяват да променят поведението и навиците на повечето хора.
Парадоксалното е, че Америка се движи все по-надясно политически, но все по-наляво в културно отношение. Огромна мотивация за консерваторите са гневът и разочарованието от моралния упадък на страната. Но те трябва да се обърнат навътре, интроспективно, и да разберат, че политиката, дори консервативната, няма да им помогне, ако бракът им е нещастен, децата им се бунтуват, а политическата им воля е слаба“, пише Улф.
Във вакуума се раждат и чудовища
За Съединените щати десетилетието след края на Студената война е период на спокойствие и успех, но и на затвърждаване и осъзнаване на дълбоките културни промени. Успешното брандиране и проектиране на образа на „свободния свят“ в света след Втората световна война води до желание у много американци мечтата да се превърне в реалност.
Отражение на това са достигналите апогея си през 60-те и 70-те години движения за правата на жените, на работниците, на гей хората и на чернокожите. Тези движения водят до много съществени законови промени (американките могат да отворят своя собствена банкова сметка едва през 1974 г. например). Именно в такъв контекст контракултурата на 60-те и 70-те създава знакова музика, литература и изобщо изкуство, което бързо превзема света (и така до днес).
Всяка реакция има контрареакция: в случая с историята това са избирането на Ричард Никсън и Роналд Рейгън, през чиито мандати се наблюдава връщане на махалото към „традициите“ според широкото им разбиране; но след като гражданските свободи вече са придобити, тяхното ограничаване се оказва трудно. Поне засега.
Всеки герой се нуждае от антигерой. Към края на 90-те години Близкият изток и Китай стават възможни злодеи по различни, понякога обективни причини. Но още преди атаките на 11 септември американските консервативни движения започват да виждат достоен враг вътре в самата държава – собствените си съграждани с различни политически и културни възгледи, които консерваторите смятат за пагубни за обществената тъкан.
За какво всъщност се воюва?
Към разговора за културните войни се присъединява и политологът Морис Фиорина от Станфорд. Той изтъква, че американската политическа система е мажоритарна – мнозинството (победителите) определя политики, които малцинството (загубилите) понася, но за сметка на това пазарната икономика дава свобода и многообразие на културата. Музиката, книгите и филмите, които се харесват на обществото например, може да не отговарят на представите на управляващото мнозинство (в САЩ редовно продължават опитите за забрана и канселиране на книги и друго изкуство). Резултатът е, че предпочитанията, моралните възгледи и вярванията на обикновените хора може да не получават непременно изражение в политическия живот, но със сигурност могат да бъдат разчетени в популярната култура и изведени от нея.
„Политическият елит съвсем естествено вярва в собствената си важност, но тя е преувеличена“, смята Фиорина. Културните войни между елита могат да доведат до обща поляризация, казва още той, но по-вероятният резултат е хората просто да се отвратят от политиката още повече и да престанат да се интересуват от нея.
Освен това политологът подчертава, че културните войни често пренебрегват значението на по-традиционни разделителни линии, например икономическите: неравенствата и бедността, както и разликата във финансовото положение на демократичните и консервативните избиратели продължават да нарастват и да са основен фактор в американската политика.
Културата почти винаги води до политика, но не и обратното, казва Фиорина. Придвижването на политиката вдясно и на културата вляво означава, че културните консерватори губят в по-важната битка, защото търсят политически решения на дълбоко културни проблеми. Какво е политическото решение на липсата на морал? На порнографията и вулгарността? На липсата на обноски и на емпатия? Разбира се, че тези въпроси нямат отговор, те нямат политически решения и ако консерваторите продължат да преследват такива, рано или късно ще се провалят. Политологът подчертава и че самите консервативни гласоподаватели са далеч от „традицията“: те сменят религията си (вицепрезидентът Джей Ди Ванс стана католик през 2019 г.), населеното си място, развеждат се, женят се отново (президентът Тръмп има три брака и множество документирани изневери) и т.н.
Надеждата умира последна
Културните войни са сигурен симптом за остра социална криза: пренареждане на политическите и финансовите слоеве, дълбоки промени в ценностите и в мисленето на обществата, загуба на сигурни структури (религия, държава) и страх от несигурното бъдеще. Две десетилетия по-късно дебатът на Улф и Хънтър е основополагащ за разбирането на реалността, в която живее Америка – и като резултат светът, включително България, тъй като, подобно на всичко останало, културните войни също са предмет на износ и на експлоатация от източници на дезинформация.
Въпрос е и доколко културните войни отразяват мисленето на американците извън конкретните казуси, около които се разиграват.
Редица проучвания показват, че американците всъщност изразяват съгласие по множество важни проблеми, като здравеопазването, неравенствата и престрелките в училищата например.
Несъгласията идват тогава, когато започне търсенето на решения, и често се експлоатират за политически ползи. Фактът, че републиканците в момента управляват и трите клона на изпълнителната и законодателната власт – Конгреса, Камарата на представителите и президентството, както и че Върховният съд има консервативно мнозинство, все още не е довел до „Великата Америка“, която бе обещана. Напротив, основните проблеми остават същите (както ще разискваме по-подробно в следващия брой). Въпреки пропагандата, въпреки насилието, въпреки невярната информация, реалността си остава същата – както винаги се случва.
Накрая Улф и Хънтър постигат съгласие поне за едно: ако има разлики между американците, те са политически, не културни или религиозни. Американците ценят едни и същи основни ценности – толерантност, плурализъм и индивидуалност.
Надеждата е – казва Улф – да бъде постигнато надграждане върху този консенсус между обикновените хора като противоотрова за екстремизма, който характеризира толкова голяма част от управляващия елит.
И двамата смятат за най-важно, че американците все още вярват в значимостта на демокрацията. Несъгласията са породени от същината ѝ – здравата демокрация по условие дава пространство за различия и несъгласия. Това, разбира се, са думи от отминало десетилетие. Работата по уронването на вярата в демократичната държава тече усилено. Дали основите ще устоят, е въпрос, който всички си задаваме поне веднъж седмично.
Modern applications are not monoliths. They are complex, distributed systems where availability depends on multiple independent components working in harmony. A web server might be running, but if its connection to the database is down or the authentication service is unresponsive, the application as a whole is unhealthy. Relying on a single health check is like knowing the “check engine” light is not on, but not knowing that one of your tires has a puncture. It’s great your engine is going, but you’re probably not driving far.
As applications grow in complexity, so does the definition of “healthy.” We’ve heard from customers, big and small, that they need to validate multiple services to consider an endpoint ready to receive traffic. For example, they may need to confirm that an underlying API gateway is healthy and that a specific ‘/login’ service is responsive before routing users there. Until now, this required building custom, synthetic services to aggregate these checks, adding operational overhead and another potential point of failure.
Today, we are introducing Monitor Groups for Cloudflare Load Balancing. This feature provides a new way to create sophisticated, multi-service health assessments directly on our platform. With Monitor Groups, you can bundle multiple health monitors into a single logical entity, define which components are critical, and use an aggregated health score to make more intelligent and resilient failover decisions.
This new capability, available via the API for our Enterprise customers, removes the need for custom health aggregation services and provides a far more accurate picture of your application’s true availability. In the near future this feature will be available in the Dashboard for all Load Balancing users, not just Enterprise!
How Monitor Groups Work
Monitor Groups function as a superset of monitors. Once you have created your monitors they can be bundled into a single unit – the Monitor Group! When you attach a Monitor Group to an endpoint pool, the health of each endpoint in that pool is determined by aggregating the results of all enabled monitors within the group. These settings, defined within the ‘members’ array of a monitor group, give you granular control over how the collective health is determined.
// Structure for a single monitor within a group
{
  "description": "Test Monitor Group",
  "members": [
    {
      "monitor_id": "string",
      "enabled": true,
      "monitoring_only": false,
      "must_be_healthy": true
    },
    {
      "monitor_id": "string",
      "enabled": true,
      "monitoring_only": false,
      "must_be_healthy": true
    }
  ]
}
Here’s what each property does:
Critical Monitors (must_be_healthy): You can designate a monitor as critical. If a monitor with this setting fails its health check against an endpoint, that endpoint is immediately marked as unhealthy. This provides a definitive override for essential services, regardless of the status of other monitors in the group.
Observational Probes (monitoring_only): Mark a monitor as “monitoring only” to receive alerts and data without it affecting a pool’s health status or traffic steering. This is perfect for testing new checks or observing non-critical dependencies without impacting production traffic.
Quorum-Based Health: In the absence of a failure from a critical monitor, an endpoint’s health is determined by a quorum of all other active monitors. An endpoint is considered globally unhealthy only if more than 50% of its assigned monitors report it as unhealthy. This system prevents an endpoint from being prematurely marked as unhealthy due to a transient failure from a single, non-critical monitor.
You can add up to five monitors to a group.
A diagram showing three health monitors (HTTP, TCP, and Database) combined into a single Monitor Group. The group is attached to a Cloudflare Load Balancing pool, which assesses the health of three origin servers.
A Globally Distributed Perspective
The power of Monitor Groups is amplified by the scale of Cloudflare’s global network. Health checks aren’t performed from a handful of static locations; they can be configured to execute from data centers in over 300 cities across the globe. While you can configure monitoring from every data center simultaneously (‘All Datacenters’ mode), we recommend a more targeted approach for most applications. Choosing a few diverse regions, like Western North America and Eastern Europe, or using the ‘All Regions’ setting provides a robust, global perspective on your application’s health while reducing the volume of health monitoring traffic sent to your origins. This creates a distributed consensus on application health, preventing a localized network issue from triggering a false positive and causing an unnecessary global failover. Your application’s health is determined not by a single perspective, but by a global one.
This same principle elevates Dynamic Steering when used in conjunction with Monitor Groups. The latency for a Monitor Group isn’t just a single RTT measurement. It’s a holistic performance score, averaged from, potentially, hundreds of points of presence, across all the critical services you’ve defined. This means your load balancer steers traffic based on a true, globally-aware understanding of your application’s performance.
For load balancers using Dynamic Steering and a Monitor Group, the latency used to make steering decisions is now calculated as the average Round Trip Time (RTT) of all active, non-monitoring-only members in the group. This provides a more stable and representative performance metric. Rather than relying on the latency of a single service, Dynamic Steering can now make decisions based on the collective performance of all critical components, ensuring traffic is sent to the endpoint that is truly the most performant overall.
Health Aggregation in Action
Let’s walk through an example to see how Cloudflare aggregates health signals from a Monitor Group to determine the overall health of a single endpoint. In this scenario, our application has three key components we need to check: a public-facing /health endpoint, another service running on a specific TCP port, and a database dependency. Privacy and security are paramount, so, to monitor the database without exposing it to the public Internet, you would securely connect it to Cloudflare using a Cloudflare Tunnel, allowing our health checks to reach it securely.
Setup
Health Monitors in the Group:
HTTP check for /health (must_be_healthy: true)
TCP check for Port 3000 connectivity (must_be_healthy: false)
DB check for database health (must_be_healthy: false)
Health Check Regions:
Western North America (3 data centers)
Eastern North America (3 data centers)
Quorum Threshold: An endpoint is considered healthy if more than 50% of checking data centers report it as UP.
First, Cloudflare determines the health from the perspective of each individual data center. If the critical monitor fails, that data center’s result is definitively DOWN. Otherwise, the result is based on the majority status of the remaining monitors.
Here are the results from our six data centers:
[image description: A table showing health check results from six data centers across two regions. One of the six data centers report a “DOWN” status because the critical HTTP monitor failed. The other five report “UP” because the critical monitor passed and a majority of the remaining monitors were healthy.]
Finally, the results from all six checking data centers are combined to determine the final, global health status for the endpoint.
Global Result: 5 out of the 6 total data centers (83%) report the endpoint as UP.
Conclusion: Because 83% is greater than the 50% quorum threshold, the endpoint is considered globally healthy and will continue to receive traffic.
This multi-layered quorum system provides incredible resilience, ensuring that failover decisions are based on a comprehensive and geographically distributed consensus.
Getting Started with Monitor Groups
Monitor Groups are now available via the API for all customers with an Enterprise Cloudflare Load Balancing subscription and will be made available to self-serve customers in the near future. To get started with building more sophisticated health checks for your applications today, check out our developer documentation.
POST accounts/{account_id}/load_balancers/monitor_groups
{
  "description": "Monitor group for checkout service",
  "members": [
    {
      "monitor_id": "string",
      "must_be_healthy": true,
	"enabled": true
    },
    {
      "monitor_id": "string",
      "monitoring_only": false,
	"enabled": true
    }
  ]
}
Once created, you can attach the group to a pool by referencing its ID in the monitor_group field of the pool object.
What’s Next
We are continuing to build a seamless platform experience that simplifies traffic management for both internal and external applications. Looking ahead, Monitor Groups will be making its way into the Dashboard for all users soon! We are also working on more flexible role-based access controls and even more advanced load-based load balancing capabilities to give you the granular control you need to manage your most complex applications.
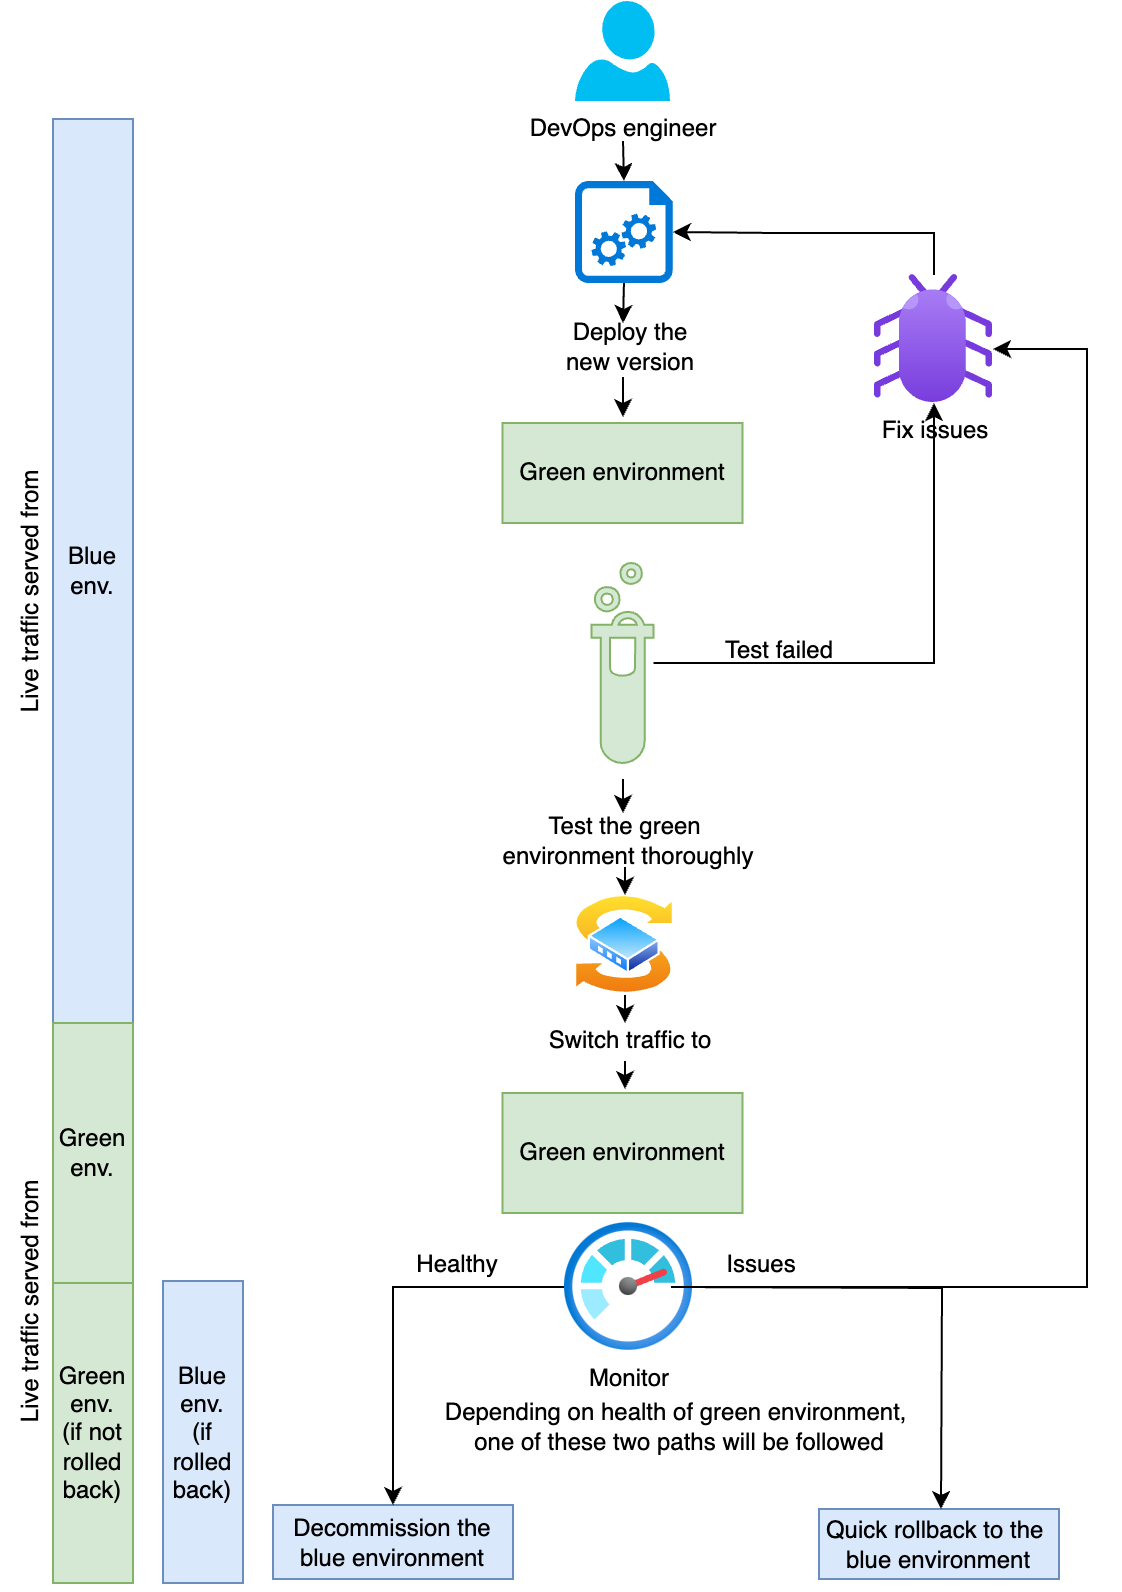
Modern applications require deployment strategies that minimize downtime and reduce risk. Blue/green deployment is a strategy that reduces downtime and risk by running two identical production environments called “blue” and “green”. At any given time, only one environment serves live production traffic while the other remains idle. This strategy provides immediate fallback to the previous stable version if issues arise after the new deployment. Let’s say a company is deploying a new version of its application. The following diagram shows the blue/green deployment strategy they are using.
As shown in the preceding diagram, current production traffic is served by the blue environment. During deployment of the new version of the application, the following sequence of activities happens:
Deploy the new version of the application: Deploy the new version to the green environment.
Test thoroughly: Test the new version in the green environment by invoking the API invoke URL from API Gateway. This does not affect production traffic, which continues to be served by the blue environment.
Switch traffic: After you have thoroughly tested the green environment, redirect all production traffic from the blue to the green environment.
Monitor and take any necessary action: Continue to monitor the green environment as it serves production traffic. Keep the blue environment ready for immediate rollback to the previous stable version, in case any issues arise in the green environment. At this point, one of two possible outcomes happens:
If you identify any issues with the green environment in production, roll back to the previous stable version of the blue environment and fix the green environment before retrying.
If you observe no issues with the green environment, decommission the blue environment. The green environment is now the new blue environment, the environment with stable production version of the application serving live traffic.
In this post, you learn how to implement blue/green deployments by using Amazon API Gateway for your APIs. For this post, we use AWS Lambda functions on the backend. However, you can follow the same strategy for other backend implementations of the APIs. All the required infrastructure is deployed by using AWS Serverless Application Model (AWS SAM).
Solution overview
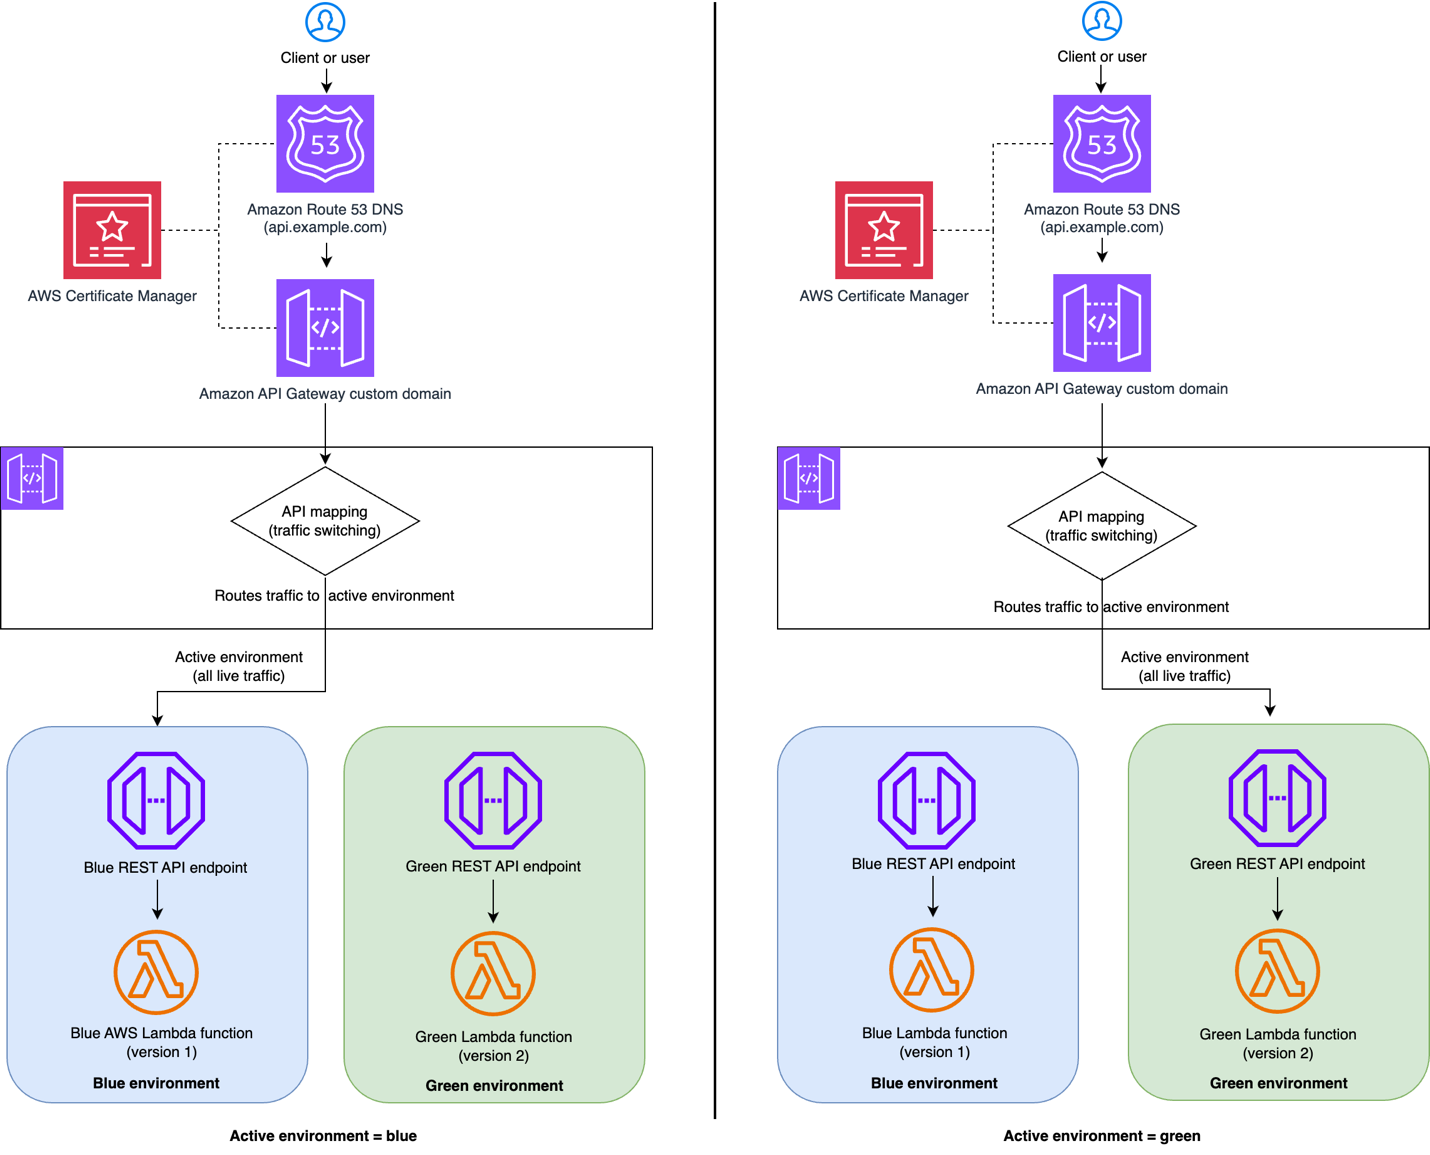
As you follow along with this post, you will implement the following blue/green deployment architecture by using API Gateway custom domain API mapping. You use API mappings to connect API stages to a custom domain name. After you create a domain name and configure DNS records, you use API mappings to send traffic to your APIs through your custom domain name.
As shown in the preceding diagram, the blue/green deployment architecture includes four primary AWS services – Amazon Route 53, Amazon API Gateway, AWS Lambda functions, and AWS Certificate Manager (ACM). When you send a request to the API, the Route 53 resolves the domain to the API Gateway custom domain. API Gateway handles HTTPS termination by using a configured ACM certificate. API Gateway examines the incoming request path and headers to route the request to the active environment.
You first set up the blue environment along with the Route 53 DNS configuration, API Gateway custom domain mapping, ACM and test it with Route 53 URL. This is your production environment serving live traffic. After that, deploy a new version of the application in the green environment and test it by invoking the API invoke URL from API Gateway while live traffic is still being served from the blue environment. Then, switch the traffic from the blue environment to the green environment by using API Gateway custom domain API mapping. This ensures that there is no change in the external (client-facing) API custom domain URL. Live traffic is now served by the green environment. If you observe any issues during this time, you can quickly roll back to the blue environment and fix the green environment. If the green environment is stable, you can decommission the blue environment.
This post uses two separate regional API endpoints to simulate blue/green environments and traffic routing between them but you can this same architectural pattern using single API endpoint with two stages representing blue and green environments.
Prerequisites
Complete the following prerequisites before you start setting up the solution:
Note that this is a sample project to understand the concept and not for direct usage in production. The sample project contains three APIs.
Health GET API to know the current health of the environment and which environment the request was served from.
Pets GET API to get the list of available pets.
Order POST API to place a pet order.
Follow the steps below to setup blue/green deployment and test it.
Clone the repository and navigate to the directory (all commands run from here) Clone the GitHub repository in a new folder and navigate to the stacks folder.
git clone https://github.com/aws-samples/sample-blue-green-deployment-with-api-gateway.git
cd sample-blue-green-deployment-with-api-gateway/stacks
Deploy the blue environment You will first setup the blue environment. Run the following commands to deploy the blue environment:
sam build -t blue-stack.yaml
sam deploy -g -t blue-stack.yaml
Enter the following details:
Stack name: The CloudFormation stack name (for example, blue-green-api-blue)
AWS Region: A supported AWS Region (for example, us-east-1)
BlueLambdaFunction has no authentication. Is this okay?: y
SAM configuration file: blue-samconfig.toml
Keep everything else set to their default values. You will use the SAM deploy output for the subsequent steps. Going forward, you can run the following command to deploy the blue environment resources:
sam build -t blue-stack.yaml
sam deploy -t blue-stack.yaml --config-file blue-samconfig.toml
Test the blue environment
Run the following commands to test the blue environment after replacing ApiEndpoint with BlueApiEndpoint from the SAM deploy output in each case. First, test Health check API to know the health of the environment. Run the following command.
curl --request GET \
--url https://<ApiEndpoint>/health
Check that the response contains the environment attribute set to blue and the version attribute set to v1.0.0
Deploy API Gateway custom domain pointing to the blue environment
Run the following commands to deploy Amazon API Gateway custom domain with API mapping pointing to the blue environment created in the previous step.
sam build -t custom-domain-stack.yaml
sam deploy -g -t custom-domain-stack.yaml
Enter the following details:
Stack name: (for example, blue-green-api-custom-domain)
AWS Region: A supported AWS Region (for example, us-east-1)
PublicHostedZoneId: The Route 53 public hosted zone ID (for example, ABXXXXXXXXXXXXXXXXXYZ)
CustomDomainName: The Route 53 domain name (for example, api.example.com)
CertificateArn: The ACM certificate ARN (for example, arn:aws:acm:us-east-1:123456789012:certificate/abc123)
ActiveApiId: The value of the BlueApiId output from the blue-stack deployment
ActiveApiStage: The value of the BlueApiStage output from the blue-stack deployment
SAM configuration file: custom-domain-samconfig.toml
Keep everything else to their default values. You will use the SAM deploy output for the subsequent steps. At this point the production (live) traffic is routed to blue environment.
Test the production (live) traffic which is routed to blue environment
Follow the test method mentioned in step 3 to test the production environment, but replace ApiEndpoint with CustomDomainUrl. Check that the production environment response contains the environment attribute set to blue and the version attribute set to v1.0.0
Deploy the green environment
You will now deploy the v2.0.0 of the application on green environment. Run the following commands to deploy the green environment:
sam build -t green-stack.yaml
sam deploy -g -t green-stack.yaml
Enter the following details:
Stack name: (for example, blue-green-api-green)
AWS Region: Select the same Region as the blue environment (for example, us-east-1)
GreenLambdaFunction has no authentication. Is this okay?: y
SAM configuration file: green-samconfig.toml
Keep everything else to default values. You will use the SAM deploy output for the subsequent steps. Going forward, you can run the following commands to deploy the green environment.
sam build -t green-stack.yaml
sam deploy -t green-stack.yaml --config-file green-samconfig.toml
Test the green environment Follow the test method shown in step 3 to test the production environment, but replace ApiEndpoint with GreenApiEndpoint. Validate that the response contains the environment attribute set to green and the version attribute set to v2.0.0
Switch the live traffic to the green environment Run the following command to switch live traffic to the green environment:
sam deploy -g -t custom-domain-stack.yaml --config-file custom-domain-samconfig.toml
Enter the following details:
Stack name: Keep it as it is.
AWS Region: Keep it as it is.
PublicHostedZoneId: Keep it as it is.
CustomDomainName: Keep it as it is.
CertificateArn: Keep it as it is.
ActiveApiId: The value of GreenApiEndpoint output from the green-stack deployment
ActiveApiStage: The value of GreenApiStage output from the green-stack deployment
SAM configuration file: Keep it as it is.
Keep everything else at their default values.
Test the production environment (now green) again
Follow the test method shown in step 3 to test the production environment (now green) again, and be sure to replace ApiEndpoint with CustomDomainUrl from SAM deploy output. Validate that the response now contains the environment attribute set to green and the version attribute set to v2.0.0. Note that it may take a minute or two for the change to be seen due to local DNS caching, during this time some of the traffic may be still served from the blue environment. After switching the live traffic to the green environment, if there is an issue, you can switch the live traffic back to the blue environment and fix the green environment. Depending on whether you need to roll back to the previous stable blue environment or decommission the blue environment when you no longer need it, follow either step 10 or 11.
(Option 1) Roll back to the blue environment, if necessary Run the following command to roll back to the blue environment, if necessary.
sam deploy -g -t custom-domain-stack.yaml --config-file custom-domain-samconfig.toml
Enter the following details:
Stack name: Keep it as it is.
AWS Region: Keep it as it is.
PublicHostedZoneId: Keep it as it is.
CustomDomainName: Keep it as it is.
CertificateArn: Keep it as it is.
ActiveApiId: Value of BlueApiEndpoint output from the blue-stack deployment.
ActiveApiStage: The value of BlueApiStage output from the blue-stack deployment.
SAM configuration file: Keep it as it is.
Keep everything else to their default values. Live traffic is switched to the blue environment. You can confirm that by following step 3.
(Option 2) Decommission the blue environment when you no longer need it Run the following command to decommission (delete) the blue environment when you no longer need it. Replace blue-stack-name with your blue deployment stack name:
sam delete --stack-name <blue-stack-name> --no-prompts
Clean up
To avoid costs, remove all resources created along this post once you’re done.
Run the following command after replacing the <placeholder> variables to delete the resources you deployed for this post’s solution:
# Delete all stacks (in reverse order)
# Delete custom domain
sam delete --stack-name <api-custom-domain-stack-name> --no-prompts
# Delete green stack
sam delete --stack-name <green-stack-name> --no-prompts
# Delete blue stack, if already not deleted in step 10
sam delete --stack-name <blue-stack-name> --no-prompts
Conclusion
Blue/green deployments with API Gateway provide a robust, scalable solution for zero-downtime deployments that deliver significant technical and operational advantages. This post’s solution architecture enables traffic switching at the API Gateway level while maintaining complete isolation between the blue and green environments to prevent interference. The solution offers immediate rollback capabilities for quick issue resolution and supports comprehensive testing through production-like validation before any traffic switching occurs.
Following this solution you can build a solid foundation for production blue/green deployments for your serverless microservice architecture that maintains the flexibility to adapt to your specific requirements while ensuring reliability, scalability, and operational excellence. To learn more about serverless architectures see Serverless Land.
This is a guest post by Supreet Padhi, Technology Architect, and Manasa Ramesh, Technology Architect at Precisely in partnership with AWS.
Enterprises rely on mainframes to run mission-critical applications and store essential data, enabling real-time operations that help achieve business objectives. These organizations face a common challenge: how to unlock the value of their mainframe data in today’s cloud-first world while maintaining system stability and data quality. Modernizing these systems is critical for competitiveness and innovation.
The digital transformation imperative has made mainframe data integration with cloud services a strategic priority for enterprises worldwide. Organizations that can seamlessly bridge their mainframe environments with modern cloud platforms gain significant competitive advantages through improved agility, reduced operational costs, and enhanced analytics capabilities. However, implementing such integrations presents unique technical challenges that require specialized solutions. Some of the challenges include converting EBCDIC data to ASCII, where the handling of data types is unique to the mainframe, such as binary data and COMP data. Data stored in Virtual Storage Access Method (VSAM) files can be quite complex due to practices to store multiple different record types in a single file. To address these challenges, Precisely—a global leader in data integrity, serving over 12,000 customers—has partnered with Amazon Web Services (AWS) to enable real-time synchronization between mainframe systems and Amazon Relational Database Service (Amazon RDS). For more on this collaboration, check out our previous blog post: Unlock Mainframe Data with Precisely Connect and Amazon Aurora.
In this post, we introduce an alternative architecture to synchronize mainframe data to the cloud using Amazon Managed Streaming for Apache Kafka (Amazon MSK) for greater flexibility and scalability. This event-driven approach provides additional possibilities for mainframe data integration and modernization strategies.
A key enhancement in this solution is the use of the AWS Mainframe Modernization – Data Replication for IBM z/OS Amazon Machine Image (AMI) available in AWS Marketplace, which simplifies deployment and reduces implementation time.
Real-time processing and event-driven architecture benefits
Real-time processing makes data actionable within seconds rather than waiting for batch processing cycles. For example, financial institutions such as Global Payments have leveraged this solution to modernize mission-critical banking operations, including payments processing. By migrating these operations to the AWS Cloud, they enhanced user experience, improved scalability and maintainability, while enabling advanced fraud detection – all without impacting the performance of existing mainframe systems. Change data capture (CDC) enables this by identifying database changes and delivering them in real time to cloud environments.
CDC offers two key advantages for mainframe modernization:
Incremental data movement – Eliminates disruptive bulk extracts by streaming only changed data to cloud targets, minimizing system impact and ensuring data currency
Real-time synchronization – Keeps cloud applications in sync with mainframe systems, enabling immediate insights and responsive operations
Solution overview
In this post, we provide a detailed implementation guide for streaming mainframe data changes from DB2z through AWS Mainframe Modernization – Data Replication for IBM z/OS AMI to Amazon MSK and then applying those changes to Amazon Relational Database Service (Amazon RDS) for PostgreSQL using MSK Connect with the Confluent JDBC Sink Connector.
By introducing Amazon MSK into architecture and streamlining deployment through the AWS Marketplace AMI, we create new possibilities for data distribution, transformation, and consumption that expand upon our previously demonstrated direct replication approach. This streaming-based architecture offers several additional benefits:
Simplified deployment – Accelerate implementation using the preconfigured AWS Marketplace AMI
Decoupled systems – Separate the concern of data extraction from data consumption, allowing both sides to scale independently
Multi-consumer support – Enable multiple downstream applications and services to consume the same data stream according to their own requirements
Extensibility – Create a foundation that can be extended to support additional mainframe data sources such as IMS and VSAM, as well as additional AWS targets using MSK Connect sink connectors
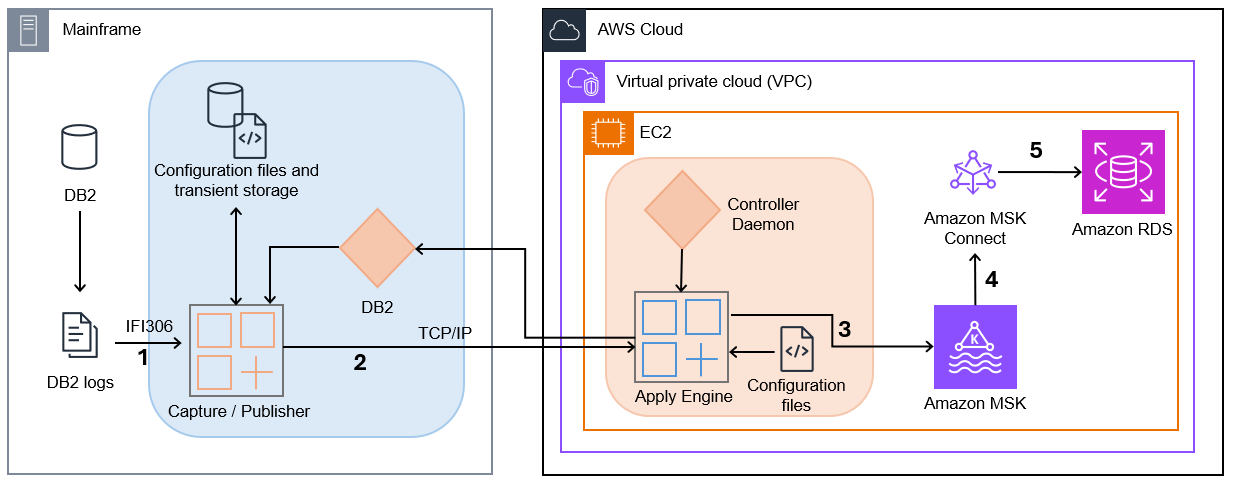
The following diagram illustrates the solution architecture.
Capture/Publisher – Connect CDC Capture/Publisher captures Db2 changes from Db2 logs using IFI 306 Read and communicates captured data changes to a target engine through TCP/IP.
Controller Daemon – The Controller Daemon authenticates all connection requests, managing secure communication between the source and target environments.
Apply Engine – The Apply Engine is a multifaceted and multifunctional component in the target environment. It receives the changes from the Publisher agent and applies the changed data to the target Amazon MSK.
Connect CDC Single Message Transform (SMT) – Performs all necessary data filtering, transformation, and augmentation required by the sink connector.
JDBC Sink Connector – As data arrives, an instance of the JDBC Sink Connector along with Apache Kafka writes the data to target tables in Amazon RDS.
This architecture provides a clean separation between the data capture process and the data consumption process, allowing each to scale independently. The use of MSK as an intermediary enables multiple systems to consume the same data stream, opening possibilities for complex event processing, real-time analytics, and integration with other AWS services.
Prerequisites
To complete the solution, you need the following prerequisites:
Create a DB cluster by using the following AWS Command Line Interface (AWS CLI) command. Replace the placeholder strings with values that correspond to your cluster’s subnet and subnet group IDs.
To create a serverless MSK cluster, complete the following steps:
Copy the following JSON and paste it into a new file create-msk-serverless-cluster.json. Replace the placeholder strings with values that correspond to your cluster’s subnet and security group IDs.
To create a Kafka topic, you need to install the Kafka CLI first. Follow these steps:
Download the binary distribution of Apache Kafka and extract the archive in folder kafka:
wget https://dlcdn.apache.org/kafka/3.9.0/kafka_2.13-3.9.0.tgz
   tar -xzf kafka_2.13-3.9.0.tgz
   ln -sfn kafka_2.13-3.9.0 kafka
To use IAM to authenticate with the MSK cluster, download the Amazon MSK Library for IAM and copy to the local Kafka library directory as shown in the following code. For complete instructions, refer to Configure clients for IAM access control.
Copy the following JSON and paste it into a new file create-custom-plugin.json. Replace the placeholder strings with values that correspond to your bucket.
Prepare the source table. Before configuring the Capture/Publisher, ensure the DEPT source table exists on your mainframe Db2 system. The table definition should match the structure defined at \$SQDATA_VAR_DIR/templates/dept.ddl. If you need to create this table on your mainframe, use the DDL from this file as a reference to ensure compatibility with the replication process.
Access the Interactive System Productivity Facility (ISPF) interface. Sign in to your mainframe system and access the AWS Mainframe Modernization – Data Repication for IBM z/OS ISPF panels through the supplied ISPF application menu. Select option 3 (CDC) to access the CDC configuration panels, as demonstrated in our previous blog post.
Add source tables for capture:
From the CDC Primary Option Menu, choose option 2 (Define Subscriptions).
Choose option 1 (Define Db2 Tables) to add source tables.
On the (Add DB2 Source Table to CAB File panel), enter a wildcard value (%) or the specific table name DEPT in the (Table Name) field.
Press Enter to display the list of available tables.
Type S next to the DEPT table to select it for replication, then press Enter to confirm.
This process is like the table selection process shown in figure 3 and figure 4 of our previous post but now focuses specifically on the DEPT table structure.
With the completion of both the Db2 Capture/Publisher setup on the mainframe and the AWS environment configuration (Amazon MSK, Apply Engine, and MSK Connect JDBC Sink Connector), you now have a fully functional pipeline ready to capture data changes from the mainframe and stream them to the MSK topic. Inserts, updates, or deletions to the DEPT table on the mainframe will be automatically captured and pushed to the MSK topic in near real time. From there, the MSK Connect JDBC Sink Connector and the custom SMT will process these messages and apply the changes to the PostgreSQL database on Amazon RDS, completing the end-to-end replication flow.
Configure Apply Engine for Amazon MSK integration
Configure the AWS side components to receive data from the mainframe and forward it to Amazon MSK. Follow these steps to define and manage a new CDC pipeline from DB2 z/OS to Amazon MSK:
Use the following command to switch to the connect user:
Copy the following content and paste it in a new file $SQDATA_VAR_DIR/apply/DB2ZTOMSK/scripts/DB2ZTOMSK.sqd. Replace the placeholder strings with values that correspond to the DB2z endpoint:
-----------------------------------------------------------------------
   Name: DB2TOKAF: Z/OS DB2 To Kafka
   -----------------------------------------------------------------------
   SUBSTITUTION PARMS USED IN THIS SCRIPT:
   ---------------------------------------------------------------------
   JOBNAME DB2TOKAFKA;
   -----------------------------
   TABLE DESCRIPTIONS
   ---------------------------
   BEGIN GROUP SOURCE_TABLES;
   DESCRIPTION Db2SQL /var/precisely/di/sqdata/apply/DB2ZTOMSK/ddl/dept.ddl AS DEPT KEY IS DEPTNO;
   END GROUP;
   -------------------------------------------------------------
   DATASTORE SECTION
   -------------------------------------------------------------
   SOURCE DATASTORE
   DATASTORE cdc://<DB2z endpoint with port>/dbcg/DBCG_TBTSS388T6 OF UTSCDC AS CDCIN DESCRIBED BY GROUP SOURCE_TABLES;
   -- TARGET DATASTORE
   DATASTORE kafka:///pgsql-sink-topic/table_key OF JSON AS TARGET KEY IS DEPTNO DESCRIBED BY GROUP SOURCE_TABLES;
   ---------------------------------
   PROCESS INTO TARGET
   SELECT { REPLICATE(TARGET) } FROM CDCIN;
The following is an example of the output that you get when you invoke the command successfully:
SQDC042I mounting/running sqdparse with arguments:
SQDC041I args[0]:sqdparse
SQDC041I args[1]:/var/precisely/di/sqdata/apply/DB2ZTOMSK/scripts/DB2ZTOMSK.sqd
SQDC041I args[2]:/var/precisely/di/sqdata/apply/DB2ZTOMSK/scripts/DB2ZTOMSK.prc
SQDC000I *******************************************************
SQDC021I sqdparse Version 5.0.1-rel (Linux-x86_64)
SQDC022I Build-id 4f2d7c16728aa2e40c610db7d5a6e373476a9889
SQDC023I (c) 2001, 2025 Syncsort Incorporated. All rights reserved.
SQDC000I *******************************************************
SQDC000I
SQD0000I 2025-03-31 00:59:10
>>> Start Preprocessed /var/precisely/di/sqdata/apply/DB2ZTOMSK/scripts/DB2ZTOMSK.sqd
000001 ----------------------------------------------------------------------
000002 -- Name: DB2TOKAF:  Z/OS DB2 To Kafka
000003 ----------------------------------------------------------------------
000004 --  SUBSTITUTION PARMS USED IN THIS SCRIPT:
000005 ----------------------------------------------------------------------
000006
000007 JOBNAME DB2TOKAFKA;
000008
000009 ----------------------------
000010 -- TABLE DESCRIPTIONS
000011 ----------------------------
000012 BEGIN GROUP SOURCE_TABLES;
000013 DESCRIPTION Db2SQL /var/precisely/di/sqdata/apply/DB2ZTOMSK/ddl/dept.ddl  AS DEPT
000014 KEY IS DEPTNO;
000015 END GROUP;
000016
000017 ------------------------------------------------------------
000018 --       DATASTORE SECTION
000019 ------------------------------------------------------------
000020
000021 -- SOURCE DATASTORE
000022 DATASTORE /var/precisely/di/sqdata/apply/DB2ZTOMSK/scripts/DB0A.ENGINE3.DEPT.COPY
000023           OF UTSCDC
000024           AS CDCIN
000025           DESCRIBED BY GROUP SOURCE_TABLES;
000026
000027 -- TARGET DATASTORE
000028 DATASTORE
000029           OF JSON
000030           AS TARGET
000031           KEY IS DEPTNO
000032           DESCRIBED BY GROUP SOURCE_TABLES;
000033
000034 ----------------------------------
000035
000036 PROCESS INTO TARGET
000037 SELECT
000038 {
000039     REPLICATE(TARGET)
000040 }
000041 FROM CDCIN;
<<< End Preprocessed /var/precisely/di/sqdata/apply/DB2ZTOMSK/scripts/DB2ZTOMSK.sqd
>>> Start Preprocessed /var/precisely/di/sqdata/apply/DB2ZTOMSK/ddl/dept.ddl
000001 CREATE TABLE DEPARTMENT
000002 (
000003    DEPTNO char(3) NOT NULL,
000004    DEPTNAME varchar(36) NOT NULL,
000005    MGRNO char(6),
000006    ADMRDEPT char(3) NOT NULL,
000007    LOCATION char(16),
000008    CONSTRAINT PK_DEPTNO PRIMARY KEY (DEPTNO)
000009 ) ;
<<< End Preprocessed /var/precisely/di/sqdata/apply/DB2ZTOMSK/ddl/dept.ddl
Number of Data Stores...................: 2
Data Store..............................: /var/precisely/di/sqdata/apply/DB2ZTOMSK/scripts/DB0A.ENGINE3.DEPT.COPY
  Alias.................................: CDCIN
  Type..................................: UTS Change Data Capture
  Number of Records.....................: 1
    Record Name.........................: DEPARTMENT
    Record Description Alias............: DEPT
    Record Description Length...........: 72
    Number of Fields....................: 5
      ................................... TYPE            OFF   LEN   XLEN  EXT
      ................................... ---------- ----- ----- ----- -----
      DEPTNO............................: CHAR(3)             0     3     3
      DEPTNAME..........................: VARCHAR(36)         3    38    38
      MGRNO.............................: CHAR(6)             7     6     6
      ADMRDEPT..........................: CHAR(3)            14     3     3
      LOCATION..........................: CHAR(16)           17    16    16
Data Store..............................:
  Alias.................................: TARGET
  Type..................................: JSON
  Number of Records.....................: 1
    Record Name.........................: DEPARTMENT
    Record Description Alias............: DEPT
    Record Description Length...........: 70
    Number of Fields....................: 5
      ................................... TYPE            OFF   LEN   XLEN  EXT
      ................................... ---------- ----- ----- ----- -----
      DEPTNO............................: CHAR(3)             0     3     3
      DEPTNAME..........................: VARCHAR(36)         3    38    38
      MGRNO.............................: CHAR(6)            41     6     6
      ADMRDEPT..........................: CHAR(3)            47     3     3
      LOCATION..........................: CHAR(16)           50    16    16
Section.................................: SQDSTP000
  Number of steps.......................: 1
SQDC017I sqdparse(pid=4023) terminated successfully
Copy the following content and paste it in a new file /var/precisely/di/sqdata_logs/apply/DB2ZTOMSK/sqdata_kafka_producer.conf. Replace the placeholder strings with values that correspond to your bootstrap server and AWS Region.
Invoke the following command to verify the data in the PostgreSQL database:
PGPASSWORD="password" psql --host=<DATABASE-HOST> --username=<user> --dbname=<database> -c "select * from \"DEPT\""
With these steps completed, you’ve successfully set up end-to-end data replication from DB2z to RDS for PostgreSQL, using AWS Mainframe Modernization – Data Replication for IBM z/OS AMI, Amazon MSK, MSK Connect, and the Confluent JDBC Sink Connector.
Cleanup
When you’re finished testing this solution, you can clean up the resources to avoid incurring additional charges. Follow these steps in sequence to ensure proper cleanup.
By capturing changed data from DB2z and streaming it to AWS targets, organizations can modernize their legacy mainframe data stores, enabling operational insights and AI initiatives. Businesses can use this solution to take advantage of cloud-based applications with mainframe data to provide scalability, cost-efficiency, and enhanced performance.
The integration of AWS Mainframe Modernization – Data Replication for IBM z/OS AMI with Amazon MSK and RDS for PostgreSQL provides an enhanced framework for real-time data synchronization that maintains data integrity. This architecture can be extended to support additional mainframe data sources such as VSAM and IMS, as well as other AWS targets. Organizations can then tailor their data integration strategy to specific business needs. Data consistency and latency challenges can be effectively managed through AWS and Precisely’s monitoring capabilities. By adopting this architecture, organizations keep their mainframe data continually available for analytics, machine learning (ML), and other advanced applications.Streaming mainframe data to AWS in near real time represents a strategic step toward modernizing legacy systems while unlocking new opportunities for innovation, with data transfers occurring in subseconds. With Precisely and AWS, organizations can effectively navigate their modernization journey and maintain their competitive advantage.
Learn more about AWS Mainframe Modernization – Data Replication for IBM z/OS AMI in the Precisely documentation. AWS Mainframe Modernization Data Replication is available for purchase in AWS Marketplace. For more information about the solution or to see a demonstration, contact Precisely.
Today, I’m happy to announce Amazon EC2 Capacity Manager, a centralized solution to monitor, analyze, and manage capacity usage across all accounts and AWS Regions from a single interface. This service aggregates capacity information with hourly refresh rates and provides prioritized optimization opportunities, streamlining capacity management workflows that previously required custom automation or manual data collection from multiple AWS services.
Organizations using Amazon Elastic Compute Cloud (Amazon EC2) at scale operate hundreds of instance types across multiple Availability Zones and accounts, using On-Demand Instances, Spot Instances, and Capacity Reservations. This complexity means customers currently access capacity data through various AWS services including the AWS Management Console, Cost and Usage Reports, Amazon CloudWatch, and EC2 describe APIs. This distributed approach can create operational overhead through manual data collection, context switching between tools, and the need for custom automation to aggregate information for capacity optimization analysis.
EC2 Capacity Manager helps you overcome these operational complexities by consolidating all capacity data into a unified dashboard. You can now view cross-account and cross-Region capacity metrics for On-Demand Instances, Spot Instances, and Capacity Reservations across all commercial AWS Regions from a single location, eliminating the need to build custom data collection tools or navigate between multiple AWS services.
This consolidated visibility can help you discover cost savings by highlighting underutilized Capacity Reservations, analyzing usage patterns across instance types, and providing insights into Spot Instance interruption patterns. By having access to comprehensive capacity data in one place, you can make more informed decisions about rightsizing your infrastructure and optimizing your EC2 spending.
Let me show you the capabilities of EC2 Capacity Manager in detail.
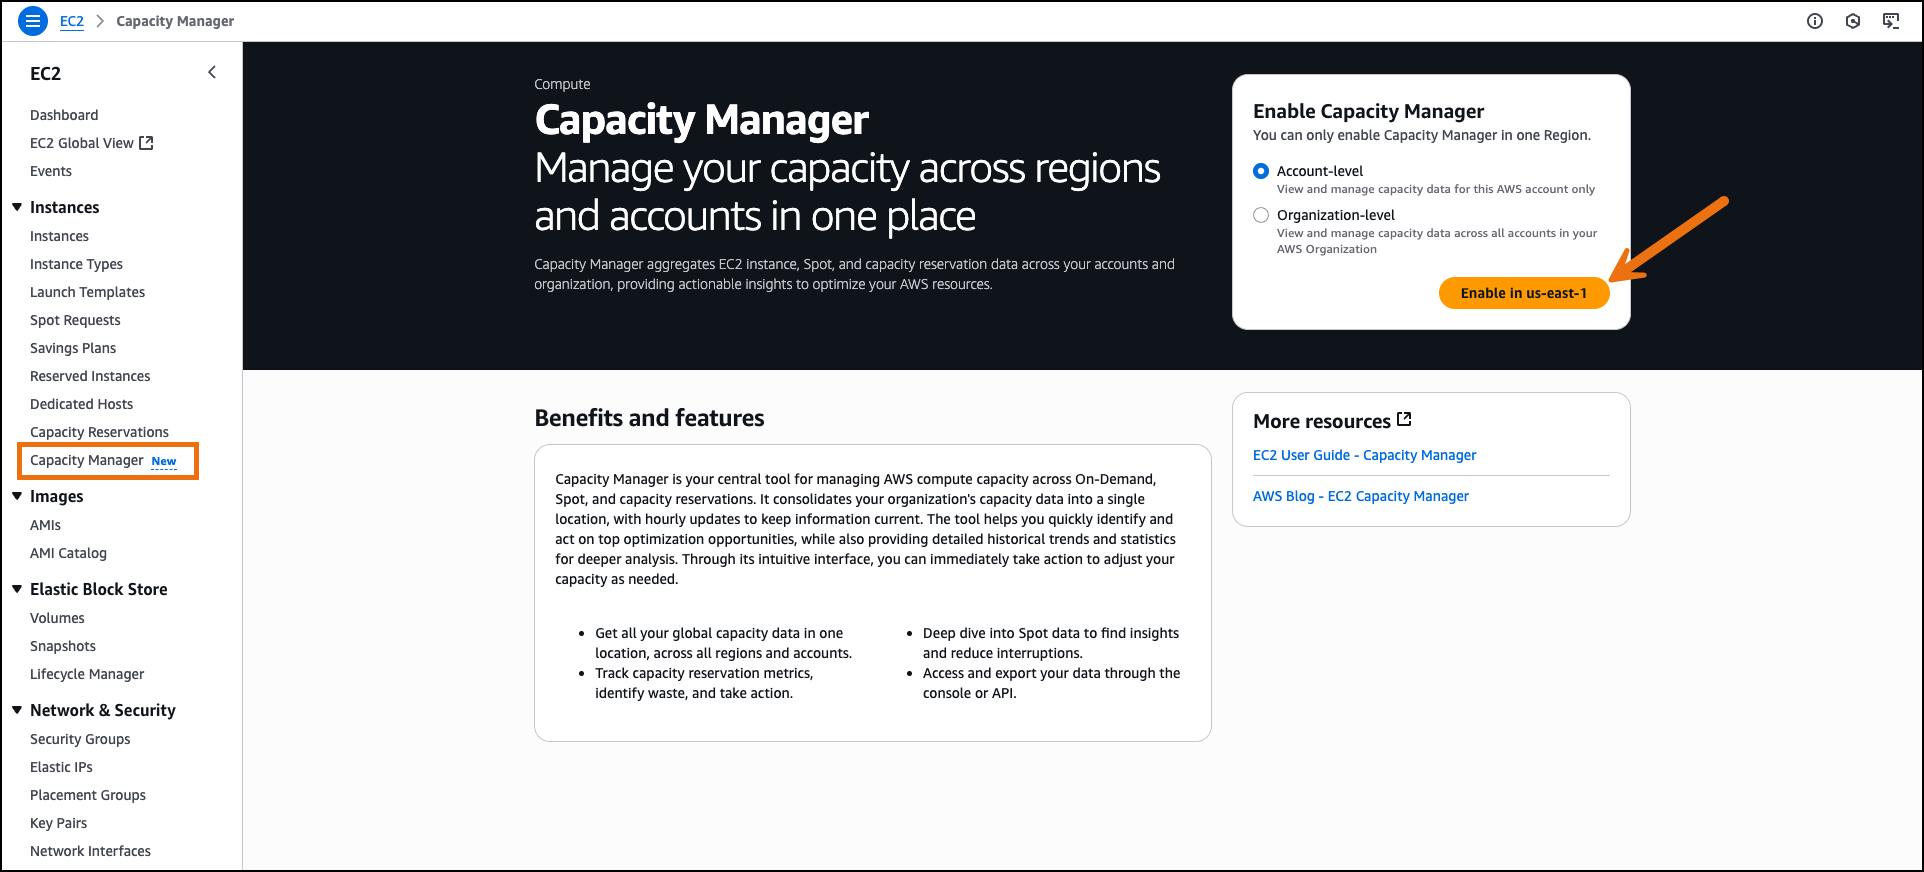
Getting started with EC2 Capacity Manager On the AWS Management Console, I navigate to Amazon EC2 and select Capacity Manager from the navigation pane. I enable EC2 Capacity Manager through the service settings. The service aggregates historical data from the previous 14 days during initial setup.
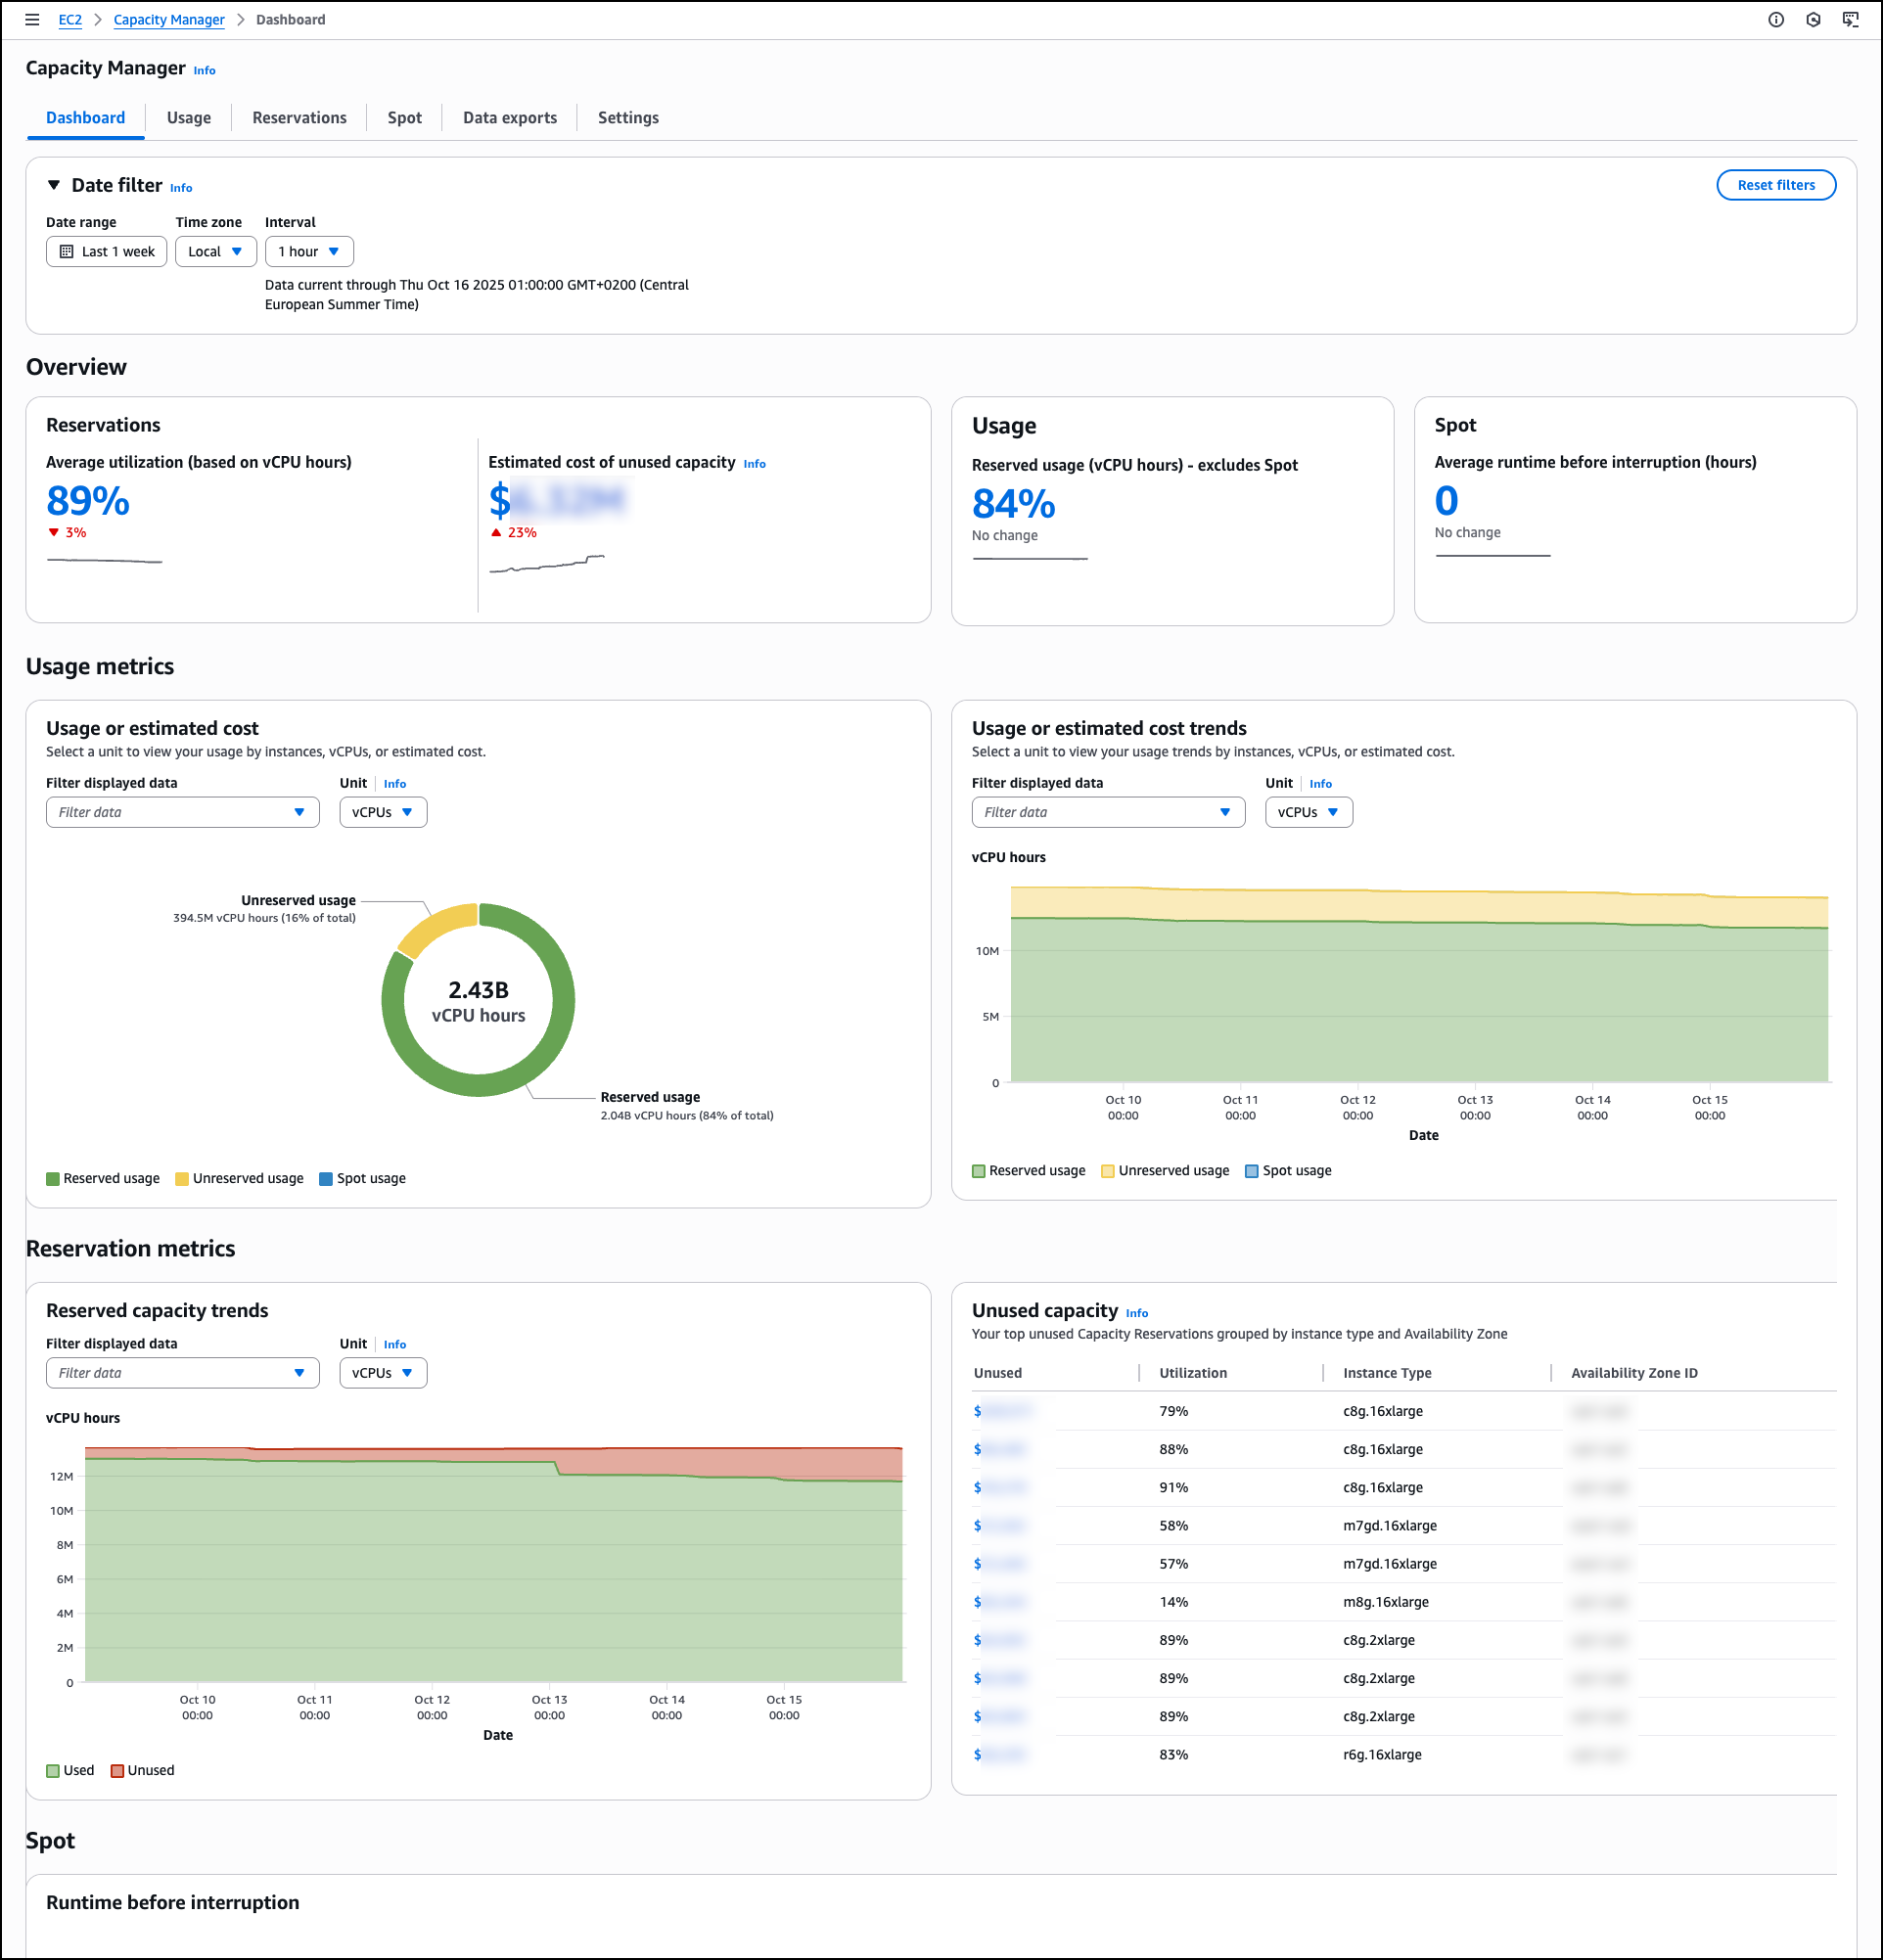
The main Dashboard displays capacity utilization across all instance types through a comprehensive overview section that presents key metrics at a glance. The capacity overview cards for Reservations, Usage, and Spot show trend indicators and percentage changes to help you identify capacity patterns quickly. You can apply filtering through the date filter controls, which include date range selection, time zone configuration, and interval settings.
You can select different units to analyze data by vCPUs, instance counts, or estimated costs to understand resource consumption patterns. Estimated costs are based on published On-Demand rates and do not include Savings Plans or other discounts. This pricing reference helps you compare the relative impact of underutilized capacity across different instance types—for example, 100 vCPU hours of unused p5 reservations represents a larger cost impact than 100 vCPU hours of unused t3 reservations.
The dashboard includes detailed Usage metrics with both total usage visualization and usage over time charts. The total usage section shows the breakdown between reserved usage, unreserved usage, and Spot usage. The usage over time chart provides visualization that tracks capacity trends over time, helping you identify usage patterns and peak demand periods.
Under Reservation metrics,Reserved capacity trends visualizes used and unused reserved capacity across the selected period, showing the proportion of reserved vCPU hours that remain unutilized compared with those actively consumed, helping you track reservation efficiency patterns and identify periods of consistent low utilization. This visibility can help you reduce costs by identifying underutilized reservations and helping you to make informed decisions about capacity adjustments.
The Unused capacity section lists underutilized capacity reservations by instance type and Availability Zone combinations, displaying specific utilization percentages and instance types across different Availability Zones. This prioritized list helps you identify potential savings with direct visibility into unused capacity costs.
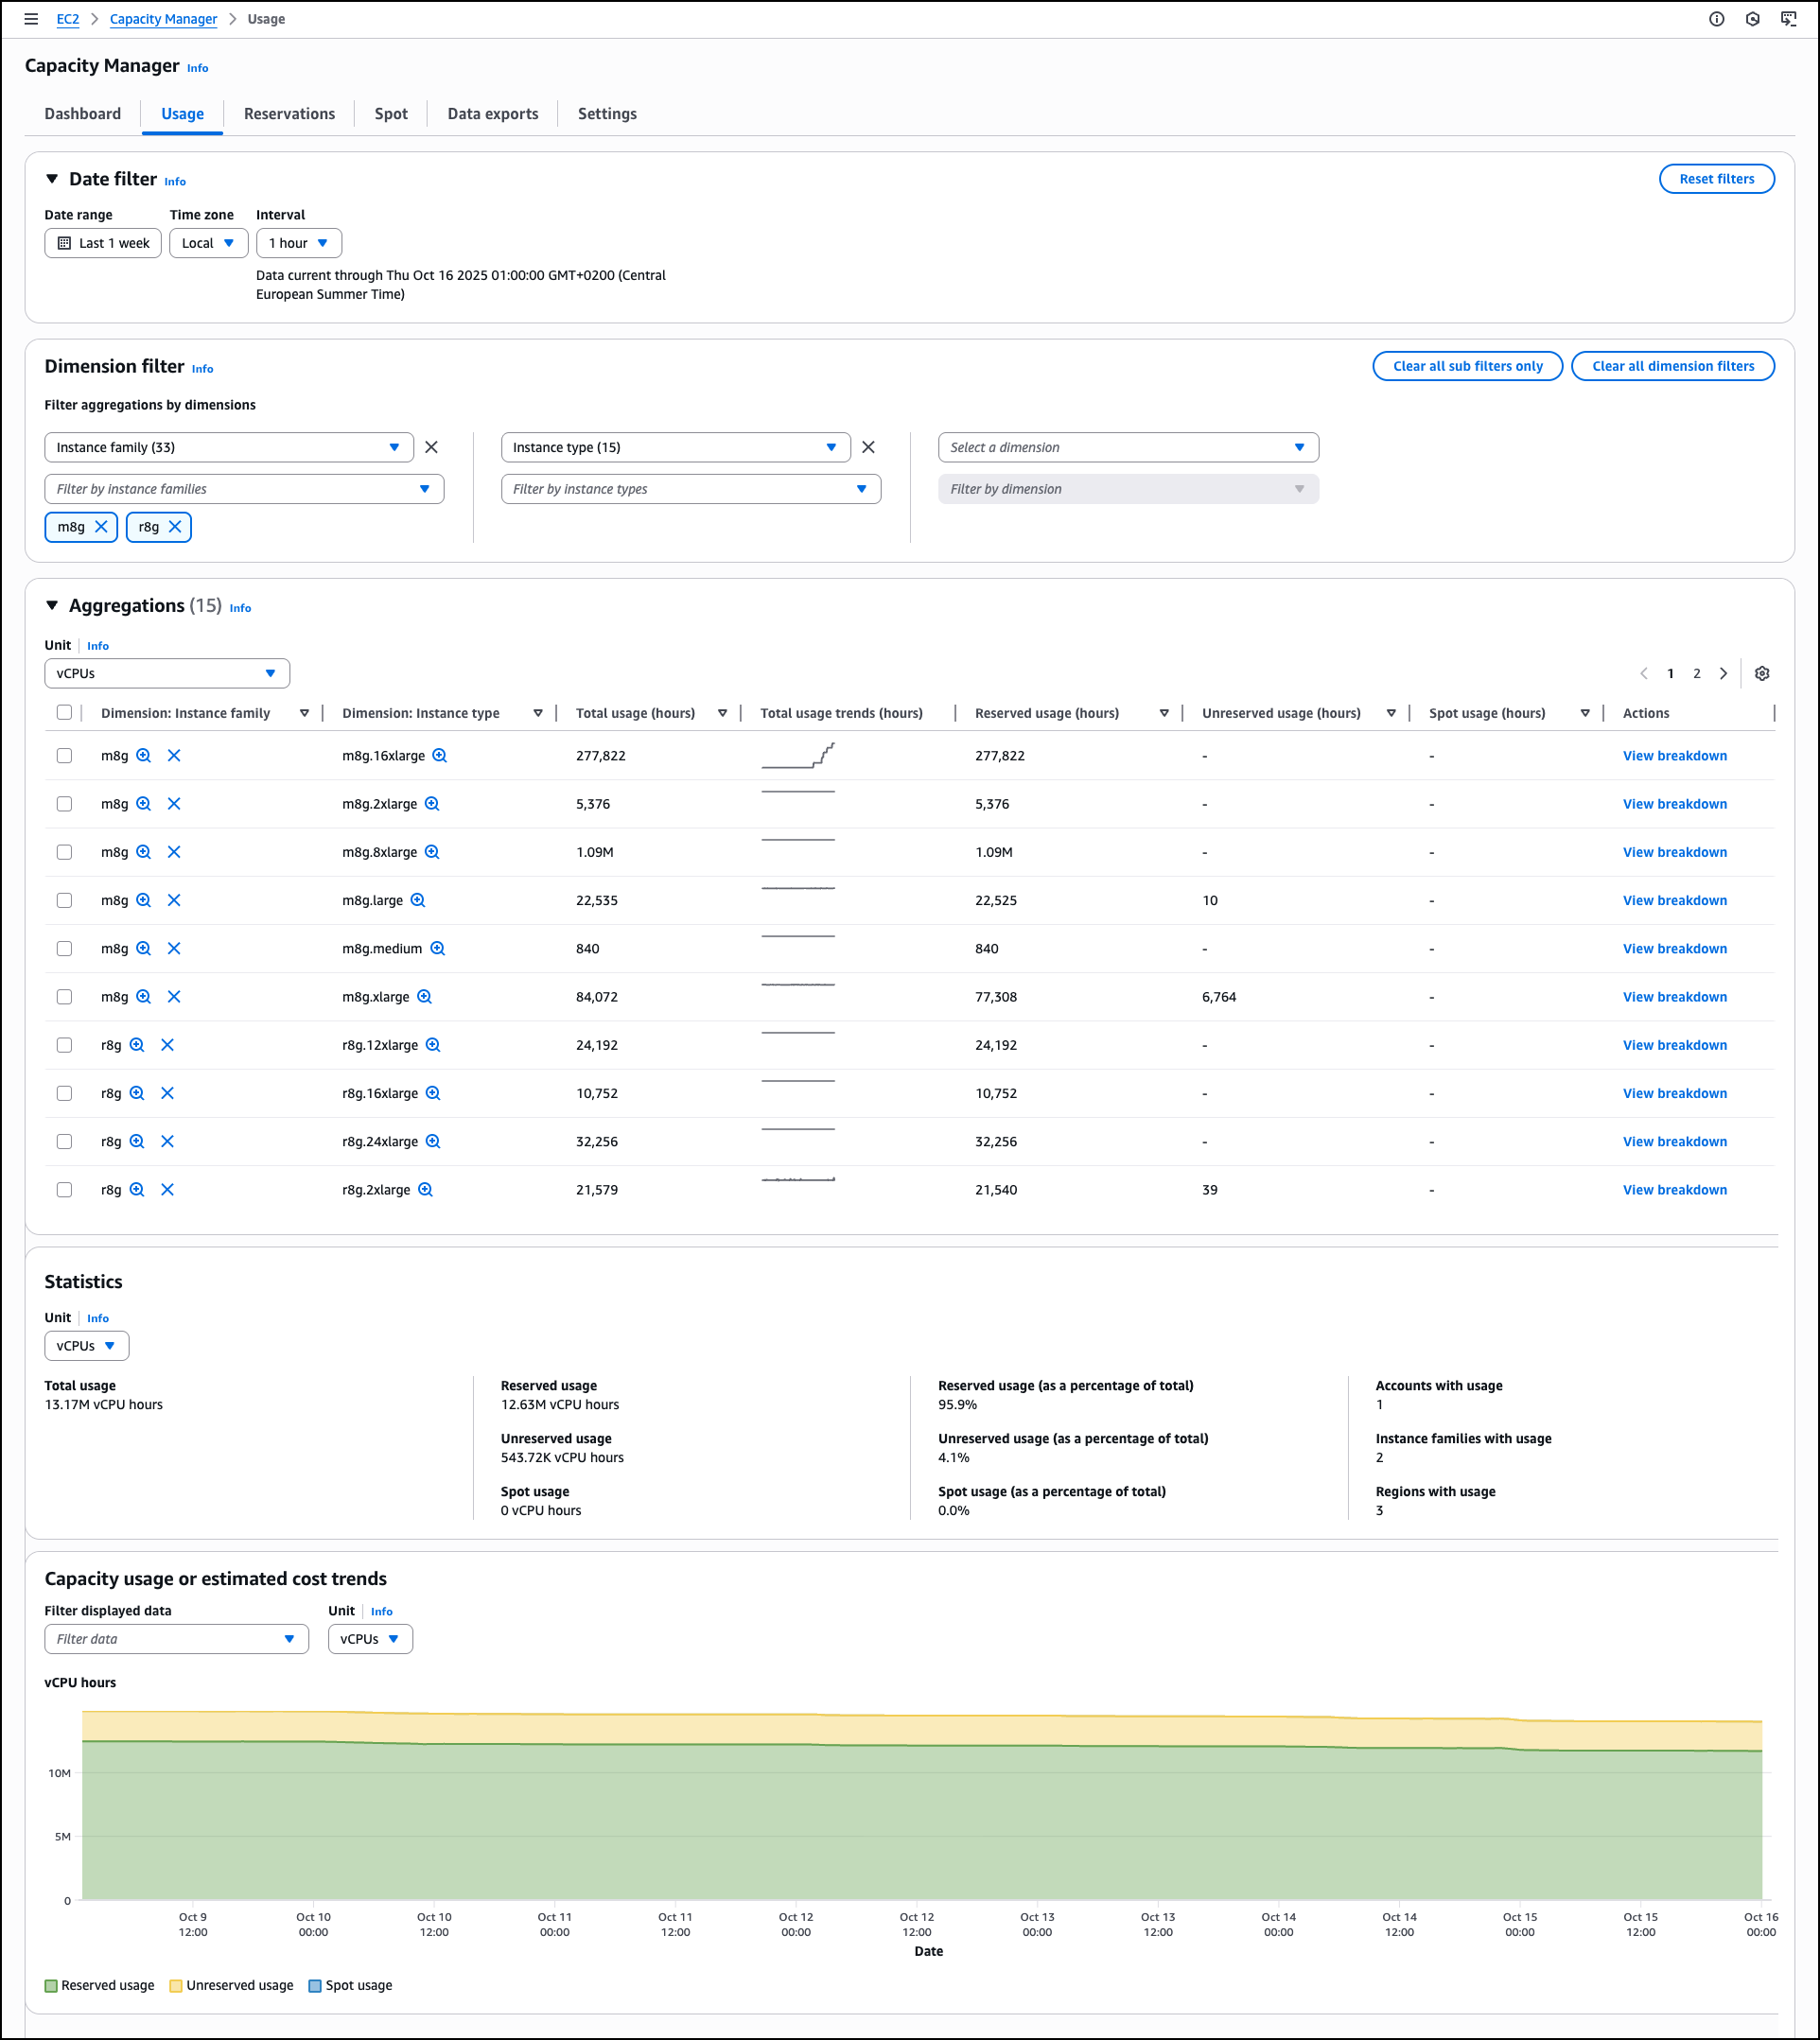
The Usage tab provides detailed historical trends and usage statistics across all AWS Regions for Spot Instances, On-Demand Instances, Capacity Reservations, Reserved Instances, and Savings Plans. Dedicated Hosts usage is not included. The Dimension filter helps you group by and filter capacity data by Account ID, Region, Instance Family, Availability Zone, and Instance Type, creating custom views that reveal usage patterns across your accounts and AWS Organizations. This helps you analyze specific configurations and compare performance across accounts or Regions.
The Aggregations section provides a comprehensive usage table across EC2 and Spot Instances. You can select different units to analyze data by vCPUs, instance counts, or estimated costs to understand resource consumption patterns. The table shows instance family breakdowns with total usage statistics, reserved usage hours, unreserved usage hours, and Spot usage data. Each row includes a View breakdown action for a detailed analysis.
The Capacity usage or estimated cost trends section visualizes usage trends, reserved usage, unreserved usage, and Spot usage. You can filter the displayed data and adjust the unit of measurement to view historical patterns. These filtering and analysis tools help you identify usage trends, compare costs across dimensions, and make informed decisions for capacity planning and optimization.
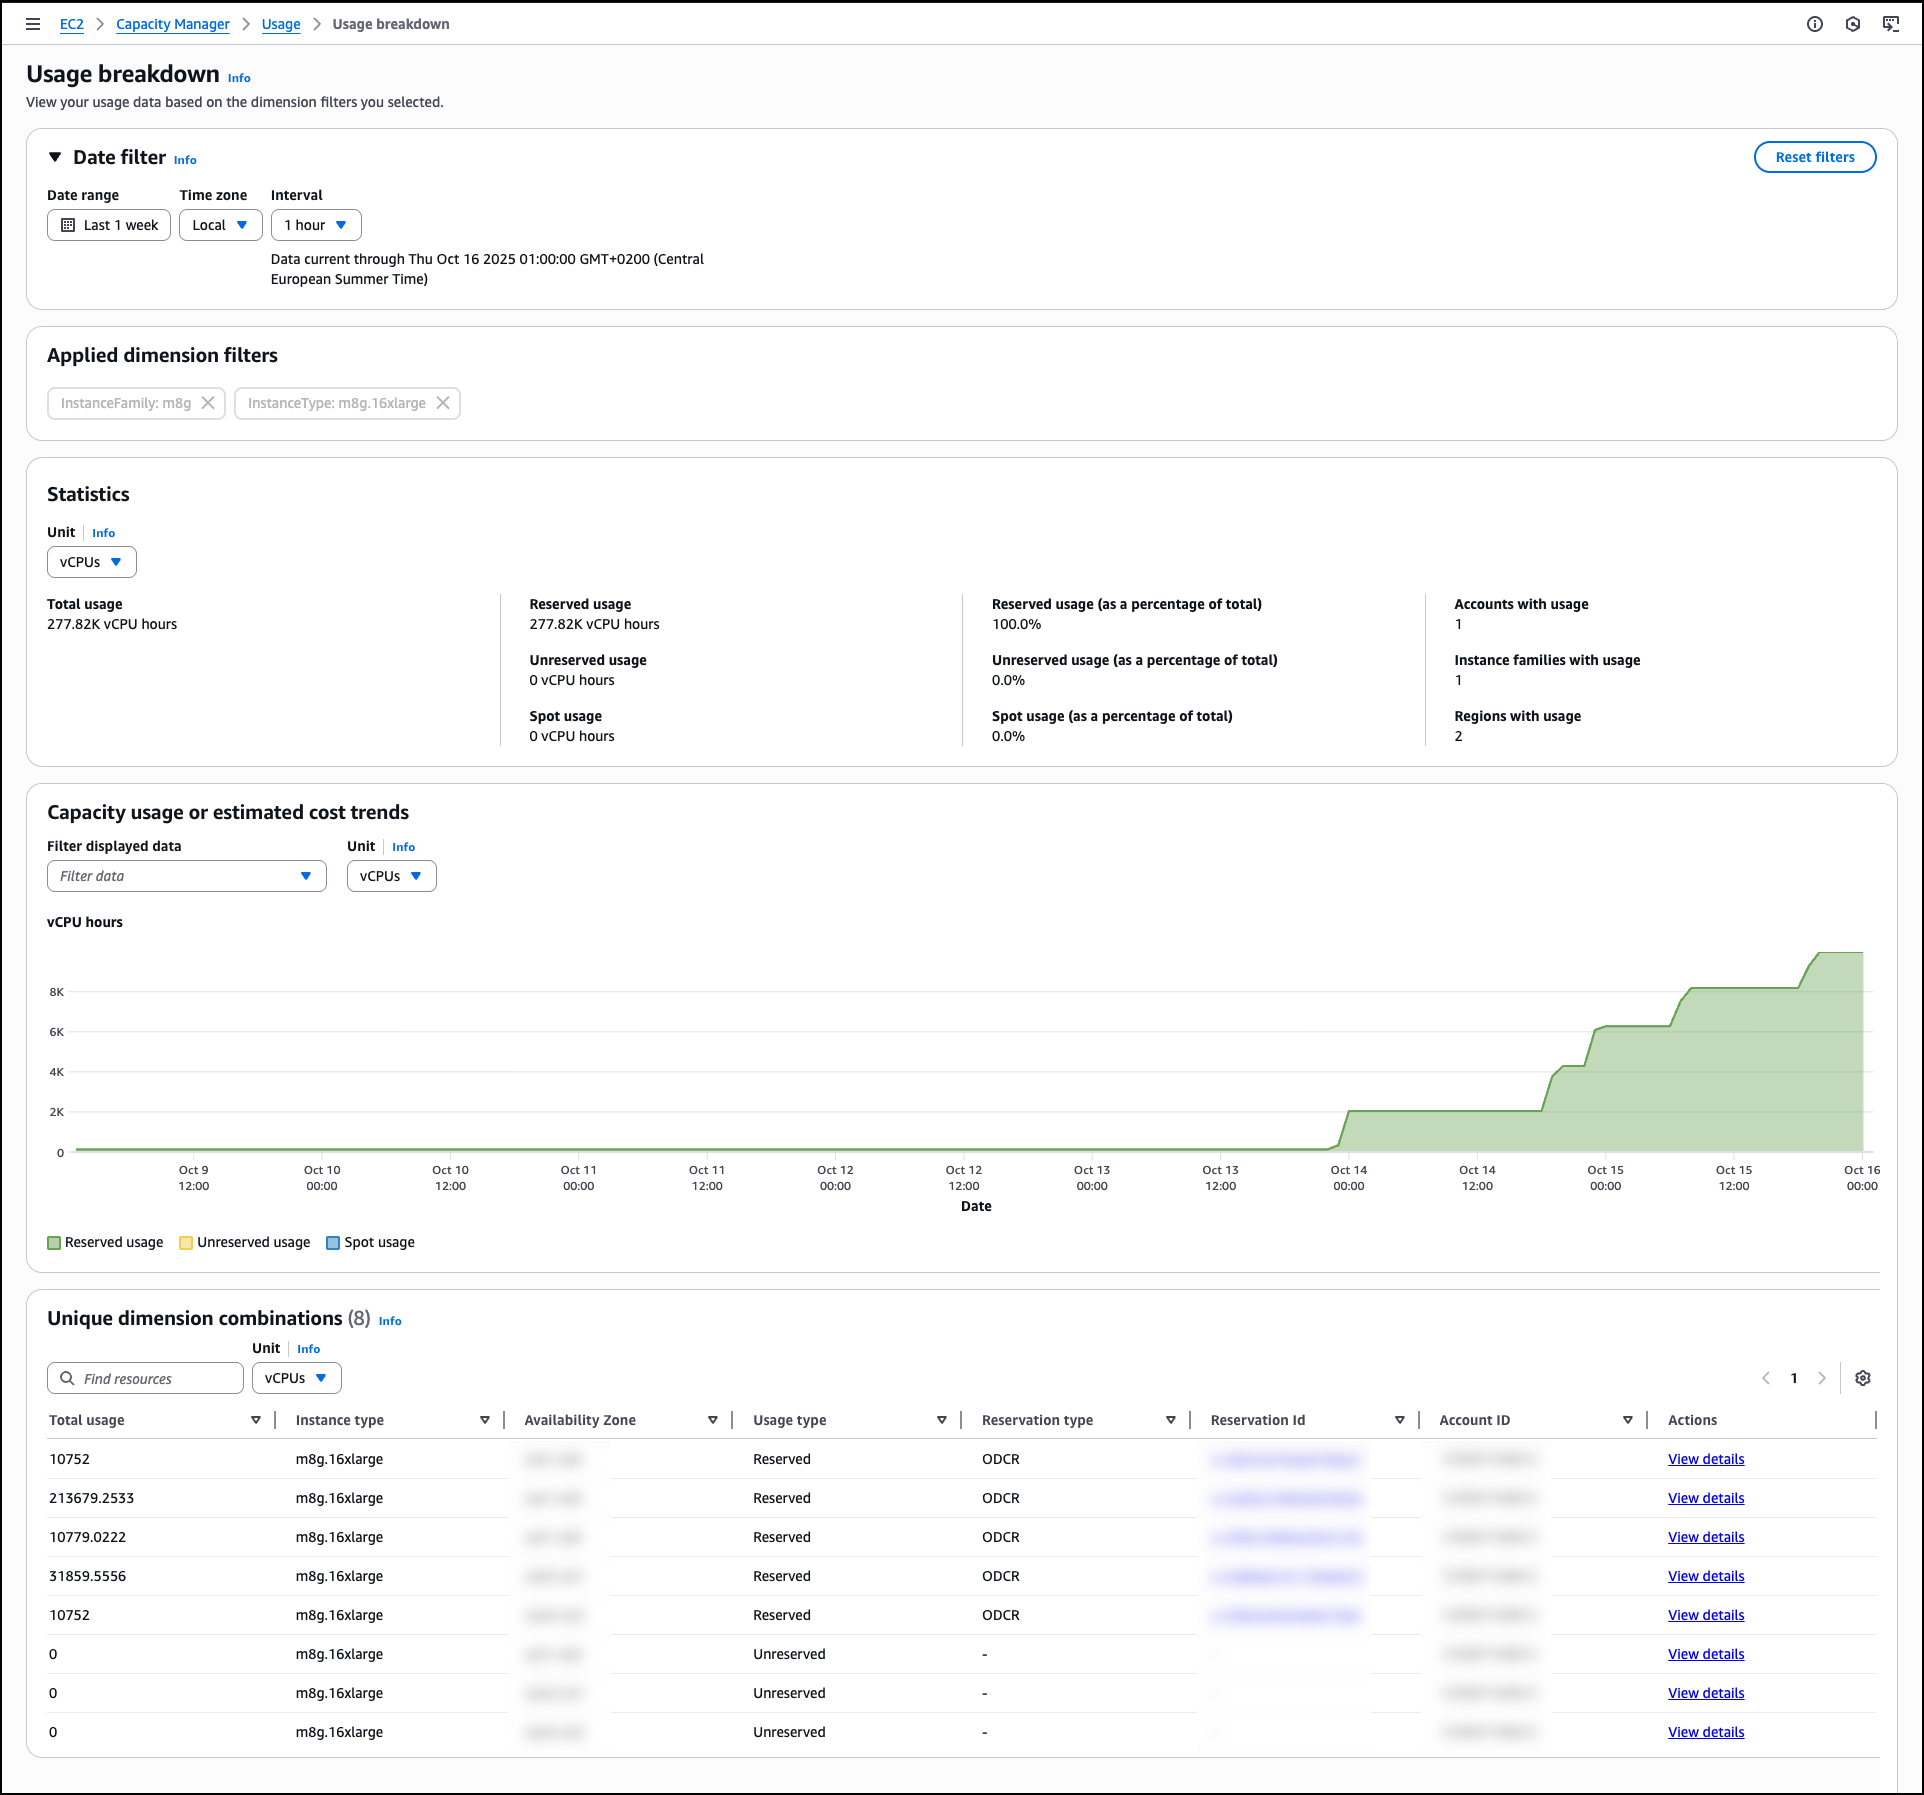
When you choose View breakdown from the Aggregations table, you access detailed Usage breakdown based on the dimension filters you selected. This breakdown view shows usage patterns for individual instance types within the selected family and Availability Zone combinations, helping you identify specific optimization opportunities.
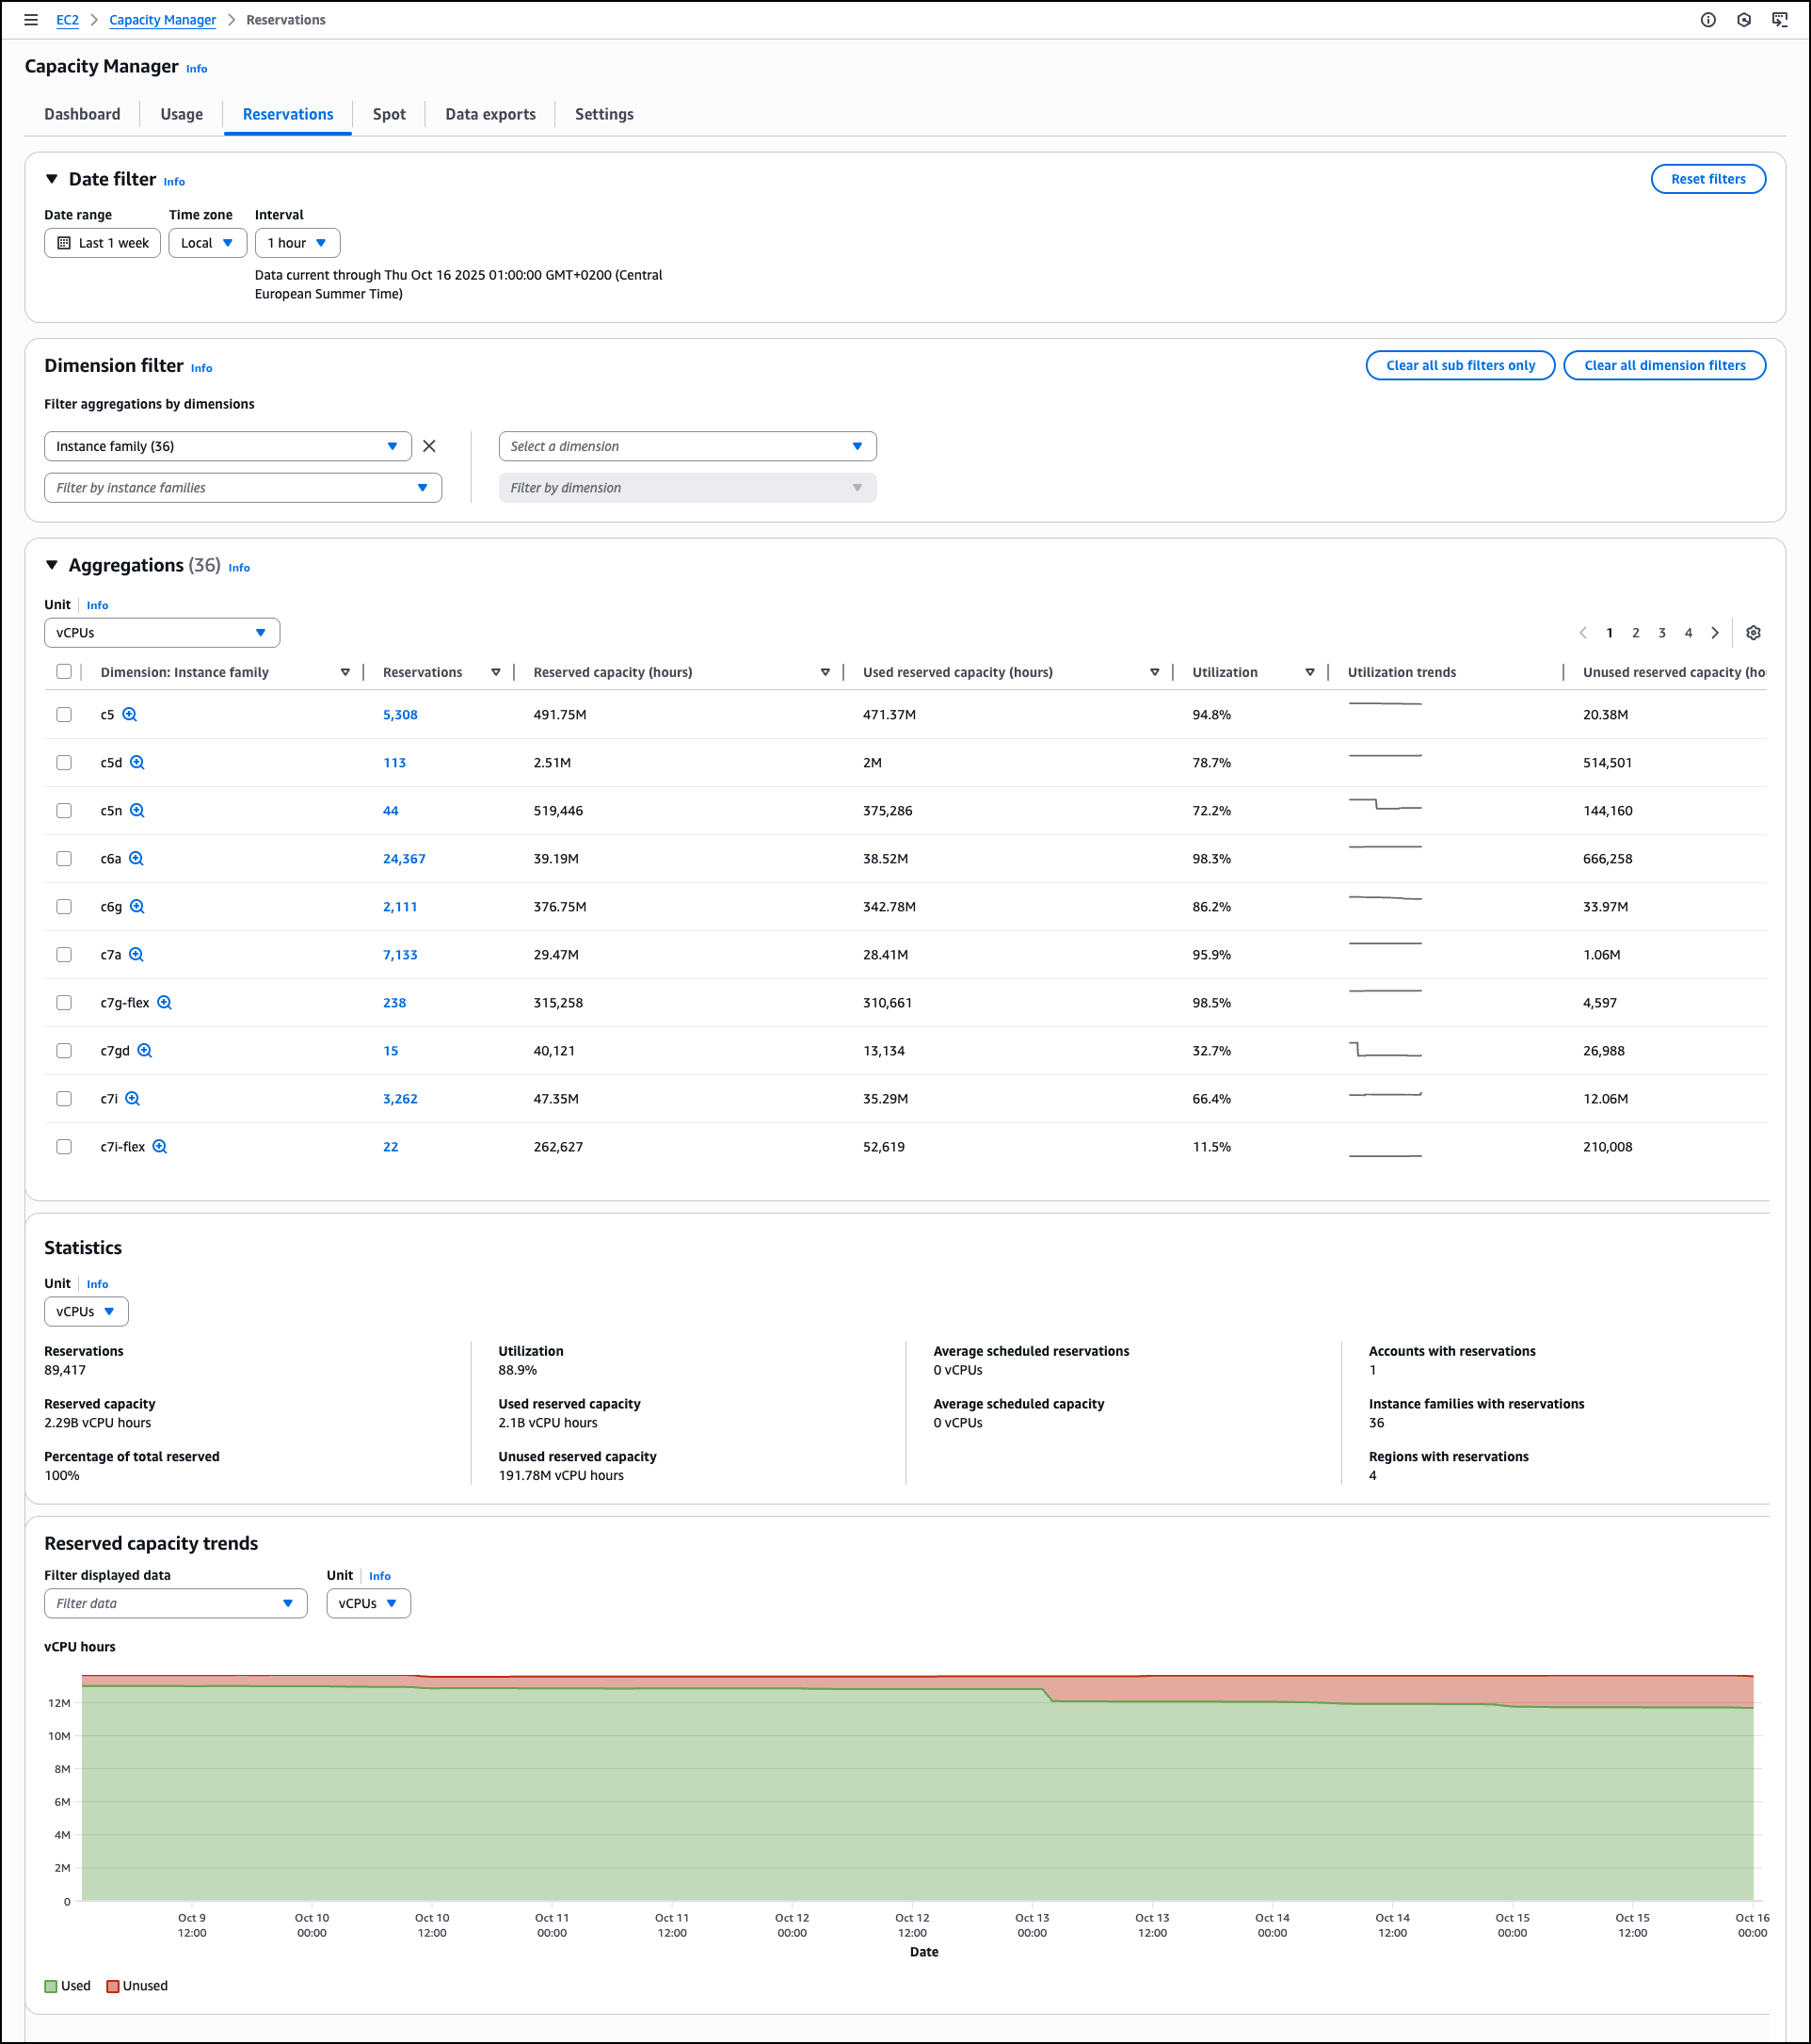
The Reservations tab displays capacity reservation utilization with automated analysis capabilities that generate prioritized lists of optimization opportunities. Similar to the Usage tab, you can apply dimension filters by Account ID, Region, Instance Family, Availability Zone, and Instance Type along with additional options related to the reservation details. On each of the tabs you can drill down to see data for individual line items. For reservations specifically, you can view specific reservations and access detailed information about On-Demand Capacity Reservations (ODCRs), including utilization history, configuration parameters, and current status. When the ODCR exists in the same account as Capacity Manager, you can modify reservation parameters directly from this interface, eliminating the need to navigate to separate EC2 console sections for reservation management.
The Statistics section provides summary metrics, including total reservations count, overall utilization percentage, reserved capacity totals, used and unused capacity volumes, average scheduled reservations, and counts of accounts, instance families, and Regions with reservations.
This consolidated view helps you understand reservation distribution and utilization patterns across your infrastructure. For example, you might discover that your development accounts consistently show 30% reservation utilization while production accounts exceed 95%, indicating an opportunity to redistribute or modify reservations. Similarly, you could identify that specific instance families in certain Regions have sustained low utilization rates, suggesting candidates for reservation adjustments or workload optimization. These insights help you make data-driven decisions about reservation purchases, modifications, or cancellations to better align your reserved capacity with actual usage patterns.
The Spot tab focuses on Spot Instance usage and displays the amount of time your Spot instances run before being interrupted. This analysis of Spot Instance usage patterns helps you identify optimization opportunities for Spot Instance workloads. You can use Spot placement score recommendations to improve workload flexibility.
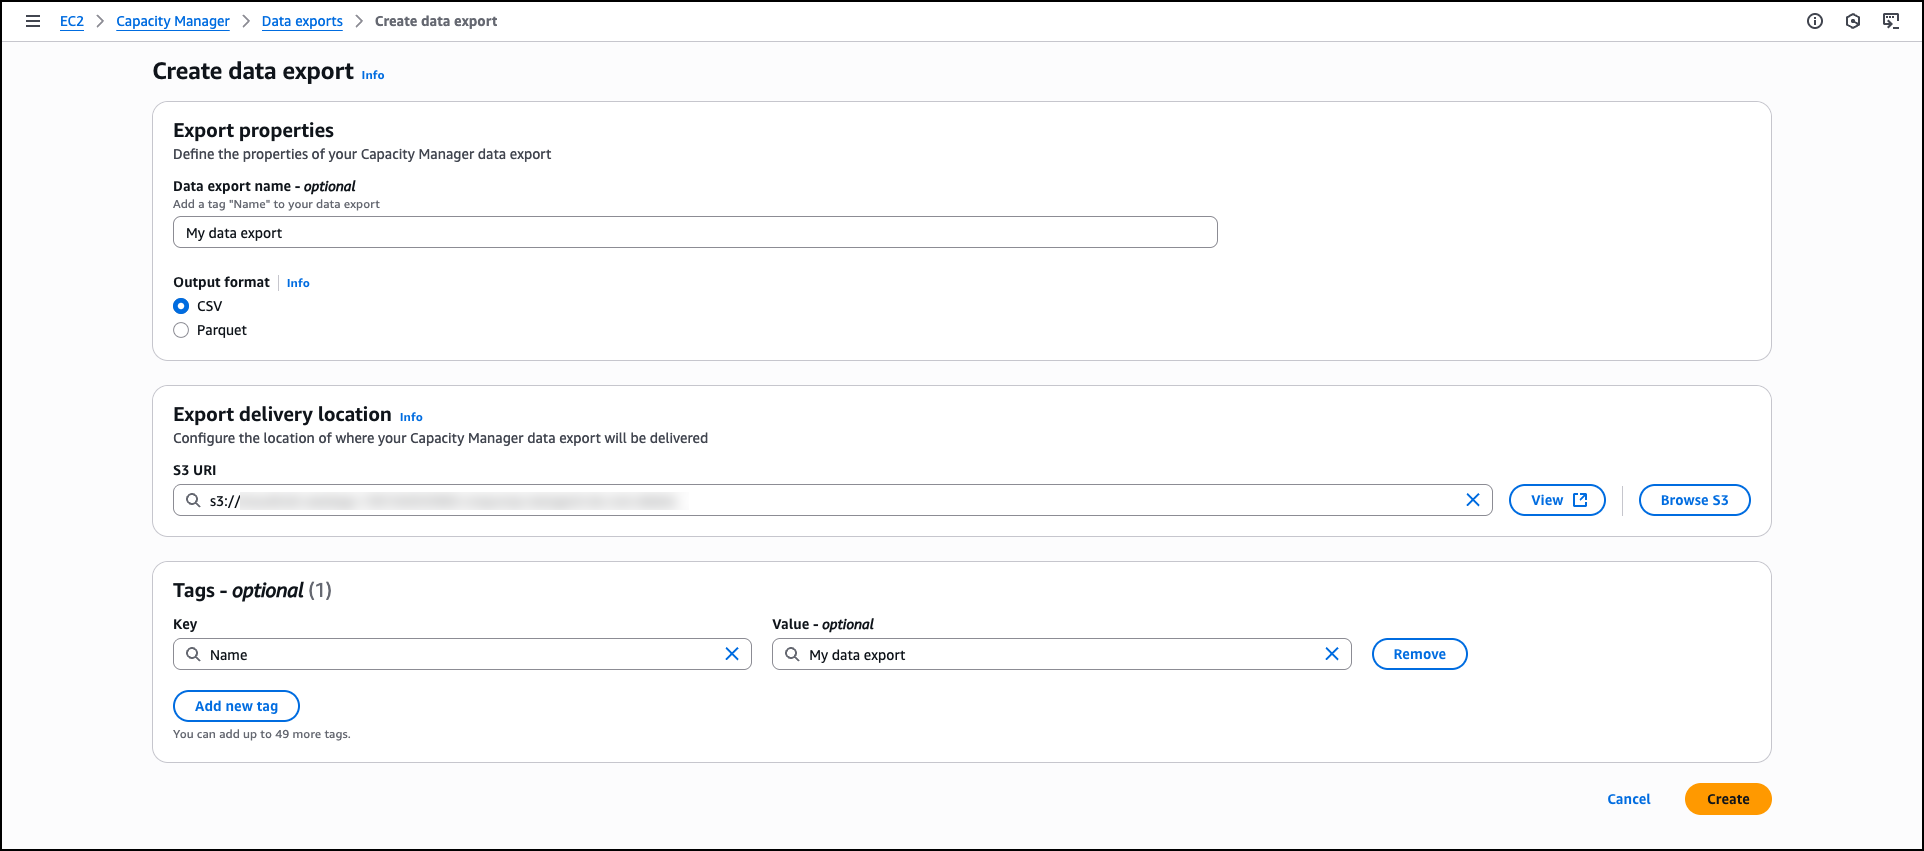
For organizations requiring data export capabilities, Capacity Manager includes data exports to Amazon Simple Storage Service (Amazon S3) buckets for capacity analysis. You can view and manage your data exports through the Data exports tab, which helps you create new exports, monitor delivery status, and configure export schedules to analyze capacity data outside the AWS Management Console.
Data exports extend your analytical capabilities by storing capacity data beyond the 90-day retention period available through the console and APIs. This extended retention enables long-term trend analysis and historical capacity planning. You can also integrate exported data with existing analytics workflows, business intelligence tools, or custom reporting systems to incorporate EC2 capacity metrics into broader infrastructure analysis and decision-making processes.
The Settings section provides configuration options for AWS Organizations integration, enabling centralized capacity management across multiple accounts. Organization administrators can enable enterprise-wide capacity visibility or delegate access to specific accounts while maintaining appropriate permissions and access controls.
Now available EC2 Capacity Manager eliminates the operational overhead of collecting and analyzing capacity data from multiple sources. The service provides automated optimization opportunities, centralized multi-account visibility, and direct access to capacity management tools. You can reduce manual analysis time while improving capacity utilization and cost optimization across your EC2 infrastructure.
Amazon EC2 Capacity Manager is available at no additional cost. To begin using Amazon EC2 Capacity Manager, visit the Amazon EC2 console or access the service APIs. The service is available in all commercial AWS Regions.
There have been many discussions in the free-software community about the
role of large language models (LLMs) in software development. For the most
part, though, those conversations have focused on whether projects should
be accepting code output by those models, and under what conditions. But
there are other ways in which these systems might participate in the
development process. Chris Mason recently started a
discussion on the Kernel Summit discussion list about how these models
can be used to review patches, rather than create them.
Security updates have been issued by AlmaLinux (kernel and libsoup3), Debian (chromium and firefox-esr), Fedora (httpd), Oracle (cups, ImageMagick, kernel, and vim), Red Hat (libssh), Slackware (samba), SUSE (alloy, exim, firefox-esr, ImageMagick, kernel, libcryptopp-devel, libQt6Svg6, libsoup-3_0-0, libtiff-devel-32bit, lsd, python3-gi-docgen, python311-Authlib, qt6-base, samba, and squid), and Ubuntu (ffmpeg, linux-oracle-6.8, redict, redis, samba, and subversion).
Version
13.0 of the Forgejo software forge has been released. Notable
changes in this release include content
moderation features, ability to require
2FA for users or administrators, and a migration
feature for Pagure repositories. The last will be useful for
Fedora’s move
to Forgejo as its new git forge. See the release
notes for all changes in 13.0.
The web is the most powerful application platform in existence. As long as you have the right API, you can safely run anything you want in a browser.
Well… anything but cryptography.
It is as true today as it was in 2011 that Javascript cryptography is Considered Harmful. The main problem is code distribution. Consider an end-to-end-encrypted messaging web application. The application generates cryptographic keys in the client’s browser that lets users view and send end-to-end encrypted messages to each other. If the application is compromised, what would stop the malicious actor from simply modifying their Javascript to exfiltrate messages?
It is interesting to note that smartphone apps don’t have this issue. This is because app stores do a lot of heavy lifting to provide security for the app ecosystem. Specifically, they provide integrity, ensuring that apps being delivered are not tampered with, consistency, ensuring all users get the same app, and transparency, ensuring that the record of versions of an app is truthful and publicly visible.
It would be nice if we could get these properties for our end-to-end encrypted web application, and the web as a whole, without requiring a single central authority like an app store. Further, such a system would benefit all in-browser uses of cryptography, not just end-to-end-encrypted apps. For example, many web-based confidential LLMs, cryptocurrency wallets, and voting systems use in-browser Javascript cryptography for the last step of their verification chains.
In this post, we will provide an early look at such a system, called Web Application Integrity, Consistency, and Transparency (WAICT) that we have helped author. WAICT is a W3C-backed effort among browser vendors, cloud providers, and encrypted communication developers to bring stronger security guarantees to the entire web. We will discuss the problem we need to solve, and build up to a solution resembling the current transparency specification draft. We hope to build even wider consensus on the solution design in the near future.
Defining the Web Application
In order to talk about security guarantees of a web application, it is first necessary to define precisely what the application is. A smartphone application is essentially just a zip file. But a website is made up of interlinked assets, including HTML, Javascript, WASM, and CSS, that can each be locally or externally hosted. Further, if any asset changes, it could drastically change the functioning of the application. A coherent definition of an application thus requires the application to commit to precisely the assets it loads. This is done using integrity features, which we describe now.
Subresource Integrity
An important building block for defining a single coherent application is subresource integrity (SRI). SRI is a feature built into most browsers that permits a website to specify the cryptographic hash of external resources, e.g.,
This causes the browser to fetch underscore.js from cdnjs.cloudflare.com and verify that its SHA-512 hash matches the given hash in the tag. If they match, the script is loaded. If not, an error is thrown and nothing is executed.
If every external script, stylesheet, etc. on a page comes with an SRI integrity attribute, then the whole page is defined by just its HTML. This is close to what we want, but a web application can consist of many pages, and there is no way for a page to enforce the hash of the pages it links to.
Integrity Manifest
We would like to have a way of enforcing integrity on an entire site, i.e., every asset under a domain. For this, WAICT defines an integrity manifest, a configuration file that websites can provide to clients. One important item in the manifest is the asset hashes dictionary, mapping a hash belonging to an asset that the browser might load from that domain, to the path of that asset. Assets that may occur at any path, e.g., an error page, map to the empty string:
The other main component of the manifest is the integrity policy, which tells the browser which data types are being enforced and how strictly. For example, the policy in the manifest below will:
Reject any script before running it, if it’s missing an SRI tag and doesn’t appear in the hashes
Reject any WASM possibly after running it, if it’s missing an SRI tag and doesn’t appear in hashes
Thus, when both SRI and integrity manifests are used, the entire site and its interpretation by the browser is uniquely determined by the hash of the integrity manifest. This is exactly what we wanted. We have distilled the problem of endowing authenticity, consistent distribution, etc. to a web application to one of endowing the same properties to a single hash.
Achieving Transparency
Recall, a transparent web application is one whose code is stored in a publicly accessible, append-only log. This is helpful in two ways: 1) if a user is served malicious code and they learn about it, there is a public record of the code they ran, and so they can prove it to external parties, and 2) if a user is served malicious code and they don’t learn about it, there is still a chance that an external auditor may comb through the historical web application code and find the malicious code anyway. Of course, transparency does not help detect malicious code or even prevent its distribution, but it at least makes it publicly auditable.
Now that we have a single hash that commits to an entire website’s contents, we can talk about ensuring that that hash ends up in a public log. We have several important requirements here:
Do not break existing sites. This one is a given. Whatever system gets deployed, it should not interfere with the correct functioning of existing websites. Participation in transparency should be strictly opt-in.
No added round trips. Transparency should not cause extra network round trips between the client and the server. Otherwise there will be a network latency penalty for users who want transparency.
User privacy. A user should not have to identify themselves to any party more than they already do. That means no connections to new third parties, and no sending identifying information to the website.
User statelessness. A user should not have to store site-specific data. We do not want solutions that rely on storing or gossipping per-site cryptographic information.
Non-centralization. There should not be a single point of failure in the system—if any single party experiences downtime, the system should still be able to make progress. Similarly, there should be no single point of trust—if a user distrusts any single party, the user should still receive all the security benefits of the system.
Ease of opt-in. The barrier of entry for transparency should be as low as possible. A site operator should be able to start logging their site cheaply and without being an expert.
Ease of opt-out. It should be easy for a website to stop participating in transparency. Further, to avoid accidental lock-in like the defunct HPKP spec, it should be possible for this to happen even if all cryptographic material is lost, e.g., in the seizure or selling of a domain.
Opt-out is transparent. As described before, because transparency is optional, it is possible for an attacker to disable the site’s transparency, serve malicious content, then enable transparency again. We must make sure this kind of attack is detectable, i.e., the act of disabling transparency must itself be logged somewhere.
Monitorability. A website operator should be able to efficiently monitor the transparency information being published about their website. In particular, they should not have to run a high-network-load, always-on program just to notify them if their site has been hijacked.
With these requirements in place, we can move on to construction. We introduce a data structure that will be essential to the design.
Hash Chain
Almost everything in transparency is an append-only log, i.e., a data structure that acts like a list and has the ability to produce an inclusion proof, i.e., a proof that an element occurs at a particular index in the list; and a consistency proof, i.e., a proof that a list is an extension of a previous version of the list. A consistency proof between two lists demonstrates that no elements were modified or deleted, only added.
The simplest possible append-only log is a hash chain, a list-like data structure wherein each subsequent element is hashed into the running chain hash. The final chain hash is a succinct representation of the entire list.
A hash chain. The green nodes represent the chain hash, i.e., the hash of the element below it, concatenated with the previous chain hash.
The proof structures are quite simple. To prove inclusion of the element at index i, the prover provides the chain hash before i, and all the elements after i:
Proof of inclusion for the second element in the hash chain. The verifier knows only the final chain hash. It checks equality of the final computed chain hash with the known final chain hash. The light green nodes represent hashes that the verifier computes.
Similarly, to prove consistency between the chains of size i and j, the prover provides the elements between i and j:
Proof of consistency of the chain of size one and chain of size three. The verifier has the chain hashes from the starting and ending chains. It checks equality of the final computed chain hash with the known ending chain hash. The light green nodes represent hashes that the verifier computes.
Building Transparency
We can use hash chains to build a transparency scheme for websites.
Per-Site Logs
As a first step, let’s give every site its own log, instantiated as a hash chain (we will discuss how these all come together into one big log later). The items of the log are just the manifest of the site at a particular point in time:
A site’s hash chain-based log, containing three historical manifests.
In reality, the log does not store the manifest itself, but the manifest hash. Sites designate an asset host that knows how to map hashes to the data they reference. This is a content-addressable storage backend, and can be implemented using strongly cached static hosting solutions.
A log on its own is not very trustworthy. Whoever runs the log can add and remove elements at will and then recompute the hash chain. To maintain the append-only-ness of the chain, we designate a trusted third party, called a witness. Given a hash chain consistency proof and a new chain hash, a witness:
Verifies the consistency proof with respect to its old stored chain hash, and the new provided chain hash.
If successful, signs the new chain hash along with a signature timestamp.
Now, when a user navigates to a website with transparency enabled, the sequence of events is:
The site serves its manifest, an inclusion proof showing that the manifest appears in the log, and all the signatures from all the witnesses who have validated the log chain hash.
The browser verifies the signatures from whichever witnesses it trusts.
The browser verifies the inclusion proof. The manifest must be the newest entry in the chain (we discuss how to serve old manifests later).
The browser proceeds with the usual manifest and SRI integrity checks.
At this point, the user knows that the given manifest has been recorded in a log whose chain hash has been saved by a trustworthy witness, so they can be reasonably sure that the manifest won’t be removed from history. Further, assuming the asset host functions correctly, the user knows that a copy of all the received code is readily available.
The need to signal transparency. The above algorithm works, but we have a problem: if an attacker takes control of a site, they can simply stop serving transparency information and thus implicitly disable transparency without detection. So we need an explicit mechanism that keeps track of every website that has enrolled into transparency.
The Transparency Service
To store all the sites enrolled into transparency, we want a global data structure that maps a site domain to the site log’s chain hash. One efficient way of representing this is a prefix tree (a.k.a., a trie). Every leaf in the tree corresponds to a site’s domain, and its value is the chain hash of that site’s log, the current log size, and the site’s asset host URL. For a site to prove validity of its transparency data, it will have to present an inclusion proof for its leaf. Fortunately, these proofs are efficient for prefix trees.
A prefix tree with four elements. Each leaf’s path corresponds to a domain. Each leaf’s value is the chain hash of its site’s log.
To add itself to the tree, a site proves possession of its domain to the transparency service, i.e., the party that operates the prefix tree, and provides an asset host URL. To update the entry, the site sends the new entry to the transparency service, which will compute the new chain hash. And to unenroll from transparency, the site just requests to have its entry removed from the tree (an adversary can do this too; we discuss how to detect this below).
Proving to Witnesses and Browsers
Now witnesses only need to look at the prefix tree instead of individual site logs, and thus they must verify whole-tree updates. The most important thing to ensure is that every site’s log is append-only. So whenever the tree is updated, it must produce a “proof” containing every new/deleted/modified entry, as well as a consistency proof for each entry showing that the site log corresponding to that entry has been properly appended to. Once the witness has verified this prefix tree update proof, it signs the root.
The sequence of updating a site’s assets and serving the site with transparency enabled.
The client-side verification procedure is as in the previous section, with two modifications:
The client now verifies two inclusion proofs: one for the integrity policy’s membership in the site log, and one for the site log’s membership in a prefix tree.
The client verifies the signature over the prefix tree root, since the witness no longer signs individual chain hashes. As before, the acceptable public keys are whichever witnesses the client trusts.
Signaling transparency. Now that there is a single source of truth, namely the prefix tree, a client can know a site is enrolled in transparency by simply fetching the site’s entry in the tree. This alone would work, but it violates our requirement of “no added round trips,” so we instead require that client browsers will ship with the list of sites included in the prefix tree. We call this the transparency preload list.
If a site appears in the preload list, the browser will expect it to provide an inclusion proof in the prefix tree, or else a proof of non-inclusion in a newer version of the prefix tree, thereby showing they’ve unenrolled. The site must provide one of these proofs until the last preload list it appears in has expired. Finally, even though the preload list is derived from the prefix tree, there is nothing enforcing this relationship. Thus, the preload list should also be published transparently.
Filling in Missing Properties
Remember we still have the requirements of monitorability, opt-out being transparent, and no single point of failure/trust. We fill in those details now.
Adding monitorability. So far, in order for a site operator to ensure their site was not hijacked, they would have to constantly query every transparency service for its domain and verify that it hasn’t been tampered with. This is certainly better than the 500k events per hour that CT monitors have to ingest, but it still requires the monitor to be constantly polling the prefix tree, and it imposes a constant load for the transparency service.
We add a field to the prefix tree leaf structure: the leaf now stores a “created” timestamp, containing the time the leaf was created. Witnesses ensure that the “created” field remains the same over all leaf updates (and it is deleted when the leaf is deleted). To monitor, a site operator need only keep the last observed “created” and “log size” fields of its leaf. If it fetches the latest leaf and sees both unchanged, it knows that no changes occurred since the last check.
Adding transparency of opt-out. We must also do the same thing as above for leaf deletions. When a leaf is deleted, a monitor should be able to learn when the deletion occurred within some reasonable time frame. Thus, rather than outright removing a leaf, the transparency service responds to unenrollment requests by replacing the leaf with a tombstone value, containing just a “created” timestamp. As before, witnesses ensure that this field remains unchanged until the leaf is permanently deleted (after some visibility period) or re-enrolled.
Permitting multiple transparency services. Since we require that there be no single point of failure or trust, we imagine an ecosystem where there are a handful of non-colluding, reasonably trustworthy transparency service providers, each with their own prefix tree. Like Certificate Transparency (CT), this set should not be too large. It must be small enough that reasonable levels of trust can be established, and so that independent auditors can reasonably handle the load of verifying all of them.
Ok that’s the end of the most technical part of this post. We’re now going to talk about how to tweak this system to provide all kinds of additional nice properties.
(Not) Achieving Consistency
Transparency would be useless if, every time a site updates, it serves 100,000 new versions of itself. Any auditor would have to go through every single version of the code in order to ensure no user was targeted with malware. This is bad even if the velocity of versions is lower. If a site publishes just one new version per week, but every version from the past ten years is still servable, then users can still be served extremely old, potentially vulnerable versions of the site, without anyone knowing. Thus, in order to make transparency valuable, we need consistency, the property that every browser sees the same version of the site at a given time.
We will not achieve the strongest version of consistency, but it turns out that weaker notions are sufficient for us. If, unlike the above scenario, a site had 8 valid versions of itself at a given time, then that would be pretty manageable for an auditor. So even though it’s true that users don’t all see the same version of the site, they will all still benefit from transparency, as desired.
We describe two types of inconsistency and how we mitigate them.
Tree Inconsistency
Tree inconsistency occurs when transparency services’ prefix trees disagree on the chain hash of a site, thus disagreeing on the history of the site. One way to fully eliminate this is to establish a consensus mechanism for prefix trees. A simple one is majority voting: if there are five transparency services, a site must present three tree inclusion proofs to a user, showing the chain hash is present in three trees. This, of course, triples the tree inclusion proof size, and lowers the fault tolerance of the entire system (if three log operators go down, then no transparent site can publish any updates).
Instead of consensus, we opt to simply limit the amount of inconsistency by limiting the number of transparency services. In 2025, Chrome trusts eight Certificate Transparency logs. A similar number of transparency services would be fine for our system. Plus, it is still possible to detect and prove the existence of inconsistencies between trees, since roots are signed by witnesses. So if it becomes the norm to use the same version on all trees, then social pressure can be applied when sites violate this.
Temporal Inconsistency
Temporal inconsistency occurs when a user gets a newer or older version of the site (both still unexpired), depending on some external factors such as geographic location or cookie values. In the extreme, as stated above, if a signed prefix root is valid for ten years, then a site can serve a user any version of the site from the last ten years.
As with tree inconsistency, this can be resolved using consensus mechanisms. If, for example, the latest manifest were published on a blockchain, then a user could fetch the latest blockchain head and ensure they got the latest version of the site. However, this incurs an extra network round trip for the client, and requires sites to wait for their hash to get published on-chain before they can update. More importantly, building this kind of consensus mechanism into our specification would drastically increase its complexity. We’re aiming for v1.0 here.
We mitigate temporal inconsistency by requiring reasonably short validity periods for witness signatures. Making prefix root signatures valid for, e.g., one week would drastically limit the number of simultaneously servable versions. The cost is that site operators must now query the transparency service at least once a week for the new signed root and inclusion proof, even if nothing in the site changed. The sites cannot skip this, and the transparency service must be able to handle this load. This parameter must be tuned carefully.
Beyond Integrity, Consistency, and Transparency
Providing integrity, consistency, and transparency is already a huge endeavor, but there are some additional app store-like security features that can be integrated into this system without too much work.
Code Signing
One problem that WAICT doesn’t solve is that of provenance: where did the code the user is running come from, precisely? In settings where audits of code happen frequently, this is not so important, because some third party will be reading the code regardless. But for smaller self-hosted deployments of open-source software, this may not be viable. For example, if Alice hosts her own version of Cryptpad for her friend Bob, how can Bob be sure the code matches the real code in Cryptpad’s Github repo?
WEBCAT. The folks at the Freedom of Press Foundation (FPF) have built a solution to this, called WEBCAT. This protocol allows site owners to announce the identities of the developers that have signed the site’s integrity manifest, i.e., have signed all the code and other assets that the site is serving to the user. Users with the WEBCAT plugin can then see the developer’s Sigstore signatures, and trust the code based on that.
We’ve made WAICT extensible enough to fit WEBCAT inside and benefit from the transparency components. Concretely, we permit manifests to hold additional metadata, which we call extensions. In this case, the extension holds a list of developers’ Sigstore identities. To be useful, browsers must expose an API for browser plugins to access these extension values. With this API, independent parties can build plugins for whatever feature they wish to layer on top of WAICT.
Cooldown
So far we have not built anything that can prevent attacks in the moment. An attacker who breaks into a website can still delete any code-signing extensions, or just unenroll the site from transparency entirely, and continue with their attack as normal. The unenrollment will be logged, but the malicious code will not be, and by the time anyone sees the unenrollment, it may be too late.
To prevent spontaneous unenrollment, we can enforce unenrollment cooldown client-side. Suppose the cooldown period is 24 hours. Then the rule is: if a site appears on the preload list, then the client will require that either 1) the site have transparency enabled, or 2) the site have a tombstone entry that is at least 24 hours old. Thus, an attacker will be forced to either serve a transparency-enabled version of the site, or serve a broken site for 24 hours.
Similarly, to prevent spontaneous extension modifications, we can enforce extension cooldown on the client. We will take code signing as an example, saying that any change in developer identities requires a 24 hour waiting period to be accepted. First, we require that extension dev-ids has a preload list of its own, letting the client know which sites have opted into code signing (if a preload list doesn’t exist then any site can delete the extension at any time). The client rule is as follows: if the site appears in the preload list, then both 1) dev-ids must exist as an extension in the manifest, and 2) dev-ids-inclusion must contain an inclusion proof showing that the current value of dev-ids was in a prefix tree that is at least 24 hours old. With this rule, a client will reject values of dev-ids that are newer than a day. If a site wants to delete dev-ids, they must 1) request that it be removed from the preload list, and 2) in the meantime, replace the dev-ids value with the empty string and update dev-ids-inclusion to reflect the new value.
Deployment Considerations
There are a lot of distinct roles in this ecosystem. Let’s sketch out the trust and resource requirements for each role.
Transparency service. These parties store metadata for every transparency-enabled site on the web. If there are 100 million domains, and each entry is 256B each (a few hashes, plus a URL), this comes out to 26GB for a single tree, not including the intermediate hashes. To prevent size blowup, there would probably have to be a pruning rule that unenrolls sites after a long inactivity period. Transparency services should have largely uncorrelated downtime, since, if all services go down, no transparency-enabled site can make any updates. Thus, transparency services must have a moderate amount of storage, be relatively highly available, and have downtime periods uncorrelated with each other.
Transparency services require some trust, but their behavior is narrowly constrained by witnesses. Theoretically, a service can replace any leaf’s chain hash with its own, and the witness will validate it (as long as the consistency proof is valid). But such changes are detectable by anyone that monitors that leaf.
Witness. These parties verify prefix tree updates and sign the resulting roots. Their storage costs are similar to that of a transparency service, since they must keep a full copy of a prefix tree for every transparency service they witness. Also like the transparency services, they must have high uptime. Witnesses must also be trusted to keep their signing key secret for a long period of time, at least long enough to permit browser trust stores to be updated when a new key is created.
Asset host. These parties carry little trust. They cannot serve bad data, since any query response is hashed and compared to a known hash. The only malicious behavior an asset host can do is refuse to respond to queries. Asset hosts can also do this by accident due to downtime.
Client. This is the most trust-sensitive part. The client is the software that performs all the transparency and integrity checks. This is, of course, the web browser itself. We must trust this.
We at Cloudflare would like to contribute what we can to this ecosystem. It should be possible to run both a transparency service and a witness. Of course, our witness should not monitor our own transparency service. Rather, we can witness other organizations’ transparency services, and our transparency service can be witnessed by other organizations.
Supporting Alternate Ecosystems
WAICT should be compatible with non-standard ecosystems, ones where the large players do not really exist, or at least not in the way they usually do. We are working with the FPF on defining transparency for alternate ecosystems with different network and trust environments. The primary example we have is that of the Tor ecosystem.
A paranoid Tor user may not trust existing transparency services or witnesses, and there might not be any other trusted party with the resources to self-host these functionalities. For this use case, it may be reasonable to put the prefix tree on a blockchain somewhere. This makes the usual domain validation impossible (there’s no validator server to speak of), but this is fine for onion services. Since an onion address is just a public key, a signature is sufficient to prove ownership of the domain.
One consequence of a consensus-backed prefix tree is that witnesses are now unnecessary, and there is only need for the single, canonical, transparency service. This mostly solves the problems of tree inconsistency at the expense of latency of updates.
Next Steps
We are still very early in the standardization process. One of the more immediate next steps is to get subresource integrity working for more data types, particularly WASM and images. After that, we can begin standardizing the integrity manifest format. And then after that we can start standardizing all the other features. We intend to work on this specification hand-in-hand with browsers and the IETF, and we hope to have some exciting betas soon.
In the meantime, you can follow along with our transparency specification draft, check out the open problems, and share your ideas. Pull requests and issues are always welcome!
Acknowledgements
Many thanks to Dennis Jackson from Mozilla for the lengthy back-and-forth meetings on design, to Giulio B and Cory Myers from FPF for their immensely helpful influence and feedback, and to Richard Hansen for great feedback.
CNN has a great piece about how cryptocurrency ATMs are used to scam people out of their money. The fees are usurious, and they’re a common place for scammers to send victims to buy cryptocurrency for them. The companies behind the ATMs, at best, do not care about the harm they cause; the profits are just too good.
The collective thoughts of the interwebz
Manage Consent
To provide the best experiences, we use technologies like cookies to store and/or access device information. Consenting to these technologies will allow us to process data such as browsing behavior or unique IDs on this site. Not consenting or withdrawing consent, may adversely affect certain features and functions.
Functional
Always active
The technical storage or access is strictly necessary for the legitimate purpose of enabling the use of a specific service explicitly requested by the subscriber or user, or for the sole purpose of carrying out the transmission of a communication over an electronic communications network.
Preferences
The technical storage or access is necessary for the legitimate purpose of storing preferences that are not requested by the subscriber or user.
Statistics
The technical storage or access that is used exclusively for statistical purposes.The technical storage or access that is used exclusively for anonymous statistical purposes. Without a subpoena, voluntary compliance on the part of your Internet Service Provider, or additional records from a third party, information stored or retrieved for this purpose alone cannot usually be used to identify you.
Marketing
The technical storage or access is required to create user profiles to send advertising, or to track the user on a website or across several websites for similar marketing purposes.