We take a look at the GL.iNet Comet GL-RM1PE, a little PoE-powered box that lets you easily remotely manage systems as if you were sitting next to them
Since launching during Birthday Week in 2020, Radar has announced significant new capabilities and data sets during subsequent Birthday Weeks. We continue that tradition this year with a two-part launch, adding more dimensions to Radar’s ability to slice and dice the Internet.
First, we’re adding regional traffic insights. Regional traffic insights bring a more localized perspective to the traffic trends shown on Radar.
Both features extend Radar’s mission of providing deeper, more granular visibility into the health and security of the Internet. Below, we dig into these new capabilities and data sets.
Introducing regional Internet traffic insights on Radar
However, sometimes Internet usage shifts on a more local level — maybe a sporting event in a particular region drives people online to find out more information. Or maybe a storm or other natural disaster causes infrastructure damage and power outages in a given state, impacting Internet traffic.
For the last few years, the Radar team relied on internal data sets and Jupyter notebooks to visualize these “sub-national” traffic shifts. But today, we are bringing that insight to Cloudflare Radar, and to you, with the launch of regional traffic insights. With this new capability, you’ll be able to see traffic trends at a more local level, including bytes and requests, as well as breakouts of desktop/mobile device and bot/human traffic shares. And for even more granular visibility, within the Data Explorer, you’ll also be able to select an autonomous system to join with the regional selection — for example, looking at AS7922 (Comcast) in Massachusetts (United States).
Geographic guidance
In line with common industry practice, the region names displayed on Radar are sourced in data from GeoNames (geonames.org), a crowdsourced geographical database. Specifically, we are using the “first-order administrative divisions” listed for each country — for example, the states of America, the departments of Honduras, or the provinces of Canada. Those geographical names reflect data provided by GeoNames; for more information, please refer to their About page.
Requests logged by Cloudflare’s services include the IP address of the device making the request. The address range (“prefix”) that includes this address is associated with a GeoNames ID within our IP address geolocation data, and we then match that GeoNames ID with the associated country and “first order administrative division” found in the GeoNames dataset. (For example: 155.246.1.142 → 155.246.0.0/16 → GeoNames ID 5101760 → United States > New Jersey)
Drilling down into Radar traffic data
Within Cloudflare Radar, there are several ways to get to this regional data. If you know the name of the region of interest, you can type it into the search bar at the top of the page, and select it from the results. For example, beginning to type Massachusetts returns the U.S. state, linked to its regional traffic page. Typing the region name into the Traffic in dropdown at the top of a Traffic page will also return the same set of results.
Radar’s country-level pages now have a new Traffic characteristics by region card that includes both summary and time series views of regional traffic. The summary view is presented as a map and table, similar to the Traffic characteristics card in the Worldwide traffic view. After selecting a metric from the dropdown at the top right of the card, the table and map are updated to reflect the relevant summary values for the chosen time period. Within the paginated table, the region names are linked, and clicking one will take you to the relevant page. Within the map, the summary values are represented by circles placed in the centroid of each region, sized in relation to their value. Clicking a circle will take you to the relevant page.
Below the summary map and table, the card also includes a time series graph of traffic at a regional level for the top five highest traffic regions within the country. These graphs can reveal interesting regional differences in traffic patterns. For example, the Traffic volume by region in Iraq graph for HTTP request traffic shown below highlights the differing Internet shutdown schedules (Kurdistan Region, central and southern Iraq) across the different governorates. On days when the schedules do not overlap, such as September 2 and 7, traffic from the Erbil and Sulaymaniyah governorates, which are located in the Kurdistan Region, does not drop concurrent with the loss in traffic observed in Baghdad and Basra.
Mobile vs. desktop device traffic trends
Over the past several years, a number of Radar blog posts have explored how human activity impacts Internet traffic, including holiday celebrations, elections, and the Paris 2024 Summer Olympics. With the new regional views, this impact now becomes even clearer at a more local level. For instance, mobile devices account for, on average, just over half of the request traffic seen from Nairobi Country in Kenya. A clear diurnal pattern is seen on weekdays, where mobile device usage drops during workday hours, and then rises again in the evening. However, during the weekends, mobile traffic remains elevated, presumably due to fewer people using desktop computers in office environments, as well as fewer desktop computers in use at home, in line with Kenya’s mobile-first culture.
Bot vs human traffic trends
Similar to how the mobile vs. desktop view exposes shifts in human activity, bot vs. human traffic insights do as well. One interpretation of the graph below is that overnight bot activity from Lisbon increased significantly during the first few days of September. However, since the graph shows traffic shares, and given the timing of the apparent increases, the more likely cause is increasingly larger drops in human-driven traffic – users in Lisbon appear to begin logging off around 23:00 UTC (midnight local time), and start getting back online around 05:00 UTC (06:00 local time). The shares and shifts will obviously vary by country and region, but they can provide a perspective on the nocturnal habits of users in a region.
Customize regional analysis with Radar’s Data Explorer
Within the Data Explorer, you can use the breakdown options and filters to customize your analysis of regional traffic data.
At a country level, choosing to breakdown by regions generates a stacked area graph that shows the relative traffic shares of the top 20 regions in the selected country, along with a bar graph showing summary share values. For example, the graph below shows that in aggregate, Virginia and California are responsible for just over a quarter of the HTTP request volume in the United States.
You can also use Data Explorer to drill down on traffic at a network (ASN) level in a given region, in both summary and timeseries views. For example, looking at HTTP request traffic for Massachusetts by ASN, we can see that AS7922 (Comcast), accounts for a third, followed by AS701 (Verizon Fios, 15%), AS21928 (T-Mobile, 8.8%), AS6167 (Verizon Wireless, 5.1%), AS7018 (AT&T, 4.7%), and AS20115 (Charter/Spectrum, 4.5%). Over 70% of the request traffic is concentrated in these six providers, with nearly half of that from one provider.
Going a level deeper, you can also look at traffic trends over time for an ASN within a given region, and even compare it with another time period. The graph below shows traffic for AS7922 (Comcast) in Massachusetts over a seven-day period, compared with the prior week. While the traffic volumes on most days were largely in line with the previous week, Saturday and Sunday were noticeably higher. These differences may reflect a shift in human activity, as September 6 & 7 were quite rainy in Massachusetts, so people may have spent more time indoors and online. (The prior weekend was Labor Day weekend, but those Saturday and Sunday traffic levels were in line with the preceding weekend.) You can also add another ASN to the traffic trends comparison. Selecting Massachusetts (Location) and AS701 (ASN) (Verizon Fios) in the Compare section finds that traffic on that network was higher on Saturday and Sunday as well, lending credence to the rainy weekend theory.
Regional comparisons, whether within the same country or across different countries, are also possible in Data Explorer. For instance, if the Kansas City Chiefs and Philadelphia Eagles were to meet yet again in the Super Bowl, the configuration below could be used to compare traffic patterns in the teams’ respective home states, as well as comparing the trends with the previous week, showing how human activity impacted it over the course of the game.
As always, the data powering the visualizations described above are also available through the Radar API. The timeseries_groups and summary methods for the NetFlows and HTTP endpoints now have an ADM1 dimension, allowing traffic to be broken down by first-order administrative divisions. In addition, the new geoId filter for the NetFlows and HTTP endpoints allows you to filter the results by a specific geolocation, using its GeoNames ID. And finally, there are new get and list endpoints for fetching geolocation details.
A note regarding data quantity and quality
As you’d expect, the more traffic we see from a given geography, the better the “signal”, and the clearer the associated graph is — this is generally the case when traffic is aggregated at a country level. However, for some smaller or less populous regions, especially in developing countries or countries with poor Internet connectivity, lower traffic will likely cause the signal to be weaker, resulting in graphs that appear spiky or incomplete. (Note that this will also be true for region+ASN views.) An illustrative example is shown below, for Northern Darfur State in Sudan. Traffic is observed somewhat inconsistently, resulting in the spikes seen in the graph. Similarly, the “Previous 7 days” line is largely incomplete, indicating a lack of traffic data for that period. In these cases, it will be hard to draw definitive conclusions from such graphs.
Although the Internet arguably transcends geographical boundaries, the reality is that usage patterns can vary by location, with traffic trends that reflect more localized human activity. The new regional insights on Cloudflare Radar traffic pages, and in the Data Explorer, provide a perspective at a sub-national level. We are exploring the potential to go a level deeper in the future, providing traffic data for “second-order administrative divisions” (such as counties, cities, etc.).
If you share our regional traffic graphs on social media, be sure to tag us: @CloudflareRadar (X), noc.social/@cloudflareradar (Mastodon), and radar.cloudflare.com (Bluesky). If you have questions or comments, you can reach out to us on social media, or contact us via email.
Introducing Certificate Transparency insights on Radar
Just as we’re bringing more granular detail to traffic patterns, we’re also shedding more light on the very foundation of trust on the Internet: TLS certificates. Certificate Authorities (CAs) serve as trusted gatekeepers for the Internet: any website that wants to prove its identity to clients must present a certificate issued by a CA that the client trusts. But how do we know that CAs themselves are trustworthy and only issue certificates they are authorized to issue?
That’s where Certificate Transparency (CT) comes in. Clients that enforce CT (most major browsers) will only trust a website certificate if it is both signed by a trusted CA and has proof that the certificate has been added to a public, append-only CT log, so that it can be publicly audited. Only recently, CT played a key role in detecting the unauthorized issuance of certificates for 1.1.1.1, a public DNS resolver service that Cloudflare operates.
In addition to its role as a vital safety mechanism for the Internet, CT has proven to be invaluable in other ways, as it provides publicly-accessible lists of all website certificates used on the Internet. This dataset is a treasure trove of intelligence for researchers measuring the Internet, security teams detecting malicious activity like phishing campaigns, or penetration testers mapping a target’s external attack surface.
The sheer amount of data (multiple terabytes) available in CT makes it difficult for regular Internet users to download and explore themselves. Instead, services like crt.sh, Censys, and Merklemap provide easy search interfaces to allow discoverability for specific domain names and certificates. We launchedMerkle Town in 2018 to share broad insights into the CT ecosystem using data from our own CT monitoring service.
Certificate Transparency on Cloudflare Radar is the next evolution of Merkle Town, providing integration with security and domain information already on Radar and more interactive ways to explore and analyze CT data. (For long-time Merkle Town users, we’re keeping it around until we’ve reached full feature parity.)
In the sections below, we’ll walk you through the features available in the new dashboard.
Certificate volume and characteristics
The CT page leads with a view of how many certificates are being issued and logged over time. Because the same certificate can appear multiple times within a single log or be submitted to several logs, the total count can be inflated. To address this, two distinct lines are shown: one for total entries and another for unique entries. Uniqueness, however, is calculated only within the selected time range — for example, if certificate C is added to log A in one period and to log B in another, it will appear in the unique count for both periods. It is also important to note that the CT charts and date filters use the log timestamp, which is the time a certificate was added to a CT log. Additionally, the data displayed on the page was collected from the logs monitored by Cloudflare — delays, backlogs, or other inconsistencies may exist, so please report any issues or discrepancies.
Alongside this chart is a comparison between certificates and pre-certificates. A pre-certificate is a special type of certificate used in CT that allows a CA to publicly log a certificate before it is officially issued. CAs are not required to log full certificates if corresponding pre-certificates have already been logged (although many CAs do anyway), so typically there are more pre-certificates logged than full certificates, as seen in the chart.
While certificate issuance trends are interesting on their own, analyzing the characteristics of issued certificates provides deeper insight into the state of the web’s trust infrastructure. Starting with the public key algorithm, which defines how secure connections are established between clients and servers, we found that more than 65% of certificates still use RSA, while the remainder use ECDSA. RSA remains dominant due to its long-standing compatibility with a wide range of clients, while ECDSA is increasingly adopted for its efficiency and smaller key sizes, which can improve performance and reduce computational overhead. In the coming years, we expect post-quantum signature algorithms like ML-DSA to appear when public CAs begin to offer support.
Next, a breakdown of certificates by signature algorithm reveals how Certificate Authorities (CAs) sign the certificates they issue. Most certificates (over 65%) use RSA with SHA-256, followed by ECDSA with SHA-384 at 19%, ECDSA with SHA-256 at 12%, and a small fraction using other algorithms. The choice of signature algorithm reflects a balance between widespread support, security, and performance, with stronger algorithms like ECDSA gradually gaining traction for modern deployments.
Certificates are also categorized by validation level, which reflects the degree to which the CA has verified the identity of the certificate requester. The main validation types are Domain Validation (DV), Organization Validation (OV), and Extended Validation (EV). DV certificates verify only control of the domain, OV certificates verify both domain control and the organization behind it, and EV certificates involve more rigorous checks and display additional identity information in browsers. The industry trend is toward simpler, automated issuance, with DV certificates now making up almost 98% of issued certificates, while EV issuance has become largely obsolete.
Finally, the chart on certificate duration shows the difference between the NotBefore and NotAfter dates embedded in each certificate, which define the period during which the certificate is valid. Currently, the majority (92%) of issued certificates have durations between 47 and 100 days. Shorter certificate lifetimes improve security by limiting exposure if a certificate is compromised, and the industry is moving toward even shorter durations, driven by browser policies and automated renewal systems.
Certificate issuance
Certificate issuance is the process by which CAs generate certificates for domain owners. Many CAs are operated by larger organizations that manage multiple subordinate CAs under a single corporate umbrella. The CT page highlights the distribution of certificate issuance across the top CA owners. At the moment, the Internet Security Research Group (ISRG), also known as Let’s Encrypt, issues more than 66% of all certificates, followed by other widely used CA owners including Google Trust Services, Sectigo, and GoDaddy.
The impact of events like the July 21-22 Let’s Encrypt API outage due to internal DNS failures that significantly reduced certificate issuance rates are visible in this visualization, as issuance rates dropped significantly during the two-day period.
In addition to CA owners, the page provides a breakdown of certificate issuance by individual CA certificates. Among the top five CAs, Let’s Encrypt’s four intermediate CAs — R12, R13, E7, and E8 — represent the bulk of its issuance. The bar chart can also be filtered by CA owner to display only the certificates associated with a specified organization.
The CT section also offers dedicated CA-specific pages. By searching for a CA name or fingerprint in the top search bar, you can reach a page showing all insights and trends available on the main CT page, filtered by the selected CA. The page also includes an additional CA information card, which provides details such as the CA’s owner, revocation status, parent certificate, validity period, country, inclusion in public root stores, and a list of all CAs operated by the same owner. All of this information is derived from the Common CA Database (CCADB).
Certificate Transparency logs
Next on the CT page is a section focused on CT logs. This section shows the distribution of certificates across CT log operators, identifying the organizations that manage the infrastructure behind the logs. Over the last three months, Sectigo operated the logs containing the largest number of certificates (2.8 billion), followed by Google (2.5 billion), Cloudflare (1.6 billion), and Let’s Encrypt (1.4 billion). Note that the same certificate can be logged multiple times across CT logs, so organizations that operate multiple CT logs with overlapping acceptance criteria may log certificates at an elevated rate. As such, the relative rank of the operators in this graph should not be construed as a measure of how load-bearing the logs are within the ecosystem.
Below this, a bar chart displays the distribution of certificates across individual CT logs. Among the top five logs are Google’s xenon2025h1 and argon2025h2, Cloudflare’s nimbus2025, and Let’s Encrypt’s oak2025h2. This chart can also be filtered by operator to show only the logs associated with a specific owner. Next to the chart, another view shows the distribution of certificates by log API, distinguishing between logs following the original RFC 6962 API versus those compatible with the newer and more efficient static CT API.
Similar to the dedicated CA pages, the CT section also provides log-specific pages. By searching for a log name in the top search bar, you can access a page showing all insights and trends available on the main CT page, filtered by the selected log. Two additional cards are included: one showing information about the log, derived from Google Chrome’s log list, including details such as the operator, API type, documentation, and a list of other logs operated by the same organization; and another displaying performance metrics with two radar charts tracking uptime and response time over the past 90 days, as observed by Cloudflare’s CT monitor. These metrics are useful to determine if logs are meeting the ongoing requirements for inclusion in CT programs like Google’s.
Certificate coverage
Last but not least, the CT page includes a section on certificate coverage. Certificates can cover multiple top-level domains (TLDs), include wildcard entries, and support IP addresses in Subject Alternative Names (SANs).
Next to this view, two half-donut charts provide further insights into certificate coverage: one shows the share of certificates that include wildcard entries — almost 25% of certificates use wildcards to cover multiple subdomains — while the other shows certificates that include IP addresses, revealing that the vast majority of certificates do not contain IPs in their SAN fields
Expanded domain certificate data
The domain information page has also been updated to provide richer details about certificates. The certificates table, which displays certificates recorded in active CT logs for the specified domain, now includes expandable rows. Expanding a row reveals further information, including the certificate’s SHA-256 fingerprint, subject and issuer details — Common Name (CN), Organization (O), and Country (C) — the validity period (NotBefore and NotAfter), and the CT log where the certificate was found.
While the charts above highlight key insights in the CT ecosystem, all underlying data is accessible via the API and can be explored interactively across time periods, CAs, logs, and additional filters and dimensions using Radar’s Data Explorer. And as always, Radar charts and graphs can be downloaded for sharing or embedded directly into blogs, websites, and dashboards for further analysis. Don’t hesitate to reach out to us with feedback, suggestions, and feature requests — we’re already working through a list of early feedback from the CT community!
The Apple M3 family of chips launched with some advancements but also intentionally shaky performance claims that should warrant a look by consumer protection agencies
Note: Timestamps used in this article are in UTC+8 Singapore time, unless stated otherwise.
Background
When we upgraded to Xcode 13.1 in April 2022, we noticed a few issues such as instability of the CI tests and other problems related to the switch to Xcode 13.1.
After taking a step back, we investigated this issue by integrating some observability tools into our iOS CI development process. This gave us a comprehensive perspective of the entire process, from the beginning to the end of the UITest job. In this article, we share the improvements we made, the insights we gathered, and the impact of these improvements on the overall process and resource utilisation.
Solution
In the following sections, we elaborate the various steps we took to investigate the issues, like unstable CI tests and high CPU utilisation, and the improvements we made to make our iOS CI infrastructure more reliable.
Analyse Xcode 13.1 CPU utilisation
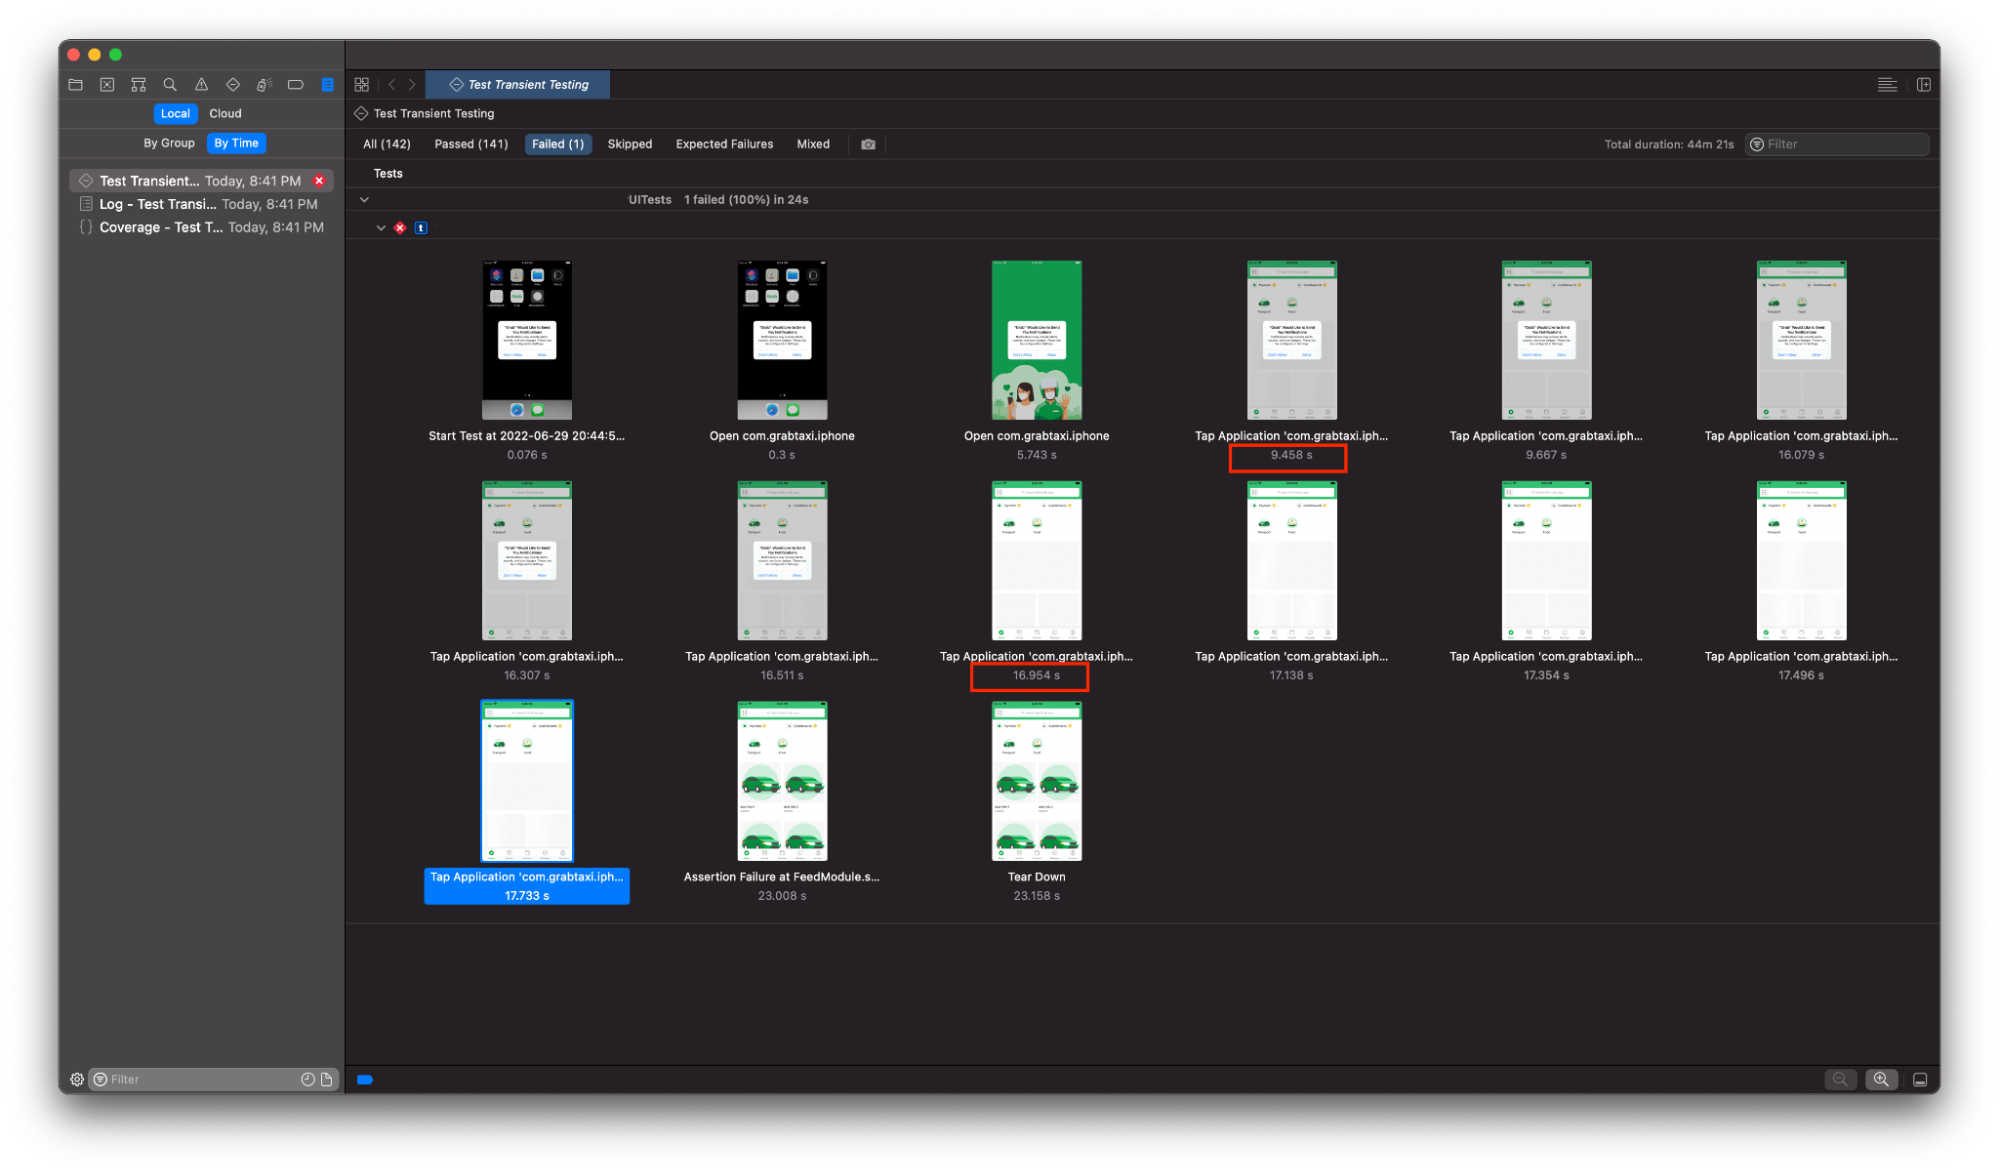
As an iOS developer, we are certain that you have also experienced Spotlight process-related CPU usage problems with Xcode 13.1, which have since been resolved in Xcode 13.2. After investigating, we found that the CPU usage issues were one of the root causes of UITest’s instability and it was something we needed to fix urgently. We decided not to wait for Apple’s update as it would cost us more time to perform another round of migration.
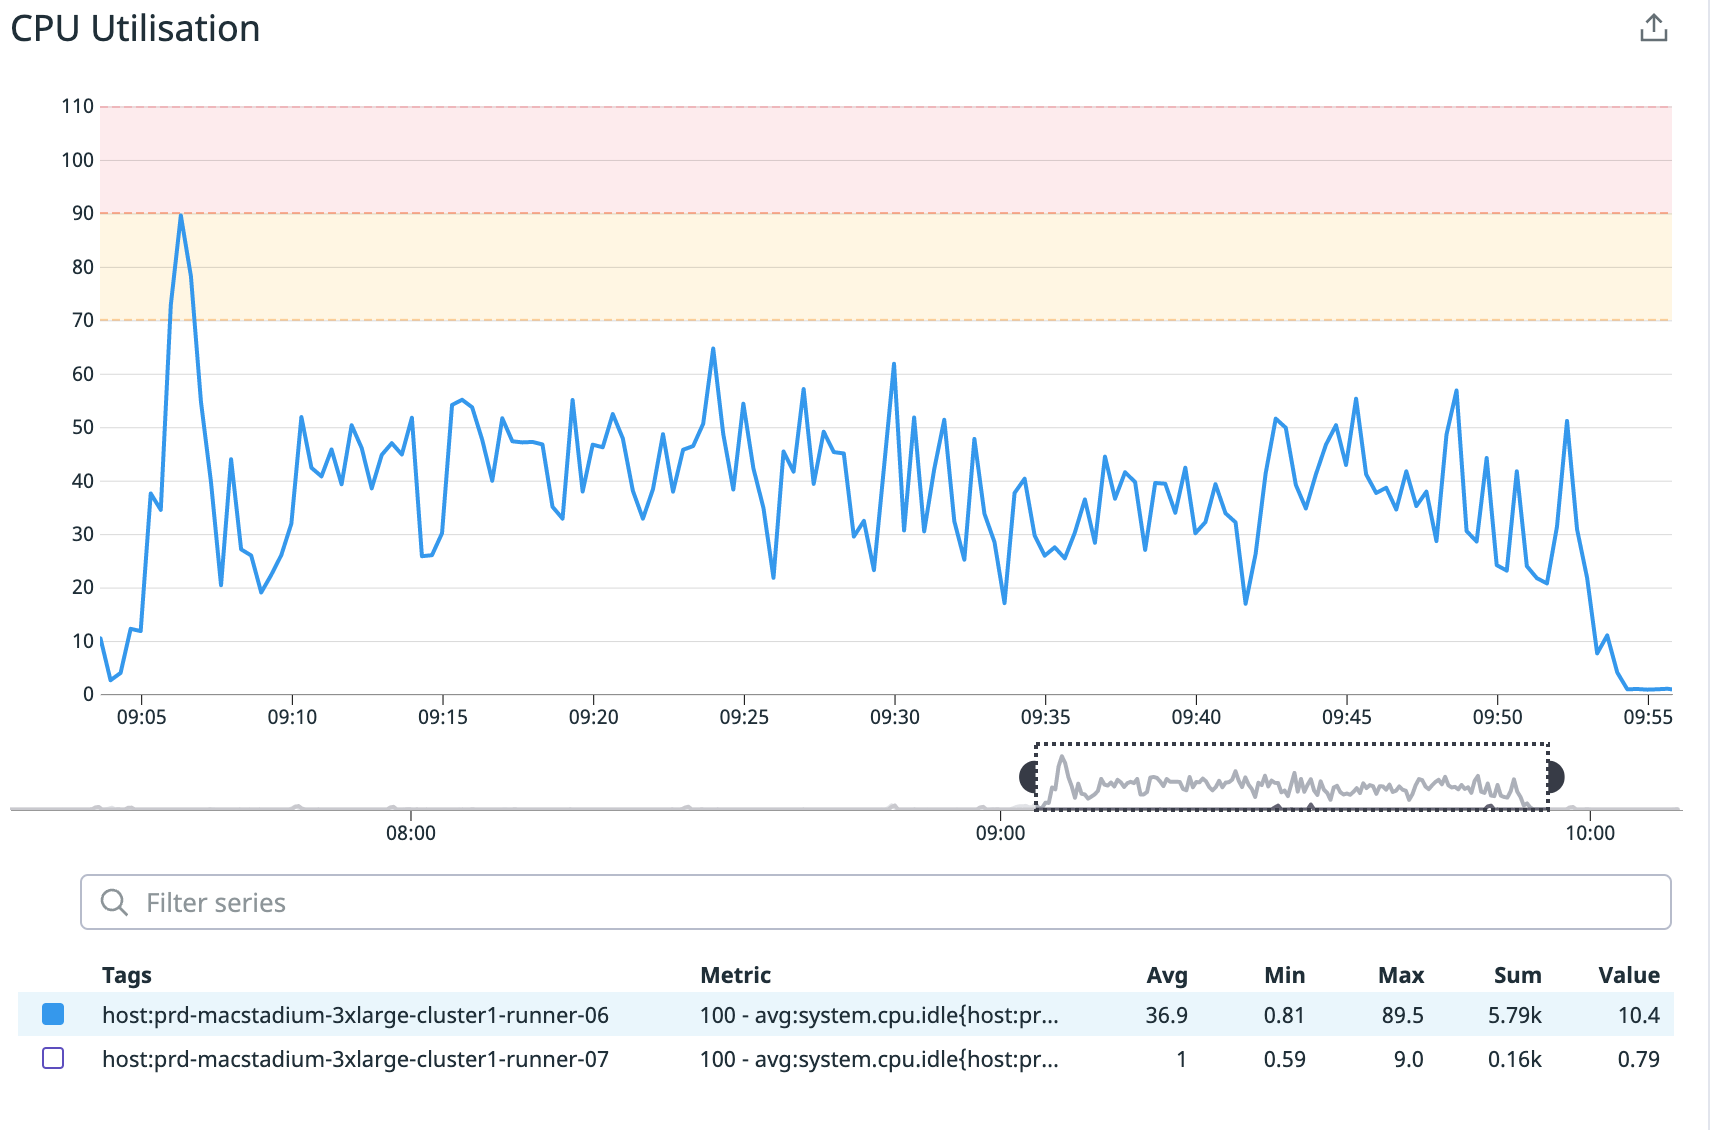
Before we started UITest, we moved the spotlight.app into a new folder. When the test was complete, we restored the application to its original location. This significantly decreased CPU utilisation by more than 50%.
This section helps you better visualise how the different versions of Xcode affected CPU utilisation.
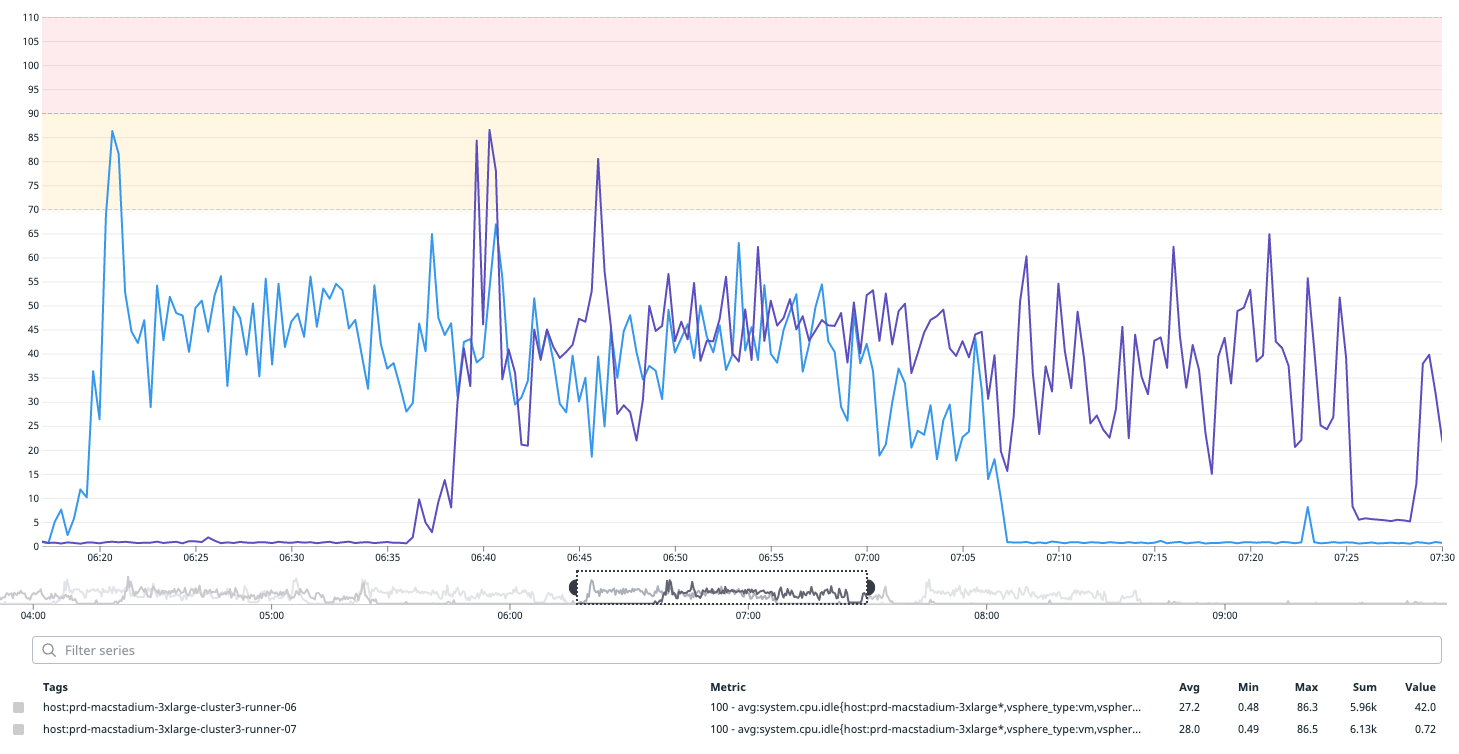
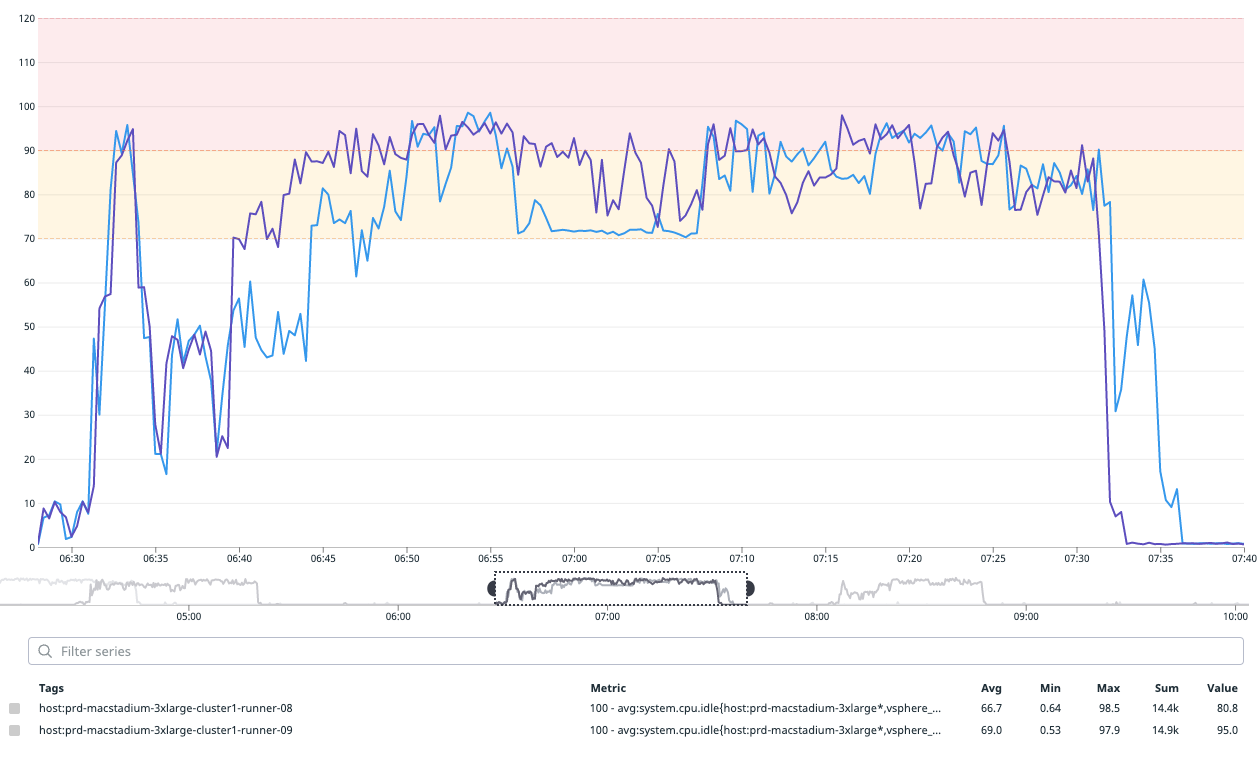
Xcode 12.1
Xcode 13.1 before fix
Xcode 13.1 after fix
Remove iOS Safari’s dependency during deep link testing
As a superapp, there are countless scenarios that need to be thoroughly tested at Grab before the feature is released in production. One of these tests is deep link testing.
More than 10% of the total number of tests are deep link tests. Typically, it is advised to mock the dependencies throughout the test to ensure that it runs quickly and reliably. However, this creates another reliance on iOS Safari.
As a result, we created a mock browser in UITest. We used the URL to the mock browser as the launch argument, and the same URL is then called back. This method results in a 20% reduction in CI time and more stable tests.
Boot the iOS simulator with permission
It is always a good idea to reset the simulator before running UITest so that there are no residual presets or simulated data from a different test. Additionally, using any of the simulator’s services (location, ATT, contacts, etc.) will prompt the simulator to request permission, which slows down execution. We used UIInterruptionHandler (a handler block for managing alerts and other dialogues) to manage asynchronous UI interruptions during the test.
We wanted to reduce the time taken for test execution, which we knew includes many permissions. Therefore, in order to speed up execution, we boot the simulator with permissions. This removes the need for permissions during UITest, which speeds up performance by 5%.
Monitor HTTP traffic during the UITest
When writing tests, it is important to mock all resources as this enables us to focus on the code that’s being tested and not how external dependencies interact or respond. However, with a large team working concurrently, it can be challenging to ensure that nothing is actually downloaded from the internet.
Developers often make changes to code, and UITests are essential for ensuring that these modifications do not adversely affect existing functionality. It is advised to mock all dependencies while writing tests to simulate all possible behavior. We discovered that a significant number of resources were being downloaded each time we ran the tests, which was highly inefficient.
In large teams working simultaneously, preventing downloads from the internet can be quite challenging. To tackle this issue, we devised a custom tool that tracks all URLs accessed throughout the UITest. This enabled us to identify resources being downloaded from the internet during the testing process.
By using our custom tool to analyse network traffic, we were able to ensure that no resources were being downloaded during testing. Instead, we relied on mocked dependencies, resulting in reduced testing times and improved stability.
GitLab load runner analysis
At Grab, we have many teams of developers who maintain the app, make code changes, and raise merge requests (MRs) on a daily basis. To make sure that new changes don’t conflict with existing code, these MRs are integrated with CI.
Additionally, to manage the number of MRs, we maintain a list of clusters that run test runners concurrently for better resource utilisation and performance. We frequently run these tests to determine how many parallel processors are required for stable results.
####Return HTTP responses to the local mock server
We have a tool that we use to mock API requests, which we improved to also support HTML responses. This increases the scope of testing and ensures the HTML response sequences work properly.
Use explicit waiting commands
When running multiple tests, timing issues are inevitable and they cause tests to occasionally pass and fail. To mitigate this, most of the developers prefer to add a sleep command so there is time for the element to render properly before we verify it – but this slows down execution. In order to improve CI execution, we introduced a link that allows us to track sleep function usage and suggest developers use waitForExistence wrappers in UI tests.
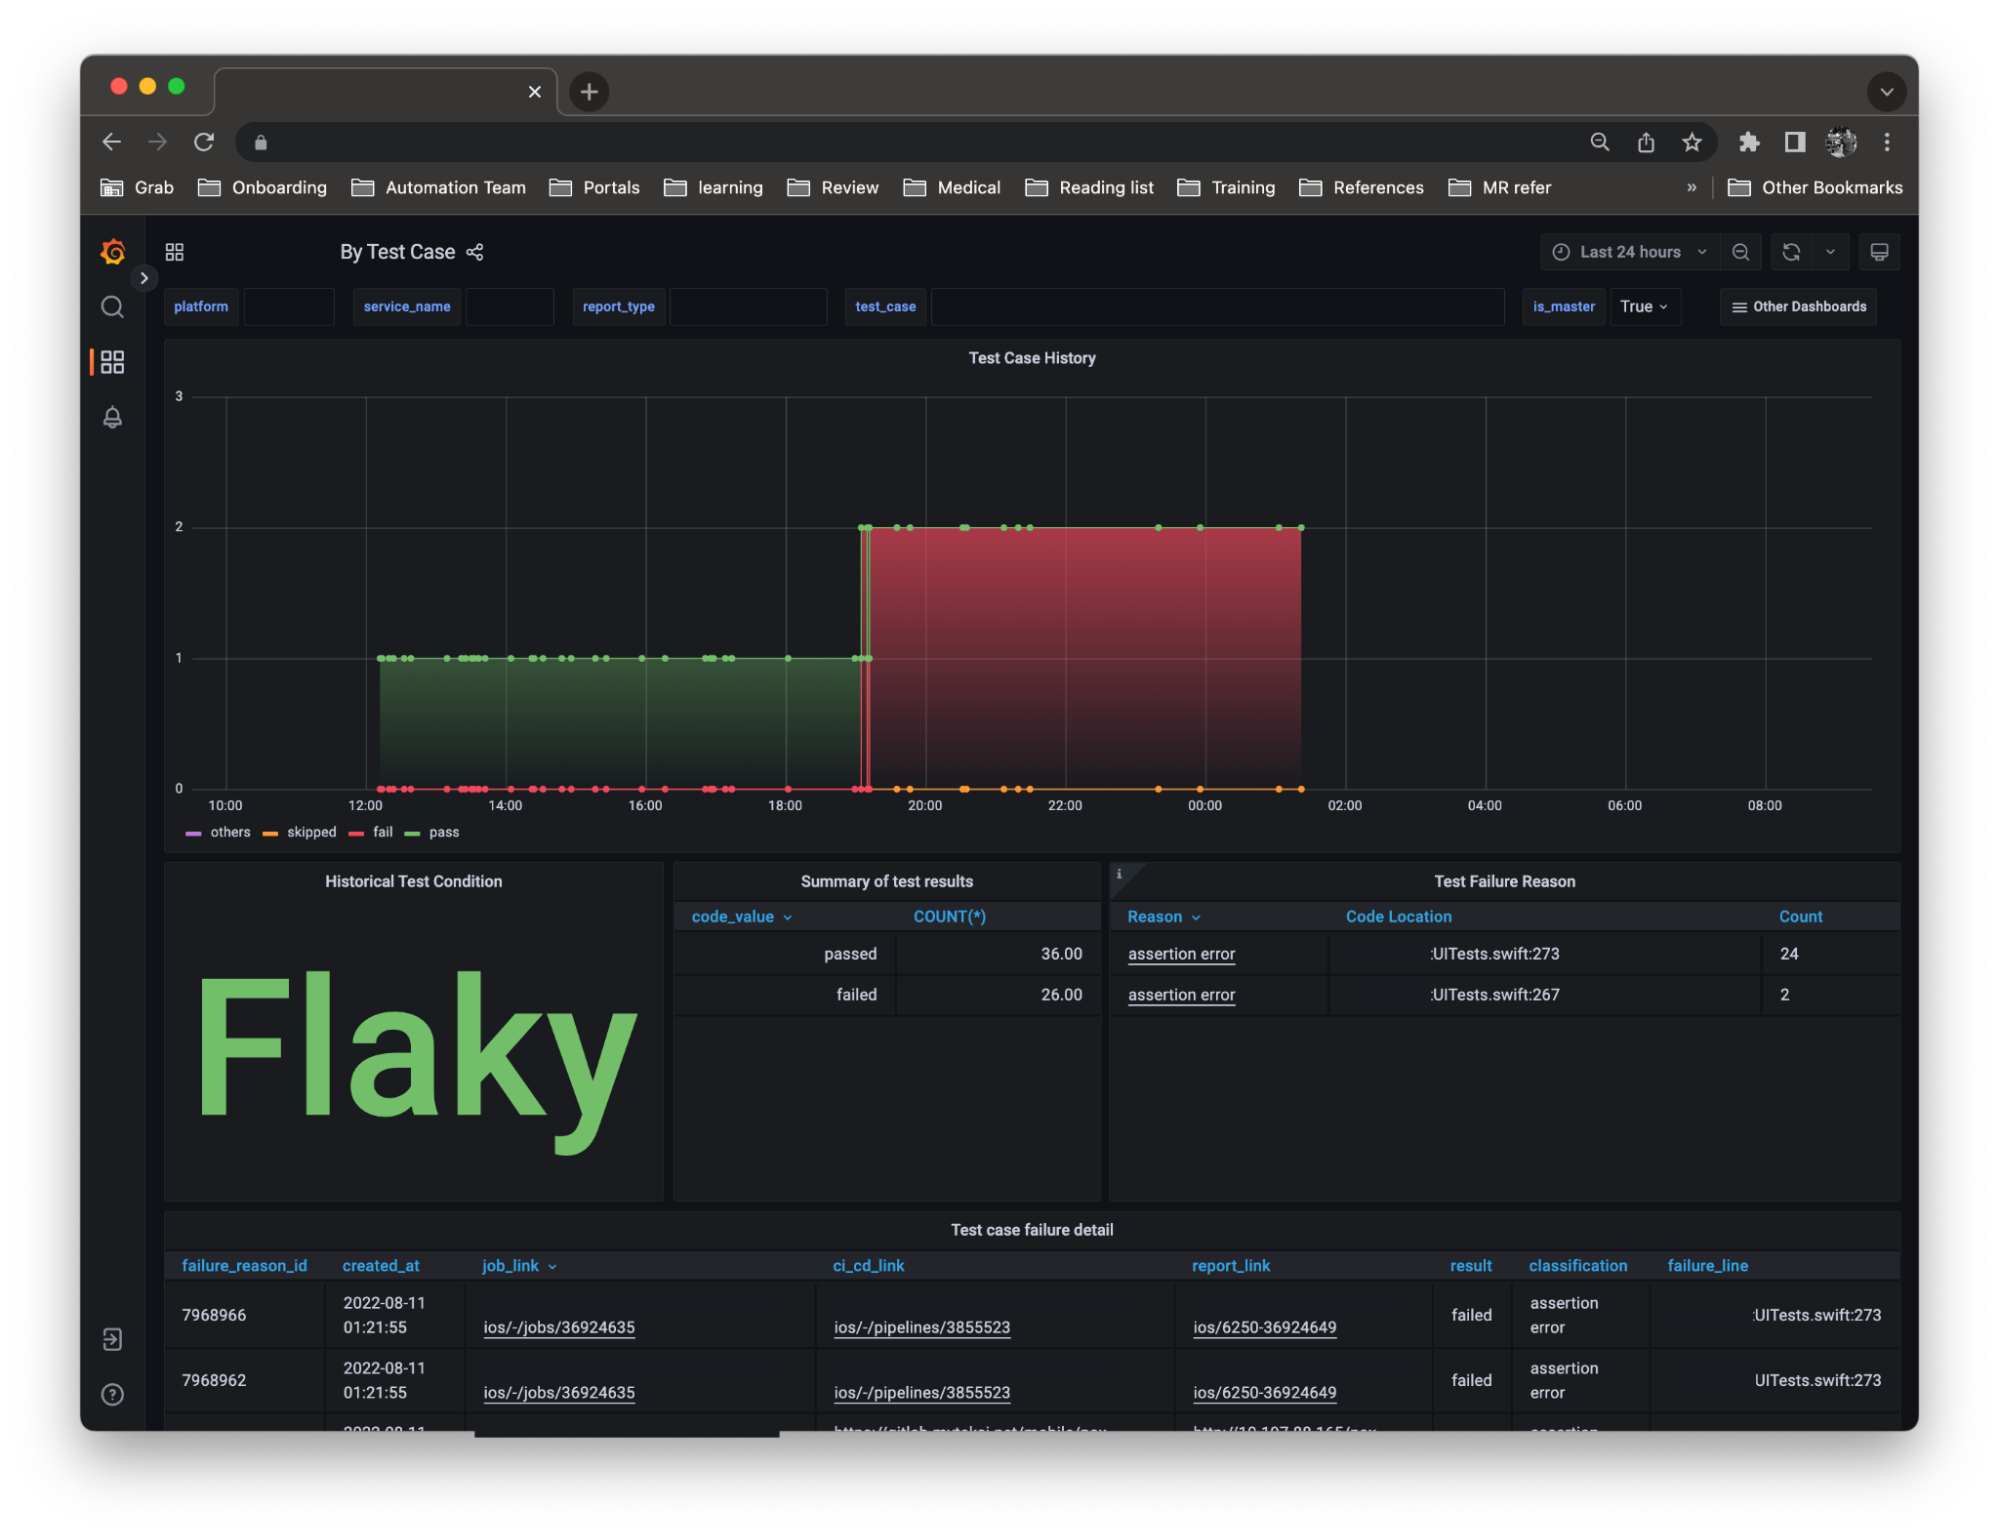
Track each failure state
With large codebases, it is quite common to see flakiness in UITests, where tests occasionally succeed and fail without any code changes. This means that test results can be inconsistent and in some cases, faulty. Faulty testing can be frustrating, and quite expensive. This is because engineers need to re-trigger entire builds, which ends up consuming more time.
Initially, we used an internal tool that required all tests to pass on the first run, before merging was allowed. However, we realised that this significantly increased engineers’ manual retry time, hence, we modified the rules to allow merging as long as a subsequent retry passes the tests. This minor change improved our engineers’ CI overall experience and did not result in more flaky tests.
Learnings/Conclusion
Our journey to improve iOS CI infrastructure is still ongoing, but from this experience, we learnt several things:
Focus on the feature being tested by ensuring all external responses are mocked.
A certain degree of test flakiness is expected, but you should monitor past trends. If flakiness increases, there’s probably a deeper lying issue within your code.
Regularly monitor resource utilisation and performance – detecting a sudden spike early could save you a lot of time and money.
At Cloudflare, we’re excited about the quickly-approaching 5G future. Increasingly, we’ll have access to high throughput and low-latency wireless networks wherever we are. It will make the Internet feel instantaneous, and we’ll find new uses for this connectivity such as sensors that will help us be more productive and energy-efficient. However, this type of connectivity doesn’t have to come at the expense of security, a concern raised in this recent Wired article. Today we’re announcing the creation of a new partnership program for mobile networks—Zero Trust for Mobile Operators—to jointly solve the biggest security and performance challenges.
SASE for Mobile Networks
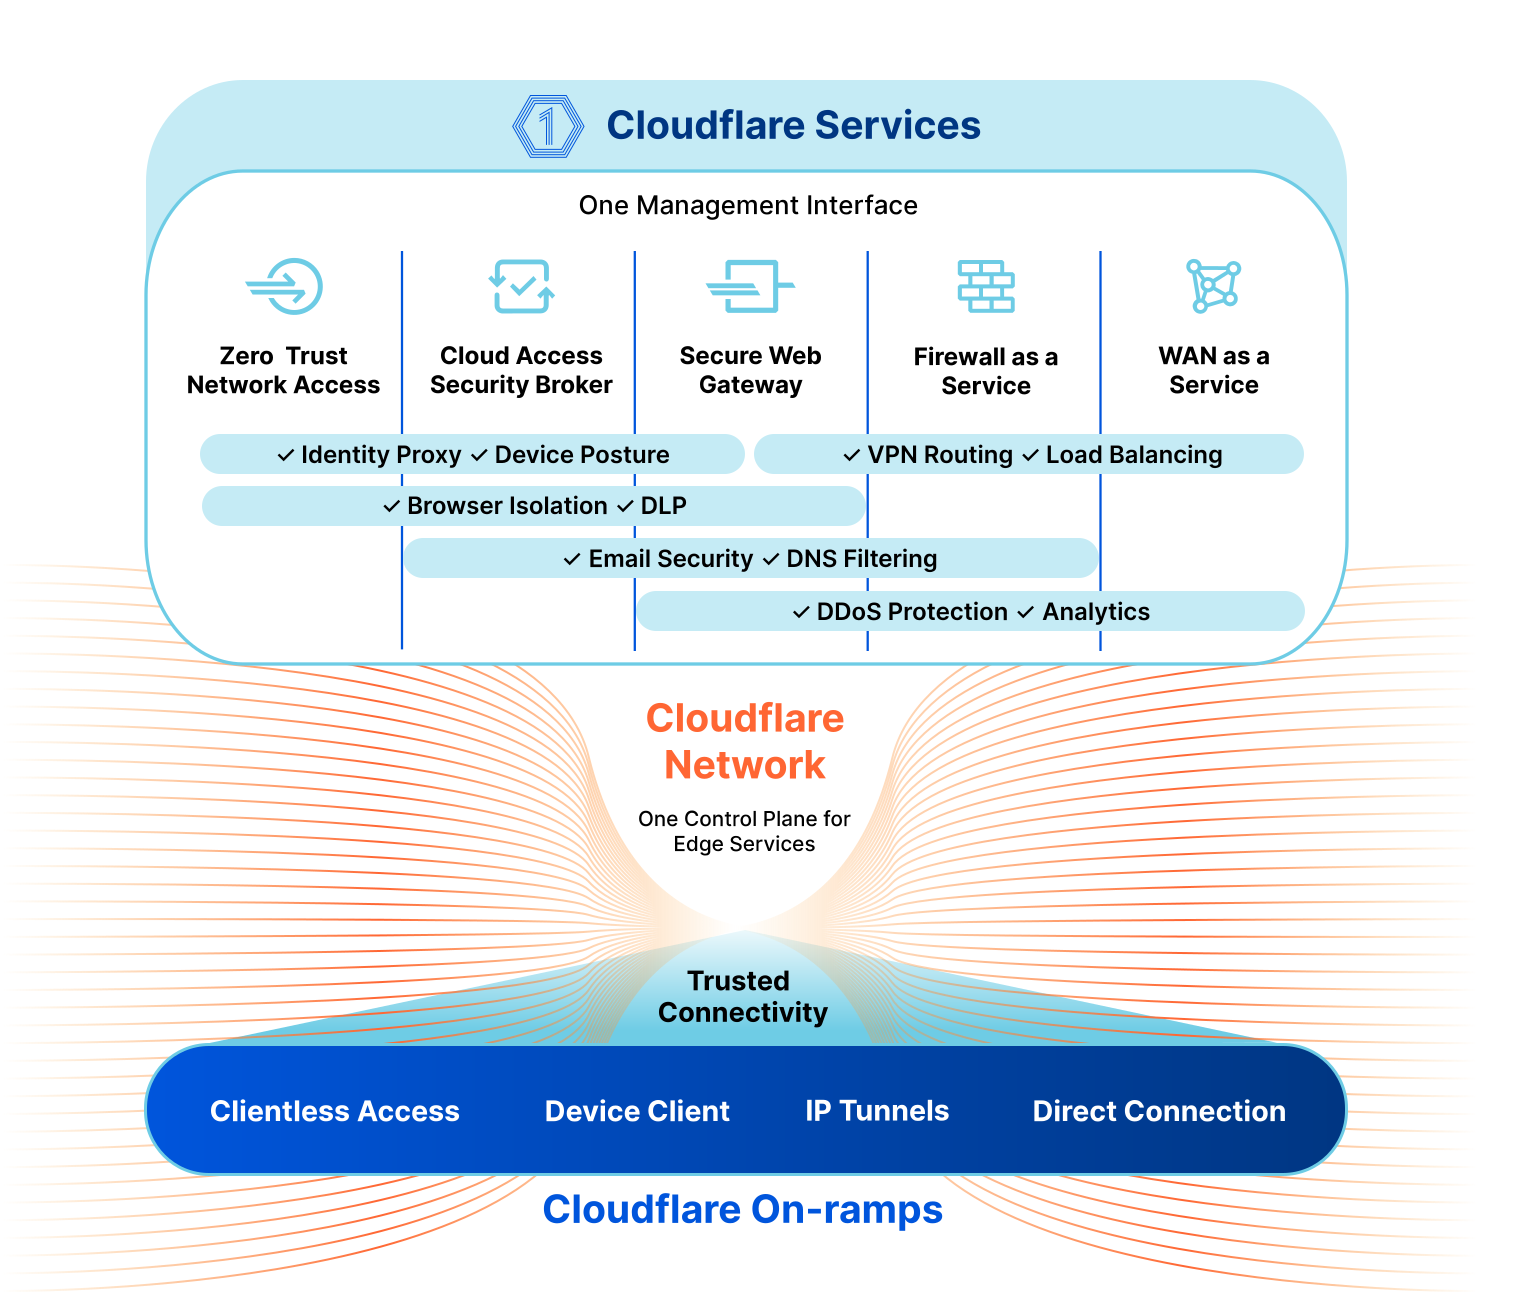
Every network is different, and the key to managing the complicated security environment of an enterprise network is having lots of tools in the toolbox. Most of these functions fall under the industry buzzword SASE, which stands for Secure Access Service Edge. Cloudflare’s SASE product is Cloudflare One, and it’s a comprehensive platform for network operators. It includes:
Magic WAN, which offers secure Network-as-a-Service (NaaS) connectivity for your data centers, branch offices and cloud VPCs and integrates with your legacy MPLS networks
Cloudflare Access, which is a Zero Trust Network Access (ZTNA) service requiring strict verification for every user and every device before authorizing them to access internal resources.
Gateway, our Secure Web Gateway, which operates between a corporate network and the Internet to enforce security policies and protect company data.
A Cloud Access Security Broker, which monitors the network and external cloud services for security threats.
Cloudflare Area 1, an email threat detection tool to scan email for phishing, malware, and other threats.
We’re excited to partner with mobile network operators for these services because our networks and services are tremendously complementary. Let’s first think about SD-WAN (Software-Defined Wide Area Network) connectivity, which is the foundation on which much of the SASE framework rests. As an example, imagine a developer working from home developing a solution with a Mobile Network Operator’s (MNO) Internet of Things APIs. Maybe they’re developing tracking software for the number of drinks left in a soda machine, or want to track the routes for delivery trucks.
The developer at home and their fleet of devices should be on the same wide area network, securely, and at reasonable cost. What Cloudflare provides is the programmable software layer that enables this secure connectivity. The developer and the developer’s employer still need to have connectivity to the Internet at home, and for the fleet of devices. The ability to make a secure connection to your fleet of devices doesn’t do any good without enterprise connectivity, and the enterprise connectivity is only more valuable with the secure connection running on top of it. They’re the perfect match.
Once the connectivity is established, we can layer on a Zero Trust platform to ensure every user can only access a resource to which they’ve been explicitly granted permission. Any time a user wants to access a protected resource – via ssh, to a cloud service, etc. – they’re challenged to authenticate with their single-sign-on credentials before being allowed access. The networks we use are growing and becoming more distributed. A Zero Trust architecture enables that growth while protecting against known risks.
Edge Computing
Given the potential of low-latency 5G networks, consumers and operators are both waiting for a “killer 5G app”. Maybe it will be autonomous vehicles and virtual reality, but our bet is on a quieter revolution: moving compute – the “work” that a server needs to do to respond to a request – from big regional data centers to small city-level data centers, embedding the compute capacity inside wireless networks, and eventually even to the base of cell towers.
Cloudflare’s edge compute platform is called Workers, and it does exactly this – execute code at the edge. It’s designed to be simple. When a developer is building an API to support their product or service, they don’t want to worry about regions and availability zones. With Workers, a developer writes code they want executed at the edge, deploys it, and within seconds it’s running at every Cloudflare data center globally.
Some workloads we already see, and expect to see more of, include:
IoT (Internet of Things) companies implementing complex device logic and security features directly at the edge, letting them add cutting-edge capabilities without adding cost or latency to their devices.
eCommerce platforms storing and caching customized assets close to their visitors for improved customer experience and great conversion rates.
Financial data platforms, including new Web3 players, providing near real-time information and transactions to their users.
A/B testing and experimentation run at the edge without adding latency or introducing dependencies on the client-side.
Fitness-type devices tracking a user’s movement and health statistics can offload compute-heavy workloads while maintaining great speed/latency.
Retail applications providing fast service and a customized experience for each customer without an expensive on-prem solution.
The Cloudflare Case Studies section has additional examples from NCR, Edgemesh, BlockFi, and others on how they’re using the Workers platform. While these examples are exciting, we’re most excited about providing the platform for new innovation.
You may have seen last week we announcedWorkers for Platforms is now in General Availability. Workers for Platforms is an umbrella-like structure that allows a parent organization to enable Workers for their own customers. As an MNO, your focus is on providing the means for devices to send communication to clients. For IoT use cases, sending data is the first step, but the exciting potential of this connectivity is the applications it enables. With Workers for Platforms, MNOs can expose an embedded product that allows customers to access compute power at the edge.
Network Infrastructure
The complementary networks between mobile networks and Cloudflare is another area of opportunity. When a user is interacting with the Internet, one of the most important factors for the speed of their connection is the physical distance from their handset to the content and services they’re trying to access. If the data request from a user in Denver needs to wind its way to one of the major Internet hubs in Dallas, San Jose, or Chicago (and then all the way back!), that is going to be slow. But if the MNO can link to the service locally in Denver, the connection will be much faster.
One of the exciting developments with new 5G networks is the ability of MNOs to do more “local breakout”. Many MNOs are moving towards cloud-native and distributed radio access networks (RANs) which provides more flexibility to move and multiply packet cores. These packet cores are the heart of a mobile network and all of a subscriber’s data flows through one.
For Cloudflare – with a data center presence in 275+ cities globally – a user never has to wait long for our services. We can also take it a step further. In some cases, our services are embedded within the MNO or ISP’s own network. The traffic which connects a user to a device, authorizes the connection, and securely transmits data is all within the network boundary of the MNO – it never needs to touch the public Internet, incur added latency, or otherwise compromise the performance for your subscribers.
We’re excited to partner with mobile networks because our security services work best when our customers have excellent enterprise connectivity underneath. Likewise, we think mobile networks can offer more value to their customers with our security software added on top. If you’d like to talk about how to integrate Cloudflare One into your offerings, please email us at [email protected], and we’ll be in touch!
The humble cell phone is now a critical tool in the modern workplace; even more so as the modern workplace has shifted out of the office. Given the billions of mobile devices on the planet — they now outnumber PCs by an order of magnitude — it should come as no surprise that they have become the threat vector of choice for those attempting to break through corporate defenses.
The problem you face in defending against such attacks is that for most Zero Trust solutions, mobile is often a second-class citizen. Those solutions are typically hard to install and manage. And they only work at the software layer, such as with WARP, the mobile (and desktop) apps that connect devices directly into our Zero Trust network. And all this is before you add in the further complication of Bring Your Own Device (BYOD) that more employees are using — you’re trying to deploy Zero Trust on a device that doesn’t belong to the company.
It’s a tricky — and increasingly critical — problem to solve. But it’s also a problem which we think we can help with.
What if employers could offer their employees a deal: we’ll cover your monthly data costs if you agree to let us direct your work-related traffic through a network that has Zero Trust protections built right in? And what’s more, we’ll make it super easy to install — in fact, to take advantage of it, all you need to do is scan a QR code — which can be embedded in an employee’s onboarding material — from your phone’s camera.
Well, we’d like to introduce you to the Cloudflare SIM: the world’s first Zero Trust SIM.
In true Cloudflare fashion, we think that combining the software layer and the network layer enables better security, performance, and reliability. By targeting a foundational piece of technology that underpins every mobile device — the (not so) humble SIM card — we’re aiming to bring an unprecedented level of security (and performance) to the mobile world.
The threat is increasingly mobile
When we say that mobile is the new threat vector, we’re not talking in the abstract. Last month, Cloudflare was one of 130 companies that were targeted by a sophisticated phishing attack. Mobile was the cornerstone of the attack — employees were initially reached by SMS, and the attack relied heavily on compromising 2FA codes.
So far as we’re aware, we were the only company to not be compromised.
A big part of that was because we’re continuously pushing multi-layered Zero Trust defenses. Given how foundational mobile is to how companies operate today, we’ve been working hard to further shore up Zero Trust defenses in this sphere. And this is how we think about Zero Trust SIM: another layer of defense at a different level of the stack, making life even harder for those who are trying to penetrate your organization. With the Zero Trust SIM, you get the benefits of:
Preventing employees from visiting phishing and malware sites: DNS requests leaving the device can automatically and implicitly use Cloudflare Gateway for DNS filtering.
Mitigating common SIM attacks: an eSIM-first approach allows us to prevent SIM-swapping or cloning attacks, and by locking SIMs to individual employee devices, bring the same protections to physical SIMs.
Enabling secure, identity-based private connectivity to cloud services, on-premise infrastructure and even other devices (think: fleets of IoT devices) via Magic WAN. Each SIM can be strongly tied to a specific employee, and treated as an identity signal in conjunction with other device posture signals already supported by WARP.
By integrating Cloudflare’s security capabilities at the SIM-level, teams can better secure their fleets of mobile devices, especially in a world where BYOD is the norm and no longer the exception.
Zero Trust works better when it’s software + On-ramps
Beyond all the security benefits that we get for mobile devices, the Zero Trust SIM transforms mobile into another on-ramp pillar into the Cloudflare One platform.
Cloudflare One presents a single, unified control plane: allowing organizations to apply security controls across all the traffic coming to, and leaving from, their networks, devices and infrastructure. It’s the same with logging: you want one place to get your logs, and one location for all of your security analysis. With the Cloudflare SIM, mobile is now treated as just one more way that traffic gets passed around your corporate network.
Working at the on-ramp rather than the software level has another big benefit — it grants the flexibility to allow devices to reach services not on the Internet, including cloud infrastructure, data centers and branch offices connected into Magic WAN, our Network-as-a-Service platform. In fact, under the covers, we’re using the same software networking foundations that our customers use to build out the connectivity layer behind the Zero Trust SIM. This will also allow us to support new capabilities like Geneve, a new network tunneling protocol, further expanding how customers can connect their infrastructure into Cloudflare One.
We’re following efforts like IoT SAFE (and parallel, non-IoT standards) that enable SIM cards to be used as a root-of-trust, which will enable a stronger association between the Zero Trust SIM, employee identity, and the potential to act as a trusted hardware token.
Get Zero Trust up and running on mobile immediately (and easily)
Of course, every Zero Trust solutions provider promises protection for mobile. But especially in the case of BYOD, getting employees up and running can be tough. To get a device onboarded, there is a deep tour of the Settings app of your phone: accepting profiles, trusting certificates, and (in most cases) a requirement for a mature mobile device management (MDM) solution.
It’s a pain to install.
Now, we’re not advocating the elimination of the client software on the phone any more than we would be on the PC. More layers of defense is always better than fewer. And it remains necessary to secure Wi-Fi connections that are established on the phone. But a big advantage is that the Cloudflare SIM gets employees protected behind Cloudflare’s Zero Trust platform immediately for all mobile traffic.
It’s not just the on-device installation we wanted to simplify, however. It’s companies’ IT supply chains, as well.
One of the traditional challenges with SIM cards is that they have been, until recently, a physical card. A card that you have to mail to employees (a supply chain risk in modern times), that can be lost, stolen, and that can still fail. With a distributed workforce, all of this is made even harder. We know that whilst security is critical, security that is hard to deploy tends to be deployed haphazardly, ad-hoc, and often, not at all.
But in recent years, nearly every modern phone shipped today has an eSIM — or more precisely, an eUICC (Embedded Universal Integrated Circuit Card) — that can be re-programmed dynamically. This is a huge advancement, for two major reasons:
You avoid all the logistical issues of a physical SIM (mailing them; supply chain risk; getting users to install them!)
You can deploy them automatically, either via QR codes, Mobile Device Management (MDM) features built into mobile devices today, or via an app (for example, our WARP mobile app).
We’re also exploring introducing physical SIMs (just like the ones above): although we believe eSIMs are the future, especially given their deployment & security advantages, we understand that the future is not always evenly distributed. We’ll be working to make sure that the physical SIMs we ship are as secure as possible, and we’ll be sharing more of how this works in the coming months.
Privacy and transparency for employees
Of course, more and more of the devices that employees use for work are their own. And while employers want to make sure their corporate resources are secure, employees also have privacy concerns when work and private life are blended on the same device. You don’t want your boss knowing that you’re swiping on Tinder.
We want to be thoughtful about how we approach this, from the perspective of both sides. We have sophisticated logging set up as part of Cloudflare One, and this will extend to Cloudflare SIM. Today, Cloudflare One can be explicitly configured to log only the resources it blocks — the threats it’s protecting employees from — without logging every domain visited beyond that. We’re working to make this as obvious and transparent as possible to both employers and employees so that, in true Cloudflare fashion, security does not have to compromise privacy.
What’s next?
Like any product at Cloudflare, we’re testing this on ourselves first (or “dogfooding”, to those in the know). Given the services we provide for over 30% of the Fortune 1000, we continue to observe, and be the target of, increasingly sophisticated cybersecurity attacks. We believe that running the service first is an important step in ensuring we make the Zero Trust SIM both secure and as easy to deploy and manage across thousands of employees as possible.
We’re also bringing the Zero Trust SIM to the Internet of Things: almost every vehicle shipped today has an expectation of cellular connectivity; an increasing number of payment terminals have a SIM card; and a growing number of industrial devices across manufacturing and logistics. IoT device security is under increasing levels of scrutiny, and ensuring that the only way a device can connect is a secure one — protected by Cloudflare’s Zero Trust capabilities — can directly prevent devices from becoming part of the next big DDoS botnet.
We’ll be rolling the Zero Trust SIM out to customers on a regional basis as we build our regional connectivity across the globe (if you’re an operator: reach out). We’d especially love to talk to organizations who don’t have an existing mobile device solution in place at all, or who are struggling to make things work today. If you’re interested, then sign up here.
To scale up to the needs of our customers, we’ve adopted ways to efficiently deliver our services through our everyday superapp – whether it’s through continuous process improvements or coding best practices. For one, libraries have made it possible for us to increase our development velocity. In the Passenger App Android team, we’ve a mix of libraries – from libraries that we’ve built in-house to open source ones.
Every week, we release a new version of our Passenger App. Each update contains on average between five to ten library updates. In this article, we will explain how we keep all libraries used by our app up to date, and the different actions we take to avoid defect leaks into production.
How many libraries are we using?
Before we add a new library to a project, it goes through a rigorous assessment process covering many parts, such as security issue detection and usability tests measuring the impact on the app size and app startup time. This process ensures that only libraries up to our standards are added.
In total, there are more than 170 libraries powering the SuperApp, including 55 AndroidX artifacts and 22 libraries used for the sole purpose of writing automation testing (Unit Testing or UI Testing).
Who is responsible for updating
While we do have an internal process on how to update the libraries, it doesn’t mention who and how often it should be done. In fact, it’s everyone’s responsibility to make sure our libraries are up to date. Each team should be aware of the libraries they’re using and whenever a new version is released.
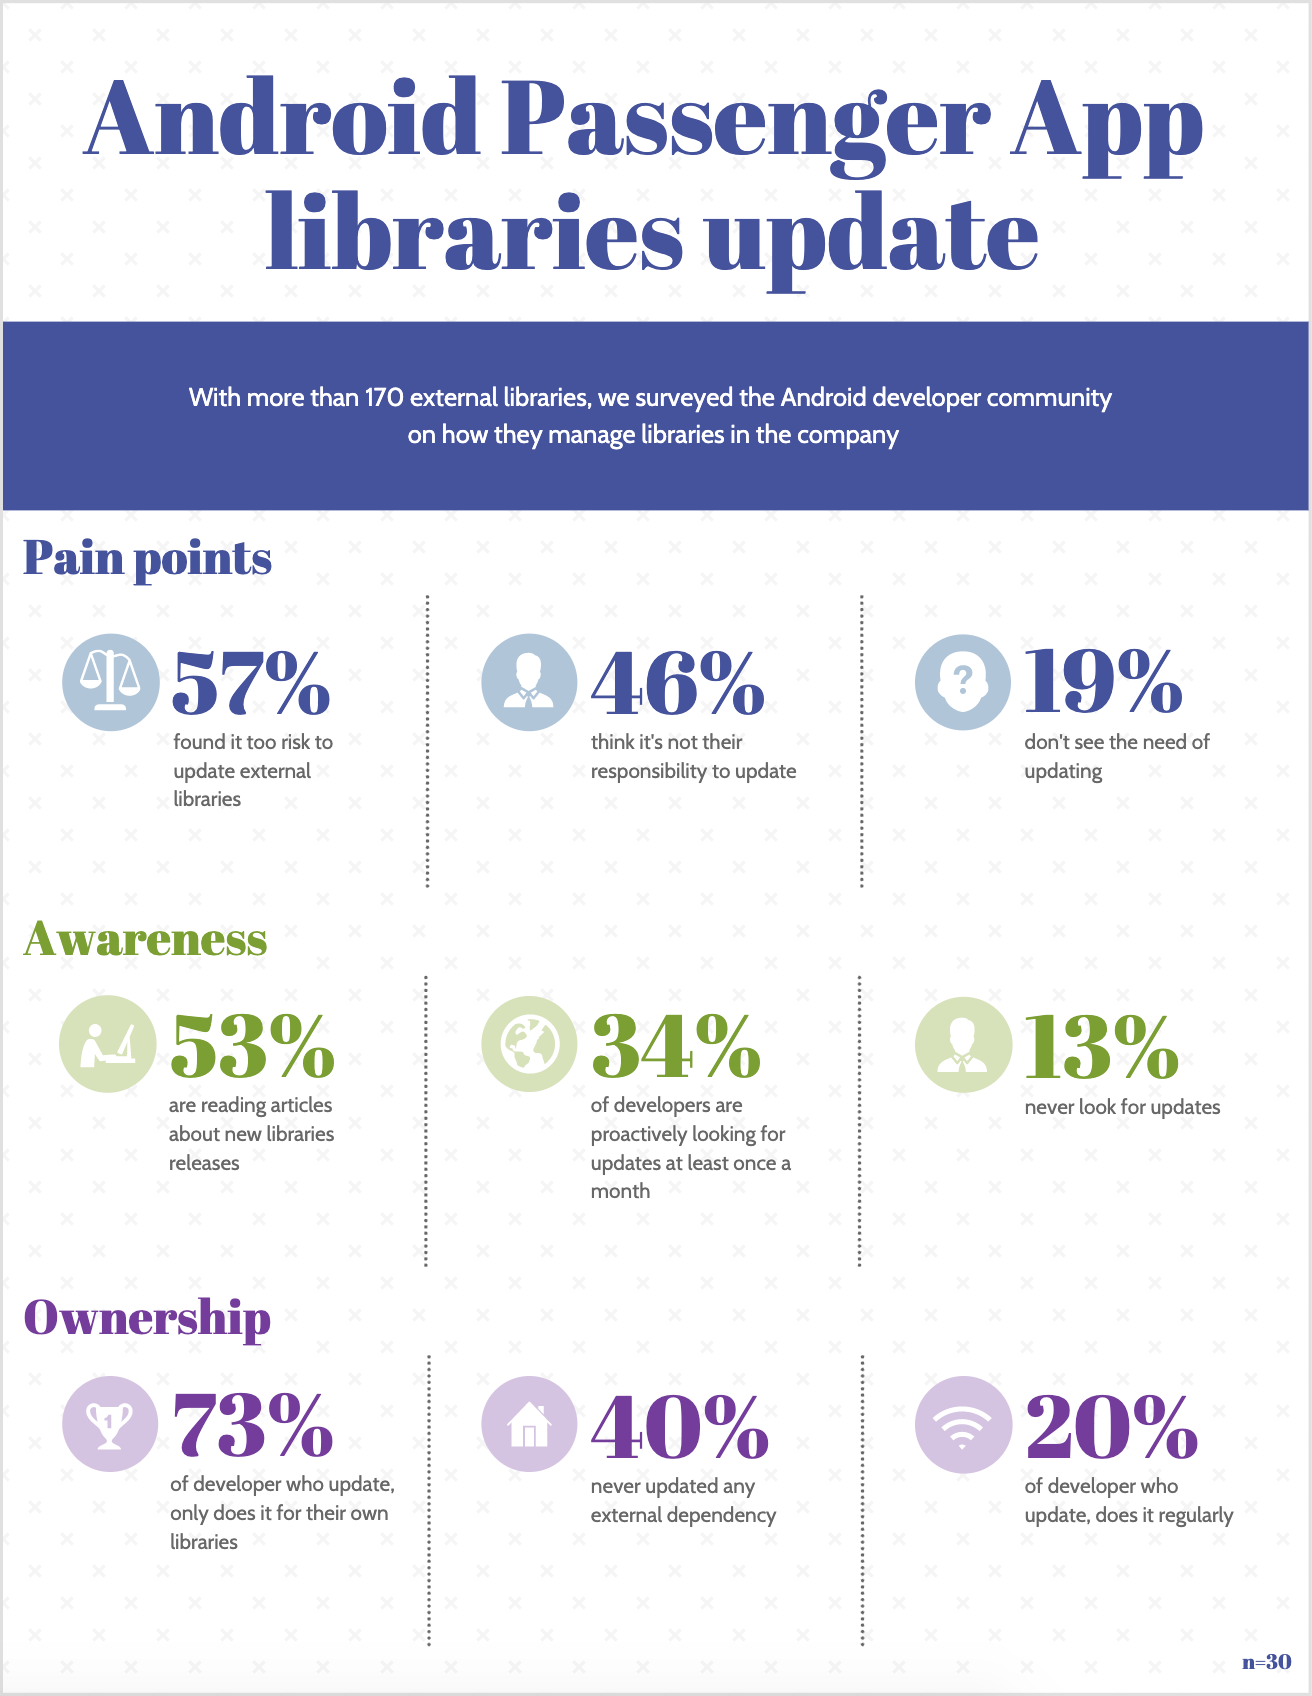
However, this isn’t really the case. We’ve a few developers taking ownership of the libraries as a whole and trying to maintain it. With more than 170 external libraries, we surveyed the Android developer community on how they manage libraries in the company. The result can be summarized as follow:
Survey Results
While most developers are aware of updates, they don’t update a library because the risk of defects leaking into production is too high.
Risk management
The risk is to have a defect leaking into production. It can cause regressions on existing features or introduce new crashes in the app. In a worst case scenario, if this isn’t caught before publishing, it can force us to make a hotfix and a certain number of users will be impacted.
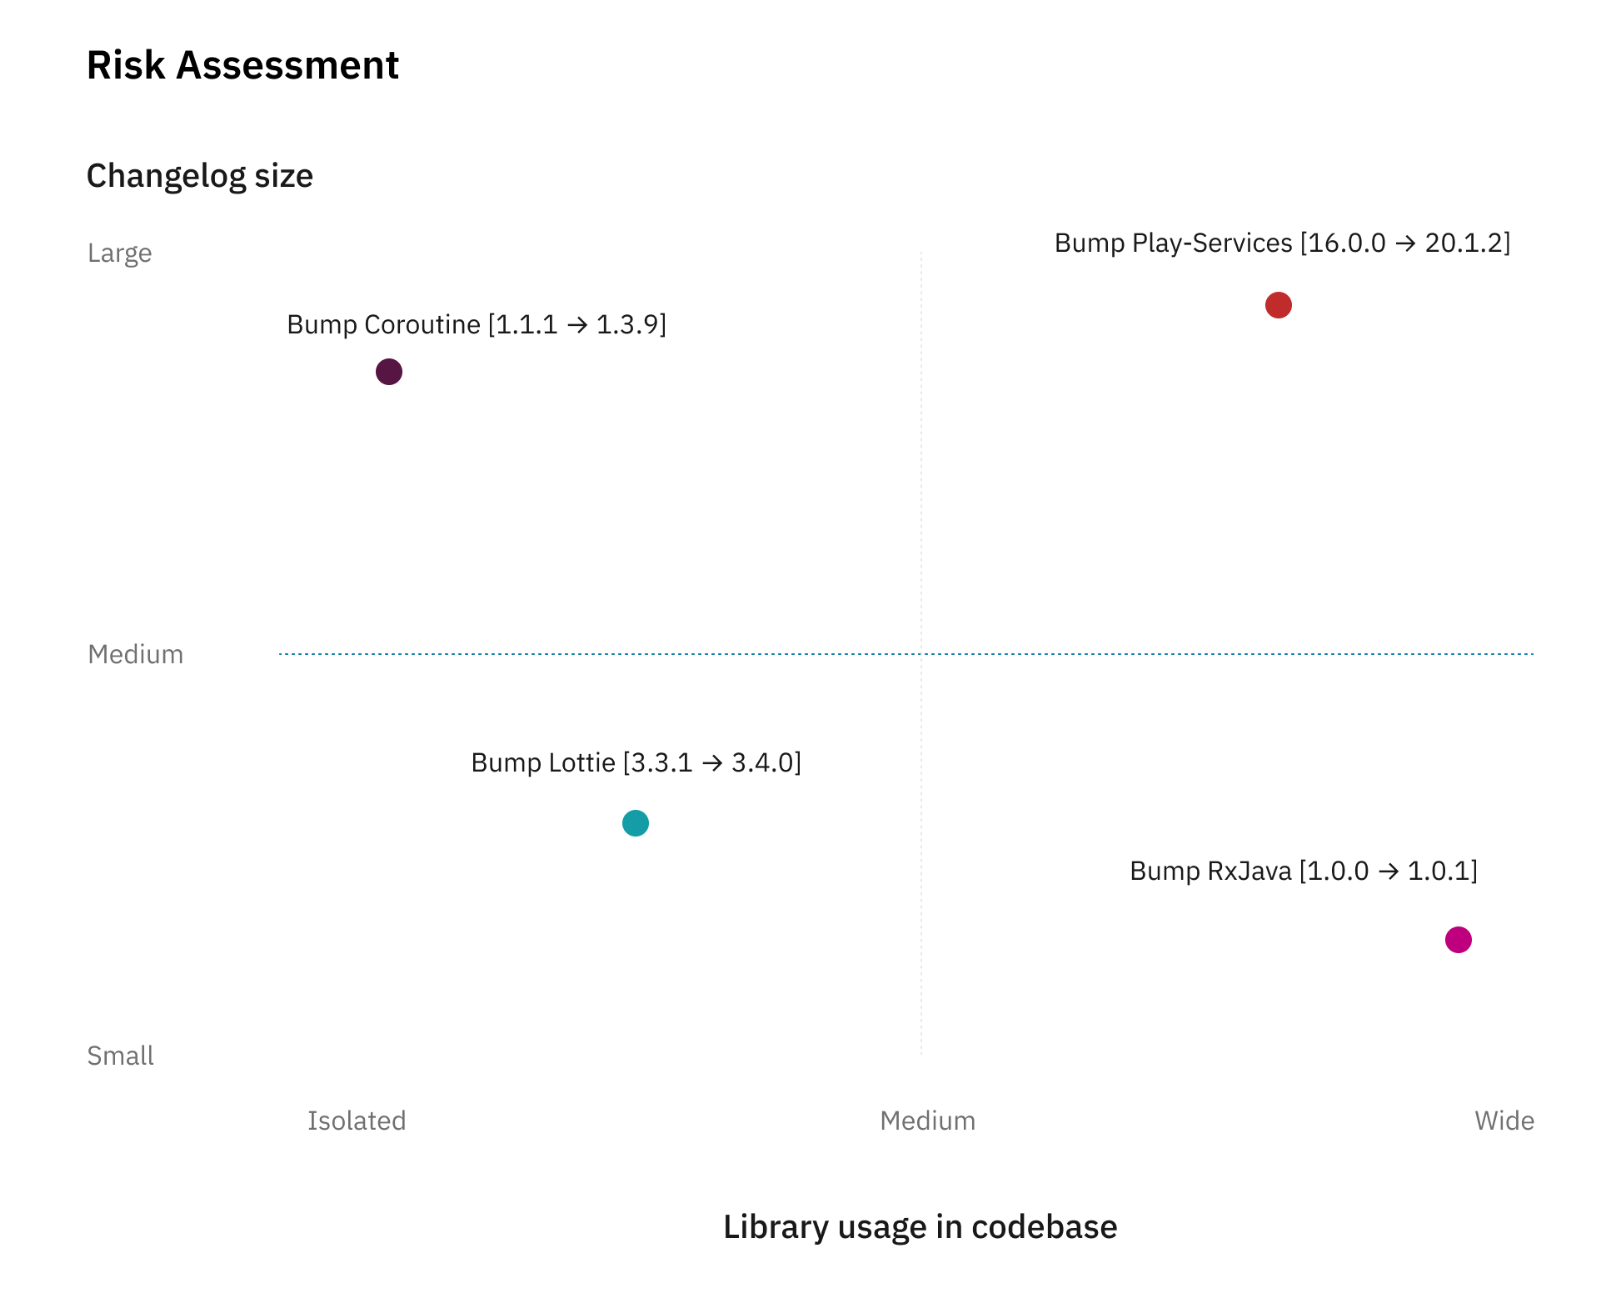
Before updating (bump) a library, we evaluate two metrics:
the usage of this library in the codebase.
the number of changes introduced in the library between the current version and the targeted version.
The risk needs to be assessed between the number of usages of a certain library and the size of the changes. The following chart illustrate this point.
Risk Assessment Radar
This arbitrary scale helps us in deciding if we will require additional signoff from the QA team. If the estimation places the item on the bottom-left corner, the update will be less risky while if it’s on the top-right corner, it means we should follow extra verification to reduce the risk.
A good practice to reduce the risks of updating a library is to update it frequently, decreasing the diffs hence reducing the scope of impact.
Reducing the risk
The first thing we’re doing to reduce the risk is to update our libraries on a weekly basis. As described above, small changes are always less risky than large changes even if the usage of this partial library is wide. By following incremental updates, we avoid accumulating potential issues over a longer period of time.
For example, the Android Jetpack and Firebase libraries follow a two-week release train. So every two weeks, we check for new updates, read the changelogs, and proceed with the update.
In case of a defect detected, we can easily revert the change until we figure out a proper solution or raise the issue to the library owner.
Automation
To reduce risk on any merge request (not limited to library update), we’ve spent a tremendous amount of effort on automating tests. For each new feature we’ve a set of test cases written in Gherkin syntax.
Automation is implemented as UI tests that run on continuous integration (CI) for every merge request. If those tests fail, we won’t be able to merge any changes.
To further elaborate, let’s take this example: Team A developed a lot of features and now has a total of 1,000 test cases. During regression testing before each release, only a subset of those are executed manually based on the impacted area. With automation in place, team A now has 60% of those tests executed as part of CI. So, when all the tests successfully pass, we’re already 60% confident that no defect is detected. This tremendously increases our confidence level while reducing manual testing.
QA signoff
When the update is in the risk threshold area and the automation tests are insufficient, the developer works with QA engineers on analyzing impacted areas. They would then execute test cases related to the impacted area.
For example, if we’re updating Facebook library, the impacted area would be the “Login with Facebook” functionality. QA engineers would then run test cases related to social login.
A single or multiple team can be involved. In some cases, QA signoff can be required by all the teams if they’re all affected by the update.
This process requires a lot of effort from different teams and can affect the current roadmap. To avoid falling into this category, we refine the impacted area analysis to be as specific as possible.
Update before it becomes mandatory
Google updates the Google Play requirements regularly to ensure that published apps are fully compatible with the latest Android version.
For example, starting 1st November 2020 all apps must target API 29. This change causes behavior changes for some API. New behavior has to be supported and verified for our code, but also for all the libraries we use. Libraries bundled inside our app are also affected if they’re using Android API. However, the support for newer API is done by each library maintainer. By keeping our libraries up to date, we ensure compatibility with the latest Android API.
Key takeaways
Keep updating your libraries. If they’re following a release plan, try to match it so it won’t accumulate too many changes. For every new release at Grab, we ship a new version each week, which includes between 5 to 10 libraries bump.
For each update, identify the potential risks on your app and find the correct balance between risk and effort required to mitigate this. Don’t overestimate the risk, especially if the changes are minimal and only include some minor bug fixing. Some library updates don’t even change any single line of code and are only documentation updates.
Invest in robust automation testing to create a high confidence level when making changes, including potentially large changes like a huge library bump.
Authored by Lucas Nelaupe on behalf of the Grab Android Development team. Special thanks to Tridip Thrizu and Karen Kue for the design and copyediting contributions.
Join us
Grab is more than just the leading ride-hailing and mobile payments platform in Southeast Asia. We use data and technology to improve everything from transportation to payments and financial services across a region of more than 620 million people. We aspire to unlock the true potential of Southeast Asia and look for like-minded individuals to join us on this ride.
If you share our vision of driving South East Asia forward, apply to join our team today.
The collective thoughts of the interwebz
Manage Consent
To provide the best experiences, we use technologies like cookies to store and/or access device information. Consenting to these technologies will allow us to process data such as browsing behavior or unique IDs on this site. Not consenting or withdrawing consent, may adversely affect certain features and functions.
Functional
Always active
The technical storage or access is strictly necessary for the legitimate purpose of enabling the use of a specific service explicitly requested by the subscriber or user, or for the sole purpose of carrying out the transmission of a communication over an electronic communications network.
Preferences
The technical storage or access is necessary for the legitimate purpose of storing preferences that are not requested by the subscriber or user.
Statistics
The technical storage or access that is used exclusively for statistical purposes.The technical storage or access that is used exclusively for anonymous statistical purposes. Without a subpoena, voluntary compliance on the part of your Internet Service Provider, or additional records from a third party, information stored or retrieved for this purpose alone cannot usually be used to identify you.
Marketing
The technical storage or access is required to create user profiles to send advertising, or to track the user on a website or across several websites for similar marketing purposes.