[$] Standardizing BPF

Post Syndicated from original https://lwn.net/Articles/926882/

The extended BPF (eBPF) virtual machine
allows programs to be loaded into and executed with the kernel — and,
increasingly, other environments. As the use of BPF grows, so does
interest in defining what the BPF virtual machine actually is. In an
effort to ensure a consistent and fair environment for defining what
constitutes the official BPF language and run-time environment, and to
encourage NVMe vendors to support BPF offloading, a recent effort
has been undertaken to standardize BPF.

10 Stories from 10 Years of Drive Stats Data

Post Syndicated from original https://www.backblaze.com/blog/10-stories-from-10-years-of-drive-stats-data/

On April 10, 2013, Backblaze saved our first daily hard drive snapshot file. We had decided to start saving these daily snapshots to improve our understanding of the burgeoning collection of hard drives we were using to store customer data. That was the beginning of the Backblaze Drive Stats reports that we know today.

Little did we know at the time that we’d be collecting the data for the next 10 years or writing various Drive Stats reports that are read by millions, but here we are.

I’ve been at Backblaze longer than Drive Stats and probably know the drive stats data and history better than most, so let’s spend the next few minutes getting beyond the quarterly and lifetime tables and charts and I’ll tell you some stories from behind the scenes of Drive Stats over the past 10 years.

1. The Drive Stats Light Bulb Moment

I have never been able to confirm whose idea it was to start saving the Drive Stats data. The two Brians—founder Brian Wilson, our CTO before he retired and engineer Brian Beach, our current CTO—take turns eating humble pie and giving each other credit for this grand experiment.

But, beyond the idea, one Brian or the other also had to make it happen. Someone had to write the Python scripts to capture and process the data, and then deploy these scripts across our fleet of shiny red Storage Pods and other storage servers, and finally someone also had to find a place to store all this newly captured data. My money’s on—to paraphrase Mr. Edison—founder Brian being the 1% that is inspiration, and engineer Brian being the 99% that is perspiration. The split could be 90/10 or even 80/20, but that’s how I think it went down.

2. The Experiment Begins

In April 2013, our Drive Stats data collection experiment began. We would collect and save basic drive information, including the SMART statistics for each drive, each day. The effort was more than a skunkworks project, but certainly not a full-fledged engineering project. Conducting such experiments has been part of our DNA since we started and we continue today, albeit with a little more planning and documentation. Still the basic process—try something, evaluate it, tweak it, and try again—still applies, and over the years, such experiments have led to the development of our Storage Pods and our Drive Farming efforts.

Our initial goal in collecting the Drive Stats data was to determine if it would help us better understand the failure rates of the hard drives we were using to store data. Questions that were top of mind included: Which drive models lasted longer? Which SMART attributes really foretold drive health? What is the failure rate of different models? And so on. The answers, we hoped, would help us make better purchasing and drive deployment decisions.

3. Where “Drive Days” Came From

To compute a failure rate of a given group of drives over a given time period, you might start with two pieces of data: the number of drives, and the number of drive failures over that period of time. So, if over the last year, you had 10 drives and one failed, you could say the 10% failure rate for the year. That works for static systems, but data centers are quite different. On a daily basis, drives enter and leave the system. There are new drives, failed drives, migrated drives, and so on. In other words, the number of drives is probably not consistent across a given time period. To address this issue, CTO Brian (current CTO Brian that is) worked with professors from UC Santa Cruz on the problem and the idea of Drive Days was born. A drive day is one drive in operation for one day, so one drive in operation for ten days is ten drive days.

To see this in action you start by defining the cohort of drives and the time period you want and then apply the following formula to get the Annualized Failure Rate (AFR).

AFR = ( Drive Failures / ( Drive Days / 365 ) )

This simple calculation allows you to compute an Annualized Failure Rate for any cohort of drives over any period of time and accounts for a variable number of drives over that period.

4. Wait! There’s No Beginning?

In testing out our elegantly simple AFR formula, we discovered a problem. Not with the formula, but with the data. We started collecting data on April 10, 2013, but many of the drives were present before then. If we wanted to compute the AFR of model XYZ for 2013, we could not count the number of drive days those drives had prior to April 10—there were none.

Never fear, SMART 9 raw value to the rescue. For the uninitiated, the SMART 9 raw value contains the number of power-on hours for a drive. A little math gets you the number of days—that is Drive Days—and you are ready to go. This little workaround was employed whenever we needed to work with drives that came into service before we started collecting data.

Why not use SMART 9 all of the time? A couple of reasons. First, sometimes the value gets corrupted. Especially when the drive is failing, it could be zero or a million or anywhere in between. Second, a new drive can have non-default SMART values. Perhaps it is just part of the burn in process or a test group at the manufacturer, or maybe the drive was a return that passed some qualification process.

Regardless, the starting value of SMART 9 wasn’t consistent across drives, so we just counted operational days in our environment and used SMART 9 as a substitute only when we couldn’t count those days. Using SMART 9 is moot now as these days there are no drives left in the current drive collection which were present prior to April 2013.

5. There’s Gold In That There Data

While the primary objective of collecting the data was to improve our operations, there was always another potential use lurking about—to write a blog post, or two, or 56. Yes, we’ve written 56 blog posts and counting based on our Drive Stats data. And no, we could have never imagined that would be the case when this all started back in 2013.

The very first Drive Stats-related blog post was written by Brian Beach (current CTO Brian, former engineer Brian) in November 2013 (we’ve updated it since then). The post had the audacious title of “How Long Do Disk Drives Last?” and a matching URL of “www.backblaze.com/blog/how-long-do-disk-drives-last/”. Besides our usual blog readers, search engines were falling all over themselves referring new readers to the site based on searches for variants of the title and the post became first page search material for multiple years. Alas, all Google things must come to an end, as the post disappeared into page two and then the oblivion beyond.

Buoyed by the success of the first post, Brian went on to write several additional posts over the next year or so based on the Drive Stats data.

That’s an impressive body of work, but Brian is, by head and heart, an engineer, and writing blog posts meant he wasn’t writing code. So after his post to open source the Drive Stats data in February 2015, he passed the reins of this nascent franchise over to me.

6. What’s in a Name?

When writing about drive failure rates, Brian used the term “Hard Drive Reliability” in his posts. When I took over, beginning with the Q1 2015 report, we morphed the term slightly to “Hard Drive Reliability Stats.” That term lasted through 2015 and in Q1 2016 it was shortened to “Hard Drive Stats.” I’d like to tell you there was a great deal of contemplation and angst that went into the decision, but the truth is the title of the Q1 2016 post “One Billion Drive Hours and Counting: Q1 2016 Hard Drive Stats,” was really long and we left out the word reliability so it wouldn’t be any longer—something about title length, the URL, search terms, and so on. The abbreviated version stuck and to this day we publish “Hard Drive Stats” reports. That said, we often shorten the term even more to just “Drive Stats,” which is technically more correct given we have solid state drives (SSDs), not just hard disk drives (HDDs), in the dataset when we talk about boot drives.

7. Boot Drives

Beginning in Q4 2013, we began collecting and storing failure and SMART stats data from some of the boot drives that we use on our storage servers in the Drive Stats data set. Over the first half of 2014, additional boot drive models were configured to report their data and by Q3 2014, all boot drives were reporting. Now the Drive Stats dataset contained both data from the data drives and the boot drives of our storage servers. There was one problem: there was no field for drive source. In other words, to distinguish a data drive from a boot drive, you needed to use the drive model.

In Q4 2018, we began using SSDs as boot drives and began collecting and storing drive stats data from the SSDs as well. Guess what? There was no drive type field either, so SSD and HDD boot drives had to be distinguished by their model numbers. Our engineering folks are really busy on product and platform features and functionality, so we use some quick-and-dirty SQL on the post-processing side to add the missing information.

The boot drive data sat quietly in the Drive Stats dataset for the next few years until Q3 2021 when we asked the question “Are SSDs Really More Reliable Than Hard Drives?” That’s the first time the boot drive data was used. In this case, we compared the failure rates of SSDs and HDDs over time. As the number of boot drive SSDs increased, we started publishing a semi-annual report focused on just the failure rates for the SSD boot drives.

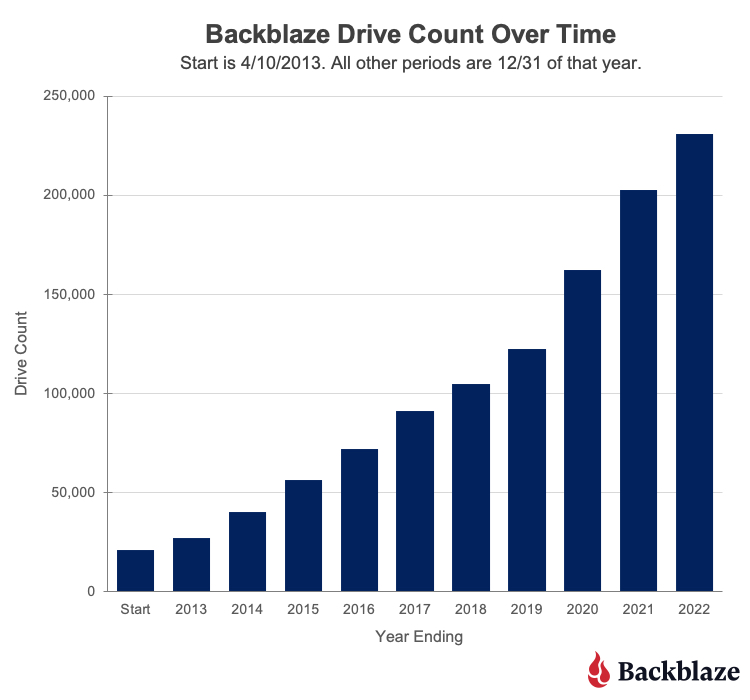
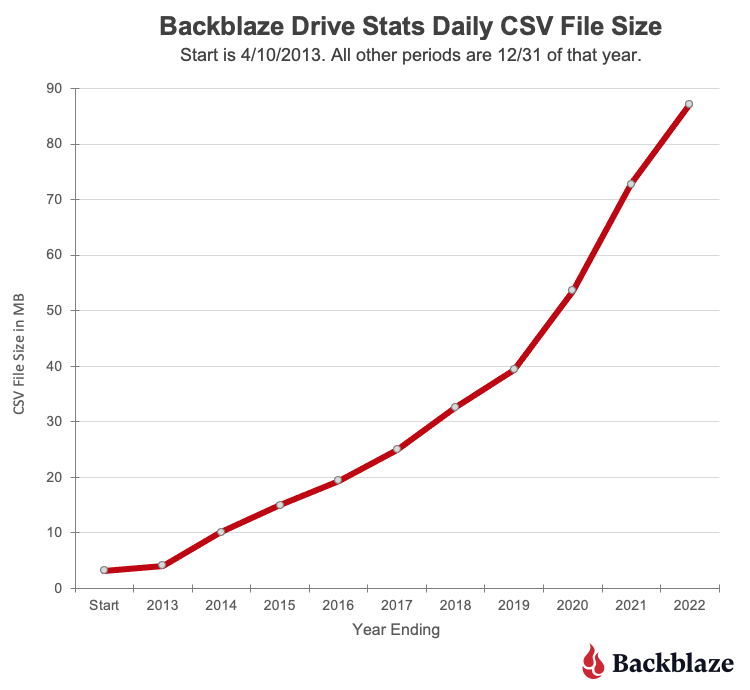
8. More Drives = More Data

On April 10, 2013, data was collected for 21,195 hard drives. The .csv data file for that day was 3.2MB. The numbers of drives and the amount of data has grown just a wee bit since then, as you can see in the following charts.

The current size of a daily Drive Stats .csv file is over 87MB. If you downloaded the entire Drive Stats dataset, you would need 113GB of storage available once you unzipped all the data files. If you are so inclined, you’ll find the data on our Drive Stats page. Once there, open the “Downloading the Raw HD Test Data” link to see a complete list of the files available.

9. Who Uses The Drive Stats Dataset?

Over the years, the Drive Stats dataset has been used in multiple ways for different reasons. Using Google Scholar, you can currently find 660 citations for the term “Backblaze hard drive stats” going back to 2014. This includes 18 review articles. Here are a couple of different ways the data has been used.

      • As a teaching tool: Several universities and similar groups have used the dataset as part of their computer science, data analytics, or statistics classes. The dataset is somewhat large, but it’s still manageable, and can be divided into yearly increments if needed. In addition, it is reasonably standardized, but not perfect, providing a good data cleansing challenge. The different drive models and variable number of drive counts allows students to practice data segmentation across the various statistical methods they are studying.
      • For artificial intelligence (AI) and machine learning: Over the years several studies have been conducted using AI and machine learning techniques applied to the Drive Stats data to determine if drive failure or drive health is predictable. We looked at one method from Interpretable on our blog, but there are several others. The results have varied, but the general conclusion is that while you can predict drive failure to some degree, the results seem to be limited to a given drive model.

10. Drive Stats Experiments at Backblaze

Of course, we also use the Drive Stats data internally at Backblaze to inform our operations and run our own experiments. Here are a couple examples:

      • Inside Backblaze: Part of the process in developing and productizing the Backblaze Storage Pod was the development of the software to manage the system itself. Almost from day one, we used certain SMART stats to help determine if a drive was not feeling well. In practice, other triggers such as ATA errors or FSCKs alerts, will often provide the first indicator of a problem. We then apply the historical and current SMART stats data that we have recorded and stored to complete the analysis. For example, we receive an ATA error on a given drive. There could be several non-drive reasons for such an error, but we can quickly determine that the drive has a history of increasing bad media and command timeouts values over time. Taken together, it could be time to replace that drive.
      • Trying new things: The Backblaze Evangelism team decided that SQL was too slow when accessing the Drive Stats data. They decided to see if they could use a combination of Parquet and Trino to make the process faster. Once they had done that, they went to work duplicating some of the standard queries we run each quarter in producing our Drive Stats Reports.

What Lies Ahead

First, thank you for reading and commenting on our various Drive Stats Reports over the years. You’ve made us better and we appreciate your comments—all of them. Not everyone likes the data or the reports, and that’s fine, but most people find the data interesting and occasionally useful. We publish the data as a service to the community at large, and we’re glad many people have found it helpful, especially when it can be used in teaching people how to test, challenge, and comprehend data—a very useful skill in navigating today’s noise versus knowledge environment.

We will continue to gather and publish the Drive Stats dataset each quarter for as long as it is practical and useful to our readers. That said, I can’t imagine we’ll be writing Drive Stats reports 10 years from now, but just in case, if anyone is interested in taking over, just let me know.

The post 10 Stories from 10 Years of Drive Stats Data appeared first on Backblaze Blog | Cloud Storage & Cloud Backup.

What is BIMI and how to use it with Amazon SES

Post Syndicated from Matt Strzelecki original https://aws.amazon.com/blogs/messaging-and-targeting/what-is-bimi-and-how-to-use-it-with-amazon-ses/

Introduction

In this blog post I’d like to walk you through how to implement BIMI while using Amazon SES. For your information BIMI can be best described by the following excerpt from bimigroup.org:

Brand Indicators for Message Identification or BIMI (pronounced: Bih-mee) is an emerging email specification that enables the use of brand-controlled logos within supporting email clients. BIMI leverages the work an organization has put into deploying DMARC protection, by bringing brand logos to the customer’s inbox. For the brand’s logo to be displayed, the email must pass DMARC authentication checks, ensuring that the organization’s domain has not been impersonated.

Brands continually need to protect themselves from spoofing and phishing from bad actors who can damage the trust that customers and recipients have in those brands. Brand Indicators for Message Identification (BIMI) is an email specification that enables email inboxes to display a brand’s logo next to the brand’s authenticated email messages within supporting email clients. BIMI is an email specification that’s directly connected to authentication, but it’s not a standalone email authentication protocol as it requires all your email to comply with DMARC authentication. Recipients are more likely to engage with email that displays the logo of the brand associated with the message author. Higher engagement helps deliverability and inbox placement because it indicates that the recipients trust your brand. BIMI is a great brand protector in email and provides a better user experience for the end recipients and customers.

BIMI requires that you authenticate all of your organization’s email with SPF, DKIM and DMARC. In this how-to we will be utilizing Amazon SES to authenticate the emails, Amazon S3 to host the SVG image, and Amazon Route53 to add DNS records. We will be walking through how to accomplish each step until completion.

Note: While we’re using AWS products in this how-to, it is not a requirement to use all AWS products to implement BIMI. Any hosting provider for content or domain can be used however the steps may differ based on the provider you use.

BIMI Implementation

The following are the steps needed to prepare your SES account and domain for BIMI:

Step 1

Note: If you already have SPF, DKIM, and DMARC enabled for your domain (with 100% as the rate for DMARC) you can move on to Step 2.

Enable Easy DKIM for your domain

  1. Sign in to the AWS Management Console and open the Amazon SES console at https://console.aws.amazon.com/ses/.
  2. In the navigation pane, under Configuration, choose Verified identities.
  3. In the list of identities, choose an identity where the Identity type is Domain.

Note: If you need to create or verify a domain, see Creating a domain identity.

  1. Under the Authentication tab, in the DomainKeys Identified Mail (DKIM) container, choose Edit.
  2. In the Advanced DKIM settings container, choose the Easy DKIM button in the Identity type field.
  3. In the DKIM signing key length field, choose either RSA_2048_BIT or RSA_1024_BIT.
  4. In the DKIM signatures field, check the Enabled box.
  5. Choose Save changes.
  6. Now that you’ve configured your domain identity with Easy DKIM, you must complete the verification process with your DNS provider – proceed to Verifying a DKIM domain identity with your DNS provider and follow the DNS authentication procedures for Easy DKIM.

Create a DMARC record for your domain

  1. Sign in to the AWS Management Console and open the Route 53 console at https://console.aws.amazon.com/route53/
  2. In the navigation pane, choose Hosted zones.
  3. On the Hosted zones page, choose the name of the hosted zone that you want to create records in.
  4. Choose and define the applicable routing policy and the following values:
Name Record Type Value
_dmarc.example.com TXT v=DMARC1;p=quarantine;pct=100;rua=mailto:[email protected]
  1. Choose Create records.

Note: The DMARC policy must enforce at 100% and include either a quarantine or reject policy. (i.e. p=reject or p=quarantine) to meet the DMARC authentication requirement. This may mean you will need to update your existing policy and DMARC record.

Configure a Custom Mail From for your sending domain

  1. Open the Amazon SES console at https://console.aws.amazon.com/ses/.
  2. In the left navigation pane, under Configuration, choose Verified identities.
  3. In the list of identities, choose the identity you want to configure where the Identity type is Domain and Status is Verified.

a. If the Status is Unverified, complete the procedures at Verifying a DKIM domain identity with your DNS provider to verify the email address’s domain.

  1. At the bottom of the screen in the in the Custom MAIL FROM domain pane, choose Edit .
  2. In the General details pane, do the following:

a. Select the Use a custom MAIL FROM domain checkbox.

b. For MAIL FROM domain, enter the subdomain that you want to use as the MAIL FROM domain.

c. For Behavior on MX failure, choose one of the following options:

    • Use default MAIL FROM domain – If the custom MAIL FROM domain’s MX record is not set up correctly, Amazon SES uses a subdomain of amazonses.com. The subdomain varies based on the AWS Region that you use Amazon SES in.
    • Reject message – If the custom MAIL FROM domain’s MX record is not set up correctly, Amazon SES returns a MailFromDomainNotVerified error. Emails that you attempt to send from this domain are automatically rejected. If you want to ensure that 100% of your email is BIMI compatible, then you should choose the reject message option.

d. Choose Save changes – you’ll be returned to the previous screen.

  1. Publish the MX and SPF (type TXT) records to the DNS server of the custom MAIL FROM domain:

Note: In the Custom MAIL FROM domain pane, the Publish DNS records table now displays the MX and SPF (type TXT) records in that you have to publish (add) to your domain’s DNS configuration. These records use the formats shown in the following table.

Name Record Type Value
subdomain.example.com MX 10 feedback-smtp.region.amazonses.com
subdomain.example.com TXT v=spf1 include:amazonses.com ~all

Step 2

Produce an SVG Tiny PS version of your official logo

In order to display your logo in the email it must conform to the specifications of the BIMI requirements. To meet these requirements the logo must be a Scalable Vector Graphics (SVG) image and must meet the Tiny PS Specification. Once your image meets this requirement you can move on to the next step.

Note: bimigroup.org outlines this process and includes references to software to assist with this process.

Step 3

Upload your image to an S3 bucket

  1. Sign in to the AWS Management Console and open the Amazon S3 console at https://console.aws.amazon.com/s3/
  2. In the Buckets list, choose the name of the bucket that you want to upload your folders or files to.
  3. Choose Upload.
  4. In the Upload window, do one of the following:
    • Drag and drop files and folders to the Upload window.
    • Choose Add file choose your SVG image to upload, and choose Open.

To configure additional object properties

  1. To change access control list permissions, choose Permissions.
  2. Under Access control list (ACL), edit the permissions.
    • You need to grant read access to your objects to the public (everyone in the world) for the SVG image you are uploading. However, we recommend not changing the default setting for your bucket to public read access.
  1. To configure other additional properties, choose Properties.
  2. To upload your objects, choose Upload.

Note: Amazon S3 uploads your object. When the upload completes, you can see a success message on the Upload: status page.

  1. Choose Exit.

Step 4

Publish a BIMI record for your domain

  1. Sign in to the AWS Management Console and open the Route 53 console at https://console.aws.amazon.com/route53/
  2. In the navigation pane, choose Hosted zones.
  3. On the Hosted zones page, choose the name of the hosted zone that you want to create records in.
  4. Choose and define the applicable routing policy and the following values with the understanding the URLs must be HTTPS:
Name Record Type Value
default._bimi.example.com TXT v=BIMI1; l=[SVG URL]; a=[PEM URL]
  1. Choose Create records.

Note: the a= tag is currently optional and will not be used in this example.

You can validate your BIMI record with a tool like the BIMI Inspector.

Conclusion

All of the steps to set up your SES account and your domain are now complete. The final component in this process is to have regular sending patterns to the mailbox providers that support BIMI logo placement. Your domain should have a regular delivery cadence and needs to have a good reputation with the mailbox providers you are sending mail. BIMI logo placement may take time to populate to mailbox providers where you don’t have an established reputation or sending cadence. The time spent implementing BIMI is well worth it as it will strengthen your sender reputation and create a better and more trusted customer experience for your end recipients.

You can find more information about the BIMI specification here.

Security updates for Monday

Post Syndicated from original https://lwn.net/Articles/928667/

Security updates have been issued by Debian (openimageio and udisks2), Fedora (chromium, curl, kernel, mediawiki, and seamonkey), Oracle (httpd:2.4), Red Hat (httpd and mod_http2 and tigervnc), SUSE (ghostscript and kernel), and Ubuntu (irssi).

LLMs and Phishing

Post Syndicated from Bruce Schneier original https://www.schneier.com/blog/archives/2023/04/llms-and-phishing.html

Here’s an experiment being run by undergraduate computer science students everywhere: Ask ChatGPT to generate phishing emails, and test whether these are better at persuading victims to respond or click on the link than the usual spam. It’s an interesting experiment, and the results are likely to vary wildly based on the details of the experiment.

But while it’s an easy experiment to run, it misses the real risk of large language models (LLMs) writing scam emails. Today’s human-run scams aren’t limited by the number of people who respond to the initial email contact. They’re limited by the labor-intensive process of persuading those people to send the scammer money. LLMs are about to change that. A decade ago, one type of spam email had become a punchline on every late-night show: “I am the son of the late king of Nigeria in need of your assistance….” Nearly everyone had gotten one or a thousand of those emails, to the point that it seemed everyone must have known they were scams.

So why were scammers still sending such obviously dubious emails? In 2012, researcher Cormac Herley offered an answer: It weeded out all but the most gullible. A smart scammer doesn’t want to waste their time with people who reply and then realize it’s a scam when asked to wire money. By using an obvious scam email, the scammer can focus on the most potentially profitable people. It takes time and effort to engage in the back-and-forth communications that nudge marks, step by step, from interlocutor to trusted acquaintance to pauper.

Long-running financial scams are now known as pig butchering, growing the potential mark up until their ultimate and sudden demise. Such scams, which require gaining trust and infiltrating a target’s personal finances, take weeks or even months of personal time and repeated interactions. It’s a high stakes and low probability game that the scammer is playing.

Here is where LLMs will make a difference. Much has been written about the unreliability of OpenAI’s GPT models and those like them: They “hallucinate” frequently, making up things about the world and confidently spouting nonsense. For entertainment, this is fine, but for most practical uses it’s a problem. It is, however, not a bug but a feature when it comes to scams: LLMs’ ability to confidently roll with the punches, no matter what a user throws at them, will prove useful to scammers as they navigate hostile, bemused, and gullible scam targets by the billions. AI chatbot scams can ensnare more people, because the pool of victims who will fall for a more subtle and flexible scammer—one that has been trained on everything ever written online—is much larger than the pool of those who believe the king of Nigeria wants to give them a billion dollars.

Personal computers are powerful enough today that they can run compact LLMs. After Facebook’s new model, LLaMA, was leaked online, developers tuned it to run fast and cheaply on powerful laptops. Numerous other open-source LLMs are under development, with a community of thousands of engineers and scientists.

A single scammer, from their laptop anywhere in the world, can now run hundreds or thousands of scams in parallel, night and day, with marks all over the world, in every language under the sun. The AI chatbots will never sleep and will always be adapting along their path to their objectives. And new mechanisms, from ChatGPT plugins to LangChain, will enable composition of AI with thousands of API-based cloud services and open source tools, allowing LLMs to interact with the internet as humans do. The impersonations in such scams are no longer just princes offering their country’s riches. They are forlorn strangers looking for romance, hot new cryptocurrencies that are soon to skyrocket in value, and seemingly-sound new financial websites offering amazing returns on deposits. And people are already falling in love with LLMs.

This is a change in both scope and scale. LLMs will change the scam pipeline, making them more profitable than ever. We don’t know how to live in a world with a billion, or 10 billion, scammers that never sleep.

There will also be a change in the sophistication of these attacks. This is due not only to AI advances, but to the business model of the internet—surveillance capitalism—which produces troves of data about all of us, available for purchase from data brokers. Targeted attacks against individuals, whether for phishing or data collection or scams, were once only within the reach of nation-states. Combine the digital dossiers that data brokers have on all of us with LLMs, and you have a tool tailor-made for personalized scams.

Companies like OpenAI attempt to prevent their models from doing bad things. But with the release of each new LLM, social media sites buzz with new AI jailbreaks that evade the new restrictions put in place by the AI’s designers. ChatGPT, and then Bing Chat, and then GPT-4 were all jailbroken within minutes of their release, and in dozens of different ways. Most protections against bad uses and harmful output are only skin-deep, easily evaded by determined users. Once a jailbreak is discovered, it usually can be generalized, and the community of users pulls the LLM open through the chinks in its armor. And the technology is advancing too fast for anyone to fully understand how they work, even the designers.

This is all an old story, though: It reminds us that many of the bad uses of AI are a reflection of humanity more than they are a reflection of AI technology itself. Scams are nothing new—simply intent and then action of one person tricking another for personal gain. And the use of others as minions to accomplish scams is sadly nothing new or uncommon: For example, organized crime in Asia currently kidnaps or indentures thousands in scam sweatshops. Is it better that organized crime will no longer see the need to exploit and physically abuse people to run their scam operations, or worse that they and many others will be able to scale up scams to an unprecedented level?

Defense can and will catch up, but before it does, our signal-to-noise ratio is going to drop dramatically.

This essay was written with Barath Raghavan, and previously appeared on Wired.com.

Kernel prepatch 6.3-rc6

Post Syndicated from original https://lwn.net/Articles/928626/

The 6.3-rc6 kernel prepatch is out for
testing.

But before the festivities can begin, we still need to take care of
business: Sunday still means another release candidate. Those
rascally (and biologically confused) egg-laying rabbits must not
distract us from kernel development.

How To Change Core Count and TDP of Intel Xeon Y CPUs on Dell PowerEdge

Post Syndicated from Peter Liu original https://www.servethehome.com/how-to-change-core-count-and-tdp-of-intel-xeon-y-cpus-on-dell-poweredge-sst-pp/

We show you how to easily select the Intel SST-PP profile on an Intel Xeon CPU using a Dell PowerEdge to change core count, TDP, and clock speed

The post How To Change Core Count and TDP of Intel Xeon Y CPUs on Dell PowerEdge appeared first on ServeTheHome.

The collective thoughts of the interwebz