Винаги другите са тези, които се измъкват (по терлици)

Post Syndicated from original https://www.toest.bg/vinagi-drugitie-sa-tezi-koito-se-izmukvat-po-terlitsi/
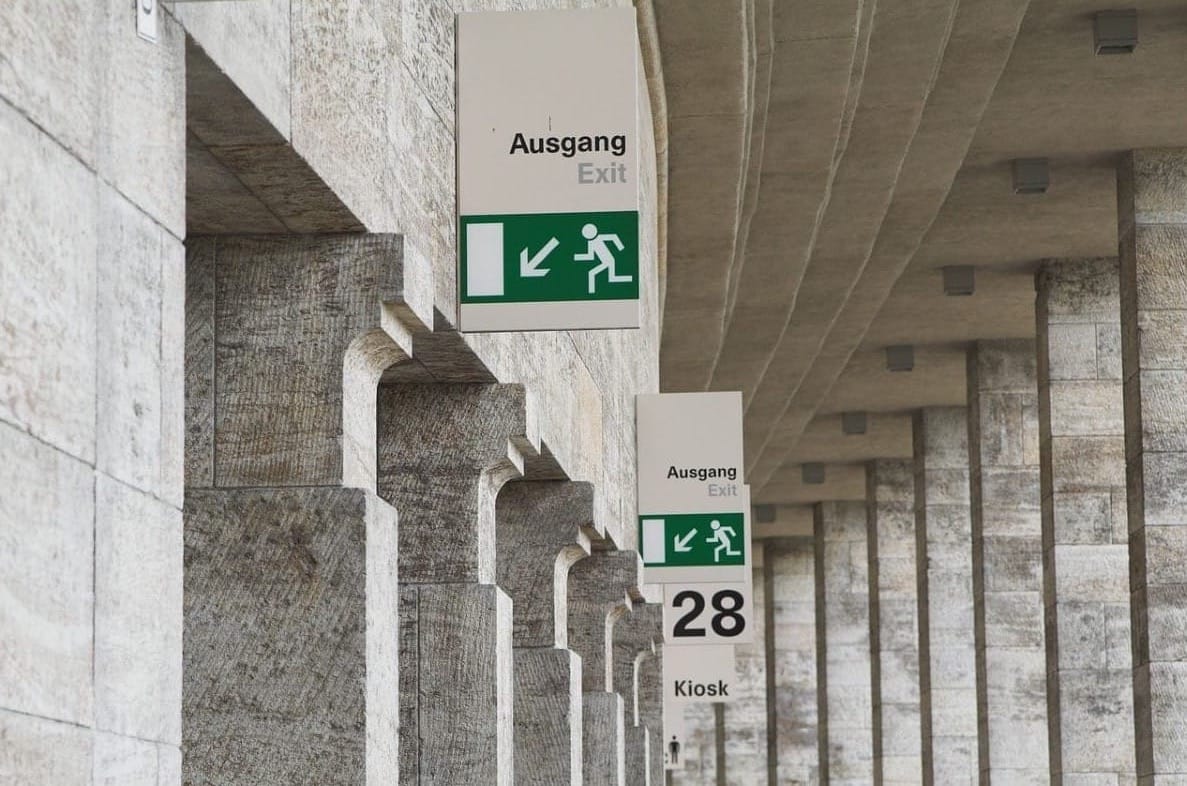
Винаги другите са тези, които се измъкват (по терлици)

Ако на 17 март сте пропуснали да отпразнувате Деня на свети Патрик подобаващо, не унивайте. Съвсем спокойно и по всяко друго време може да извършите някоя от дейностите, с които се отбелязва празникът – да се закичите с трилистна детелина, да се облечете в зелено или да се почерпите с пинта „Гинес“. А ако пинтите станат повечко и се наложи, може дори да упражните т.нар. ирландско сбогуване.

Наименованието на последната „дейност“ все още не е сериозно навлязло в българския език, но самата тя – състояща се в това

да си тръгнеш от купон или друго събиране тихомълком и без да се сбогуваш

– със сигурност е добре позната и широко разпространена практика както в България, така и на много други географски ширини. И макар че на дейността като цяло се гледа с неодобрение като проява на лошо възпитание, тя все пак има и известни преимущества.

От практическа гледна точка „ирландското сбогуване“ несъмнено предотвратява загубата на време, тъй като се избягват ненужни формалности. Наскоро попаднах на изследване, проведено сред австралийци. Според резултатите от него хората, които систематично напускат купони, без да се сбогуват, спестяват по цели два дни на година¹. Макар и числото вероятно да варира според конкретния случай, личностните специфики на отделния човек и общоприетите нрави в различни култури, безспорно е, че безкрайните сбогувания в края на социални сбирки могат да погълнат минути, часове (а с натрупване очевидно и цели дни), които бихме могли да вложим в други (по презумпция) по-полезни дейности.

Но извън чисто практичната му полза „ирландското сбогуване“ също така ни предоставя възможност да разгледаме отблизо някои любопитни езикови особености, които от своя страна отразяват още по-любопитни културни, социални и исторически феномени – и то без риск да ни обвинят в неприлични обноски.

Смята се, че

изразът Irish goodbye всъщност произлиза не от Ирландия, а от Америка.

Макар че няма единодушна теория за появата му, според една от версиите, цитирана в базата данни с неологизми на университета „Райс“, изразът е разговорен и води началото си от Бостън, Масачузетс, a употребата му се отнася за някой, който напуска парти, бар или друго социално събиране, защото е пиян и иска да си тръгне, без да разговаря с никого и да разкрива нетрезвото си състояние.

Други, по-сантиментални теории свързват произхода на израза с т.нар. Ирландски картофен глад в средата на XIX век, който принуждава между един и два милиона души да eмигрират от Ирландия, голяма част от които впоследствие се заселват в Америка. Трети пък правят връзка между горните две теории, изтъквайки репутацията на ирландските имигранти и техните потомци като големи пиячи, на които често им се налага да практикуват „ирландското сбогуване“, поради което и самата практика започва да се нарича по този начин.

Както можем да предположим, макар и произходът на конкретния израз да е сравнително скорошен, самата практика е много по-стара, като лингвистите проследяват първообраза му не до другаде, а до родното място на добрите обноски – Англия. Използвайки възможността за пореден път да покажат два пръста² на древните си врагове от другата страна на Ламанша (който те, разбира се, наричат The English Channel), англичаните още от средата на XVIII век – като определение на страхливото оттегляне на французите по време на военни сражения³ – назовават практиката на напускане без сбогуване French leave, а в по-съвременен вариант тя съществува и като French exit.

От английския език изразът се разпространява и навлиза в испанския (despedirse a la francesca) и португалския (sair á francesca), а даже и в словенския (oditi po francosko), гръцкия (την κάνω/το σκάω αλά γαλλικά) и немския (sich auf französisch empfehlen), макар че там съществува и понятието einen polnischen Abgang machen („да направиш полски изход“)⁴.

Както може да се очаква, французите не остават длъжни на англичаните и на свой ред им показват една bras d’honneur, обозначавайки безцеремонното тръгване като filer a l’anglaise, тоест „измъкване по английски“. На свой ред цял набор от други езици заимстват израза, като например унгарският (angolosan távozik), румънският (a o sterge englezeste), полският (wyjść po angielsku), чешкият (vypařit se po anglicku), украинският („пiти по-англiйськи“) и руският („уйти по-английски“)⁵.

Италианците пък, явно предпочитайки да не заемат страна – или пък смятайки англичаните и французите за еднакво невъзпитани, – използват и двете разновидности: както andarsene alla francese, така и filarsela all’inglese.

Както съвсем намясто се отбелязва в статия по темата в Zeit Magazin,

винаги тези, които се измъкват, са другите.

Но не и според българския език, който – като никога! – в този случай се проявява доста по-възпитано и политкоректно от европейските си роднини.

Макар че ирландското, английското и френското сбогуване до известна степен вече са навлезли като фрази и в българския език, той по-скоро разчита на благозвучни, почти ономатопеични и винаги възвратни (тоест насочени не към друг, а към самия извършител на безцеремонното напускане) глаголи, за да назове въпросната практика, например: „изсулвам се“, „измъквам се“, „изнизвам се“, „изнасям се“, „спасявам се“, „чупя се“ и т.н. Някои от другите често използвани глаголи, освен възвратни, са и метафорични: „изпарявам се“, „омитам се“, „омъглявам се“⁶.

А когато изразите съдържат някакво сравнение, се разчита по-скоро на конкретни образи от всекидневието, отколкото на стереотипизиране на цели народи, например: „измъквам се по терлици/пантофи/капли“, „изхлузвам се като мокра връв“, „изнизвам се през задния вход“ или „изпарявам се като дим“. Вероятно всички вие вече сте се досетили и за най-цветистия български израз за въпросната практика, който може и да не обижда ничия национална принадлежност, но със сигурност нарушава добрия тон. (Да, става дума точно за фразата, в която напускането тихомълком се сравнява с друга универсална „човещинка“, или измъкването като „газ“ из „бельо“.)

Тук все пак е справедливо да отбележим, че и в нарочените по-горе за неполиткоректни езици съществуват и „по-дипломатични“ изрази за практиката да се изнижеш без обяснения. В САЩ например като синонимни за Irish goodbye се използва и вече леко остарялото понятие houdini, по името на американския илюзионист, живял в края на XIX и началото на XX век и известен с ловкото си измъкване от белезници, усмирителни ризи и всякакви други примки, както и новопоявилият се (и вече навлязъл и сред младото поколение по света, включително и в България) глагол to ghost, от „призрак“⁷. Французите пък, когато искат да спазят благоприличие и да не обиждат англичаните, използват израза partir comme un voleur („да напуснеш като крадец“).

За финал няма как да не се запитаме какво е положението в самата Ирландия. Според единия от тримата ирландци, до които се допитах, там не съществува конкретен израз, еквивалентен на „ирландско сбогуване“⁸. Другите двама изобщо не ми отговориха, което – вярвам, ще се съгласите – е точно толкова грубо, колкото да си тръгнеш, без да се сбогуваш.

Но все пак изглежда, че не само изразът, а и практиката, поне до известна степен, са достигнали и до Изумрудения остров. Миналата година например гледахме ирландската комедия, взела „Оскар“ за най-добър късометражен игрален филм, чието заглавие – An Irish Goodbye – е директно заимствано от израза. И докато в „Баншите от Инишерин“ – другия ирландски фаворит от 2023 г. – изразът може изобщо да не се споменава, няма как да не отбележим, че в самия център на историята, която филмът разказва, е точно едно абсолютно безцеремонно сбогуване. (Или поне опит за такова, макар и то впоследствие да се превръща в разтегленото сбогуване от алтернативната дефиниция на израза, което – освен че става доста кърваво – трае не часове, а дни наред, отваря нови теми за разговор и претърпява вълнуващи обрати.)⁹

Но дори и изразът Irish goodbye да не се използва в Ирландия, там сбогуването – както рязкото, така и разтегленото във времето и пространството – несъмнено е на почит10. Достатъчно е да споменем (без да се лъжем, че сме го чели) един от шедьоврите на ирландската литература: романа „Бдение над Финеган“ на Джеймс Джойс. Повествованието в него хем се разпростира подобно на болезнено дълго пиянско бълнуване, чийто край сякаш никога няма да настъпи (малко като настоящия текст), хем завършва напълно внезапно, без никакво предупреждение и по средата на изречението – съвсем в стила на ирландското сбогуване. 

1 Според въпросното проучване, цитирано в различни новинарски сайтове и социални медии в средата на март, са анкетирани 2000 австралийци, които посещават средно по 25 партита на година, като на всеки от тях му отнема средно по 45 минути да се сбогува, преди да си тръгне, което се равнява на 18 часа и 45 минути на година. Изследването се приписва на Института по управление на времето на Университета на Нов Южен Уелс в Сидни, но аз не откривам такъв институт на сайта на университета, нито пък споменаване на подобно изследване. Все пак изчисленията звучат правдоподобно.

2 Показването на два пръста е британският еквивалент на универсалния вулгарен знак със среден пръст. Легендата проследява появата на първия жест до Стогодишната война (1337–1453), когато французите пленявали английските стрелци с лък и им отрязвали показалеца и средния пръст, за да им попречат да използват лъка, а незаловените стрелци започнали да показват знака V със същите два пръста като символ на неподчинение на французите.

3 Сред историческите източници няма консенсус дали английското French leave предхожда френското filer a l’anglaise, или обратното, но повечето лингвисти смятат, че и двата израза са се появили в резултат на взаимни обиди в страхливост между френски и английски войници по време на Седемгодишната война (1756–1763), а след това са започнали да се използват като определение на случаите, когато гости на бал или прием си тръгвали, без да се сбогуват с домакините.

4 Според статия в Zeit Magazin от 2014 г., докато по-старият израз „да се сбогуваш по френски“ (sich auf französisch empfehlen/verabschieden) е по-популярен в Западна Германия, в Източна Германия по-често се използва изразът със сходно значение „да направиш полски изход“ (einen polnischen Abgang machen). В статията се цитира научно изследване на германиста Дирк Рамтор, според което вторият израз произлиза от годините след падането на Берлинската стена, когато германците са имали навика да се шегуват на гърба на поляците и да ги набеждават, че са крадливи.

5 В руския си вариант изразът даже се появява в сценария „Как-то так всё вышло…“, който Владимир Висоцки пише в началото на 70-те години: „Снова возникли разговоры, все забыли про барда, и он незаметно ускользнул с женщиной, которой взгляд так безошибочно засек. Так сказать, ушел по-английски.“

6 Като става дума за (само)рефлексивност, мой близък от Швеция се пошегува с пословичната скандинавска социална скованост и каза, че там практиката да си тръгнеш, без да се сбогуваш, се нарича просто „най-нормално напускане на купон“.

7 На основата на „ирландското сбогуване“, „английското изнизване“ и „френския изход“ се раждат и цяла серия шеговити вариации, например: British exit, вдъхновен от Брекзит, който означава да обявиш на всеослушание, че си тръгваш, и часове по-късно да те открият пиян в някой ъгъл; Jewish goodbye, тоест да се сбогуваш с всички и след това още дълго да не си тръгнеш; и Tokyo Sayonara, когато на тръгване се сбогуваш единствено с котката.

8 В горецитираната статия в Zeit Magazin се твърди – както логично бихме могли да предположим, – че в Ирландия все пак се използва английският израз to take French leave.

9 Макар че около популярната дефиниция на израза Irish goodbye като цяло има консенсус, някои източници твърдят, че освен с установеното си и широко разпространено значение, той може да означава и точно обратното – безкрайно дълго сбогуване на входната врата, типично за големи ирландски семейства (но не само), по време на което се отварят нови теми и се провеждат цели разговори.

10 Неизненадващо, житието на самия покровител на Ирландия и ирландците свети Патрик съдържа цял набор такива „сбогувания“ – той бива отвлечен от пирати от родната си Англия, впоследствие бяга от робство и плен в Ирландия и т.н.


В рубриката „От дума на дума“ Екатерина Петрова търси актуални, интересни или новопоявили се думи от нашето ежедневие и проследява често изненадващия им произход, развитието на значенията им във времето и взаимовръзките им с близки и далечни езици.

Stories from the SoC Part 1: IDAT Loader to BruteRatel

Post Syndicated from Tom Elkins original https://blog.rapid7.com/2024/03/28/stories-from-the-soc-part-1-idat-loader-to-bruteratel/

Stories from the SoC Part 1: IDAT Loader to BruteRatel

Rapid7’s Managed Detection and Response (MDR) team continuously monitors our customers’ environments, identifying emerging threats and developing new detections.

In August 2023, Rapid7 identified a new malware loader named the IDAT Loader. Malware loaders are a type of malicious software designed to deliver and execute additional malware onto a victim’s system. What made the IDAT Loader unique was the way in which it retrieved data from PNG files, searching for offsets beginning with 49 44 41 54 (IDAT).

At the time, the loader was seen being distributed via a FakeUpdates campaign. In two recent investigations, Rapid7’s Managed Detection & Response (MDR) observed the loader being used again. Based on the recent tactics, techniques and procedures observed (TTPs), we believe the activity is associated with financially motivated threat groups.

In this two-part blog series, we will examine the attack chain observed in two separate incidents, offering in-depth analysis of the malicious behavior detected. The incidents discussed in the series stem from opportunistic infections, wherein threat groups utilize malvertising and drive-by downloads in order to have their initial malicious payloads executed by users.

This first installment focuses on an incident triggered by a user downloading an application, which subsequently triggered the execution of the IDAT Loader and the BruteRatel C4 (BRC4) framework following initial access to a compromised asset.

Technical Analysis

Stage 1: The drive by

In a recent incident, Rapid7 observed a user navigate to a website that hosted popular Korean shows. Upon attempting to watch the video, the website redirected the user through various websites before ultimately directing the users browser into downloading a supposed application named AppFile_v1.1.exe. Threat actors utilize website redirection in order to make it difficult for network technologies to scan links for malicious content.

Stories from the SoC Part 1: IDAT Loader to BruteRatel
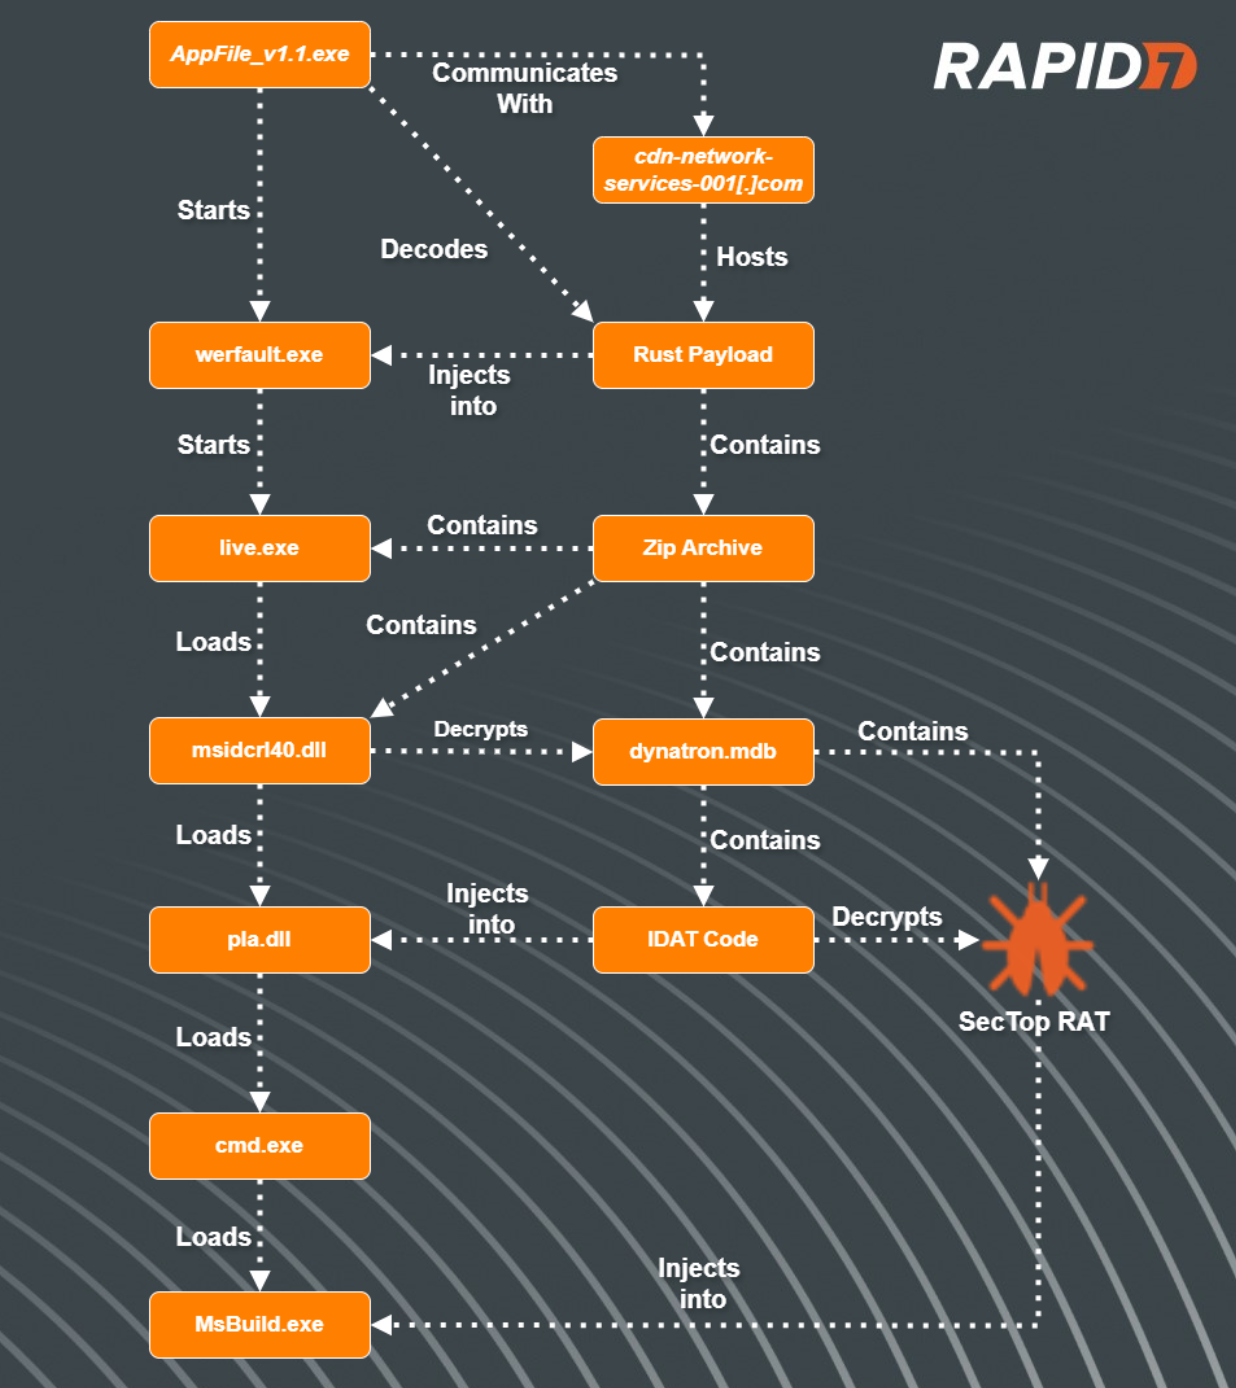
Figure 1 – Attack Flow

Binary Analysis: Shaking off the Rust

After initial analysis of the binary AppFile_v1.1.exe, Rapid7 determined the program was written in Rust.

During execution, the program will query the name of the executable. If the executable’s name matches AppFile_v1.1.exe, the program will continue. Most sandboxes will rename the files (sometimes based on the hash) of submitted programs. This technique helps to evade sandboxes, ensuring the malicious functions are not run. If the program name does not match its original intended name,  the program will quit and display an error message, showing an image that a web page could not be loaded.

Stories from the SoC Part 1: IDAT Loader to BruteRatel
Figure 2 – Error messages displayed by AppFile_v1.1.exe when checks fail

Next, the program will check to see if it resides within a debugger by querying the function IsDebuggerPresent. If the check passes, it will decrypt a hard-coded string that resolves to “Normal”. If not, the program will decrypt another hard-coded string that resolves to “Debugger” and then exit.

Once the anti-debug check passes, the program retrieves an encrypted string and XOR decrypts it, revealing the URL hxxps://cdn-network-services-001[.]com/update/minor/1/release.json.

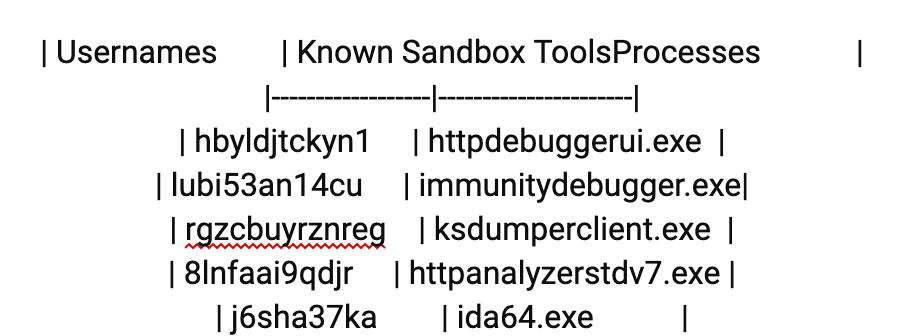
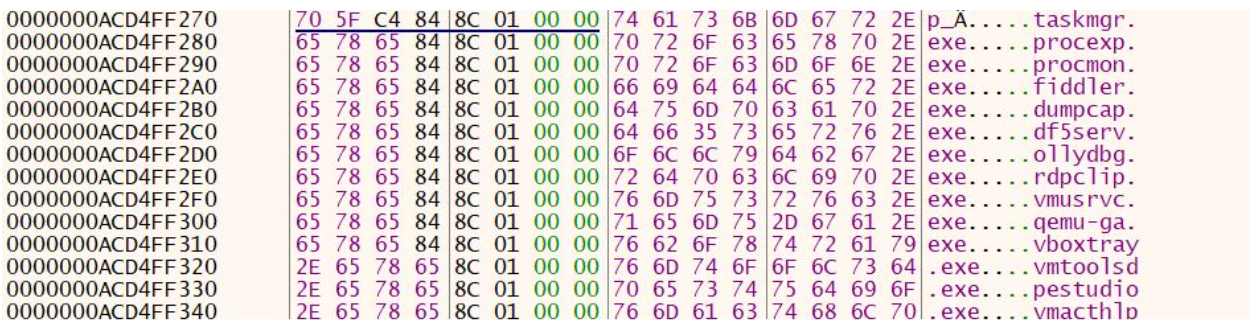
The program will then perform anti-analysis techniques, specifically querying for the username and open process and comparing them to a list of known sandbox usernames and tools. The list of usernames and processes are also XOR-encrypted and are decrypted at runtime. Based on Open Source Intelligence, we determined that another malware known as Serpent Stealer contained a similar table of user names. See Appendix A below for the complete list.

Stories from the SoC Part 1: IDAT Loader to BruteRatel
Table 1 – Usernames and Known Sandbox Tools to Check Against
Stories from the SoC Part 1: IDAT Loader to BruteRatel
Figure 3 – Sample Output from x64Debugger showing list of processes to check for

If any of the checks fail, the program will exit and display the message box. If the checks pass, the program will then utilize Rust library tokio-1.32.0/src/net/tcp/stream.rs in order to read in data from the decrypted URL and store the contents in memory.

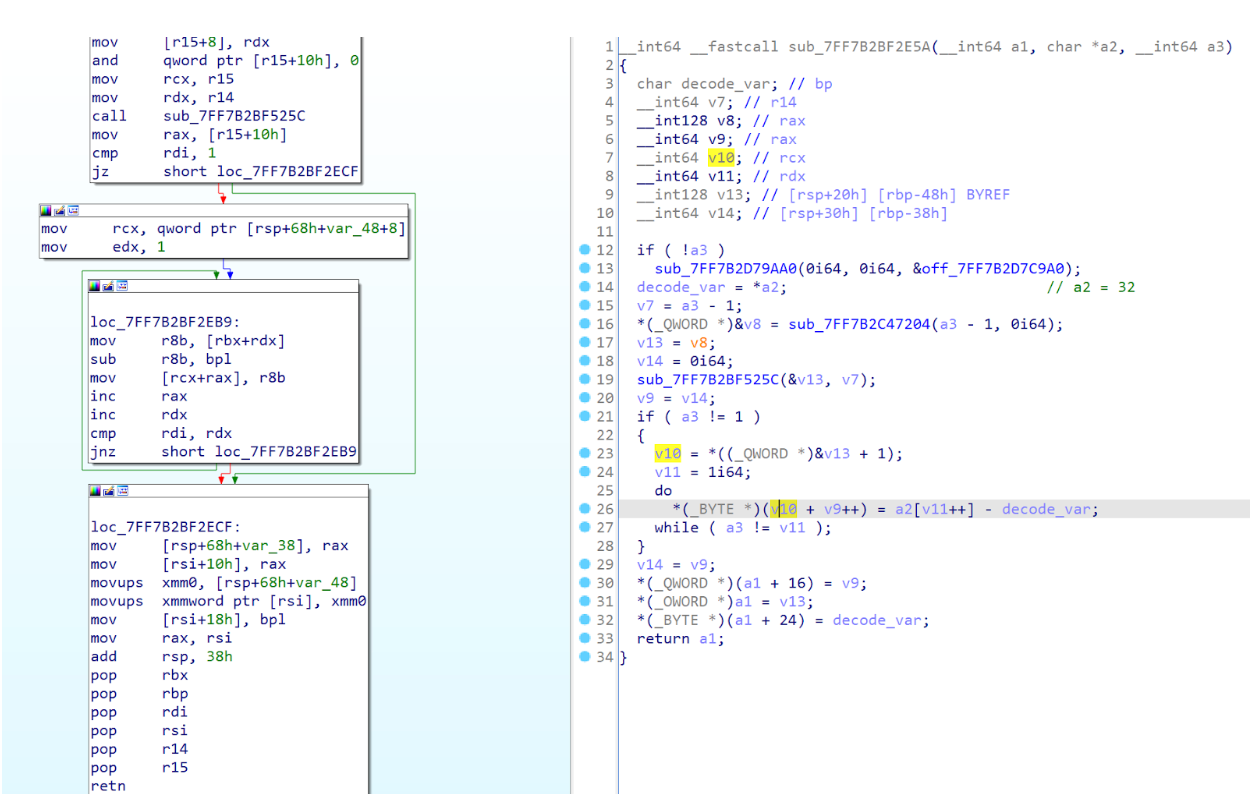
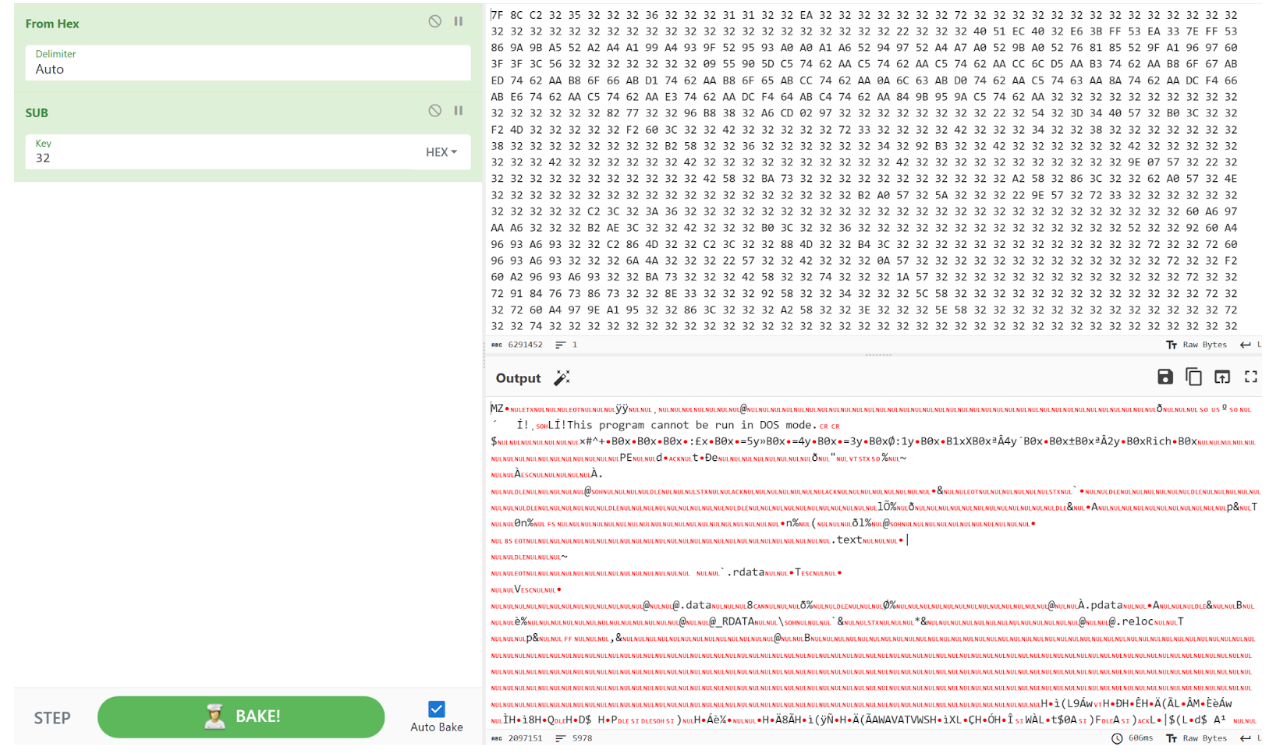
Upon initial analysis, the downloaded data appeared to be encoded. Subsequently, the data is passed into a function tasked with decoding it. The decoding process involves reading each byte and subtracting the hexadecimal value 32.

Stories from the SoC Part 1: IDAT Loader to BruteRatel
Figure 4 – Data Decoding Routine
Stories from the SoC Part 1: IDAT Loader to BruteRatel
Figure 5 – Decoded downloaded bytes using CyberChef

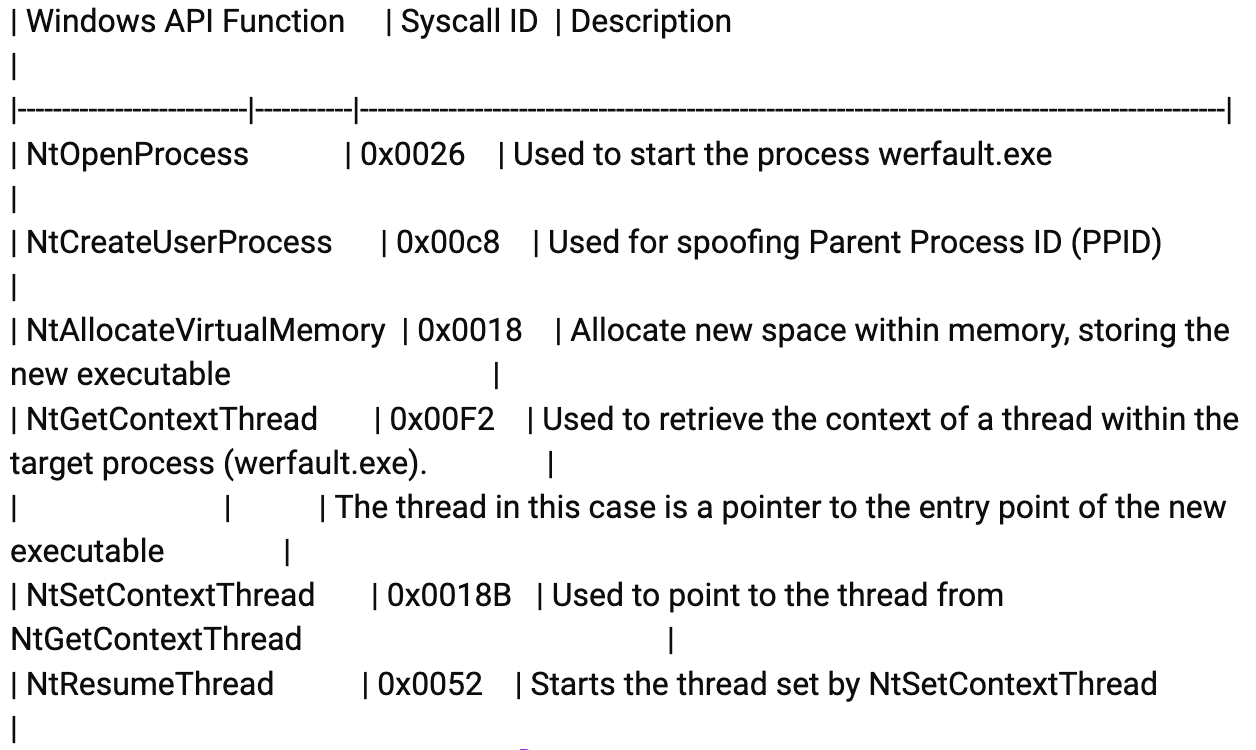
After the downloaded data is decoded, the program XOR decrypts another string, revealing a path to the executable C:\Windows\system32\werfault.exe. Using syscalls, the program then does the following:

Stories from the SoC Part 1: IDAT Loader to BruteRatel
Table 2 – Syscalls Used by Rust Loader

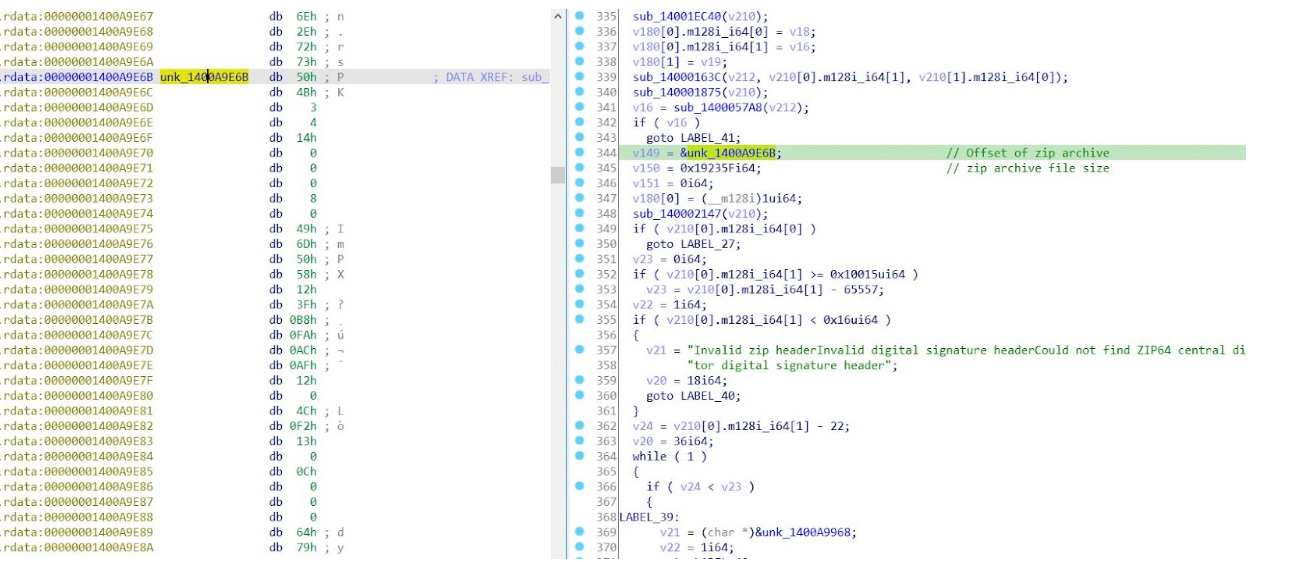
After analysis of the decoded binary, we determined that it was another executable written in Rust. The program’s executable contains a zip archive within the .rdata section. During execution, the program generates a folder with a randomly generated name in the %TEMP% directory and extracts the contents of the archive into this newly created folder.

Stories from the SoC Part 1: IDAT Loader to BruteRatel
Figure 6 – ZIP Archive Contained Within New Rust Executable

The archive contained a DLL, msidcrl40.dll, an executable named live.exe and an encrypted file, dynatron.mdb. Initial analysis of the DLL msidcrl40.dll showed that the DLL’s signature was corrupted, indicating the DLL was tampered with. Further analysis showed that the DLL contained code related to the IDAT Loader.

IDAT Loader

After the rust program drops the contents of the zip archive, it then proceeds to execute the binary live.exe, which sideloads the DLL, msidcrl40.dll, containing the IDAT Loader code.

After the binary live.exe loads the DLL msidcrl40.dll, the DLL executes the function containing  the IDAT Loader. The IDAT then reads in encrypted contents contained within the file dynatron.mdb, searching for the offset 49 44 41 54 (IDAT) followed by C6 A5 79 EA. After decrypting the contents, the loader will then decompress the contents using RtlDecompressBuffer and execute additional code into a newly created process, cmd.exe.

The IDAT loader employs advanced techniques such as Process Doppelgänging and the Heaven’s Gate technique in order to initiate new processes and inject additional code.

The code contained within cmd.exe is responsible for decrypting the final payload and injecting it into a newly created process, msbuild.exe.

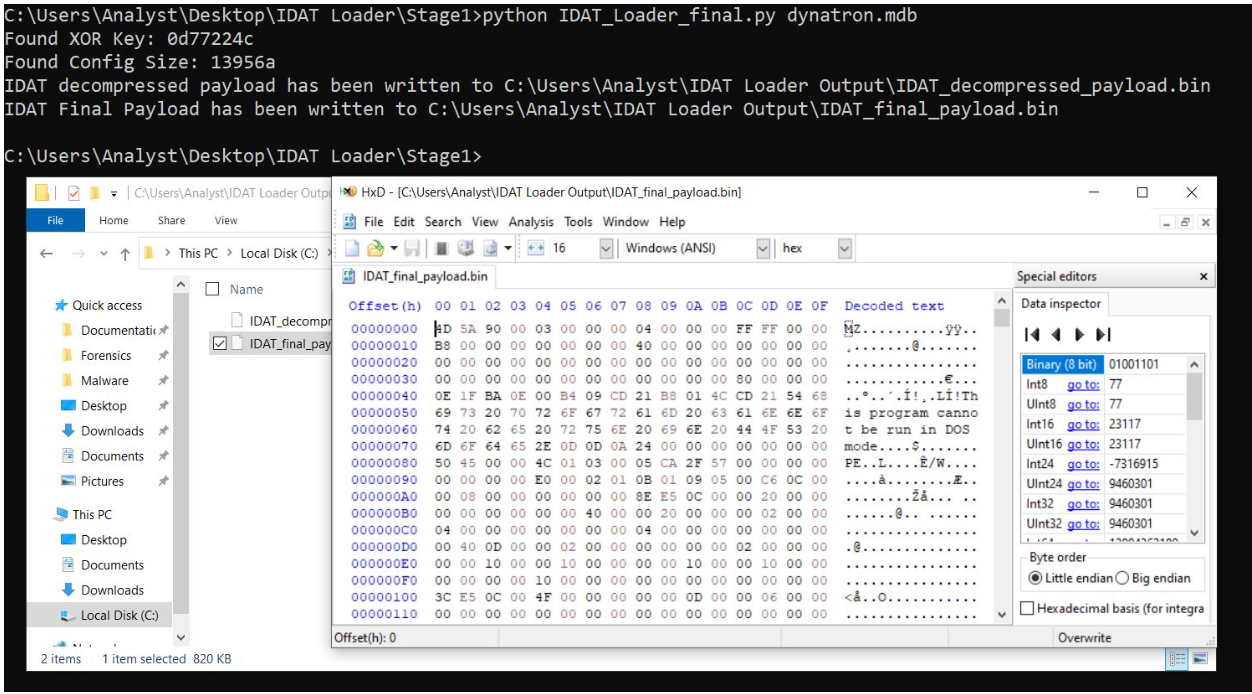
Using our IDAT Loader config extractor, we were able to extract the final payload and determined that it was SecTop RAT. During execution of the SecTop RAT, we observed that it communicated with the IP address 152.89.217[.]215.

Stories from the SoC Part 1: IDAT Loader to BruteRatel
Figure 7 – SecTop RAT payload extracted by our IDAT Loader Python Script

Post-Exploitation: BRC4 Deployment

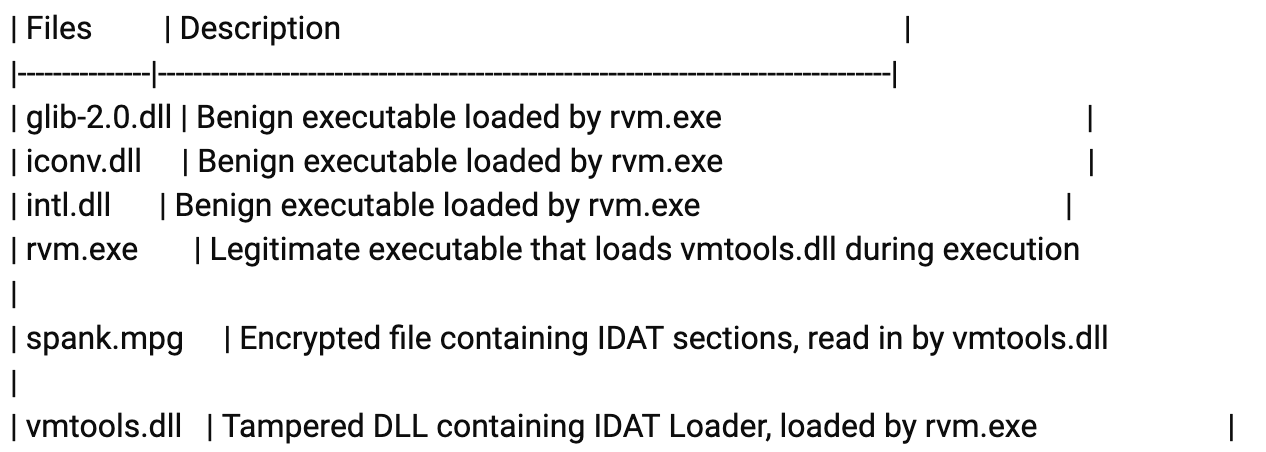
After the SecTop RAT was executed successfully, Rapid7 observed follow-on activity in which the threat actor executed another version of the IDAT loader from within the folder path C:\ProgramData\. We observed the following related files were dropped by the threat actor into C:\ProgramData:

Stories from the SoC Part 1: IDAT Loader to BruteRatel
Table 2: Files Dropped by Threat Actor into C:/ProgramData\

After analysis of the files, we determined that rvm.exe was a renamed executable rvmsetup.exe, a legitimate tool that is a part of the VMWare Tools toolset. The binary is used to join a VMWare source virtual machine to an active directory domain. We also observed that the binary vmtools.dll had a corrupted signature, indicating the binary’s code was tampered with. We observed that the DLL vmtools.dll contained code related to the IDAT Loader.

During execution of the executable, rvm.exe, the program loads vmtools.dll. After vmtools.dll is loaded, the DLL is directed to execute a function that contains the IDAT Loader. The IDAT Loader proceeds to read in contents from within spank.mpg, searching for the same offset, 49 44 41 54 (IDAT) followed by C6 A5 79 EA. After decrypting the contents within spank.mpg, the IDAT Loader spawns a new process, cmd.exe, injecting additional code that is responsible for decrypting the final payload and injecting it into a newly created process, explorer.exe.

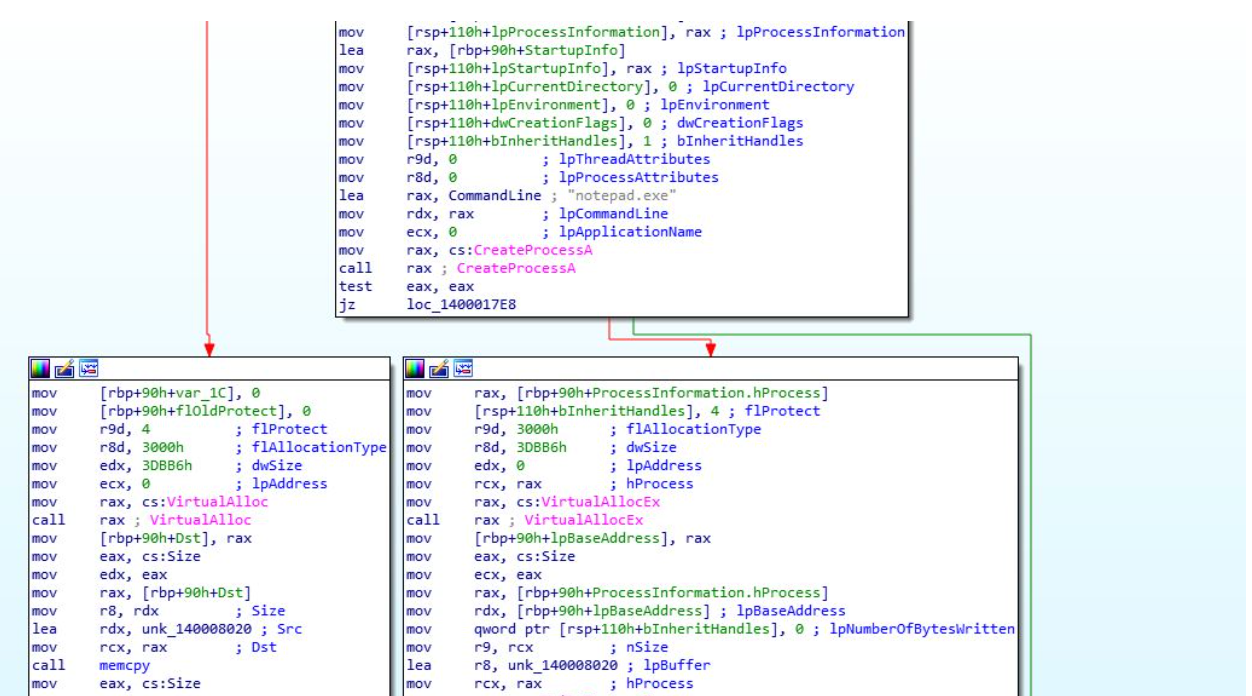
Using our static config extractor, we extracted the final payload, a 64-bit executable. During initial analysis of the final payload, we observed that the program utilized the API functions VirtualAlloc and VirtualProtect. During execution of the program, it utilized VirtualAlloc to read in and store additional code, including encrypted data, into a new region of memory. The program then called upon the function VirtualProtect, changing the newly allocated region of memory (containing the new code) to be executable. We also observed the 64 bit executable (obtained from the IDAT Loader python script) had the capability to perform process hollowing by starting a new process, notepad.exe, and injecting the code into the newly created process.

Stories from the SoC Part 1: IDAT Loader to BruteRatel
Figure 8 – Final Payload showing Injection into notepad.exe

The newly allocated code was responsible for decrypting the encrypted data using RC4, copying the decrypted code into an allocated memory buffer via VirtualAlloc, and setting the memory buffer to have executable permission using VirtualProtect. Rapid7 determined the decrypted code was a Brute Ratel C4 (BRC4) “badger”.

Brute Ratel originated as a post-exploitation tool intended for penetration testers, designed to mimic adversary tactics as of December 2020. Its development aimed to replicate the functionality of established Command and Control (C2) software like Cobalt Strike, Mythic and Sliver. Following a successful compromise of a target, the attacker deploys the Brute Ratel “badger,” tasked with establishing communication with the attacker’s Command and Control domain.

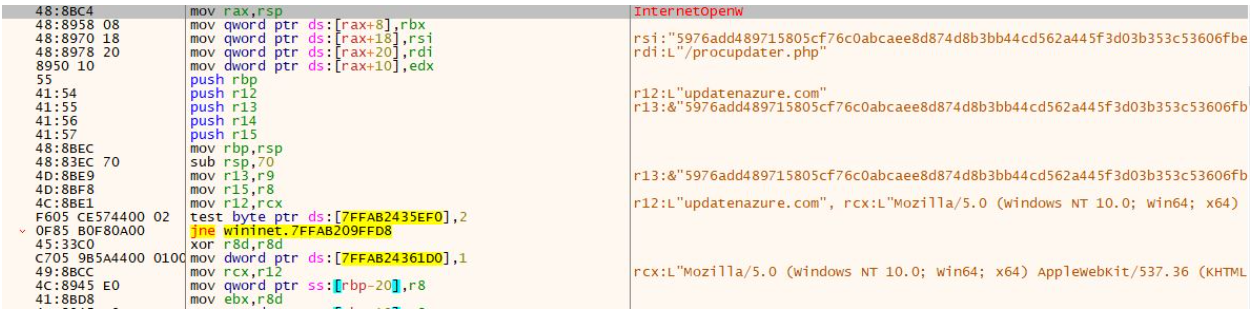
During execution of the BRC4 program, we observed that it reached out to the domain updatenazure[.]com.

Stories from the SoC Part 1: IDAT Loader to BruteRatel
Figure 9 – Debugging BRC4 C2 Communication

After the BRC4 program was executed, we observed the threat actor attempting to enumerate the domain controller by using the command nltest /dclist.

Rapid7 Customers

InsightIDR and Managed Detection and Response customers have existing detection coverage through Rapid7’s expansive library of detection rules. Rapid7 recommends installing the Insight Agent on all applicable hosts to ensure visibility into suspicious processes and proper detection coverage. Below is a non-exhaustive list of detections deployed and alerting on activity described:

  • Network Discovery – Nltest Enumerate Domain Controllers
  • Suspicious Process – Execution From Root of ProgramData
  • Suspicious Process – PowerShell Uncommon Upper And Lower Case Combinations
  • Suspicious Process – explorer.exe in Non-Standard Location

Appendix A: Known Sandbox Usernames and Analysis Tools

Usernames Processes
hbyldjtckyn1 httpdebuggerui.exe
lubi53an14cu immunitydebugger.exe
rgzcbuyrznreg ksdumperclient.exe
8lnfaai9qdjr httpanalyzerstdv7.exe
j6sha37ka ida64.exe
keecfmwgj 32dbg.exe
pwouqdtdq 64dbg.exe
qmis5df7u protection_id.exe
txwas1m2t vmsrvc.exe
uox1tzamo x32dbg.exe
rb5bnfur2 x64dbg.exe
cm0uegn4do x96dbg.exe
douyo8rv71 prl_cc.exe
paul jones windbg.exe
pxmduopvyx scylla.exe
fnbdsldtxy idau64.exe
gexwjqdjxg idaq64.exe
gjam1nxxvm idag64.exe
jcotj17dzx taskmgr.exe
05kvauqkpqk5 procexp.exe
64f2tkiqo5k5h procmon.exe
of20xqh4vl fiddler.exe
harry johnson dumpcap.exe
4tgiizslims df5serv.exe
bvjchrpnsxn ollydbg.exe
kfu0lqwgx5p rdpclip.exe
nok4zg7zhof vmusrvc.exe
ogjb6gqgk0o5 qemu-ga.exe
xplyvzr8sgc vboxtray.exe
ykj0egq7fze vmtoolsd.exe
ryjijkiroms pestudio.exe
nzap7ubvas1 vmacthlp.exe
9yjcpseyimh procexp64.exe
uhuqiuwoefu wireshark.exe
6o4kyhhjxbir prl_tools.exe
7wjlgx7pjlw4 importrec.exe
8nl0colnq5bq vmwaretray.exe
g2dbyldgzz8yo vmwareuser.exe
pqonjhvwexsst xenservice.exe
rdhj0cnfevzxf scylla_x86.exe
xmimmckziitdl scylla_x64.exe
l3cnbb8ar5b8 vboxservice.exe
vzy4jmh0jw02
21zlucunfi85
sal.rosenburg
defaultaccount
wdagutilityaccount

MITRE ATT&CK Techniques

Tactics Techniques Details
Initial Access Drive-by Compromise (T1189) Threat Actors utilize drive-by downloads in order to direct browsers to download their initial payloads without users consent
Execution User Execution: Malicious File (T1204.002) Users execute the binary AppFile_v1.1.exe
Execution Native API (T1106) The IDAT injector and IDAT loader are using Heaven’s Gate technique to evade detection
Defense Evasion Hijack Execution Flow: DLL Search Order Hijacking (T1574.001) run.exe loads a malicious wbxtrace.dll
Defense Evasion Process Injection (T1055) IDAT injector implements NtCreateSection + NtMapViewOfSection Code Injection technique to inject into cmd.exe process
Defense Evasion Deobfuscate/Decode Files or Information (T1140) msidcrl40.dll decrypts dynatron.mdb
Defense Evasion Process Injection: Process Doppelgänging (T1055.013) IDAT loader implements Process Doppelgänging technique to load the SecTop RAT
Defense Evasion Masquerading (T1036) dynatron.mdb file masqueraded to a .png file
Defense Evasion Virtualization/Sandbox Evasion: Time Based Evasion (T1497.003) Execution delays are performed by several stages throughout the attack flow

IOCs

IOC Sha256 Notes
AppFile_v1.1.exe A3A5E7011335A2284E2D4F73FD464FF129F0C9276878A054C1932BC50608584B Rust Loader responsible for downloading IDAT Loader
msidcrl40.dll 02D5E281689EC2D4AB8AC19C93321A09113E5D8FA39380A7021580EA1887B7A5 Malicious DLL executed by live.exe
dynatron.mdb C5C52331B208CAD19DC710786E26AC55090FFCA937410D76C53569D731F0BB92 Encrypted payload decrypted by msidcrl40.dll
vmtools.dll BEFE0DF365F0E2DC05225470E45FDF03609F098A526D617C478B81AC6BB9147F Malicious DLL executed by rvm.exe
spank.mpg E05E561C5118EFDBCA113CA231C527B62E59A4BFFAE3BD374F7B4FCDD10E7D90 Encrypted payload decrypted by vmtools.dll
hxxps://cdn-network-services-001[.]com/update/minor/1/release.json Downloads additional Rust binary containing IDAT Loader
152.89.217[.]215 SecTop RAT domain
updatenazure[.]com BRC4 Domain

References

Article URL
Uncovering the “Serpent” https://malware.news/t/uncovering-the-serpent/76253
Process Doppelgänging https://malware.news/t/uncovering-the-serpent/76253
Analysis of “Heaven’s Gate” part 1 https://sachiel-archangel.medium.com/analysis-of-heavens-gate-part-1-62cca0ace6f0
A Deep Dive Into Malicious Direct Syscall Detection https://www.paloaltonetworks.com/blog/security-operations/a-deep-dive-into-malicious-direct-syscall-detection/
Fake Update Utilizes New IDAT Loader To Execute StealC and Lumma Infostealers https://www.rapid7.com/blog/post/2023/08/31/fake-update-utilizes-new-idat-loader-to-execute-stealc-and-lumma-infostealers/

Krones real-time production line monitoring with Amazon Managed Service for Apache Flink

Post Syndicated from Florian Mair original https://aws.amazon.com/blogs/big-data/krones-real-time-production-line-monitoring-with-amazon-managed-service-for-apache-flink/

Krones provides breweries, beverage bottlers, and food producers all over the world with individual machines and complete production lines. Every day, millions of glass bottles, cans, and PET containers run through a Krones line. Production lines are complex systems with lots of possible errors that could stall the line and decrease the production yield. Krones wants to detect the failure as early as possible (sometimes even before it happens) and notify production line operators to increase reliability and output. So how to detect a failure? Krones equips their lines with sensors for data collection, which can then be evaluated against rules. Krones, as the line manufacturer, as well as the line operator have the possibility to create monitoring rules for machines. Therefore, beverage bottlers and other operators can define their own margin of error for the line. In the past, Krones used a system based on a time series database. The main challenges were that this system was hard to debug and also queries represented the current state of machines but not the state transitions.

This post shows how Krones built a streaming solution to monitor their lines, based on Amazon Kinesis and Amazon Managed Service for Apache Flink. These fully managed services reduce the complexity of building streaming applications with Apache Flink. Managed Service for Apache Flink manages the underlying Apache Flink components that provide durable application state, metrics, logs, and more, and Kinesis enables you to cost-effectively process streaming data at any scale. If you want to get started with your own Apache Flink application, check out the GitHub repository for samples using the Java, Python, or SQL APIs of Flink.

Overview of solution

Krones’s line monitoring is part of the Krones Shopfloor Guidance system. It provides support in the organization, prioritization, management, and documentation of all activities in the company. It allows them to notify an operator if the machine is stopped or materials are required, regardless where the operator is in the line. Proven condition monitoring rules are already built-in but can also be user defined via the user interface. For example, if a certain data point that is monitored violates a threshold, there can be a text message or trigger for a maintenance order on the line.

The condition monitoring and rule evaluation system is built on AWS, using AWS analytics services. The following diagram illustrates the architecture.

Architecture Diagram for Krones Production Line Monitoring

Almost every data streaming application consists of five layers: data source, stream ingestion, stream storage, stream processing, and one or more destinations. In the following sections, we dive deeper into each layer and how the line monitoring solution, built by Krones, works in detail.

Data source

The data is gathered by a service running on an edge device reading several protocols like Siemens S7 or OPC/UA. Raw data is preprocessed to create a unified JSON structure, which makes it easier to process later on in the rule engine. A sample payload converted to JSON might look like the following:

{
  "version": 1,
  "timestamp": 1234,
  "equipmentId": "84068f2f-3f39-4b9c-a995-d2a84d878689",
  "tag": "water_temperature",
  "value": 13.45,
  "quality": "Ok",
  "meta": {      
    "sequenceNumber": 123,
    "flags": ["Fst", "Lst", "Wmk", "Syn", "Ats"],
    "createdAt": 12345690,
    "sourceId": "filling_machine"
  }
}

Stream ingestion

AWS IoT Greengrass is an open source Internet of Things (IoT) edge runtime and cloud service. This allows you to act on data locally and aggregate and filter device data. AWS IoT Greengrass provides prebuilt components that can be deployed to the edge. The production line solution uses the stream manager component, which can process data and transfer it to AWS destinations such as AWS IoT Analytics, Amazon Simple Storage Service (Amazon S3), and Kinesis. The stream manager buffers and aggregates records, then sends it to a Kinesis data stream.

Stream storage

The job of the stream storage is to buffer messages in a fault tolerant way and make it available for consumption to one or more consumer applications. To achieve this on AWS, the most common technologies are Kinesis and Amazon Managed Streaming for Apache Kafka (Amazon MSK). For storing our sensor data from production lines, Krones choose Kinesis. Kinesis is a serverless streaming data service that works at any scale with low latency. Shards within a Kinesis data stream are a uniquely identified sequence of data records, where a stream is composed of one or more shards. Each shard has 2 MB/s of read capacity and 1 MB/s write capacity (with max 1,000 records/s). To avoid hitting those limits, data should be distributed among shards as evenly as possible. Every record that is sent to Kinesis has a partition key, which is used to group data into a shard. Therefore, you want to have a large number of partition keys to distribute the load evenly. The stream manager running on AWS IoT Greengrass supports random partition key assignments, which means that all records end up in a random shard and the load is distributed evenly. A disadvantage of random partition key assignments is that records aren’t stored in order in Kinesis. We explain how to solve this in the next section, where we talk about watermarks.

Watermarks

A watermark is a mechanism used to track and measure the progress of event time in a data stream. The event time is the timestamp from when the event was created at the source. The watermark indicates the timely progress of the stream processing application, so all events with an earlier or equal timestamp are considered as processed. This information is essential for Flink to advance event time and trigger relevant computations, such as window evaluations. The allowed lag between event time and watermark can be configured to determine how long to wait for late data before considering a window complete and advancing the watermark.

Krones has systems all around the globe, and needed to handle late arrivals due to connection losses or other network constraints. They started out by monitoring late arrivals and setting the default Flink late handling to the maximum value they saw in this metric. They experienced issues with time synchronization from the edge devices, which lead them to a more sophisticated way of watermarking. They built a global watermark for all the senders and used the lowest value as the watermark. The timestamps are stored in a HashMap for all incoming events. When the watermarks are emitted periodically, the smallest value of this HashMap is used. To avoid stalling of watermarks by missing data, they configured an idleTimeOut parameter, which ignores timestamps that are older than a certain threshold. This increases latency but gives strong data consistency.

public class BucketWatermarkGenerator implements WatermarkGenerator<DataPointEvent> {
private HashMap <String, WatermarkAndTimestamp> lastTimestamps;
private Long idleTimeOut;
private long maxOutOfOrderness;
}

Stream processing

After the data is collected from sensors and ingested into Kinesis, it needs to be evaluated by a rule engine. A rule in this system represents the state of a single metric (such as temperature) or a collection of metrics. To interpret a metric, more than one data point is used, which is a stateful calculation. In this section, we dive deeper into the keyed state and broadcast state in Apache Flink and how they’re used to build the Krones rule engine.

Control stream and broadcast state pattern

In Apache Flink, state refers to the ability of the system to store and manage information persistently across time and operations, enabling the processing of streaming data with support for stateful computations.

The broadcast state pattern allows the distribution of a state to all parallel instances of an operator. Therefore, all operators have the same state and data can be processed using this same state. This read-only data can be ingested by using a control stream. A control stream is a regular data stream, but usually with a much lower data rate. This pattern allows you to dynamically update the state on all operators, enabling the user to change the state and behavior of the application without the need for a redeploy. More precisely, the distribution of the state is done by the use of a control stream. By adding a new record into the control stream, all operators receive this update and are using the new state for the processing of new messages.

This allows users of Krones application to ingest new rules into the Flink application without restarting it. This avoids downtime and gives a great user experience as changes happen in real time. A rule covers a scenario in order to detect a process deviation. Sometimes, the machine data is not as easy to interpret as it might look at first glance. If a temperature sensor is sending high values, this might indicate an error, but also be the effect of an ongoing maintenance procedure. It’s important to put metrics in context and filter some values. This is achieved by a concept called grouping.

Grouping of metrics

The grouping of data and metrics allows you to define the relevance of incoming data and produce accurate results. Let’s walk through the example in the following figure.

Grouping of metrics

In Step 1, we define two condition groups. Group 1 collects the machine state and which product is going through the line. Group 2 uses the value of the temperature and pressure sensors. A condition group can have different states depending on the values it receives. In this example, group 1 receives data that the machine is running, and the one-liter bottle is selected as the product; this gives this group the state ACTIVE. Group 2 has metrics for temperature and pressure; both metrics are above their thresholds for more than 5 minutes. This results in group 2 being in a WARNING state. This means group 1 reports that everything is fine and group 2 does not. In Step 2, weights are added to the groups. This is needed in some situations, because groups might report conflicting information. In this scenario, group 1 reports ACTIVE and group 2 reports WARNING, so it’s not clear to the system what the state of the line is. After adding the weights, the states can be ranked, as shown in step 3. Lastly, the highest ranked state is chosen as the winning one, as shown in Step 4.

After the rules are evaluated and the final machine state is defined, the results will be further processed. The action taken depends on the rule configuration; this can be a notification to the line operator to restock materials, do some maintenance, or just a visual update on the dashboard. This part of the system, which evaluates metrics and rules and takes actions based on the results, is referred to as a rule engine.

Scaling the rule engine

By letting users build their own rules, the rule engine can have a high number of rules that it needs to evaluate, and some rules might use the same sensor data as other rules. Flink is a distributed system that scales very well horizontally. To distribute a data stream to several tasks, you can use the keyBy() method. This allows you to partition a data stream in a logical way and send parts of the data to different task managers. This is often done by choosing an arbitrary key so you get an evenly distributed load. In this case, Krones added a ruleId to the data point and used it as a key. Otherwise, data points that are needed are processed by another task. The keyed data stream can be used across all rules just like a regular variable.

Destinations

When a rule changes its state, the information is sent to a Kinesis stream and then via Amazon EventBridge to consumers. One of the consumers creates a notification from the event that is transmitted to the production line and alerts the personnel to act. To be able to analyze the rule state changes, another service writes the data to an Amazon DynamoDB table for fast access and a TTL is in place to offload long-term history to Amazon S3 for further reporting.

Conclusion

In this post, we showed you how Krones built a real-time production line monitoring system on AWS. Managed Service for Apache Flink allowed the Krones team to get started quickly by focusing on application development rather than infrastructure. The real-time capabilities of Flink enabled Krones to reduce machine downtime by 10% and increase efficiency up to 5%.

If you want to build your own streaming applications, check out the available samples on the GitHub repository. If you want to extend your Flink application with custom connectors, see Making it Easier to Build Connectors with Apache Flink: Introducing the Async Sink. The Async Sink is available in Apache Flink version 1.15.1 and later.


About the Authors

Florian Mair is a Senior Solutions Architect and data streaming expert at AWS. He is a technologist that helps customers in Europe succeed and innovate by solving business challenges using AWS Cloud services. Besides working as a Solutions Architect, Florian is a passionate mountaineer, and has climbed some of the highest mountains across Europe.

Emil Dietl is a Senior Tech Lead at Krones specializing in data engineering, with a key field in Apache Flink and microservices. His work often involves the development and maintenance of mission-critical software. Outside of his professional life, he deeply values spending quality time with his family.

Simon Peyer is a Solutions Architect at AWS based in Switzerland. He is a practical doer and is passionate about connecting technology and people using AWS Cloud services. A special focus for him is data streaming and automations. Besides work, Simon enjoys his family, the outdoors, and hiking in the mountains.

Managing the Media Tidal Wave: Backlight iconik’s 2024 Media Report

Post Syndicated from Jennifer Newman original https://backblazeprod.wpenginepowered.com/blog/managing-the-media-tidal-wave-backlight-iconiks-2024-media-report/

A decorative image showing several types of files falling into the a cloud with the Backblaze logo on it.

Everyone knows we’re living through an exceptional time when it comes to media production: Every day we experience a tidal wave of content—social video, virtual reality (VR) and augmented reality (AR) gaming, 10K sports footage, every streaming option imaginable—crashing down on us.

Two eye popping stats underscore that this perception is real: In December, Netflix shared that its users streamed close to 100 billion hours of content on its platform during the first half of 2023. At the beginning of 2024, YouTube revealed that its users watch one billion hours of video daily. 

It’s hard to make sense of that volume of content, it’s even harder to understand how it’s produced. Imagine the armies of people and types of programs required to capture, ingest, transcode, store, tag, edit, distribute, and archive all of it. Managing that content means touching every stage, start to finish, of the production process through the data lifecycle. 

A photo showing a woman surrounded by glistening raindrops, some of which transform into media icons.

To further complicate things, the modern production person’s workflow is nothing close to linear. They have to deal with:

  • A diversity of inputs: Content is pouring in from various sources. Keeping track of all this content, ensuring its quality, and organizing it effectively can feel like trying to catch a waterfall in a teacup. 
  • A variety of formats and file types: Each platform or device may require a different format or resolution, making it difficult to maintain consistency across the board and adding another layer of complexity.
  • Managing metadata, or indexing and tagging: With so much content flying around, ensuring that each file is properly tagged with relevant information is crucial for easy retrieval and management. However, manually inputting metadata for every piece of media can be time-consuming and prone to errors.
  • Remote and in-person collaboration: With team members spread across different locations, coordinating efforts and maintaining version control can be a headache.
  • Storage and scalability: As the volume of media grows, so does the need for storage space. Finding a solution that can accommodate this growth without breaking the bank can be tough.

While many companies are jumping in to provide tools to manage this tidal wave of content, one company, Backlight iconik, differentiates itself by providing industry-leading tools and offering public media reports on the state of media data today.

Backlight iconik’s 2024 Media Stats Report

Since 2018, iconik has provided a cloud-based media asset management (MAM) tool to help production professionals tame the insanity of modern content development. For the past four years, they’ve also provided an annual Media Stats report to help the industry understand the type of media being developed and distributed, as well as where and how it’s stored. (In 2022, Backlight, a global media technology, acquired iconik, hence the name change.) If you want the full story, please check out Backlight iconik’s 2024 Media Stats Report,

As cloud storage specialists here at Backblaze (and, lovers of stats ourselves), we would like to dig into their stats on storage and offer our own take here for you today.

2024 Media Storage Trend: The Content Tidal Wave Is Not a Mirage

According to Backlight iconik’s Media Stats Report, iconik’s data exploded to 152PB, shooting up by a whopping 57%—that’s 53PB more than in 2023. To put it in perspective, that’s roughly 6TB of fresh data pouring in every hour. This surge in data can be attributed to both new customers integrating their archives with iconik and existing customers ramping up their usage.

2024 Media Storage Trend: Audio on the Rise

An interesting find in their study was the difference between audio and video asset growth. Iconik is now managing 328 years of video (up 41% YoY) and 208 years of audio (up 50% YoY).

A decorative display of media stats from iconik's media report. The title reads Asset Duration. On the left, a blue circle displays the words 328 years of video, which represents 41% growth year on year. On the right, an orange circle contains the words 208 years of audio, which represents 50% growth year on year.
Note that “duration” in this context is measuring the total hours of runtime for each file. Source.

Over the last year, the growth of audio assets managed by Backlight iconik has surged, surpassing that of video, with a staggering 1,700 hours being added daily. They believe this surge is closely tied to the remarkable expansion of both the podcasting and audiobook markets in recent years. The global podcast market ballooned to $17.9 billion in 2023 and is forecasted to soar to $144 billion by 2032. Similarly, the audiobook market is projected to hit $35 billion by 2030, with expected revenue of $35.05 billion in the same year. While audio files are smaller than video files by far, it’s reasonable to anticipate a continued upward trajectory for audio assets across the media and entertainment landscape.

2024 Trend: The Shift to Cloud Storage for Cost-Effective Storage and Collaboration

According to Backlight iconik’s 2024 Media Stats Report, the trend toward cloud storage is definitely on the rise as the increased competition in the market and move away from hyperscalers drive more reasonable pricing. Companies are opting to transition to the cloud at their own speed, and hybrid cloud setups give them the freedom to shift assets as needed to improve things like performance, ease of access, security, and meeting regulatory requirements.

Get Ahead of the Wave: Pair iconik With Modern Cloud Storage Today

The reasons so many media professionals are moving to cloud are relatively simple: Cloud workflows enable enhanced collaboration and flexibility, greater cost predictability, and heightened security and management capabilities. And often, all of the above is possible at a lower total cost than legacy solutions.

Pairing Backlight iconik and Backblaze provides a simple solution for users to manage, collaborate, and store media projects easily. By integrating with iconik, Backblaze boosts workflow effectiveness, delivering a strong cloud-based MAM system that allows thorough management of Backblaze B2 Cloud Storage data right from a web browser.

Customer Story: How One Streaming Company Tackled Remote Content Workflows With Backblaze and Backlight iconik

When Goalcast, the empowering media company, decided to dive into making their own content, they realized their current setup just wasn’t cutting it. With their team spread out all over the place, they needed an easy way to get footage, access videos from anywhere, and keep a stash of finished files ready to jazz up for YouTube, Facebook, Instagram, Snapchat, TikTok, and the Goalcast OTT app. 

Goalcast combined LucidLink’s cloud-based workflows, iconik’s media asset manager and uploader features, and Backblaze B2 Cloud Storage. The integration between iconik, LucidLink, and Backblaze creates a slick media workflow. The content crew uploads raw footage straight into iconik, tossing in key details. Original files zip into Goalcast’s Backblaze B2 Bucket automatically, while edited versions are up for grabs via LucidLink. After the editing magic, final assets kick back into Backblaze B2.

The integration and partnership means endless possibilities for Goalcast. They’re saving around 150 hours a month in grunt work and stress. Now, they don’t have to fret about where footage hides or how to snag it—it’s all securely stored in Backblaze, ready for anyone on the team to grab, no matter where they’re working from.

You can get lost in the weeds of tech companies and storage solutions. It can hurt your brain. The sweet spot is these three—iconik, LucidLink, and Backblaze—and how they work together.

—Dan Schiffmacher, Production Operations Manager, Goalcast

2024 Media Mega Trend

Looking at Backlight iconik’s numbers and forecasts from a 25,000 foot vantage point makes one thing painfully clear: Effective media management and storage are going to be absolutely crucial for media teams to succeed in the future landscape of production. Dive deeper into how Backblaze and Backlight iconik can support you now and down the road, ensuring seamless media management, and affordable storage, that creates easy, stress-free expansion as your data continues to grow. 

Already have iconik and want to get started with Backblaze? Click here. 

The post Managing the Media Tidal Wave: Backlight iconik’s 2024 Media Report appeared first on Backblaze Blog | Cloud Storage & Cloud Backup.

How Amazon optimized its high-volume financial reconciliation process with Amazon EMR for higher scalability and performance

Post Syndicated from Jeeshan Khetrapal original https://aws.amazon.com/blogs/big-data/how-amazon-optimized-its-high-volume-financial-reconciliation-process-with-amazon-emr-for-higher-scalability-and-performance/

Account reconciliation is an important step to ensure the completeness and accuracy of financial statements. Specifically, companies must reconcile balance sheet accounts that could contain significant or material misstatements. Accountants go through each account in the general ledger of accounts and verify that the balance listed is complete and accurate. When discrepancies are found, accountants investigate and take appropriate corrective action.

As part of Amazon’s FinTech organization, we offer a software platform that empowers the internal accounting teams at Amazon to conduct account reconciliations. To optimize the reconciliation process, these users require high performance transformation with the ability to scale on demand, as well as the ability to process variable file sizes ranging from as low as a few MBs to more than 100 GB. It’s not always possible to fit data onto a single machine or process it with one single program in a reasonable time frame. This computation has to be done fast enough to provide practical services where programming logic and underlying details (data distribution, fault tolerance, and scheduling) can be separated.

We can achieve these simultaneous computations on multiple machines or threads of the same function across groups of elements of a dataset by using distributed data processing solutions. This encouraged us to reinvent our reconciliation service powered by AWS services, including Amazon EMR and the Apache Spark distributed processing framework, which uses PySpark. This service enables users to process files over 100 GB containing up to 100 million transactions in less than 30 minutes. The reconciliation service has become a powerhouse for data processing, and now users can seamlessly perform a variety of operations, such as Pivot, JOIN (like an Excel VLOOKUP operation), arithmetic operations, and more, providing a versatile and efficient solution for reconciling vast datasets. This enhancement is a testament to the scalability and speed achieved through the adoption of distributed data processing solutions.

In this post, we explain how we integrated Amazon EMR to build a highly available and scalable system that enabled us to run a high-volume financial reconciliation process.

Architecture before migration

The following diagram illustrates our previous architecture.

Our legacy service was built with Amazon Elastic Container Service (Amazon ECS) on AWS Fargate. We processed the data sequentially using Python. However, due to its lack of parallel processing capability, we frequently had to increase the cluster size vertically to support larger datasets. For context, 5 GB of data with 50 operations took around 3 hours to process. This service was configured to scale horizontally to five ECS instances that polled messages from Amazon Simple Queue Service (Amazon SQS), which fed the transformation requests. Each instance was configured with 4 vCPUs and 30 GB of memory to allow horizontal scaling. However, we couldn’t expand its capacity on performance because the process happened sequentially, picking chunks of data from Amazon Simple Storage Service (Amazon S3) for processing. For example, a VLOOKUP operation where two files are to be joined required both files to be read in memory chunk by chunk to obtain the output. This became an obstacle for users because they had to wait for long periods of time to process their datasets.

As part of our re-architecture and modernization, we wanted to achieve the following:

  • High availability – The data processing clusters should be highly available, providing three 9s of availability (99.9%)
  • Throughput – The service should handle 1,500 runs per day
  • Latency – It should be able to process 100 GB of data within 30 minutes
  • Heterogeneity – The cluster should be able to support a wide variety of workloads, with files ranging from a few MBs to hundreds of GBs
  • Query concurrency – The implementation demands the ability to support a minimum of 10 degrees of concurrency
  • Reliability of jobs and data consistency – Jobs need to run reliably and consistently to avoid breaking Service Level Agreements (SLAs)
  • Cost-effective and scalable – It must be scalable based on the workload, making it cost-effective
  • Security and compliance – Given the sensitivity of data, it must support fine-grained access control and appropriate security implementations
  • Monitoring – The solution must offer end-to-end monitoring of the clusters and jobs

Why Amazon EMR

Amazon EMR is the industry-leading cloud big data solution for petabyte-scale data processing, interactive analytics, and machine learning (ML) using open source frameworks such as Apache Spark, Apache Hive, and Presto. With these frameworks and related open-source projects, you can process data for analytics purposes and BI workloads. Amazon EMR lets you transform and move large amounts of data in and out of other AWS data stores and databases, such as Amazon S3 and Amazon DynamoDB.

A notable advantage of Amazon EMR lies in its effective use of parallel processing with PySpark, marking a significant improvement over traditional sequential Python code. This innovative approach streamlines the deployment and scaling of Apache Spark clusters, allowing for efficient parallelization on large datasets. The distributed computing infrastructure not only enhances performance, but also enables the processing of vast amounts of data at unprecedented speeds. Equipped with libraries, PySpark facilitates Excel-like operations on DataFrames, and the higher-level abstraction of DataFrames simplifies intricate data manipulations, reducing code complexity. Combined with automatic cluster provisioning, dynamic resource allocation, and integration with other AWS services, Amazon EMR proves to be a versatile solution suitable for diverse workloads, ranging from batch processing to ML. The inherent fault tolerance in PySpark and Amazon EMR promotes robustness, even in the event of node failures, making it a scalable, cost-effective, and high-performance choice for parallel data processing on AWS.

Amazon EMR extends its capabilities beyond the basics, offering a variety of deployment options to cater to diverse needs. Whether it’s Amazon EMR on EC2, Amazon EMR on EKS, Amazon EMR Serverless, or Amazon EMR on AWS Outposts, you can tailor your approach to specific requirements. For those seeking a serverless environment for Spark jobs, integrating AWS Glue is also a viable option. In addition to supporting various open-source frameworks, including Spark, Amazon EMR provides flexibility in choosing deployment modes, Amazon Elastic Compute Cloud (Amazon EC2) instance types, scaling mechanisms, and numerous cost-saving optimization techniques.

Amazon EMR stands as a dynamic force in the cloud, delivering unmatched capabilities for organizations seeking robust big data solutions. Its seamless integration, powerful features, and adaptability make it an indispensable tool for navigating the complexities of data analytics and ML on AWS.

Redesigned architecture

The following diagram illustrates our redesigned architecture.

The solution operates under an API contract, where clients can submit transformation configurations, defining the set of operations alongside the S3 dataset location for processing. The request is queued through Amazon SQS, then directed to Amazon EMR via a Lambda function. This process initiates the creation of an Amazon EMR step for Spark framework implementation on a dedicated EMR cluster. Although Amazon EMR accommodates an unlimited number of steps over a long-running cluster’s lifetime, only 256 steps can be running or pending simultaneously. For optimal parallelization, the step concurrency is set at 10, allowing 10 steps to run concurrently. In case of request failures, the Amazon SQS dead-letter queue (DLQ) retains the event. Spark processes the request, translating Excel-like operations into PySpark code for an efficient query plan. Resilient DataFrames store input, output, and intermediate data in-memory, optimizing processing speed, reducing disk I/O cost, enhancing workload performance, and delivering the final output to the specified Amazon S3 location.

We define our SLA in two dimensions: latency and throughput. Latency is defined as the amount of time taken to perform one job against a deterministic dataset size and the number of operations performed on the dataset. Throughput is defined as the maximum number of simultaneous jobs the service can perform without breaching the latency SLA of one job. The overall scalability SLA of the service depends on the balance of horizontal scaling of elastic compute resources and vertical scaling of individual servers.

Because we had to run 1,500 processes per day with minimal latency and high performance, we choose to integrate Amazon EMR on EC2 deployment mode with managed scaling enabled to support processing variable file sizes.

The EMR cluster configuration provides many different selections:

  • EMR node types – Primary, core, or task nodes
  • Instance purchasing options – On-Demand Instances, Reserved Instances, or Spot Instances
  • Configuration options – EMR instance fleet or uniform instance group
  • Scaling options – Auto Scaling or Amazon EMR managed scaling

Based on our variable workload, we configured an EMR instance fleet (for best practices, see Reliability). We also decided to use Amazon EMR managed scaling to scale the core and task nodes (for scaling scenarios, refer to Node allocation scenarios). Lastly, we chose memory-optimized AWS Graviton instances, which provide up to 30% lower cost and up to 15% improved performance for Spark workloads.

The following code provides a snapshot of our cluster configuration:

Concurrent steps:10

EMR Managed Scaling:
minimumCapacityUnits: 64
maximumCapacityUnits: 512
maximumOnDemandCapacityUnits: 512
maximumCoreCapacityUnits: 512

Master Instance Fleet:
r6g.xlarge
- 4 vCore, 30.5 GiB memory, EBS only storage
- EBS Storage:250 GiB
- Maximum Spot price: 100 % of On-demand price
- Each instance counts as 1 units
r6g.2xlarge
- 8 vCore, 61 GiB memory, EBS only storage
- EBS Storage:250 GiB
- Maximum Spot price: 100 % of On-demand price
- Each instance counts as 1 units

Core Instance Fleet:
r6g.2xlarge
- 8 vCore, 61 GiB memory, EBS only storage
- EBS Storage:100 GiB
- Maximum Spot price: 100 % of On-demand price
- Each instance counts as 8 units
r6g.4xlarge
- 16 vCore, 122 GiB memory, EBS only storage
- EBS Storage:100 GiB
- Maximum Spot price: 100 % of On-demand price
- Each instance counts as 16 units

Task Instances:
r6g.2xlarge
- 8 vCore, 61 GiB memory, EBS only storage
- EBS Storage:100 GiB
- Maximum Spot price: 100 % of On-demand price
- Each instance counts as 8 units
r6g.4xlarge
- 16 vCore, 122 GiB memory, EBS only storage
- EBS Storage:100 GiB
- Maximum Spot price: 100 % of On-demand price
- Each instance counts as 16 units

Performance

With our migration to Amazon EMR, we were able to achieve a system performance capable of handling a variety of datasets, ranging from as low as 273 B to as high as 88.5 GB with a p99 of 491 seconds (approximately 8 minutes).

The following figure illustrates the variety of file sizes processed.

The following figure shows our latency.

To compare against sequential processing, we took two datasets containing 53 million records and ran a VLOOKUP operation against each other, along with 49 other Excel-like operations. This took 26 minutes to process in the new service, compared to 5 days to process in the legacy service. This improvement is almost 300 times greater over the previous architecture in terms of performance.

Considerations

Keep in mind the following when considering this solution:

  • Right-sizing clusters – Although Amazon EMR is resizable, it’s important to right-size the clusters. Right-sizing mitigates a slow cluster, if undersized, or higher costs, if the cluster is oversized. To anticipate these issues, you can calculate the number and type of nodes that will be needed for the workloads.
  • Parallel steps – Running steps in parallel allows you to run more advanced workloads, increase cluster resource utilization, and reduce the amount of time taken to complete your workload. The number of steps allowed to run at one time is configurable and can be set when a cluster is launched and any time after the cluster has started. You need to consider and optimize the CPU/memory usage per job when multiple jobs are running in a single shared cluster.
  • Job-based transient EMR clusters – If applicable, it is recommended to use a job-based transient EMR cluster, which delivers superior isolation, verifying that each task operates within its dedicated environment. This approach optimizes resource utilization, helps prevent interference between jobs, and enhances overall performance and reliability. The transient nature enables efficient scaling, providing a robust and isolated solution for diverse data processing needs.
  • EMR Serverless – EMR Serverless is the ideal choice if you prefer not to handle the management and operation of clusters. It allows you to effortlessly run applications using open-source frameworks available within EMR Serverless, offering a straightforward and hassle-free experience.
  • Amazon EMR on EKS – Amazon EMR on EKS offers distinct advantages, such as faster startup times and improved scalability resolving compute capacity challenges—which is particularly beneficial for Graviton and Spot Instance users. The inclusion of a broader range of compute types enhances cost-efficiency, allowing tailored resource allocation. Furthermore, Multi-AZ support provides increased availability. These compelling features provide a robust solution for managing big data workloads with improved performance, cost optimization, and reliability across various computing scenarios.

Conclusion

In this post, we explained how Amazon optimized its high-volume financial reconciliation process with Amazon EMR for higher scalability and performance. If you have a monolithic application that’s dependent on vertical scaling to process additional requests or datasets, then migrating it to a distributed processing framework such as Apache Spark and choosing a managed service such as Amazon EMR for compute may help reduce the runtime to lower your delivery SLA, and also may help reduce the Total Cost of Ownership (TCO).

As we embrace Amazon EMR for this particular use case, we encourage you to explore further possibilities in your data innovation journey. Consider evaluating AWS Glue, along with other dynamic Amazon EMR deployment options such as EMR Serverless or Amazon EMR on EKS, to discover the best AWS service tailored to your unique use case. The future of the data innovation journey holds exciting possibilities and advancements to be explored further.


About the Authors

Jeeshan Khetrapal is a Sr. Software Development Engineer at Amazon, where he develops fintech products based on cloud computing serverless architectures that are responsible for companies’ IT general controls, financial reporting, and controllership for governance, risk, and compliance.

Sakti Mishra is a Principal Solutions Architect at AWS, where he helps customers modernize their data architecture and define their end-to-end data strategy, including data security, accessibility, governance, and more. He is also the author of the book Simplify Big Data Analytics with Amazon EMR. Outside of work, Sakti enjoys learning new technologies, watching movies, and visiting places with family.

[$] Declarative partitioning in PostgreSQL

Post Syndicated from daroc original https://lwn.net/Articles/965508/

Keith Fiske gave a talk
(with
slides
) about the state of partitioning — splitting a large
table into smaller tables for performance reasons — in
PostgreSQL at
SCALE
this year. He spoke about the existing support for partitioning, what work still
needs to be done, and what place existing partitioning tools, like his own

pg_partman
, still have as PostgreSQL gains more built-in features.

Отговорност за щетите в Министерството на електронното управление

Post Syndicated from Bozho original https://blog.bozho.net/blog/4246

Онзи ден Борисов каза, че преговорният екип на ГЕРБ се е борил за това министър на електронното управление да остане Йоловски. Мисля, че е важно да маркирам този факт, защото поне вече е ясно кой носи отговорност за щетите, нанесени там в последните месеци.

В министерството има общо 9 дирекции, главен секретар и една изпълнителна агенция. За последните 9 месеца са уволнени, помолени да напуснат, принудени да напуснат или преместени: главния секретар, изпълнителния директор на агенцията и директорите на 8 от 9-те дирекции.

И тази своеобразна чистка е само една от многото причини за липсата на резултати. Още в края на есента писах, че нямам очаквания, че политическото ръководство на МЕУ ще се справи със задачите, а напредъкът по управленската програма беше основно заради това, което свършихме в парламента. И това е разбираемо – при това разбиване на министерството, няма как там да се работи продуктивно.

Политиката за електронно управление е изключително важна за цялостното развитие на страната – за намаляване на административната тежест, за повече проследимост и прозрачност, за киберсигурността. И има нужда да бъдат придвижвани напред компетентно и систематично – нещо, което в последните 9 месеца се случваше в парламента, но далеч не толкова в МЕУ.

Материалът Отговорност за щетите в Министерството на електронното управление е публикуван за пръв път на БЛОГодаря.

Security updates for Thursday

Post Syndicated from jake original https://lwn.net/Articles/966961/

Security updates have been issued by Fedora (perl-Data-UUID, python-pygments, and thunderbird), Mageia (clojure, grub2, kernel,kmod-xtables-addons,kmod-virtualbox, kernel-linus, nss firefox, nss, python3, python, tcpreplay, and thunderbird), Oracle (nodejs:18), Red Hat (.NET 6.0 and dnsmasq), SUSE (avahi and python39), and Ubuntu (curl, linux-intel-iotg, linux-intel-iotg-5.15, unixodbc, and util-linux).

Хронология на неосъществилата се ротация

Post Syndicated from Bozho original https://blog.bozho.net/blog/4244

Малко хронология на неосъществилата се ротация:

На 17-ти март Мария Габриел предложи: ротация на премиера и вицепремиера, без смяна на министри, и отлагане на подписването на споразумение за неопределено време.

ППДБ отказахме, защото за нас споразумението беше ключово.

На 19-ти март Мария Габриел внесе несъгласуван състав на Министерския съвет на втория ден от седемте за изпълнение на мандата без логично обяснение защо.

На 24-ти март Николай Денков предложи ротация на премиера и вицепремиера, без смяна на министри, но с подписано споразумение.

ГЕРБ отказаха. Вчера отказаха и повторно аналогично предложение с втория мандат, но с номиниран от тях премиер.

Разликата между предложенията на двете страни е ясна – споразумението. А какво има в него?

Съдебна реформа, реформа на службите, избор на независими регулатори, избор на органи на съдебната власт без гарантирани места за никого.
Все неща, без които държавата не може да върви напред. Неща, които щяха да бъдат протакани, отлагани и подменяни, ако ги няма черно на бяло.
И затова отиваме на избори – защото изглежда ГЕРБ са решили, че предпочитат избори пред това да имат твърд ангажимент по тези реформи, а ние (противно на обвиненията) не искаме да стоим във властта самоцелно, без да правим тези фундаментални за страната промени.

А всички „лакърдии“ от преговорния процес са шум и отклоняване на вниманието – кой с кого се срещал, какви имена задраскал, кой какво поискал, кой колко бил обиден и т.н.

България може да реши фундаменталните си проблеми само с независима съдебна система (без политици да назначават хора по върховете ѝ), с независими регулатори и с работещи служби. И това е най-трудната, но и най-важната политическа задача.

Материалът Хронология на неосъществилата се ротация е публикуван за пръв път на БЛОГодаря.

Our new theory of change

Post Syndicated from Ben Durbin original https://www.raspberrypi.org/blog/theory-of-change-2024/

One of the Raspberry Pi Foundation’s core values is our focus on impact. This means that we are committed to learning from the best available evidence, and to being rigorous and transparent about the difference we’re making.

A smiling girl holding a robot buggy in her lap

Like many charities, an important part of our approach to achieving and measuring our impact is our theory of change. We are excited to launch a newly refreshed theory of change that reflects our mission and strategy to ensure that young people can realise their full potential through the power of computing and digital technologies.

What is a theory of change?

A theory of change describes the difference an organisation aims to make in the world, the actions it takes to achieve this, and the underlying assumptions about how its actions will create change.

Two learners sharing a laptop in a coding session.

It’s like a good cake recipe. It describes the ingredients and tools that are required, how these are combined, and what the results should be. But a theory of change goes further: it also addresses why you need the cake in the first place, and the reasons why the recipe will produce such a good cake if you follow it correctly!

What is the change we want to make?

Our theory of change begins with a statement of the problem that needs solving: too many young people are missing out on the enormous opportunities from digital technologies, and access to opportunities to learn depends too much on who you are and where you were born.

We want to see a world where young people can take advantage of the opportunities that computers and digital technologies offer to transform their own lives and communities, to contribute to society, and to help address the world’s challenges.

Learners in a computing classroom.

To help us empower young people to do this, we have identified three broad sets of outcomes that we should target, measure, and hold ourselves accountable for. These map roughly to the COM-B model of behaviour change. This model suggests that for change to be achieved, people need a combination of capabilities, opportunities, and motivation.

Our identified outcomes are that we support young people to:

  1. Build knowledge and skills in computing
  2. Understand the opportunities and risks associated with new technologies
  3. Develop the mindsets to confidently engage with technological change

How do we make a difference?

We work at multiple levels throughout education systems and society, which together will achieve deep and long-lasting change for young people. We design learning experiences and initiatives that are fun and engaging, including hundreds of free coding and computing projects, the Coolest Projects showcase for young tech creators, and the European Astro Pi Challenge, which gives young people the chance to run their computer programs in space.

Three learners working at laptops.

We also support teachers, youth workers, volunteers, and parents to develop their skills and knowledge, and equip them to inspire young people and help them learn. For example, The Computing Curriculum provides a complete bank of free lesson plans and other resources, and Experience AI is our educational programme that includes everything teachers need to deliver lessons on artificial intelligence and machine learning in secondary schools.

Finally, we aim to elevate the state of computing education globally by advocating for policy and systems change, and undertaking our own original research to deepen our understanding of how young people learn about computing.

How will we use our theory of change?

Our theory of change is an important part of our approach to evaluating the impact of our resources and programmes, and it informs all our monitoring and evaluation plans. These plans identify the questions we want to answer, key metrics to monitor, and the data sources we use to understand the impact we’re having and to gather feedback to improve our impact in future.

An educator teaches students to create with technology.

The theory of change also informs a shared outcomes framework that we are applying consistently across all of our products. This framework supports planning and helps keep us focused as we consider new opportunities to further our mission.

A final role our theory of change plays is to help communicate our mission to other stakeholders, and explain how we can work with our partners and communities to achieve change.

You can read our new theory of change here and if you have any questions or feedback on it, please do get in touch.

The post Our new theory of change appeared first on Raspberry Pi Foundation.

Hardware Vulnerability in Apple’s M-Series Chips

Post Syndicated from Bruce Schneier original https://www.schneier.com/blog/archives/2024/03/hardware-vulnerability-in-apples-m-series-chips.html

It’s yet another hardware side-channel attack:

The threat resides in the chips’ data memory-dependent prefetcher, a hardware optimization that predicts the memory addresses of data that running code is likely to access in the near future. By loading the contents into the CPU cache before it’s actually needed, the DMP, as the feature is abbreviated, reduces latency between the main memory and the CPU, a common bottleneck in modern computing. DMPs are a relatively new phenomenon found only in M-series chips and Intel’s 13th-generation Raptor Lake microarchitecture, although older forms of prefetchers have been common for years.

[…]

The breakthrough of the new research is that it exposes a previously overlooked behavior of DMPs in Apple silicon: Sometimes they confuse memory content, such as key material, with the pointer value that is used to load other data. As a result, the DMP often reads the data and attempts to treat it as an address to perform memory access. This “dereferencing” of “pointers”—meaning the reading of data and leaking it through a side channel—­is a flagrant violation of the constant-time paradigm.

[…]

The attack, which the researchers have named GoFetch, uses an application that doesn’t require root access, only the same user privileges needed by most third-party applications installed on a macOS system. M-series chips are divided into what are known as clusters. The M1, for example, has two clusters: one containing four efficiency cores and the other four performance cores. As long as the GoFetch app and the targeted cryptography app are running on the same performance cluster—­even when on separate cores within that cluster­—GoFetch can mine enough secrets to leak a secret key.

The attack works against both classical encryption algorithms and a newer generation of encryption that has been hardened to withstand anticipated attacks from quantum computers. The GoFetch app requires less than an hour to extract a 2048-bit RSA key and a little over two hours to extract a 2048-bit Diffie-Hellman key. The attack takes 54 minutes to extract the material required to assemble a Kyber-512 key and about 10 hours for a Dilithium-2 key, not counting offline time needed to process the raw data.

The GoFetch app connects to the targeted app and feeds it inputs that it signs or decrypts. As its doing this, it extracts the app secret key that it uses to perform these cryptographic operations. This mechanism means the targeted app need not perform any cryptographic operations on its own during the collection period.

Note that exploiting the vulnerability requires running a malicious app on the target computer. So it could be worse. On the other hand, like many of these hardware side-channel attacks, it’s not possible to patch.

Slashdot thread.

Прозрачността в градската среда и това да си деен не само по избори

Post Syndicated from Боян Юруков original https://yurukov.net/blog/2024/sofia-deinost/

Все се говори за прозрачност и отчетност, но донякъде иронично остават доста мъгляви понятия. Писал съм за това доста през годините, например за фонда за лечение на деца, връзките на лекари с фарма компании и размислите на Радев дали е нужна прозрачност въобще. Тук опивам три малки примера какво се научава и какво можеш да направиш, ако имаш достъп, достъпност и поставени в контекст данни.

Това са все случаи с места в София, покрай които минавам редовно и затова съм се решил да се занимавам. Накрая ще добавя списък с ресурси, които може да ви помогнат да научите повече за средата около себе си. За съжаление, за София конкретно, тъй като във всички останали градове почти липсва информация.

В първия случай става въпрос за общински имот, на който има стар блок. Зад блока има паркинг. Преди няколко години живущите там са решили да преградят достъпа до имота усвоявайки го и създавайки частен паркинг. Слагат и автоматична врата с контролиран достъп. Преди 5 години някой подава сигнал, констатира се нарушение, установява се точно кой го е извършил, но заповедта се прехвърля между район Изгрев и дирекции в общината докато накрая потъва. Сега имат нов сигнал за същото и отговорът от район Изгрев е общо взето „тогава строителен контрол каза, че няма нарушение и оставихме случая“. Обаче, ако някой намери стария сигнал и прочете какво всъщност е написано, открива, че район Изгрев подвеждат и наистина са седели върху установен и документиран от институциите проблем с общинска земя години наред. Сега ДНСК е изискала нова проверка и действия по въпроса и ги чака.

Вторият случай пак е за общински имот. По-точно три, но ще се фокусираме върху най-големия. Този път инвеститор си е построил блок и е заградил съседните общински имоти. Известно време ги използва за строителни отпадъци, но после просто ги подготвя за строеж. На тези имоти незнайно как има одобрен градоустройствен план за жилищно строителство. Липсват документите за това на сайта на общината, но е добре известно, че става дума за общинска частна собственост. Явно е подготвено за продажба при „удобен общински съвет“. Това беше коментирано из групите на квартала и район Изгрев имат сигнал, на който отговориха вчера след двумесечно забавяне. Установили нарушението и нарушителя и му дали срок за доброволно премахване на оградата и освобождаване на имота. Не става ясно какъв е срокът и кога изтича. Малката подробност е, че аналогични сигнали от различни хора от квартала има 18 месеца по-рано. Тогава същите хора от район Изгрев по същия начин открили нарушение и е дали пак срок за същото. Отново не става ясно какъв, но година и половина по-късно не само няма предприети действия, но въпросният инвеститор си е насадил временни декоративни храстчета, които даже пораснаха, за да скрият какво се прави в имота. Има нов сигнал в общината за бездействието на района и непроследяването на собствените им актове.

Третият случай отново е за инвеститор, този път небезизвестен и с топли връзки с ключови хора в общината. В подготовка на нов техен проект, за да няма шанс някой да го оспорва, си осигуриха отделяне на парцел с широчина три метра по протежението на имота. Така се отделиха от „съседите“, които не бяха уведомени за последващите визи и разрешения, както е по закон. Класическа схема. Така си осигуриха разрешение за строителство само в големия парцел. Прекрасно – прецакаха системата. Последваха редица проблеми дори само със започването на строежа. За повечето бяха предупредени от район Изгрев и не бяха санкционирани. Нещо, което не успяха да скрият е, че са започнали строителни дейности и в малкия парцел, т.е. изкопаха основите и изляха стена на подземните гаражи видимо разширявайки ги в рамките на ония „юридически-санитарен“ имот и извън параметрите на проекта. Общината има сигнал, но единственото, което строителен контрол констатира е, че има разрешително за големия парцел. Премълчават дали се отнася до малкия и дали са направили проверка на място. Отново ДНСК ги чака за отговор. Ако ще се спазва буквата на закона, трябва да важи за всеки етап от строителството. Тук проблемът е, че ако не бъде отстранено това нарушение, на практика проектът не би следвало да получи акт 16, освен ако не прибегнат до нелегалните практики с които се свързва името им в медиите. Предвид как е предвиден проекта и какво се строи се очакват още проблеми най-вече свързани със задължителното озеленяване и дълбочина на почвен слой. Всичко това обаче се очаква да мине безпроблемно проверки също както аналогичните в други подобни проекти.

Всяко от тези неща изглежда дребно на пръв поглед, но са всъщност чести нарушения в София и други градове. Масово не се съблюдават изискванията, не се извършват реални проверки или когато е установено нарушение, не се санкционира или проследява отстраняването му от органите на общината. Понякога това заради чадър от ръководството, понякога е заради саботирани дела, но най-често е заради нехайство, липса на прозрачност и проследяване, а и откровена корупция по ниските нива. Това позволява особено на едри строители, за които иначе се предполага, че са им изрядни документите, да правят куп нарушения, включително с цел позволяване на строителство. Това включва подкупи за получаване на становище за пожарна безопасност, ток и вода, „услуги“ и скриване на процедурите по одобрение, както и уреждане на по-добри параметри за строеж и продажба на общинска земя директно от общинския съвет.

Лесно е да се каже, че в общината са некадърни и „не е виновен тоя дето яде баницата“. В действителност това е модел на поведение, който не се оправя с избори, а с ежедневни усилия, както всяко друго нещо в държавата ни. Означава и че действията на чиновници и техните ръководители също се диктува от това какво може да им се размине. Затова, ако искате да направите нещо отвъд гневните емоджита и писане по групи във фейса, ето няколко ресурса, от които да започнете без да ви отнема много време:

  • isofmap.bg – това е карта с повечето слоеве на градско планиране и застрояване, които самата община гледа. Там ще намерите информация за собственост на имоти, инфраструктура и прочие. От слоевете ще намерите и карта на планирано и съществуващо застрояване. Отчасти на данните в тази карта се базира 3D картата, която започнах
  • Регистрите на НАГ – тук има документи за всякакви фази и аспекти от строителството. Включително разрешения за поставяне и санкции.
  • Картата на НАГ – всеки документ от онзи регистър би трябвало да е на тази карта. Подобно на isofmap има доста слоеве, но като натиснете на имот и показва известни свързани документи. За съжаление, 30% от документите не са свързани с картата, но доста от новите са
  • call.sofia.bg – сигнали към общината за нередности и проблеми в градската среда.
  • Визуализацията към call.sofia – тъй като на портала на общината не се откриват стари сигнал и не е особено лесен за търсене по принцип, направих тази визуализация. С нея открих и стаите сигнали, за които говоря по-горе. Пак на база тези данни направих карта на сигналите за паднали клони в София тази зима.
  • Картата на GovAlert – тъй като регистрите и дори картата на НАГ не са особено лесни за търсене и ориентиране, направих тази карта, която се обновява в реално време. Има филтри за време и видове документи. Също се опитва да свърже документи, които не са включени в картата на НАГ като търси идентификатори на имоти. Повече ще прочетете в статията ми когато започнах проекта преди три години.
  • Twitter акаунта на @NAG_SO_public – тъй като не всички документи може да се сложат на карта, всичко се пуска допълнително и в този акаунт като новини. Добавени са също прес съобщения от НАГ, обявления за обществени обсъждания и прочие.
  • Сигурно електронно връчване – за всякаква комуникация с институции е полезно. Трябва само ПИК на НАП или електронен подпис в момента. Докато при сигналите към общината няма опция за отговор или ескалиране на проблем, тук може лесно да се препращат сигнали, добавя информация и оспорват резултати. Също да се изпраща запитвания по ЗДОИ. С този портал няма опция да не входират документ, защото всичко е проследимо и подписано електронно.

Ресурсите за градоустройство в София всъщност предоставят някаква прозрачност и данни, макар да е все още трудна за следене и преглеждане. В другите градове дори това липсва. Доколкото строителството там беше несравнимо по-малко дори спрямо населението и размерите на града, това се променя в последните години особено в Пловдив и Бургас. Затова добавих Пловдив и Благоевград и работя все още да добавя Бургас и Варна към картата и бюлетина на отделен twitter акаунт – @BGCityPlanning. Все пак, поради значително по-малкия поток от информация, може да следите протоколите и обявите на сайта на общината си докато нещо по-добро е налично.

The post Прозрачността в градската среда и това да си деен не само по избори first appeared on Блогът на Юруков.

Грешка 404: Здравеопазване по неправилно зададени параметри

Post Syndicated from Надежда Цекулова original https://www.toest.bg/greshka-404-zdraveopazvane-po-nepravilno-zadadeni-parametri/

Грешка 404: Здравеопазване по неправилно зададени параметри

Мария Шаркова е адвокат, специализиращ в сферата на медицинското право. През 2019 г. създава уебсайта „Лекарска грешка“, в който събира статистика за делата по случаите, наречени в правото „медицински деликти“. Тя обаче смята, че в крайна сметка важното е не да се регистрират т.нар. лекарски грешки, а дали може да не се стига до подобни събития. В последното си изследване адв. Шаркова се занимава с въпроса как е гарантирано качеството на медицинската помощ в българската нормативна уредба. 

Защо се занимавате с изследвания, свързани с качеството на медицинската помощ?

През 2016 г. учих в САЩ и времето, което изкарах там, ми даде да разбера, че в България не събираме никакви данни, свързани с инцидентите в лечебните заведения и въобще с качеството на медицинската помощ. А когато липсват данни, не може да се вземат аргументирани решения, всичко е само лично мнение. 

Когато се върнах, започнах да изследвам съдебната практика при делата на пациенти срещу лекари и лечебни заведения. Правя това и до ден днешен. Натрупах богата база данни от близо 600 дела. Това са хиляди постановени съдебни актове, защото по едно дело може да се постановят и три съдебни акта, ако делото мине на три инстанции. Първият етап беше да извадя ясните количествени индикатори – колко дела са се водили за определен период, кои специалности стават най-често обект на съдебни дела, каква част от тези дела са приключили в полза на пациента и т.н.

Следващият етап дойде логично с въпросите какво е качествена медицинска помощ, кога пациентът получава некачествена медицинска помощ и респективно каква е дължимата грижа, която пациентите имат право да очакват от медицинския персонал и от лечебното заведение. Това не са абстрактни въпроси, те би трябвало да имат ясен отговор в нормативната уредба и в съдебната практика. 

Установихте ли такъв ясен отговор при изследването си?

За съжаление, установих, че има много неясноти и много противоречия – както в съдебната практика, така и в правната теория, а и сред самите медицински специалисти. Има много неизяснени въпроси или недокрай изяснени, или такива, които са регламентирани противоречиво.

Наскоро публикувахте статия по този въпрос в сп. „Медицинско право и здравеопазване“ (бр. 1/2024), но читателите на „Тоест“ са с разнообразни компетентности и вероятно малцина от тях са юристи. След като Вие като юрист откривате толкова неясноти, може ли да се формулира достъпен съвет какво има право да изисква всеки от нас като пациент?

Това, което е ясно и което е написано в закона, е, че медицинската помощ в България трябва да се оказва въз основата на утвърдени от науката и практиката методи. Тоест когато пациент отиде в лечебно заведение, той има право да очаква, а медицинският персонал е длъжен да му оказва такава медицинска помощ, която е утвърдена и в медицинската теория, и в практиката. 

И тук вече идва въпросът какво означава това. Как разбираме къде е записано по какъв начин се утвърждават тези методи?

Ще Ви дам един добре познат пример. Представете си, че една жена отива да ражда. Допустимо ли е по време на раждането да ѝ приложат метода „Кристелер“, който българските родилки познават като „скачане по корема“ и е описан в учебник по акушерство и гинекология от 1967 г., или медиците, асистиращи на раждането, трябва да се съобразяват със съвременната наука, според която този метод е отречен и се смята за опасен, а в много държави е и изрично забранен? Българската уредба не ни дава ясен отговор. 

Друг проблем, който е свързан с оказването на медицинска помощ, е в случаите, в които пациентът смята, че има някакъв пропуск в неговото лечение. За да се установи дали това е така, съдът назначава вещи лица. Когато едно вещо лице преценява дали лечението е било правилно, или дали диагнозата е била правилно поставена, или дали се е процедирало както трябва, то обикновено изразява своето мнение, основано на собствения му опит. Много рядко вещите лица се опират на утвърдените от науката и практиката методи. В доста случаи те дори не посочват научните източници, на които основават твърдението си, че пациентът е получил качествена или некачествена медицинска помощ. 

Така че – да се върна към въпроса Ви – всеки от нас има право да изисква и да получи медицинска помощ съобразно утвърдените от науката и практиката методи. За съжаление, никой от нас не може със сигурност да знае кои са тези методи, защото това не е изрично разписано.

В Закона за здравето е записано, че качеството на медицинската помощ се основава на медицински стандарти и Правила за добра медицинска практика. Не следва ли именно в тези документи да пише кои са утвърдените от науката и практиката методи, за които говорите? 

По принцип следва. Но тук идва следващият проблем. В Закона за лечебните заведения пише, че тези медицински стандарти трябва да се приемат и утвърждават от министъра на здравеопазването. Но няма единен модел, по който те да бъдат разработвани, не е изяснено какво трябва да е тяхното съдържание, и не е регламентиран редът, по който се изготвят проектите на тези стандарти, докато стигнат до утвърждаване с наредба от министъра на здравеопазването. Така стигаме до съществуващата практика голяма част от стандартите да се изготвят на тъмно, без широкото участие на медицинската общност. Понякога в тях може да се открият лобистки текстове, които отразяват интересите на много тесен кръг от специалисти, участвали в изготвянето им.

Може ли да дадете пример? Трудно е да си представи човек как един медицински стандарт може да обслужва нечий интерес.

Например преди две-три години с промени във всички медицински стандарти беше премахнато изискването за брой медицински персонал, който задължително трябва да има в едно звено, било то клиника или отделение. Това беше оставено на преценката на лечебните заведения в зависимост от тяхната натовареност и необходимост с оглед конкретен пациент. Но това е едно много широко понятие, а броят на персонала много често има пряко отношение към качеството на медицинската помощ. Ако в една клиника или отделение има 30 или 35 пациенти, не е редно да се остави на преценката на лечебното заведение дали те ще бъдат обслужвани от петима специалисти, или от един специализант.

Извън тези количествени показатели не са ли разписани в медицинските стандарти конкретни „методи, утвърдени в науката и практиката“?

Най-често не са. Иначе казано, в момента пациентите в България по закон имат право да получат качествена медицинска помощ, но ако по някаква причина сметнат, че това тяхно право е нарушено, няма как да го докажат. Това ще зависи от субективната преценка на вещите лица. 

Да се върнем към примера ни за метода „Кристелер“. Ако  родилката, която споменахме по-рано в разговора, прецени, че като са ѝ приложили този метод, това не отговаря на изискването за качествена медицинска помощ, защото например ѝ е руптурирала матката или са ѝ счупили две ребра, или има други травми, тя трябва да докаже дали този метод е утвърден в науката и практиката, или не. Но в едно съдебно дело отговорът на въпроса ще зависи изцяло от вещото лице. И ако вещото лице е спряло своето професионално развитие с учебника от 1967 г., ще отговори, че да, това е един възможен метод, утвърден, и няма нищо лошо в използването му. 

Както пациентът зависи от това дали дадено вещо лице е актуализирало познанията си, по същия начин при евентуален правен спор зависи и медицинският специалист. Попадала съм на становище на вещо лице, в което пише, че в медицината всичко е възможно. Попадала съм на становище, в което лабораторните изследвания са сравнени с „невярна любовница“. 

Когато говорим за тези утвърдени от науката и практиката методи, те най-често се описват в документи, наречени протоколи или алгоритми за клинично поведение. В тях се описват действията, които трябва да се извършат в конкретна клинична ситуация, защото пациентът по принцип има право на „своевременна и достатъчна“ медицинска помощ, но за всяка конкретна ситуация кое е своевременно и кое е достатъчно, се описва именно в тези протоколи. В голяма част от медицинските стандарти обаче не се говори въобще за протоколи и алгоритми за поведение. В други се насочва към протоколите на конкретно професионално дружество, без да е ясно защо се реферира към тях. В трети се изисква всяко лечебно заведение само̀ да си изработи такива протоколи, а по някои специалности въобще няма разписани стандарти. Това създава един водовъртеж от случайни обстоятелства, в центъра на които попада пациентът.

Има ли добър пример?

Спешната медицина е единствената сфера, в която има утвърдени със заповед на министъра на здравеопазването правила за клинично поведение. Това е така, защото е предвидено и в самия стандарт. 

Разговорът ни не звучи оптимистично дотук. Излиза, че като пациенти не сме особено защитени и разчитаме изцяло на личностните качества на медицинските специалисти, при които ще попаднем.

Напомняте ми да отбележа, че медицинските специалисти също не са добре защитени. Защото и те разчитат на личностните си качества и ако при тях попадне случай, който надхвърля компетенциите им, те са в риск, защото няма начертана система, която да ги подкрепи. 

Нещо повече. Нормативната уредба нерядко, вместо да ги насърчава и подкрепя да прилагат медицина, основана на доказателства, в някои случаи изисква от тях точно обратното. Защото алгоритъмът, към който те са длъжни да се придържат, е на клиничната пътека. Ако този алгоритъм не бъде изпълнен, Здравната каса няма да заплати лечението или ще глоби лечебното заведение. А тези алгоритми нямат отношение към медицината, основана на доказателства, и нерядко принуждават лекарите да извършват ненужни дейности, но и не им дават възможност да извършат необходимите. Системата не предполага субективните качества и умения на работещите в нея да бъдат възпитавани в духа на съвременната медицинска наука. И това е голям проблем за всички, не само за пациентите или само за медиците. 

Бихте ли обяснили понятието „медицина, основана на доказателства“? 

Добрият медицински специалист е този, който прилага утвърдените от науката и практиката методи, но ги прилага чрез позоваване на медицината, основана на доказателства. Това означава, че когато лекарят или медицинската сестра, или акушерката, или друг медицински специалист избира да прилага даден метод, той трябва да бъде актуален и да бъде доказан. В медицинската наука има много ясни правила как един диагностично-лечебен метод се утвърждава и медицинските специалисти трябва да познават тези правила. 

Нека се върнем към нашия си пример – ако се чудим дали прилагането на метода „Кристелер“ съответства на качествената медицинска помощ, можем да проверим, следвайки тези правила на медицинската наука. И ще установим как през 1967 г. се е смятало, че това е единственият начин в определени случаи да подпомогнеш раждането при даден проблем. Но през годините са събрани данни, проведени са научни изследвания и проучвания, вече е доказано, че рискът от прилагането на метода надхвърля в пъти повече евентуалните ползи. Затова към момента това не е утвърден от науката и практиката метод.

Как се гарантира на практика дължимата грижа и качеството на медицинската помощ в по-добре регулирани системи? 

Нито една система не е съвършена, но има системи, в които за това се мисли активно. Един от ключовите моменти е осигуряването на задължително продължаващо обучение за медицинските специалисти, което да бъде и ефективно, и контролирано. Казано по-просто, държавата трябва да гарантира, че тези хора периодично се обучават в новите достижения на медицинската наука в своята сфера, а след това да контролира как новостите се прилагат в практиката. 

Другото е създаването на работещи етични правила и подкрепянето на медицинските специалисти да се придържат към тях. Тук говорим за нещо просто, каквото е очакването на пациента да получи човешко отношение, защото той е уязвимата страна в отношенията с лекаря и защото никой не е станал пациент по желание. Да се създадат условия за такова общуване между медици и пациенти, които да гарантират, че информираното съгласие не е само една бланка, която пациентът подписва под натиск, а истинска комуникация, в която му става ясно какво му предстои.

Третото, за което се мисли, е гарантирането на пътя на пациента през системата. Това са взаимовръзките между различни специалисти, различни лечебни заведения и различни етапи на лечение. Наскоро при мен беше пациентка, диагностицирана със злокачествено заболяване на кръвта. В решението си онкологичната комисия препоръчваше ревизия на хистологичните блокчета, както и извършване на ядрено-магнитен резонанс. Без обаче никой да насочи жената къде да направи този ядрено-магнитен резонанс, по какъв начин да се снабди с хистологията си, къде да бъде осъществена тази ревизия, кой да я осъществи и след като евентуално направи ревизията и ядрено-магнитния резонанс, какво да прави с резултатите. Никаква представа. Това беше забавило лечението на пациентката с около три месеца. 

В изследването си стигнахте ли до извод какво може да направи един пациент, за да си осигури качествена медицинска помощ въпреки недостатъците и противоречията в правилата? 

За съжаление, смея да кажа, че обективни предпоставки на законодателно равнище, които да гарантират подобна дължима грижа, няма. Това е въпрос на субективните качества на лекарите или на субективните качества на ръководителя на лечебно заведение. Но за да внеса малко оптимизъм, трябва да кажа, че все по-често срещам млади лекари, които искат да работят по съвременен начин, инвестират сами в развитието си и се опитват да бъдат коректив на системните грешки. В повечето случаи и в повечето лечебни заведения наистина се полага старание да се оказва оптималната медицинска помощ, която всеки пациент заслужава да получи и има право да получи.

The collective thoughts of the interwebz