Tag Archives: AWS Fault Injection Simulator

Securely validate business application resilience with AWS FIS and IAM

Post Syndicated from Dr. Rudolf Potucek original https://aws.amazon.com/blogs/devops/securely-validate-business-application-resilience-with-aws-fis-and-iam/

To avoid high costs of downtime, mission critical applications in the cloud need to achieve resilience against degradation of cloud provider APIs and services.

In 2021, AWS launched AWS Fault Injection Simulator (FIS), a fully managed service to perform fault injection experiments on workloads in AWS to improve their reliability and resilience. At the time of writing, FIS allows to simulate degradation of Amazon Elastic Compute Cloud (EC2) APIs using API fault injection actions and thus explore the resilience of workflows where EC2 APIs act as a fault boundary. 

In this post we show you how to explore additional fault boundaries in your applications by selectively denying access to any AWS API. This technique is particularly useful for fully managed, “black box” services like Amazon Simple Storage Service (S3) or Amazon Simple Queue Service (SQS) where a failure of read or write operations is sufficient to simulate problems in the service. This technique is also useful for injecting failures in serverless applications without needing to modify code. While similar results could be achieved with network disruption or modifying code with feature flags, this approach provides a fine granular degradation of an AWS API without the need to re-deploy and re-validate code.

Overview

We will explore a common application pattern: user uploads a file, S3 triggers an AWS Lambda function, Lambda transforms the file to a new location and deletes the original:

S3 upload and transform logical workflow: User uploads file to S3, upload triggers AWS Lambda execution, Lambda writes transformed file to a new bucket and deletes original. Workflow can be disrupted at file deletion.

Figure 1. S3 upload and transform logical workflow: User uploads file to S3, upload triggers AWS Lambda execution, Lambda writes transformed file to a new bucket and deletes original. Workflow can be disrupted at file deletion.

We will simulate the user upload with an Amazon EventBridge rate expression triggering an AWS Lambda function which creates a file in S3:

S3 upload and transform implemented demo workflow: Amazon EventBridge triggers a creator Lambda function, Lambda function creates a file in S3, file creation triggers AWS Lambda execution on transformer function, Lambda writes transformed file to a new bucket and deletes original. Workflow can be disrupted at file deletion.

Figure 2. S3 upload and transform implemented demo workflow: Amazon EventBridge triggers a creator Lambda function, Lambda function creates a file in S3, file creation triggers AWS Lambda execution on transformer function, Lambda writes transformed file to a new bucket and deletes original. Workflow can be disrupted at file deletion.

Using this architecture we can explore the effect of S3 API degradation during file creation and deletion. As shown, the API call to delete a file from S3 is an application fault boundary. The failure could occur, with identical effect, because of S3 degradation or because the AWS IAM role of the Lambda function denies access to the API.

To inject failures we use AWS Systems Manager (AWS SSM) automation documents to attach and detach IAM policies at the API fault boundary and FIS to orchestrate the workflow.

Each Lambda function has an IAM execution role that allows S3 write and delete access, respectively. If the processor Lambda fails, the S3 file will remain in the bucket, indicating a failure. Similarly, if the IAM execution role for the processor function is denied the ability to delete a file after processing, that file will remain in the S3 bucket.

Prerequisites

Following this blog posts will incur some costs for AWS services. To explore this test application you will need an AWS account. We will also assume that you are using AWS CloudShell or have the AWS CLI installed and have configured a profile with administrator permissions. With that in place you can create the demo application in your AWS account by downloading this template and deploying an AWS CloudFormation stack:

git clone https://github.com/aws-samples/fis-api-failure-injection-using-iam.git
cd fis-api-failure-injection-using-iam
aws cloudformation deploy --stack-name test-fis-api-faults --template-file template.yaml --capabilities CAPABILITY_NAMED_IAM

Fault injection using IAM

Once the stack has been created, navigate to the Amazon CloudWatch Logs console and filter for /aws/lambda/test-fis-api-faults. Under the EventBridgeTimerHandler log group you should find log events once a minute writing a timestamped file to an S3 bucket named fis-api-failure-ACCOUNT_ID. Under the S3TriggerHandler log group you should find matching deletion events for those files.

Once you have confirmed object creation/deletion, let’s take away the permission of the S3 trigger handler lambda to delete files. To do this you will attach the FISAPI-DenyS3DeleteObject  policy that was created with the template:

ROLE_NAME=FISAPI-TARGET-S3TriggerHandlerRole
ROLE_ARN=$( aws iam list-roles --query "Roles[?RoleName=='${ROLE_NAME}'].Arn" --output text )
echo Target Role ARN: $ROLE_ARN

POLICY_NAME=FISAPI-DenyS3DeleteObject
POLICY_ARN=$( aws iam list-policies --query "Policies[?PolicyName=='${POLICY_NAME}'].Arn" --output text )
echo Impact Policy ARN: $POLICY_ARN

aws iam attach-role-policy \
  --role-name ${ROLE_NAME}\
  --policy-arn ${POLICY_ARN}

With the deny policy in place you should now see object deletion fail and objects should start showing up in the S3 bucket. Navigate to the S3 console and find the bucket starting with fis-api-failure. You should see a new object appearing in this bucket once a minute:

S3 bucket listing showing files not being deleted because IAM permissions DENY file deletion during FIS experiment.

Figure 3. S3 bucket listing showing files not being deleted because IAM permissions DENY file deletion during FIS experiment.

If you would like to graph the results you can navigate to AWS CloudWatch, select “Logs Insights“, select the log group starting with /aws/lambda/test-fis-api-faults-S3CountObjectsHandler, and run this query:

fields @timestamp, @message
| filter NumObjects >= 0
| sort @timestamp desc
| stats max(NumObjects) by bin(1m)
| limit 20

This will show the number of files in the S3 bucket over time:

AWS CloudWatch Logs Insights graph showing the increase in the number of retained files in S3 bucket over time, demonstrating the effect of the introduced failure.

Figure 4. AWS CloudWatch Logs Insights graph showing the increase in the number of retained files in S3 bucket over time, demonstrating the effect of the introduced failure.

You can now detach the policy:

ROLE_NAME=FISAPI-TARGET-S3TriggerHandlerRole
ROLE_ARN=$( aws iam list-roles --query "Roles[?RoleName=='${ROLE_NAME}'].Arn" --output text )
echo Target Role ARN: $ROLE_ARN

POLICY_NAME=FISAPI-DenyS3DeleteObject
POLICY_ARN=$( aws iam list-policies --query "Policies[?PolicyName=='${POLICY_NAME}'].Arn" --output text )
echo Impact Policy ARN: $POLICY_ARN

aws iam detach-role-policy \
  --role-name ${ROLE_NAME}\
  --policy-arn ${POLICY_ARN}

We see that newly written files will once again be deleted but the un-processed files will remain in the S3 bucket. From the fault injection we learned that our system does not tolerate request failures when deleting files from S3. To address this, we should add a dead letter queue or some other retry mechanism.

Note: if the Lambda function does not return a success state on invocation, EventBridge will retry. In our Lambda functions we are cost conscious and explicitly capture the failure states to avoid excessive retries.

Fault injection using SSM

To use this approach from FIS and to always remove the policy at the end of the experiment, we first create an SSM document to automate adding a policy to a role. To inspect this document, open the SSM console, navigate to the “Documents” section, find the FISAPI-IamAttachDetach document under “Owned by me”, and examine the “Content” tab (make sure to select the correct region). This document takes the name of the Role you want to impact and the Policy you want to attach as parameters. It also requires an IAM execution role that grants it the power to list, attach, and detach specific policies to specific roles.

Let’s run the SSM automation document from the console by selecting “Execute Automation”. Determine the ARN of the FISAPI-SSM-Automation-Role from CloudFormation or by running:

POLICY_NAME=FISAPI-DenyS3DeleteObject
POLICY_ARN=$( aws iam list-policies --query "Policies[?PolicyName=='${POLICY_NAME}'].Arn" --output text )
echo Impact Policy ARN: $POLICY_ARN

Use FISAPI-SSM-Automation-Role, a duration of 2 minutes expressed in ISO8601 format as PT2M, the ARN of the deny policy, and the name of the target role FISAPI-TARGET-S3TriggerHandlerRole:

Image of parameter input field reflecting the instructions in blog text.

Figure 5. Image of parameter input field reflecting the instructions in blog text.

Alternatively execute this from a shell:

ASSUME_ROLE_NAME=FISAPI-SSM-Automation-Role
ASSUME_ROLE_ARN=$( aws iam list-roles --query "Roles[?RoleName=='${ASSUME_ROLE_NAME}'].Arn" --output text )
echo Assume Role ARN: $ASSUME_ROLE_ARN

ROLE_NAME=FISAPI-TARGET-S3TriggerHandlerRole
ROLE_ARN=$( aws iam list-roles --query "Roles[?RoleName=='${ROLE_NAME}'].Arn" --output text )
echo Target Role ARN: $ROLE_ARN

POLICY_NAME=FISAPI-DenyS3DeleteObject
POLICY_ARN=$( aws iam list-policies --query "Policies[?PolicyName=='${POLICY_NAME}'].Arn" --output text )
echo Impact Policy ARN: $POLICY_ARN

aws ssm start-automation-execution \
  --document-name FISAPI-IamAttachDetach \
  --parameters "{
      \"AutomationAssumeRole\": [ \"${ASSUME_ROLE_ARN}\" ],
      \"Duration\": [ \"PT2M\" ],
      \"TargetResourceDenyPolicyArn\": [\"${POLICY_ARN}\" ],
      \"TargetApplicationRoleName\": [ \"${ROLE_NAME}\" ]
    }"

Wait two minutes and then examine the content of the S3 bucket starting with fis-api-failure again. You should now see two additional files in the bucket, showing that the policy was attached for 2 minutes during which files could not be deleted, and confirming that our application is not resilient to S3 API degradation.

Permissions for injecting failures with SSM

Fault injection with SSM is controlled by IAM, which is why you had to specify the FISAPI-SSM-Automation-Role:

Visual representation of IAM permission used for fault injections with SSM. It shows the SSM execution role permitting access to use SSM automation documents as well as modify IAM roles and policies via the SSM document. It also shows the SSM user needing to have a pass-role permission to grant the SSM execution role to the SSM service.

Figure 6. Visual representation of IAM permission used for fault injections with SSM.

This role needs to contain an assume role policy statement for SSM to allow assuming the role:

      AssumeRolePolicyDocument:
        Statement:
          - Action:
             - 'sts:AssumeRole'
            Effect: Allow
            Principal:
              Service:
                - "ssm.amazonaws.com"

The role also needs to contain permissions to describe roles and their attached policies with an optional constraint on which roles and policies are visible:

          - Sid: GetRoleAndPolicyDetails
            Effect: Allow
            Action:
              - 'iam:GetRole'
              - 'iam:GetPolicy'
              - 'iam:ListAttachedRolePolicies'
            Resource:
              # Roles
              - !GetAtt EventBridgeTimerHandlerRole.Arn
              - !GetAtt S3TriggerHandlerRole.Arn
              # Policies
              - !Ref AwsFisApiPolicyDenyS3DeleteObject

Finally the SSM role needs to allow attaching and detaching a policy document. This requires

  1. an ALLOW statement
  2. a constraint on the policies that can be attached
  3. a constraint on the roles that can be attached to

In the role we collapse the first two requirements into an ALLOW statement with a condition constraint for the Policy ARN. We then express the third requirement in a DENY statement that will limit the '*' resource to only the explicit role ARNs we want to modify:

          - Sid: AllowOnlyTargetResourcePolicies
            Effect: Allow
            Action:  
              - 'iam:DetachRolePolicy'
              - 'iam:AttachRolePolicy'
            Resource: '*'
            Condition:
              ArnEquals:
                'iam:PolicyARN':
                  # Policies that can be attached
                  - !Ref AwsFisApiPolicyDenyS3DeleteObject
          - Sid: DenyAttachDetachAllRolesExceptApplicationRole
            Effect: Deny
            Action: 
              - 'iam:DetachRolePolicy'
              - 'iam:AttachRolePolicy'
            NotResource: 
              # Roles that can be attached to
              - !GetAtt EventBridgeTimerHandlerRole.Arn
              - !GetAtt S3TriggerHandlerRole.Arn

We will discuss security considerations in more detail at the end of this post.

Fault injection using FIS

With the SSM document in place you can now create an FIS template that calls the SSM document. Navigate to the FIS console and filter for FISAPI-DENY-S3PutObject. You should see that the experiment template passes the same parameters that you previously used with SSM:

Image of FIS experiment template action summary. This shows the SSM document ARN to be used for fault injection and the JSON parameters passed to the SSM document specifying the IAM Role to modify and the IAM Policy to use.

Figure 7. Image of FIS experiment template action summary. This shows the SSM document ARN to be used for fault injection and the JSON parameters passed to the SSM document specifying the IAM Role to modify and the IAM Policy to use.

You can now run the FIS experiment and after a couple minutes once again see new files in the S3 bucket.

Permissions for injecting failures with FIS and SSM

Fault injection with FIS is controlled by IAM, which is why you had to specify the FISAPI-FIS-Injection-EperimentRole:

Visual representation of IAM permission used for fault injections with FIS and SSM. It shows the SSM execution role permitting access to use SSM automation documents as well as modify IAM roles and policies via the SSM document. It also shows the FIS execution role permitting access to use FIS templates, as well as the pass-role permission to grant the SSM execution role to the SSM service. Finally it shows the FIS user needing to have a pass-role permission to grant the FIS execution role to the FIS service.

Figure 8. Visual representation of IAM permission used for fault injections with FIS and SSM. It shows the SSM execution role permitting access to use SSM automation documents as well as modify IAM roles and policies via the SSM document. It also shows the FIS execution role permitting access to use FIS templates, as well as the pass-role permission to grant the SSM execution role to the SSM service. Finally it shows the FIS user needing to have a pass-role permission to grant the FIS execution role to the FIS service.

This role needs to contain an assume role policy statement for FIS to allow assuming the role:

      AssumeRolePolicyDocument:
        Statement:
          - Action:
              - 'sts:AssumeRole'
            Effect: Allow
            Principal:
              Service:
                - "fis.amazonaws.com"

The role also needs permissions to list and execute SSM documents:

            - Sid: RequiredReadActionsforAWSFIS
              Effect: Allow
              Action:
                - 'cloudwatch:DescribeAlarms'
                - 'ssm:GetAutomationExecution'
                - 'ssm:ListCommands'
                - 'iam:ListRoles'
              Resource: '*'
            - Sid: RequiredSSMStopActionforAWSFIS
              Effect: Allow
              Action:
                - 'ssm:CancelCommand'
              Resource: '*'
            - Sid: RequiredSSMWriteActionsforAWSFIS
              Effect: Allow
              Action:
                - 'ssm:StartAutomationExecution'
                - 'ssm:StopAutomationExecution'
              Resource: 
                - !Sub 'arn:aws:ssm:${AWS::Region}:${AWS::AccountId}:automation-definition/${SsmAutomationIamAttachDetachDocument}:$DEFAULT'

Finally, remember that the SSM document needs to use a Role of its own to execute the fault injection actions. Because that Role is different from the Role under which we started the FIS experiment, we need to explicitly allow SSM to assume that role with a PassRole statement which will expand to FISAPI-SSM-Automation-Role:

            - Sid: RequiredIAMPassRoleforSSMADocuments
              Effect: Allow
              Action: 'iam:PassRole'
              Resource: !Sub 'arn:aws:iam::${AWS::AccountId}:role/${SsmAutomationRole}'

Secure and flexible permissions

So far, we have used explicit ARNs for our guardrails. To expand flexibility, we can use wildcards in our resource matching. For example, we might change the Policy matching from:

            Condition:
              ArnEquals:
                'iam:PolicyARN':
                  # Explicitly listed policies - secure but inflexible
                  - !Ref AwsFisApiPolicyDenyS3DeleteObject

or the equivalent:

            Condition:
              ArnEquals:
                'iam:PolicyARN':
                  # Explicitly listed policies - secure but inflexible
                  - !Sub 'arn:${AWS::Partition}:iam::${AWS::AccountId}:policy/${FullPolicyName}

to a wildcard notation like this:

            Condition:
              ArnEquals:
                'iam:PolicyARN':
                  # Wildcard policies - secure and flexible
                  - !Sub 'arn:${AWS::Partition}:iam::${AWS::AccountId}:policy/${PolicyNamePrefix}*'

If we set PolicyNamePrefix to FISAPI-DenyS3 this would now allow invoking FISAPI-DenyS3PutObject and FISAPI-DenyS3DeleteObject but would not allow using a policy named FISAPI-DenyEc2DescribeInstances.

Similarly, we could change the Resource matching from:

            NotResource: 
              # Explicitly listed roles - secure but inflexible
              - !GetAtt EventBridgeTimerHandlerRole.Arn
              - !GetAtt S3TriggerHandlerRole.Arn

to a wildcard equivalent like this:

            NotResource: 
              # Wildcard policies - secure and flexible
              - !Sub 'arn:${AWS::Partition}:iam::${AWS::AccountId}:role/${RoleNamePrefixEventBridge}*'
              - !Sub 'arn:${AWS::Partition}:iam::${AWS::AccountId}:role/${RoleNamePrefixS3}*'
and setting RoleNamePrefixEventBridge to FISAPI-TARGET-EventBridge and RoleNamePrefixS3 to FISAPI-TARGET-S3.

Finally, we would also change the FIS experiment role to allow SSM documents based on a name prefix by changing the constraint on automation execution from:

            - Sid: RequiredSSMWriteActionsforAWSFIS
              Effect: Allow
              Action:
                - 'ssm:StartAutomationExecution'
                - 'ssm:StopAutomationExecution'
              Resource: 
                # Explicitly listed resource - secure but inflexible
                # Note: the $DEFAULT at the end could also be an explicit version number
                # Note: the 'automation-definition' is automatically created from 'document' on invocation
                - !Sub 'arn:aws:ssm:${AWS::Region}:${AWS::AccountId}:automation-definition/${SsmAutomationIamAttachDetachDocument}:$DEFAULT'

to

            - Sid: RequiredSSMWriteActionsforAWSFIS
              Effect: Allow
              Action:
                - 'ssm:StartAutomationExecution'
                - 'ssm:StopAutomationExecution'
              Resource: 
                # Wildcard resources - secure and flexible
                # 
                # Note: the 'automation-definition' is automatically created from 'document' on invocation
                - !Sub 'arn:aws:ssm:${AWS::Region}:${AWS::AccountId}:automation-definition/${SsmAutomationDocumentPrefix}*'

and setting SsmAutomationDocumentPrefix to FISAPI-. Test this by updating the CloudFormation stack with a modified template:

aws cloudformation deploy --stack-name test-fis-api-faults --template-file template2.yaml --capabilities CAPABILITY_NAMED_IAM

Permissions governing users

In production you should not be using administrator access to use FIS. Instead we create two roles FISAPI-AssumableRoleWithCreation and FISAPI-AssumableRoleWithoutCreation for you (see this template). These roles require all FIS and SSM resources to have a Name tag that starts with FISAPI-. Try assuming the role without creation privileges and running an experiment. You will notice that you can only start an experiment if you add a Name tag, e.g. FISAPI-secure-1, and you will only be able to get details of experiments and templates that have proper Name tags.

If you are working with AWS Organizations, you can add further guard rails by defining SCPs that control the use of the FISAPI-* tags similar to this blog post.

Caveats

For this solution we are choosing to attach policies instead of permission boundaries. The benefit of this is that you can attach multiple independent policies and thus simulate multi-step service degradation. However, this means that it is possible to increase the permission level of a role. While there are situations where this might be of interest, e.g. to simulate security breaches, please implement a thorough security review of any fault injection IAM policies you create. Note that modifying IAM Roles may trigger events in your security monitoring tools.

The AttachRolePolicy and DetachRolePolicy calls from AWS IAM are eventually consistent, meaning that in some cases permission propagation when starting and stopping fault injection may take up to 5 minutes each.

Cleanup

To avoid additional cost, delete the content of the S3 bucket and delete the CloudFormation stack:

# Clean up policy attachments just in case
CLEANUP_ROLES=$(aws iam list-roles --query "Roles[?starts_with(RoleName,'FISAPI-')].RoleName" --output text)
for role in $CLEANUP_ROLES; do
  CLEANUP_POLICIES=$(aws iam list-attached-role-policies --role-name $role --query "AttachedPolicies[?starts_with(PolicyName,'FISAPI-')].PolicyName" --output text)
  for policy in $CLEANUP_POLICIES; do
    echo Detaching policy $policy from role $role
    aws iam detach-role-policy --role-name $role --policy-arn $policy
  done
done
# Delete S3 bucket content
ACCOUNT_ID=$( aws sts get-caller-identity --query Account --output text )
S3_BUCKET_NAME=fis-api-failure-${ACCOUNT_ID}
aws s3 rm --recursive s3://${S3_BUCKET_NAME}
aws s3 rb s3://${S3_BUCKET_NAME}
# Delete cloudformation stack
aws cloudformation delete-stack --stack-name test-fis-api-faults
aws cloudformation wait stack-delete-complete --stack-name test-fis-api-faults

Conclusion 

AWS Fault Injection Simulator provides the ability to simulate various external impacts to your application to validate and improve resilience. We’ve shown how combining FIS with IAM to selectively deny access to AWS APIs provides a generic path to explore fault boundaries across all AWS services. We’ve shown how this can be used to identify and improve a resilience problem in a common S3 upload workflow. To learn about more ways to use FIS, see this workshop.

About the authors:

Dr. Rudolf Potucek

Dr. Rudolf Potucek is Startup Solutions Architect at Amazon Web Services. Over the past 30 years he gained a PhD and worked in different roles including leading teams in academia and industry, as well as consulting. He brings experience from working with academia, startups, and large enterprises to his current role of guiding startup customers to succeed in the cloud.

Rudolph Wagner

Rudolph Wagner is a Premium Support Engineer at Amazon Web Services who holds the CISSP and OSCP security certifications, in addition to being a certified AWS Solutions Architect Professional. He assists internal and external Customers with multiple AWS services by using his diverse background in SAP, IT, and construction.

Hazard analysis and Chaos engineering at Vanguard Group

Post Syndicated from Jason Barto original https://aws.amazon.com/blogs/devops/hazard-analysis-and-chaos-engineering-at-vanguard-group/

Anticipating events that can cause a disruption to your system’s service is critical to building highly available, reliable systems.  Hazard analysis gives you a method to identify such events.  Chaos engineering gives you a method to confirm that a system behaves as expected in adverse conditions.  By combining these methods, Vanguard is building reliability into their systems.

Vanguard engineering teams perform hazard analysis on their systems and capture the identified events as failure scenarios.  They use the identified failure scenarios to create hypotheses to support chaos engineering experiments.  These hypotheses predict how the system will respond to failures and each hypothesis is then confirmed through experimentation to increase the team’s confidence in the system’s reliability.

In this article we will walk you through how Vanguard uses hazard analysis and chaos engineering.  We will also provide guidance on how you can employ these techniques on your applications.

Failure Mode & Effects Analysis

A hazard analysis can be performed using different methods.  At Vanguard, they have adapted the failure mode & effects analysis (FMEA) method to support their important services.

FMEA is a bottom-up approach to analyse an architecture and focus on the impact to system functions when one or more components of the system are disrupted. Members of the engineering team and architects responsible for designing and building a system brainstorm possible failure scenarios or failure modes, and document the impact of these failures on the system. Combined with a quantitative method for ranking the failure modes, the analysis process produces a prioritised list of failure modes which describes how the system would respond to individual or combined failures in its component parts or dependencies.

For each failure mode the team conducting the analysis will highlight what protections exist within the system to guard against the failure mode.  Sometimes, fault isolation boundaries have been put in place to prevent client impact in failure scenarios. In other scenarios, for one reason or another, there are hard dependencies in place for which the engineering team has decided not to build in fault tolerance. For example, a team responsible for a less-critical function may have architected its system to operate across multiple availability zones, but could decide not to implement other mitigations to prioritize cost over increased resilience.

The FMEA method has been in use by engineers in the automotive, aeronautical, healthcare, and military industries for more than 60 years.  Over that time, FMEA has been modified to best suit the organization and the field in which it was applied.  In many variations the FMEA measures each failure mode with a risk priority number (RPN), which is intended to quantitatively rank the failure mode based upon:

  1. The failure mode’s impact to the system as a whole
  2. The probability of the failure mode’s occurrence
  3. How easily the failure mode can be detected

Vanguard have adapted the FMEA process to serve their own specific requirements and processes.  Vanguard have decided not to adopt the RPN element of the FMEA process, as teams found they spent a lot of time debating the impact, probability, and detectability of individual failure modes.  To perform an FMEA more quickly, teams instead focus on the failure modes and system impact only, documenting a mental model of system performance which can be experimented through chaos engineering.

An excerpt of a Vanguard FMEA output is provided as an example in the following table:

The “Process Step” in the table above refers to a business function of the system being analyzed, for example “Request to retrieve stored data”. As part of the analysis, the team identifies the system components needed to perform the Process Step and considers the interactions of those components Focusing on a Process Step makes it easier to anticipate the failure scenarios that would affect the system in performing this particular business function. Also, the Process Step will imply an importance or criticality which can be a factor when prioritizing mitigations.

After selecting a Process Step, you walk through the system components involved and identify how component failures or disruptions will affect the wider system. Such component failures may involve individual components or a combination of components and are captured as “Failure Mode”. This identifies the component or components that are disrupted and their behaviour; for example, “Microservice is unavailable or returns an error”.

“Expected Behaviour” describes the effect of the failure mode on the wider system, in the context of the Process Step. This captures what other system components are affected by the Failure Mode and why, and how this impacts the Process Step as a whole.

Lastly, the “Hypothesis” column forms the basis for the chaos experiments that will follow from the FMEA to confirm that the system performs as expected.

At Vanguard, all mission-critical product teams are conducting FMEAs for their production applications. The outputs of these sessions are maintained over time and serve multiple purposes:

  1. When onboarding new team members, it is helpful to provide the FMEA document alongside an architecture diagram and narrative. It will paint a more robust picture of how the system is intended to operate in both “happy path” and “unhappy path” scenarios.
  2. When troubleshooting incidents, an FMEA document can help on-call engineers – especially those less experienced with debugging – to match up the documented expectations to the observed system behavior.
  3. Site Reliability Engineers (SREs) looking for opportunities to improve the resilience of a system might look to FMEA documentation to understand the existing fault isolation boundaries and introduce additional resilience mechanisms through automation and system changes.
  4. Finally, when selecting scenarios for experimentation with Chaos Engineering, the FMEA document provides a list of conjectures that have been mapped to hypotheses, ready to be validated through experimentation. This input into the Chaos Engineering workflow is the primary use of FMEA documents for Vanguard product teams.

There are many resources available online to learn more about how FMEA is used and applied in other organisations. In Failure Modes and Continuous Resilience, Adrian Cockcroft introduces FMEA as a method for anticipating failure scenarios. The NASA Software Engineering Handbook details how FMEAs are conducted as part of their engineering process. The Automotive Industry Group has also formally documented the use of FMEA in the Automotive Industry Action Group FMEA Handbook.

Chaos Engineering

After failure modes have been identified and mitigated through system design, it’s time to understand how resilient the system’s implementation is to those failure modes. Chaos engineering can be used to explore a system and validate that a system’s implementation meets business resiliency objectives.

Chaos engineering helps to improve a team’s mental model about the system under experimentation and provides insights into how a complex system behaves under adverse conditions. It also enables an engineer to find the unknown unknowns and the known unknowns through experiments that are built on top of the hypothesis. These experiments should simulate real world events, such as network degradation and increased client requests, and the outcome of the experiment should not be known. In other words, an experiment is not an experiment if it’s known that the conditions will cause the system to fail.

Prerequisites to Chaos Experiments at Vanguard

At Vanguard, there are some necessary prerequisites to running a chaos experiment. Firstly, the system under experiment must be set up with some basic observability tooling that will allow teams to monitor the state of the application during the failure injection. This could be as simple as an Amazon CloudWatch dashboard and some associated alarms, or as elaborate as a dedicated dashboard set up in a vendor tool.

Secondly, teams must be able to drive load to the application during the experiment; depending on the experiment type, the level and type of load may vary. The load generator can be as simple as a script on someone’s machine, or a fully automated load test depending on the requirements of the hypothesis.

Finally, teams need to have a good understanding of what the application’s “steady state” looks like. I Ideally, this takes the form of some metrics such as expected error rate, expected latency, and/or a service level objective (SLO) that can be monitored throughout the duration of the experiment. For example, a service level objective for a RESTful API might be that 90% of requests should receive a response within 100 milliseconds.

With the prerequisites met and a completed FMEA, teams can then experiment with their hypothesis using various experiment templates defined by Vanguard’s Climate of Chaos tooling.

Vanguard’s Climate of Chaos

At Vanguard, ensuring its software systems are resilient to adverse events is a critical part of its ongoing mission to provide world-class service to their clients. Vanguard believes that in order to develop high quality software, one must plan for the inevitable “stormy weather” events that occur in a distributed system.

Over the past 2 years, as a response to this need, Vanguard has developed in-house tooling called “The Climate of Chaos” to give teams easy access to common experiment templates, along with a friendly UI interface. The Climate of Chaos helps developers experiment on their systems and validate the hypotheses generated from FMEAs. It also provides the tooling for them to simulate the most common failure scenarios on Vanguard’s most commonly utilized AWS infrastructure, including Amazon Elastic Container Service (Amazon ECS), AWS Fargate, Amazon DynamoDB, Amazon Relational Database Service (Amazon RDS), AWS Lambda, and others.

The Climate of Chaos was created prior to Amazon’s release of the AWS Fault Injection Simulator (FIS), and today there is a lot of overlap with the experiment capabilities available in FIS. The Climate of Chaos has also been enhanced with company-specific features and integrations that make it easier for Vanguard developers to run chaos experiments in a controlled and predictable manner.

The Climate of Chaos includes important safety features such as an “emergency stop” function. This feature enables teams to terminate the experiment immediately if unintended side effects are encountered, rolling back the events simulated to resume steady state operation. The Climate of Chaos has been coupled with other systems like an in-house load testing tooling and added features like the ability to monitor CloudWatch alarms. Vanguard also offers teams the ability to schedule experiments to run at their convenience. Soon, Vanguard hopes to make running chaos experiments even smarter, introducing tools that will help teams run bulk experiments that systematically inject failures on a group of related applications to help pinpoint more complex failure modes.

Next Steps

Failure modes and effects analysis is a hazard analysis method which can help you identify single and combined points of failure in your system so you can prioritize the failure modes. To learn more about the FMEA process, you can read the NASA Software Engineering Handbook which outlines how they perform FMEA on their software-based systems. The AWS Whitepaper Building Mission-Critical Financial Services Applications on AWS provides example forms and suggestions for severity, probability, and detectability rankings. Appendix F in the whitepaper suggests a 1 to 10 ranking for each Risk Priority Number input, and the example spreadsheets recommend performing FMEAs for the application, platform, infrastructure, and operation layers of the system. Using these examples, you can perform an analysis of your own systems and generate hypotheses.

To experiment on your systems and validate your own hypotheses, you can use the AWS Fault Injection Simulator (FIS) mentioned earlier in this article. FIS provides you with a framework for performing controlled chaos experiments on your AWS workloads. It helps you to safely manage your experiments by providing tooling to monitor, rollback, and orchestrate chaos experiments. FIS provides the fault injection mechanisms that you will need to experiment upon your system’s implementation and resilience to identified failure modes. You can start by running experiments in pre-production environments, and then step up to running them as part of your CI/CD workflow and ultimately in your production environment. To learn more about FIS, you can read the FIS User Guide and FIS tutorials.

By using FMEA to anticipate the failures and experimenting on your systems with chaos engineering, you will gain confidence in the reliability of your system.

The content and opinions in this post are those of The Vanguard Group and AWS is not responsible for the content or accuracy of this post.

About the authors:
Tory Benya

Tory works as a Chaos Engineering Tech Lead at Vanguard.  She is passionate about automation, data, and making software work for people.  She likes to automate, integrate, and improve processes and technology.  Tory makes data-driven decisions to make a difference as part of her team at Vanguard.

Christina Yakomin

Christina works as a Senior Site Reliability Engineering Specialist in Vanguard’s Chief Technology Office. Throughout her career, she has developed an expansive skill set in front- and back-end web development, as well as cloud infrastructure and automation, with a specialization in Site Reliability Engineering. She has earned several Amazon Web Services certifications, including the Solutions Architect – Professional. Christina has also worked closely with the Women’s Initiative for Leadership Success at Vanguard, both internally at the company and externally in the local community, to further the career advancement of women and girls – in particular within the tech industry.

Jason Barto

Jason works as a Principal Solutions Architect at AWS where he works with customers to design resilient system architectures and develop chaos engineering practices. Prior to joining AWS Jason was designing and building distributed systems for complex event processing and real-time telemetry analytics.

John Formento

John is a Solutions Architect at AWS. He helps large enterprises achieve their goals by architecting secure and scalable solutions on the AWS Cloud. John holds 7 AWS certifications including AWS Certified Solutions Architect – Professional and DevOps Engineer – Professional.

Chaos experiments on Amazon RDS using AWS Fault Injection Simulator

Post Syndicated from Anup Sivadas original https://aws.amazon.com/blogs/devops/chaos-experiments-on-amazon-rds-using-aws-fault-injection-simulator/

Performing controlled chaos experiments on your Amazon Relational Database Service (RDS) database instances and validating the application behavior is essential to making sure that your application stack is resilient. How does the application behave when there is a database failover? Will the connection pooling solution or tools being used gracefully connect after a database failover is successful? Will there be a cascading failure if the database node gets rebooted for a few seconds? These are some of the fundamental questions that you should consider when evaluating the resiliency of your database stack. Chaos engineering is a way to effectively answer these questions.

Traditionally, database failure conditions, such as a failover or a node reboot, are often triggered using a script or 3rd party tools. However, at scale, these external dependencies often become a bottleneck and are hard to maintain and manage. Scripts and 3rd party tools can fail when called, whereas a web service is highly available. The scripts and 3rd party tools also tend to require elevated permissions to work, which is a management overhead and insecure from a least privilege access model perspective. This is where AWS Fault Injection Simulator (FIS) comes to the rescue.

AWS Fault Injection Simulator (AWS FIS) is a fully managed service for running fault injection experiments on AWS that makes it easier to improve an application’s performance, observability, and resiliency. Fault injection experiments are used in chaos engineering, which is the practice of stressing an application in testing or production environments by creating disruptive events, such as a sudden increase in CPU or memory consumption, database failover and observing how the system responds, and implementing improvements.

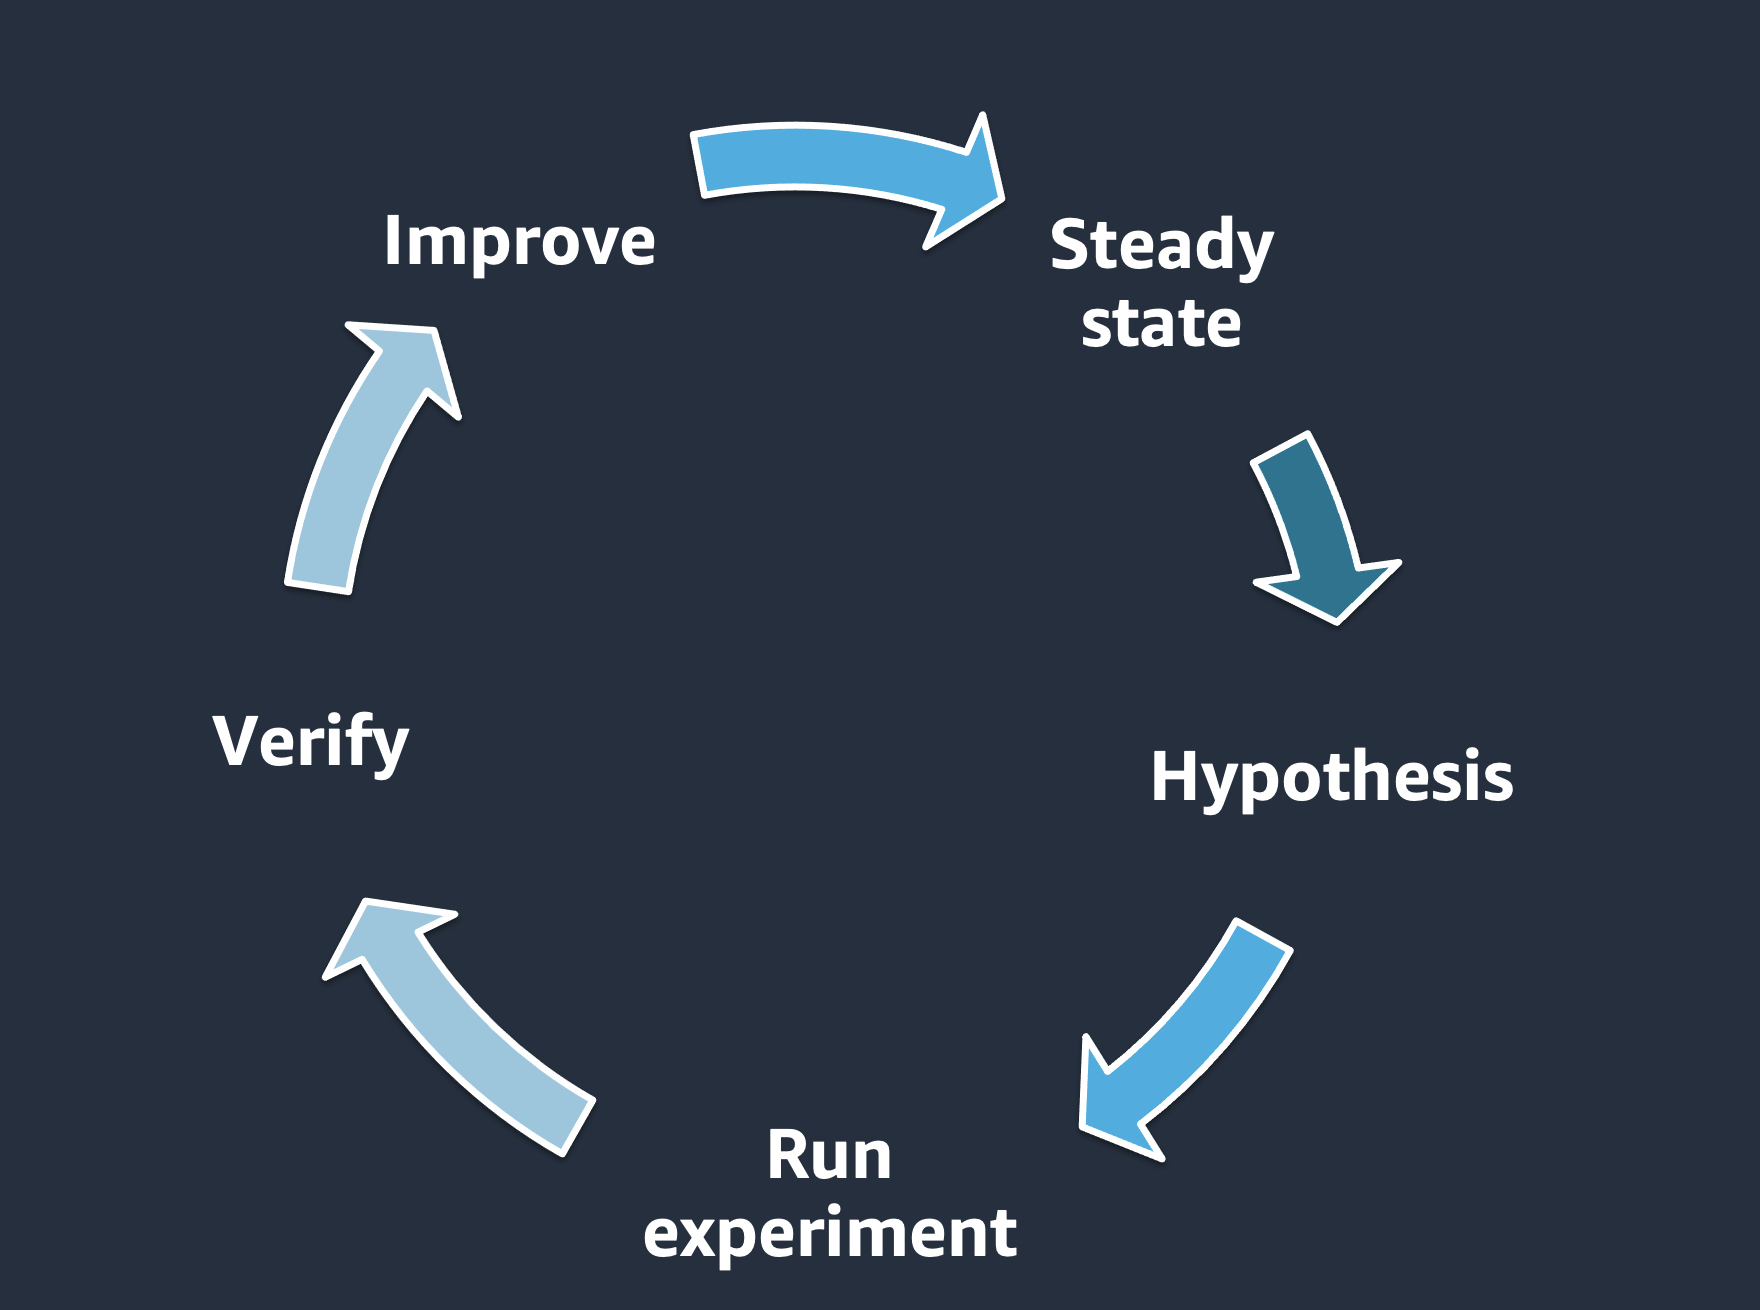
We can define the key phases of chaos engineering as identifying the steady state of the workload, defining a hypothesis, running the experiment, verifying the experiment results and making necessary improvements based on the experiment results. These phases will confirm that you are injecting failures in a controlled environment through well-planned experiments in order to build confidence in the workloads and tools we are using to withstand turbulent conditions.

This diagram explains the phases of chaos engineering. We start with identifying the steady state, defining a hypothesis, run the experiment, verify the experiment results and improve. This is a cycle.

Example—

  • Baseline: we have a managed database with a replica and automatic failover enabled.
  • Hypothesis: failure of a single database instance / replica may slow down a few requests but will not adversely affect our application.
  • Run experiment: trigger a DB failover.
  • Verify: confirm/dis-confirm the hypothesis by looking at KPIs for the application (e.g., via CloudWatch metric/alarm).

Methodology and Walkthrough

Let’s look at how you can configure AWS FIS to perform failure conditions for your RDS database instances. For this walkthrough, we’ll look at injecting a cluster failover for Amazon Aurora PostgreSQL. You can leverage an existing Aurora PostgreSQL cluster or you can launch a new cluster by following the steps in the Create an Aurora PostgreSQL DB Cluster documentation.

Step 1: Select the Aurora Cluster.

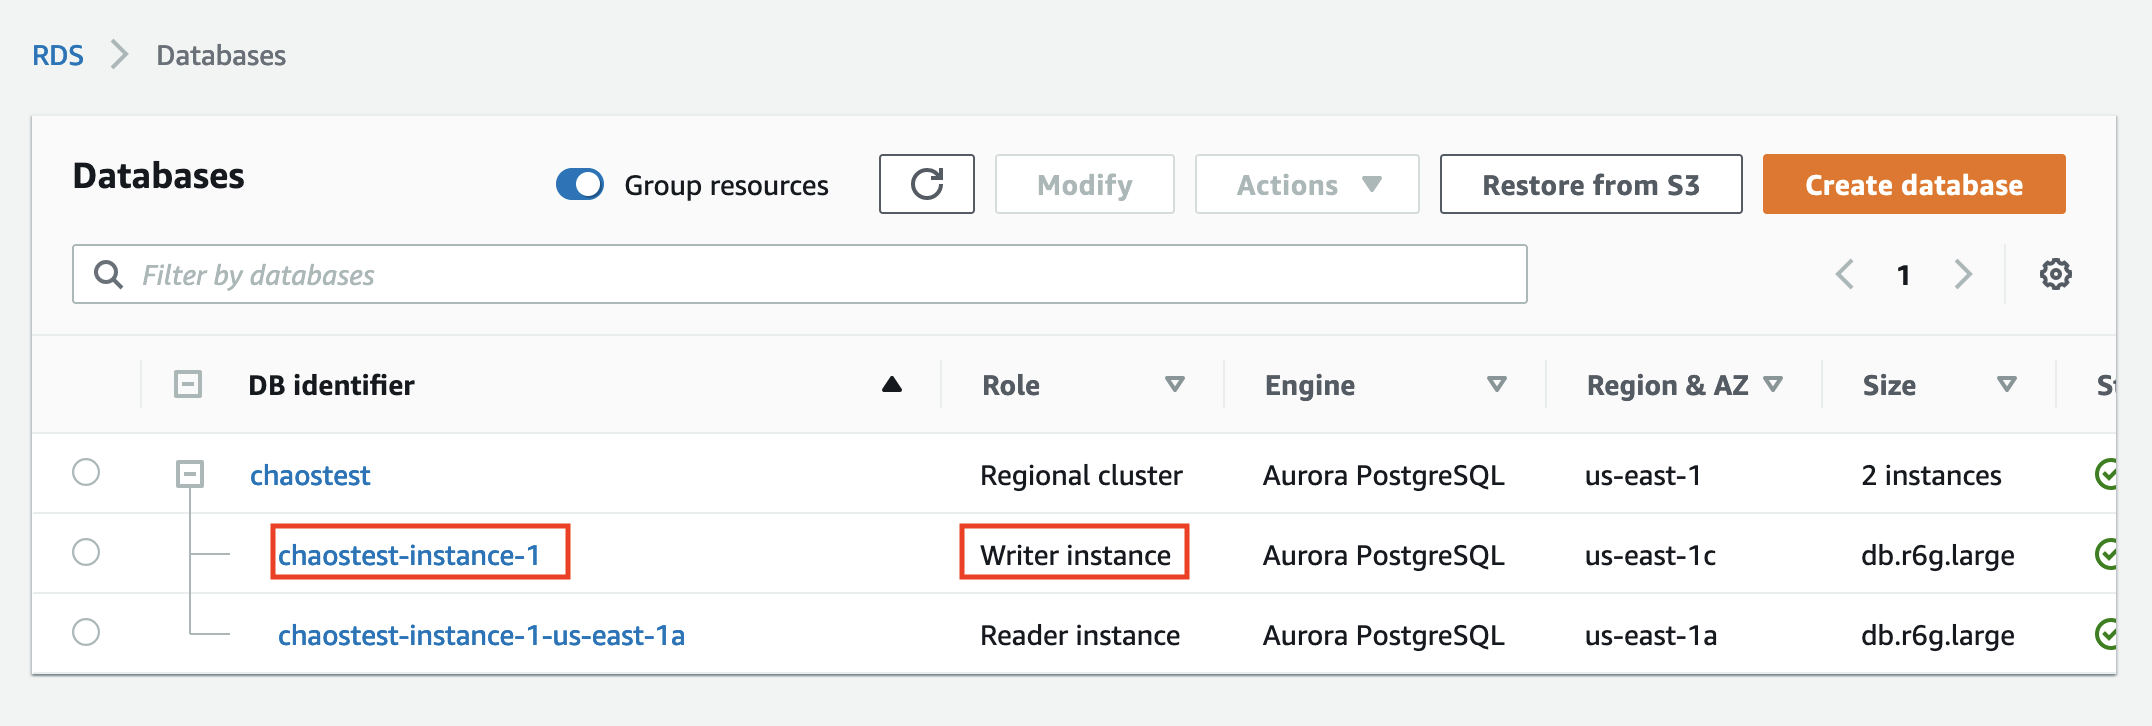
The Aurora PostgreSQL instance that we’ll use for this walkthrough is provisioned in us-east-1 (N. Virginia), and it’s a cluster with two instances. There is one writer instance and another reader instance (Aurora replica). The cluster is named chaostest, the writer instance is named chaostest-instance-1, and the reader is named chaostest-intance-1-us-east-1a.

Under RDS Databases Section, the cluster named chaostest is selected. Under the cluster there are two instances which is available. Chaostest-instance-1 is the writer instance and chaostest-instance-1-us-east-1a is the reader instance.

The goal is to simulate a failover for this Aurora PostgreSQL cluster so that the existing chaostest-intance-1-us-east-1a reader instance will switch roles and then be promoted as the writer, and the existing chaostest-instance-1 will become the reader.

Step 2: Navigate to the AWS FIS console.

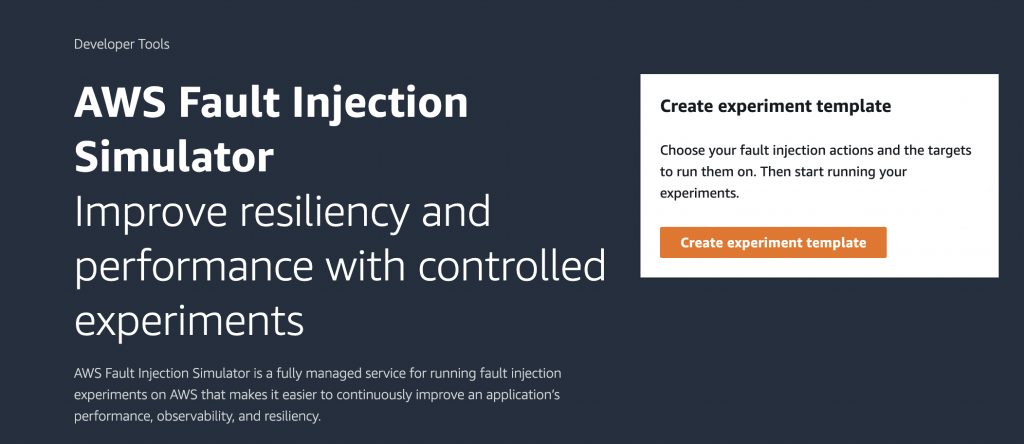
We will now navigate to the AWS FIS console to create an experiment template. Select Create experiment template.

Under FIS console, Create experiment template needs to be selected.

Step 3: Complete the AWS FIS template pre-requisites.

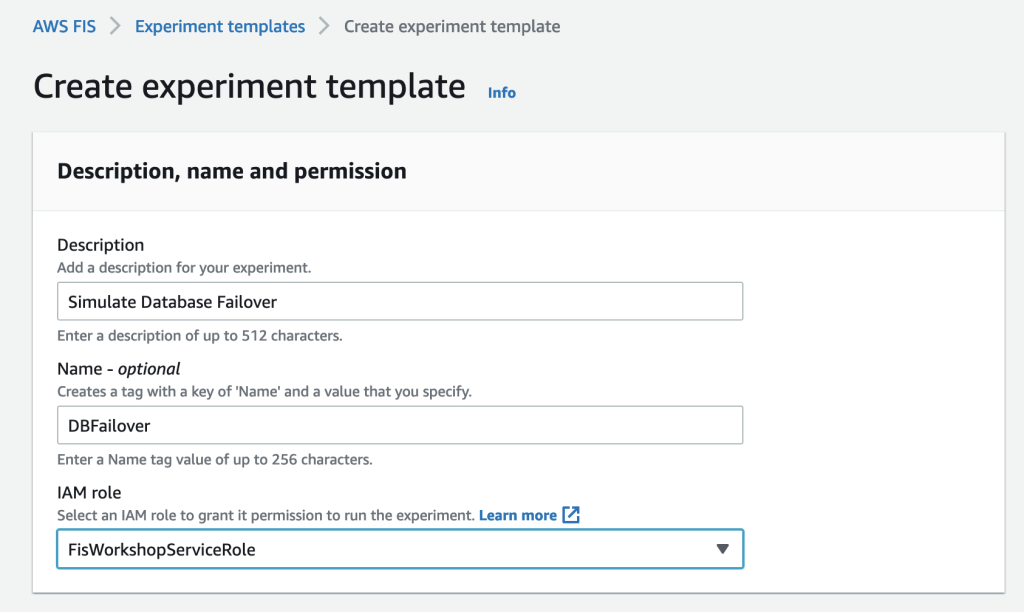
Enter a Description, Name, and select the AWS IAM Role for the experiment template.

Under create experiment template section, Simulate Database Failover is entered for the Description field. DBFailover is entered for the Name field(Optional). FISWorkshopServiceRole is selected for the IAM role drop down field.

The IAM role selected above was pre-created. To use AWS FIS, you must create an IAM role that grants AWS FIS the permissions required so that the service can run experiments on your behalf. The role follows the least privileged model and includes permissions to act on your database clusters like trigger a failover. AWS FIS only uses the permissions that have been delegated explicitly for the role. To learn more about how to create an IAM role with the required permissions for AWS FIS, refer to the FIS documentation.

Step 4: Navigate to the Actions, Target, Stop Condition section of the template.

The next key section of AWS FIS is Action, Target, and Stop Condition.

Action, Target and Stop Conditions section is highlighted in the image.

Action—An action is an activity that AWS FIS performs on an AWS resource during an experiment. AWS FIS provides a set of pre-configured actions based on the AWS resource type. Each Action runs for a specified duration during an experiment, or until you stop the experiment. An action can run sequentially or in parallel.

For our experiment, the Action will be aws:rds:failover-db-cluster.

Target—A target is one or more AWS resources on which AWS FIS performs an action during an experiment. You can choose specific resources or select a group of resources based on specific criteria, such as tags or state.

For our experiment, the target will be the chaostest Aurora PostgreSQL cluster.

Stop Condition—AWS FIS provides the controls and guardrails that you need to run experiments safely on your AWS workloads. A stop condition is a mechanism to stop an experiment if it reaches a threshold that you define as an Amazon CloudWatch alarm. If a stop condition is triggered while the experiment is running, then AWS FIS stops the experiment.

For our experiment, we won’t be defining a stop condition. This is because this simple experiment contains only one action. Stop conditions are especially useful for experiments with a series of actions, to prevent them from continuing if something goes wrong.

Step 5: Configure Action.

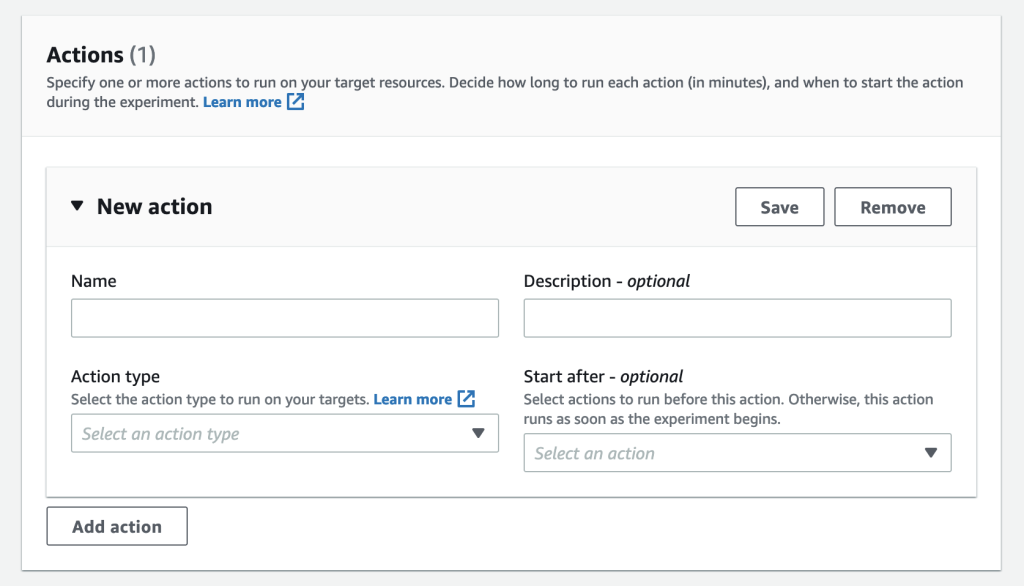
Now, let’s configure the Action and Target for our experiment template. Under the Actions section, we will select Add action to get the New action window.

The action section displays Name,Description, Action Type and Start After fields. There is a Add action button that needs to be selected.

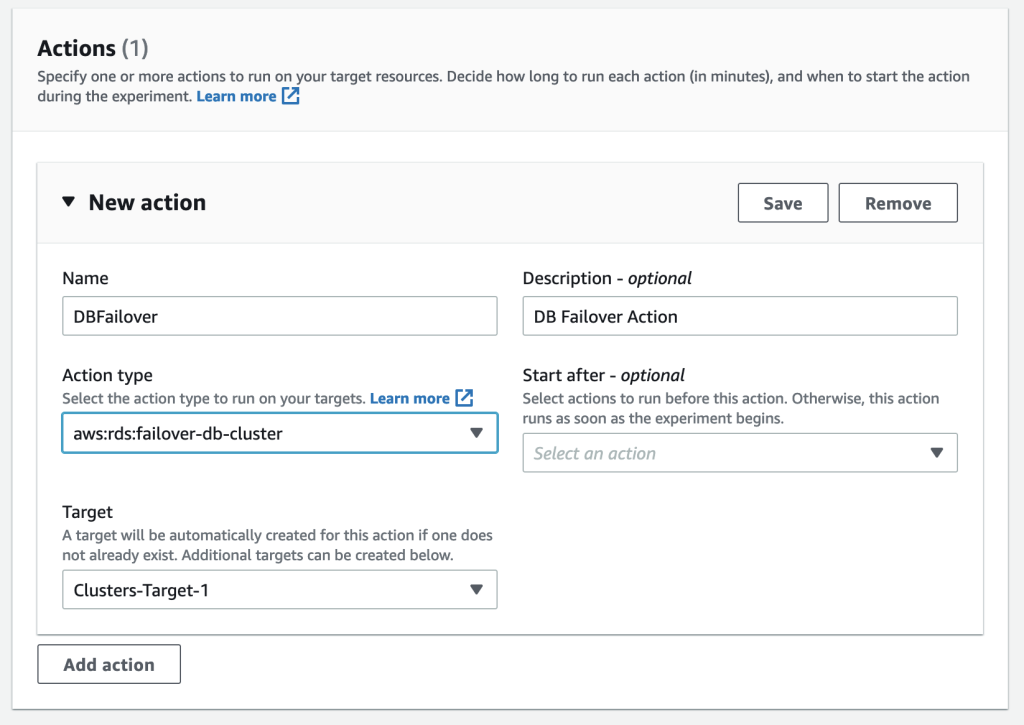
Enter a Name, a Description, and select Action type aws:rds:failover-db-cluster. Start after is an optional setting. This setting allows you to specify an action that should precede the one we are currently configuring.

Under Actions section, DBFailover is entered for the Name field. DB Failover Action is entered for the Description field. aws:rds:failover-db-cluster is entered for the Action Type field. Start after field is left blank and Clusters-Target-1 is selected for the Target field. The save button will save the info entered for the respective fields.

Step 6: Configure Target.

Note that a Target has been automatically created with the name Clusters-Target-1. Select Save to save the action.

Next, you will edit the Clusters-Target-1 target to select the target, i.e., the Aurora PostgreSQL cluster.

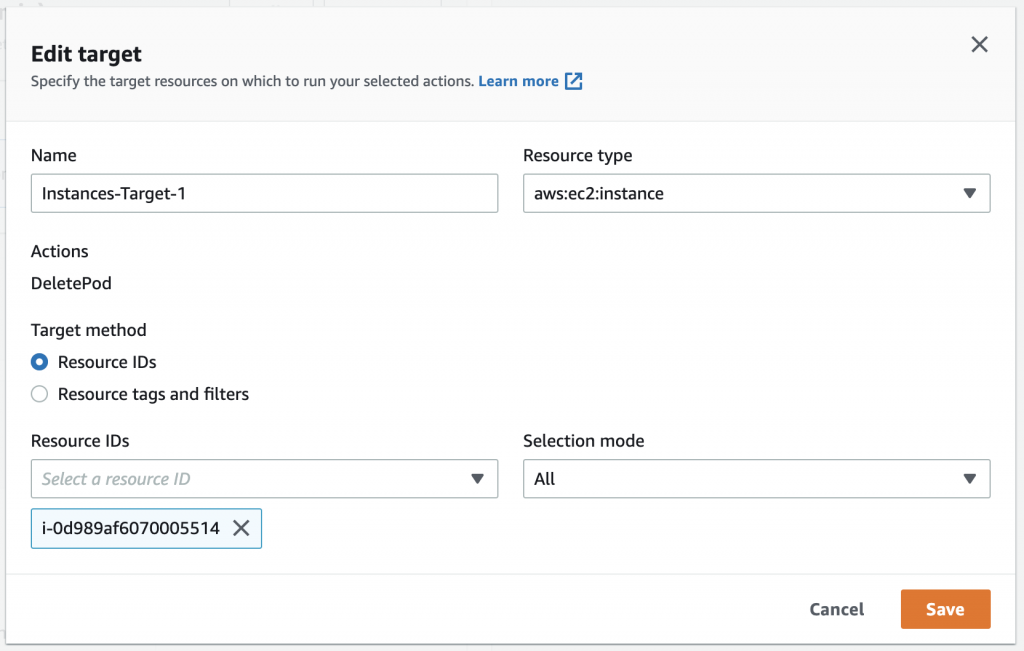
Under Targets section, the edit button for Clusters-Target-1 is highlighted.

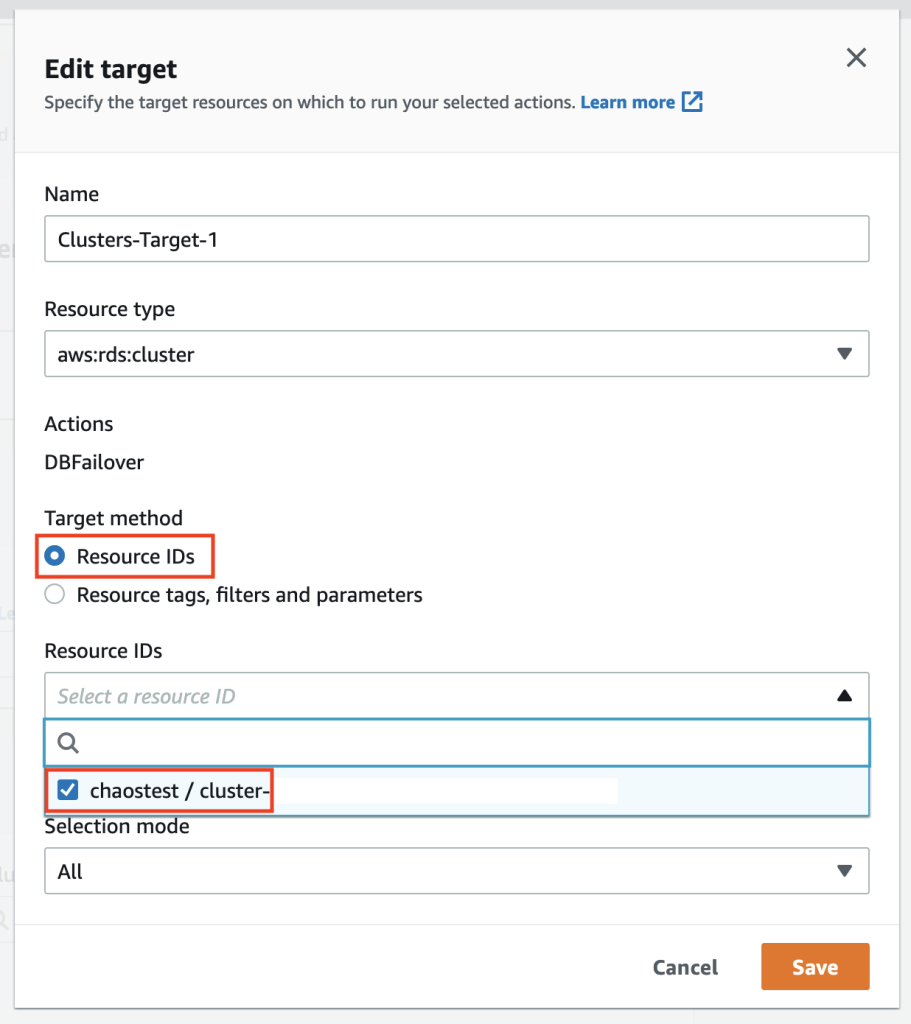
Select Target method as Resource IDs, and select the chaostest cluster.  If you are interested to select a group of resources, then select Resource tags, filters and parameters option.

Under Edit Target section, Clusters-Target-1 is selected for the Name field. aws:rds:cluster is selected for the Resource type field. Action is set as DBFailover. Resource IDs is selected for the Target Method field. Chaostest cluster is selected for the Resource IDs drop down box. Save button is also available in this section to save the configuration.

Step 7: Create the experiment template to complete this stage.

We will wrap up the process by selecting the create experiment template.

Create experiment template option is highlighted. The user will click this button to proceed creating a template.

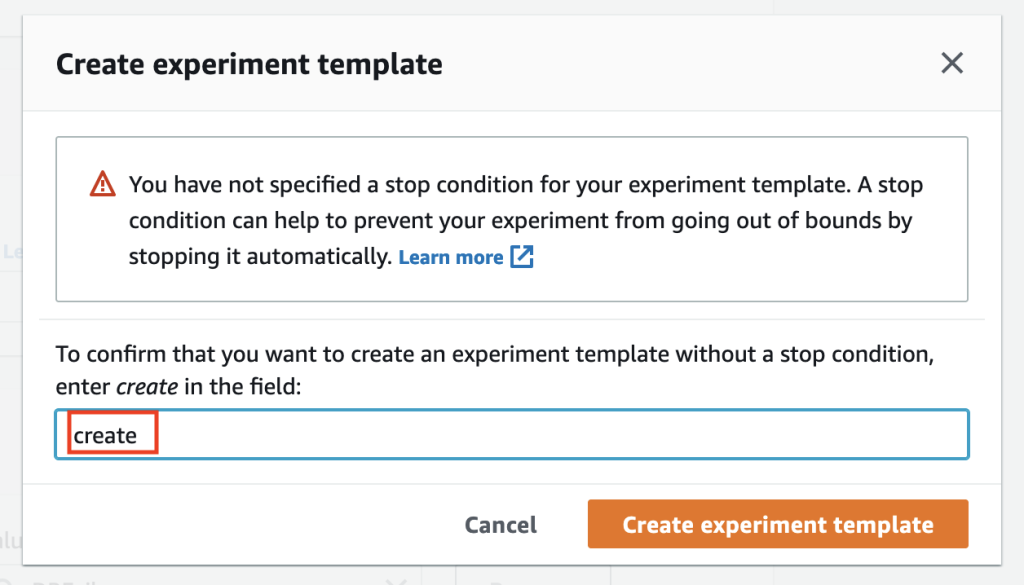
We will get a warning stating that a stop condition isn’t defined. We’ll enter create in the provided field to create the template.

After selecting the create experiment template option in the previous screen, the user is prompted to enter "create" in the field to proceed.

We will get a success message if the entries are correct and the template will be successfully created.

"You successfully created experiment template" success message is displayed in the screen and its highlighted in green color.

Step 8: Verify the Aurora Cluster.

Before we run the experiment, let’s double-check the chaostest Aurora Cluster to confirm which instance is the writer and which is the reader.

Under the RDS section, chaos cluster is listed. The user is confirming that chaostest-instance-1 is the writer and chaostest-instance-1-us-east-1a is the reader.

We confirmed that chaostest-instance-1 is the writer and chaostest-instance-1-us-east-1a is the reader.

Step 9: Run the AWS FIS experiment.

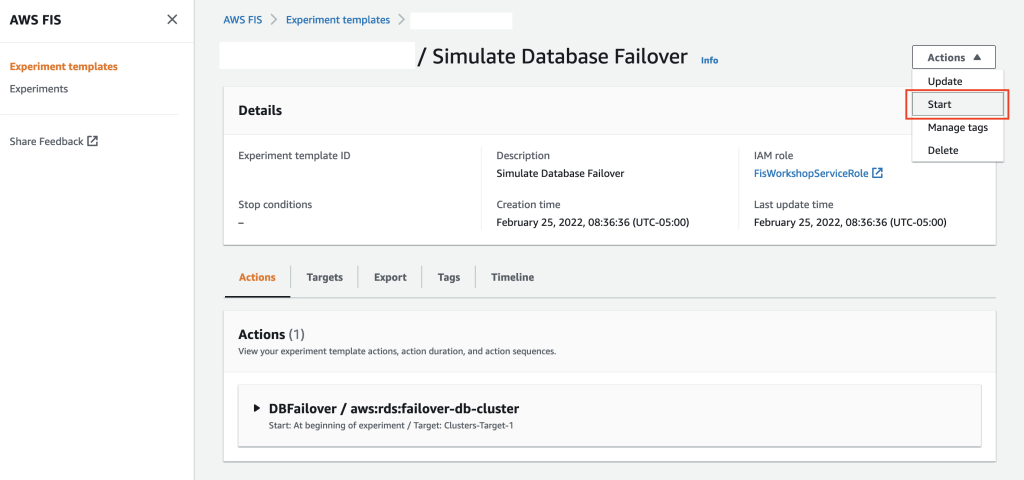
Now we’ll run the FIS experiment. Select Actions, and then select Start for the experiment template.

Under the experiment template section, the Simulate Database Failover template is selection. Under the actions section, option Start is selected to start the experiment. The other options under Actions section includes Update, Manage tags and Delete.

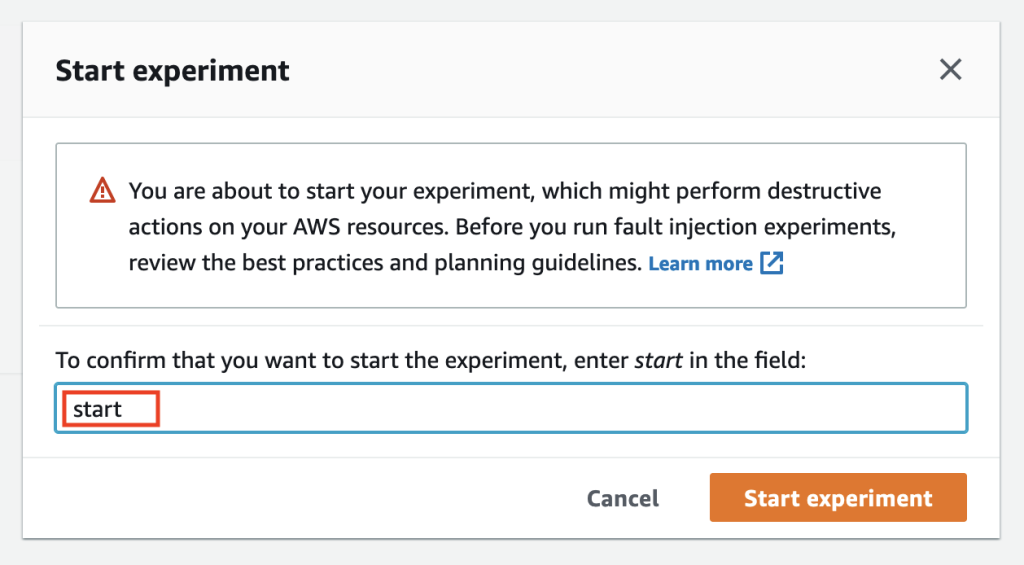
Select Start experiment and you’ll get another warning to confirm if you really want to start this experiment. Confirm by entering start say Start experiment.

Under the Start Experiement section, user is promoted to enter "start" in the field to start the experiement.

Step 10: Observe the various stages of the experiment.

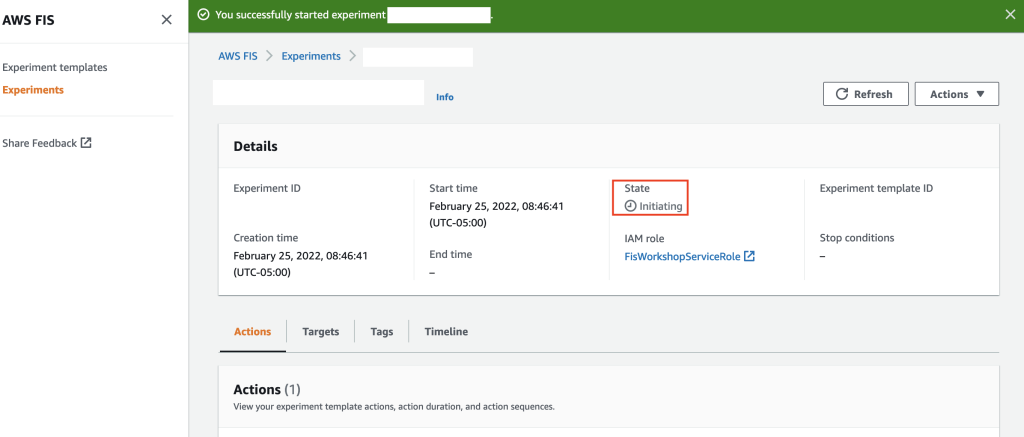
The experiment will be in initiating, running and will eventually be in completed states.

The experiment is in initiating state.

The experiment is in Complete state.

Step 11: Verify the Aurora Cluster to confirm failover.

Now let’s look at the chaostest Aurora PostgreSQL cluster to check the state. Note that a failover was indeed triggered by FIS and chaostest-instance-1-us-east-1a is the newly promoted writer and chaostest-instance-1 is the reader now.

Under RDS Section, Chaostest cluster is shown. This time, the writer is chaostest-instance-1-us-east-1a.

Step 12: Verify the Aurora Cluster logs.

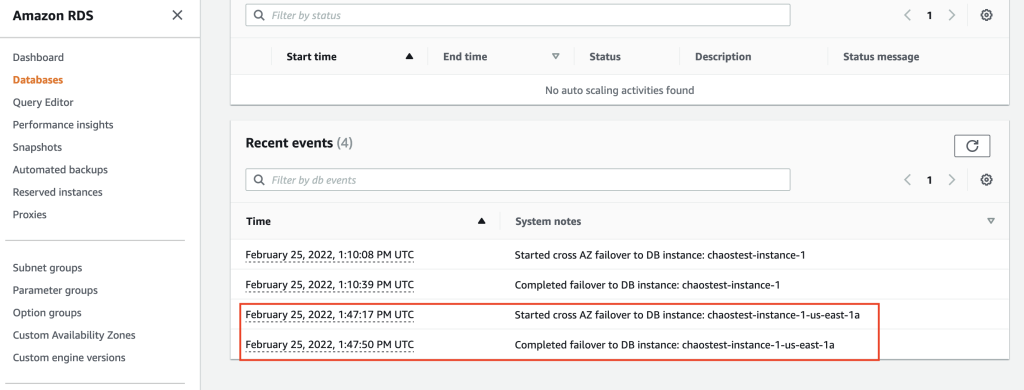
We can also confirm the failover action by looking at the Logs and events section of the Aurora Cluster.

Under the Recent Events section of the chaos-test cluster, the failover messages is displayed. One of the messages lists "Started cross AZ failover to DB instance:chaostest-instance-1-us-east-1a. This confirms that the experiment was successful.

Clean up

If you created a new Aurora PostgreSQL cluster for this walkthrough, then you can terminate the cluster to optimize the costs by following the steps in the Deleting an Aurora DB cluster documentation.

You can also delete the AWS FIS experiment template by following the steps in the Delete an experiment template documentation.

You can refer to the AWS FIS documentation to learn more about the service. If you want to know more about chaos engineering, check out the AWS re:Invent session Testing resiliency using chaos engineering and The Chaos Engineering Collection. Finally, check out the following GitHub repo for additional example experiments, and how you can work with AWS FIS using the AWS Cloud Development Kit (AWS CDK).

Conclusion

In this walkthrough, you learned how you can leverage AWS FIS to inject failures into your RDS Instances. To get started with AWS Fault Injection Service for Amazon RDS, refer to the service documentation.

Author:

Anup Sivadas

Anup Sivadas is a Principal Solutions Architect at Amazon Web Services and is based out of Arlington, Virginia. With 18 + years in technology, Anup enjoys working with AWS customers and helps them craft highly scalable, performing, resilient, secure, sustainable and cost-effective cloud architectures. Outside work, Anup’s passion is to travel and explore the nature with his family.

Chaos engineering on Amazon EKS using AWS Fault Injection Simulator

Post Syndicated from Omar Kahil original https://aws.amazon.com/blogs/devops/chaos-engineering-on-amazon-eks-using-aws-fault-injection-simulator/

In this post, we discuss how you can use AWS Fault Injection Simulator (AWS FIS), a fully managed fault injection service used for practicing chaos engineering. AWS FIS supports a range of AWS services, including Amazon Elastic Kubernetes Service (Amazon EKS), a managed service that helps you run Kubernetes on AWS without needing to install and operate your own Kubernetes control plane or worker nodes. In this post, we aim to show how you can simplify the process of setting up and running controlled fault injection experiments on Amazon EKS using pre-built templates as well as custom faults to find hidden weaknesses in your Amazon EKS workloads.

What is chaos engineering?

Chaos engineering is the process of stressing an application in testing or production environments by creating disruptive events, such as server outages or API throttling, observing how the system responds, and implementing improvements. Chaos engineering helps you create the real-world conditions needed to uncover the hidden issues and performance bottlenecks that are difficult to find in distributed systems. It starts with analyzing the steady-state behavior, building an experiment hypothesis (for example, stopping x number of instances will lead to x% more retries), running the experiment by injecting fault actions, monitoring rollback conditions, and addressing the weaknesses.

AWS FIS lets you easily run fault injection experiments that are used in chaos engineering, making it easier to improve an application’s performance, observability, and resiliency.

Solution overview

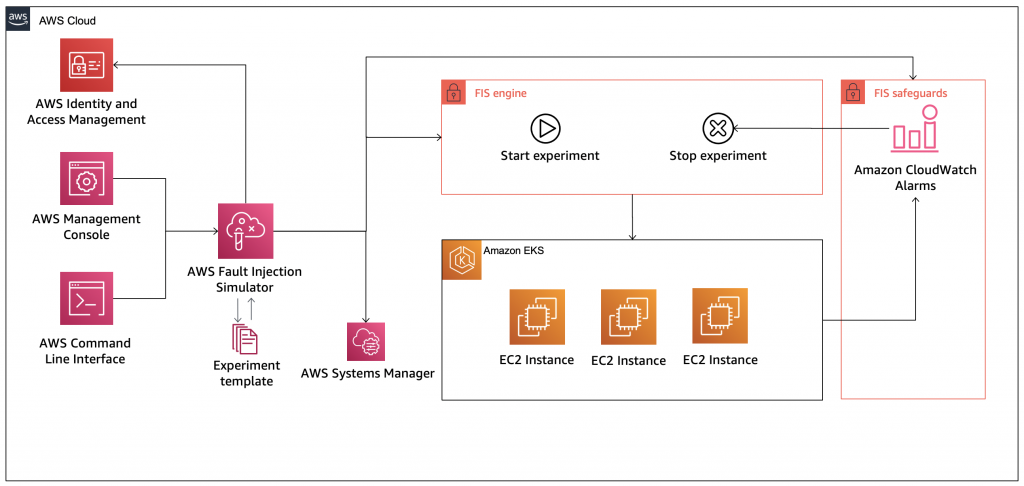
Figure 1: Solution Overview

Figure 1: Solution Overview

The following diagram illustrates our solution architecture.

In this post, we demonstrate two different fault experiments targeting an Amazon EKS cluster. This post doesn’t go into details about the creation process of an Amazon EKS cluster; for more information, see Getting started with Amazon EKS – eksctl and eksctl – The official CLI for Amazon EKS.

Prerequisites

Before getting started, make sure you have the following prerequisites:

We used the following configuration to create our cluster:

---
apiVersion: eksctl.io/v1alpha5
kind: ClusterConfig

metadata:
  name: aws-fis-eks
  region: eu-west-1
  version: "1.19"

iam:
  withOIDC: true

managedNodeGroups:
- name: nodegroup
  desiredCapacity: 3
  instanceType: t3.small
  ssh:
    enableSsm: true
  tags:
    Environment: Dev

Our cluster was created with the following features:

We have deployed a simple Nginx deployment with three replicas, each running on different instances for high availability.

In this post, we perform the following experiments:

  • Terminate node group instances In the first experiment, we will use the aws:eks:terminate-nodegroup-instance AWS FIS action that runs the Amazon EC2 API action TerminateInstances on the target node group. When the experiment starts, AWS FIS begins to terminate nodes, and we should be able to verify that our cluster replaces the terminated nodes with new ones as per our desired capacity configuration for the cluster.
  • Delete application pods In the second experiment, we show how you can use AWS FIS to run custom faults against the cluster. Although AWS FIS plans to expand on supported faults for Amazon EKS in the future, in this example we demonstrate how you can run a custom fault injection, running kubectl commands to delete a random pod for our Kubernetes deployment. Using a Kubernetes deployment is a good practice to define the desired state for the number of replicas you want to run for your application, and therefore ensures high availability in case one of the nodes or pods is stopped.

Experiment 1: Terminate node group instances

We start by creating an experiment to terminate Amazon EKS nodes.

  1. On the AWS FIS console, choose Create experiment template.
Figure 2: AWS FIS Console

Figure 2: AWS FIS Console

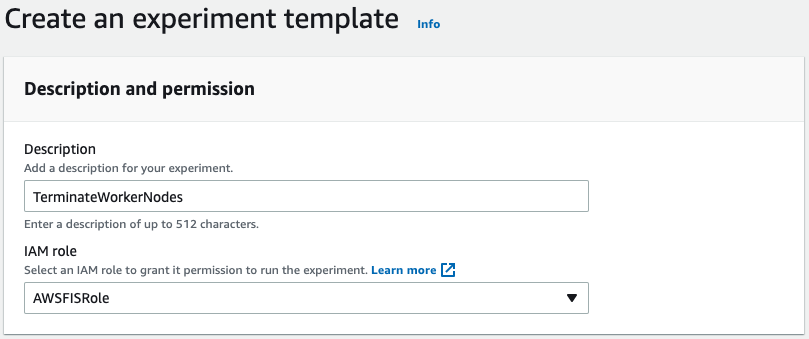
2. For Description, enter a description.

3. For IAM role, choose the IAM role you created.

Figure 3: Create experiment template

Figure 3: Create experiment template

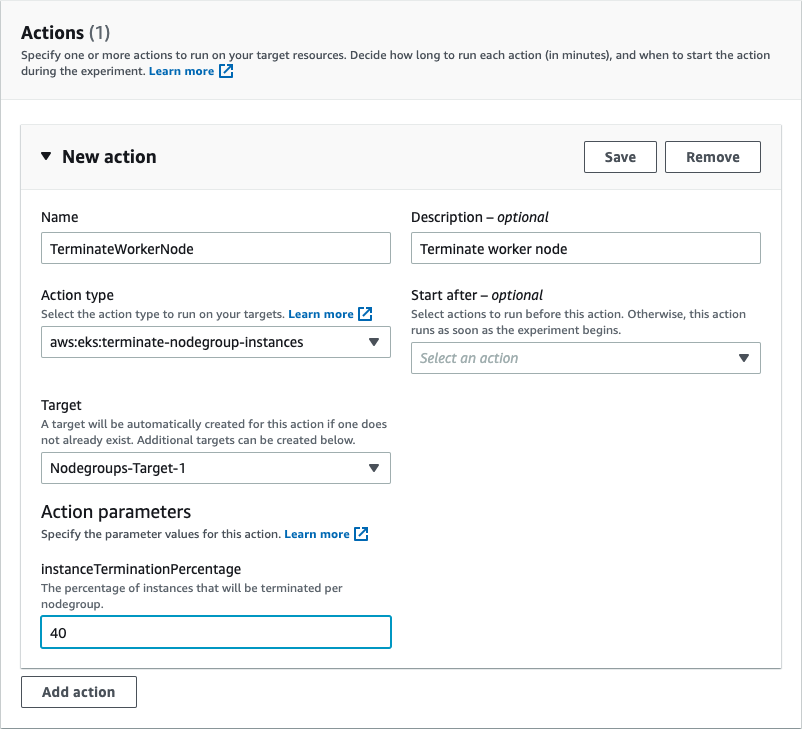
   4. Choose Add action.

For our action, we want aws:eks:terminate-nodegroup-instances to terminate worker nodes in our cluster.

  5. For Name, enter TerminateWorkerNode.

  6. For Description, enter Terminate worker node.

  7. For Action type, choose aws:eks:terminate-nodegroup-instances.

  8. For Target, choose Nodegroups-Target-1.

  9. For instanceTerminationPercentage, enter 40 (the percentage of instances that are terminated per node group).

  10. Choose Save.

Figure 4: Select action type

Figure 4: Select action type

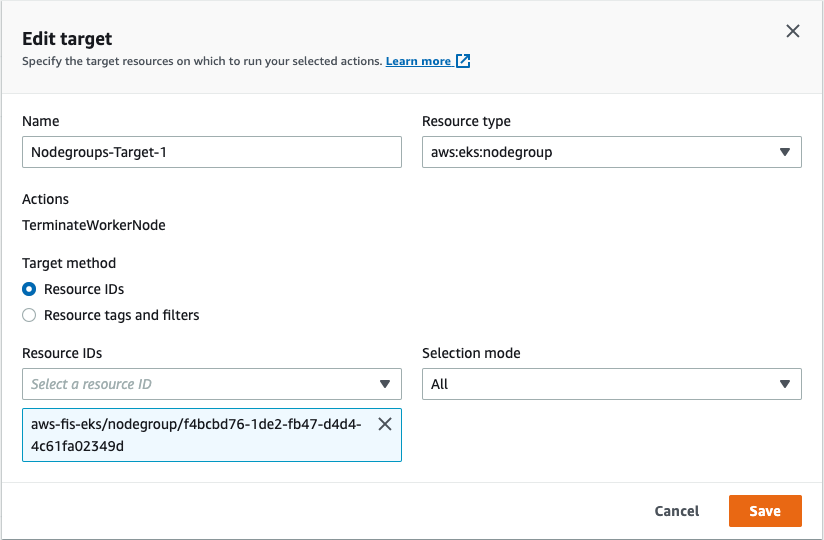
After you add the correct action, you can modify your target, which in this case is Amazon EKS node group instances.

11. Choose Edit target.

12. For Resource type, choose aws:eks:nodegroup.

13. For Target method, select Resource IDs.

14. For Resource IDs, enter your resource ID.

15. Choose Save.

With selection mode in AWS FIS, you can select your Amazon EKS cluster node group.

Figure 5: Specify target resource

Figure 5: Specify target resource

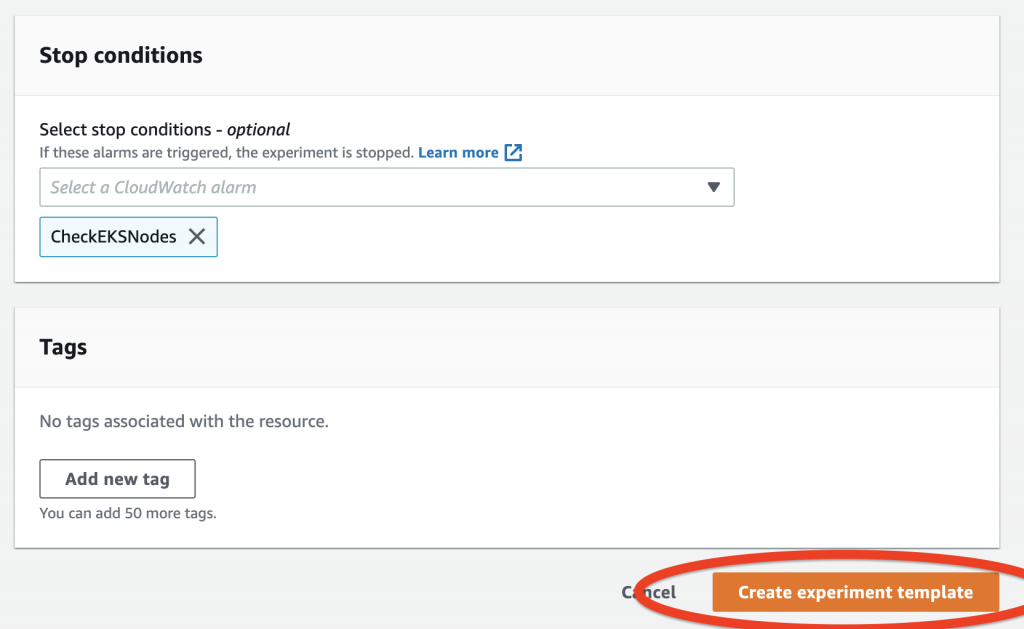
Finally, we add a stop condition. Even though this is optional, it’s highly recommended, because it makes sure we run experiments with the appropriate guardrails in place. The stop condition is a mechanism to stop an experiment if an Amazon CloudWatch alarm reaches a threshold that you define. If a stop condition is triggered during an experiment, AWS FIS stops the experiment, and the experiment enters the stopping state.

Because we have Container Insights configured for the cluster, we can monitor the number of nodes running in the cluster.

16. Through Container Insights, create a CloudWatch alarm to stop our experiment if the number of nodes is less than two.

17. Add the alarm as a stop condition.

18. Choose Create experiment template.

Figure 6: Create experiment template

Figure 6: Create experiment template

Figure 7: Check cluster nodes

Before we run our first experiment, let’s check our Amazon EKS cluster nodes. In our case, we have three nodes up and running.

19. On the AWS FIS console, navigate to the details page for the experiment we created.

20. On the Actions menu, choose Start.

Figure 8: Start experiment

Figure 8: Start experiment

Before we run our experiment, AWS FIS will ask you to confirm if you want to start the experiment. This is another example of safeguards to make sure you’re ready to run an experiment against your resources.

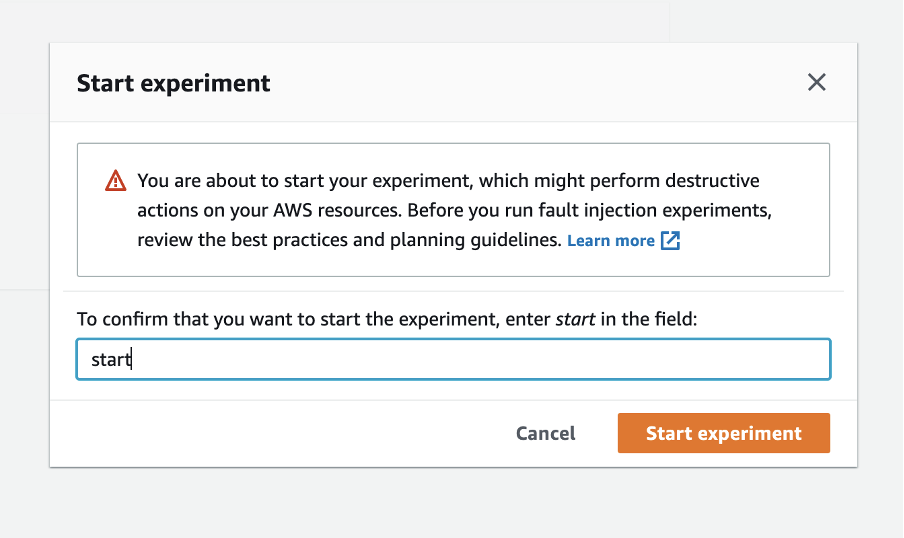
21. Enter start in the field.

22. Choose Start experiment.

Figure 9: Confirm to start experiment

Figure 9: Confirm to start experiment

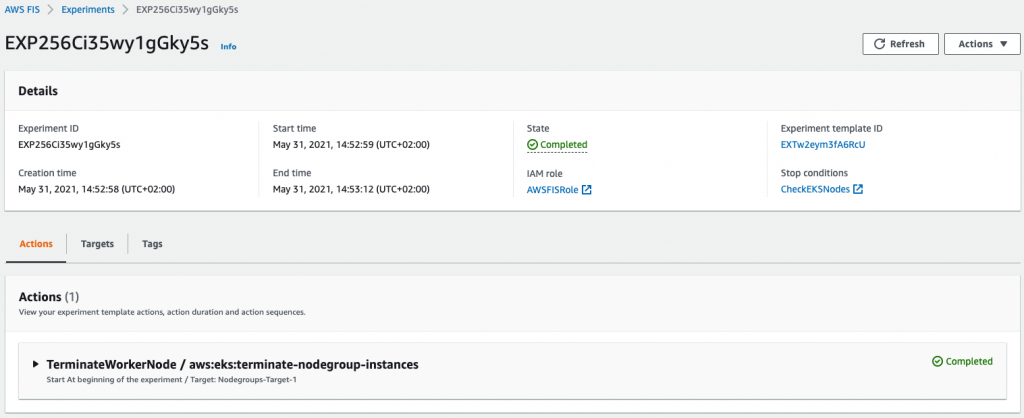
After you start the experiment, you can see the experiment ID with its current state. You can also see the action the experiment is running.

Figure 10: Check experiment state

Figure 10: Check experiment state

Next, we can check the status of our cluster worker nodes. The process of adding a new node to the cluster takes a few minutes, but after a while we can see that Amazon EKS has launched new instances to replace the terminated ones.

The number of terminated instances should reflect the percentage that we provided as part of our action configuration. Because our experiment is complete, we can verify our hypothesis—our cluster eventually reached a steady state with a number of nodes equal to the desired capacity within a few minutes.

Figure 11: Check new worker node

Figure 11: Check new worker node

Experiment 2: Delete application pods

Now, let’s create a custom fault injection, targeting a specific containerized application (pod) running on our Amazon EKS cluster.

As a prerequisite for this experiment, you need to update your Amazon EKS cluster configmap, adding the IAM role that is attached to your worker nodes. The reason for adding this role to the configmap is because the experiment uses kubectl, the Kubernetes command-line tool that allows us to run commands against our Kubernetes cluster. For instructions, see Managing users or IAM roles for your cluster.

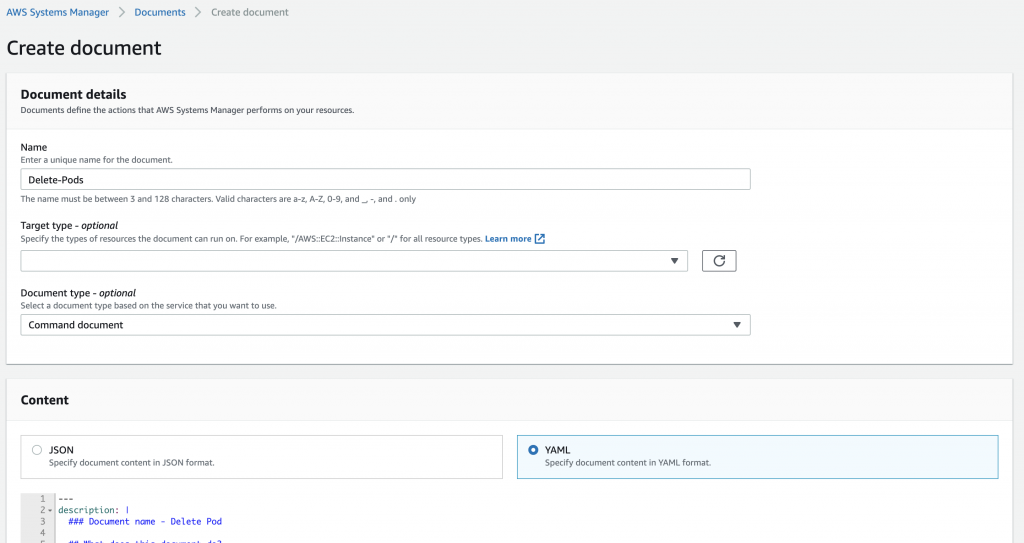
  1. On the Systems Manager console, choose Documents.
  2. On the Create document menu, choose Command or Session.
Figure 12: Create AWS Systems Manager Document

Figure 12: Create AWS Systems Manager Document

3. For Name, enter a name (for example, Delete-Pods).

4. In the Content section, enter the following code:

---
description: |
  ### Document name - Delete Pod

  ## What does this document do?
  Delete Pod in a specific namespace via kubectl

  ## Input Parameters
  * Cluster: (Required)
  * Namespace: (Required)
  * InstallDependencies: If set to True, Systems Manager installs the required dependencies on the target instances. (default True)

  ## Output Parameters
  None.

schemaVersion: '2.2'
parameters:
  Cluster:
    type: String
    description: '(Required) Specify the cluster name'
  Namespace:
    type: String
    description: '(Required) Specify the target Namespace'
  InstallDependencies:
    type: String
    description: 'If set to True, Systems Manager installs the required dependencies on the target instances (default: True)'
    default: 'True'
    allowedValues:
      - 'True'
      - 'False'
mainSteps:
  - action: aws:runShellScript
    name: InstallDependencies
    precondition:
      StringEquals:
        - platformType
        - Linux
    description: |
      ## Parameter: InstallDependencies
      If set to True, this step installs the required dependecy via operating system's repository.
    inputs:
      runCommand:
        - |
          #!/bin/bash
          if [[ "{{ InstallDependencies }}" == True ]] ; then
            if [[ "$( which kubectl 2>/dev/null )" ]] ; then echo Dependency is already installed. ; exit ; fi
            echo "Installing required dependencies"
            sudo mkdir -p $HOME/bin && cd $HOME/bin
            sudo curl -o kubectl https://amazon-eks.s3.us-west-2.amazonaws.com/1.20.4/2021-04-12/bin/linux/amd64/kubectl
            sudo chmod +x ./kubectl
            export PATH=$PATH:$HOME/bin
          fi
  - action: aws:runShellScript
    name: ExecuteKubectlDeletePod
    precondition:
      StringEquals:
        - platformType
        - Linux
    description: |
      ## Parameters: Namespace, Cluster, Namespace
      This step will terminate the random first pod based on namespace provided
    inputs:
      maxAttempts: 1
      runCommand:
        - |
          if [ -z "{{ Cluster }}" ] ; then echo Cluster not specified && exit; fi
          if [ -z "{{ Namespace }}" ] ; then echo Namespace not specified && exit; fi
          pgrep kubectl && echo Another kubectl command is already running, exiting... && exit
          EC2_REGION=$(curl -s http://169.254.169.254/latest/dynamic/instance-identity/document|grep region | awk -F\" '{print $4}')
          aws eks --region $EC2_REGION update-kubeconfig --name {{ Cluster }} --kubeconfig /home/ssm-user/.kube/config
          echo Running kubectl command...
          TARGET_POD=$(kubectl --kubeconfig /home/ssm-user/.kube/config get pods -n {{ Namespace }} -o jsonpath={.items[0].metadata.name})
          echo "TARGET_POD: $TARGET_POD"
          kubectl --kubeconfig /home/ssm-user/.kube/config delete pod $TARGET_POD -n {{ Namespace }} --grace-period=0 --force
          echo Finished kubectl delete pod command.

Figure 13: Add Document details

Figure 13: Add Document details

For this post, we create a Systems Manager command document that does the following:

  • Installs kubectl on the target Amazon EKS cluster instances
  • Uses two required parameters—the Amazon EKS cluster name and namespace where your application pods are running
  • Runs kubectl delete, deleting one of our application pods from a specific namespace

5. Choose Create document.

6. Create a new experiment template on the AWS FIS console.

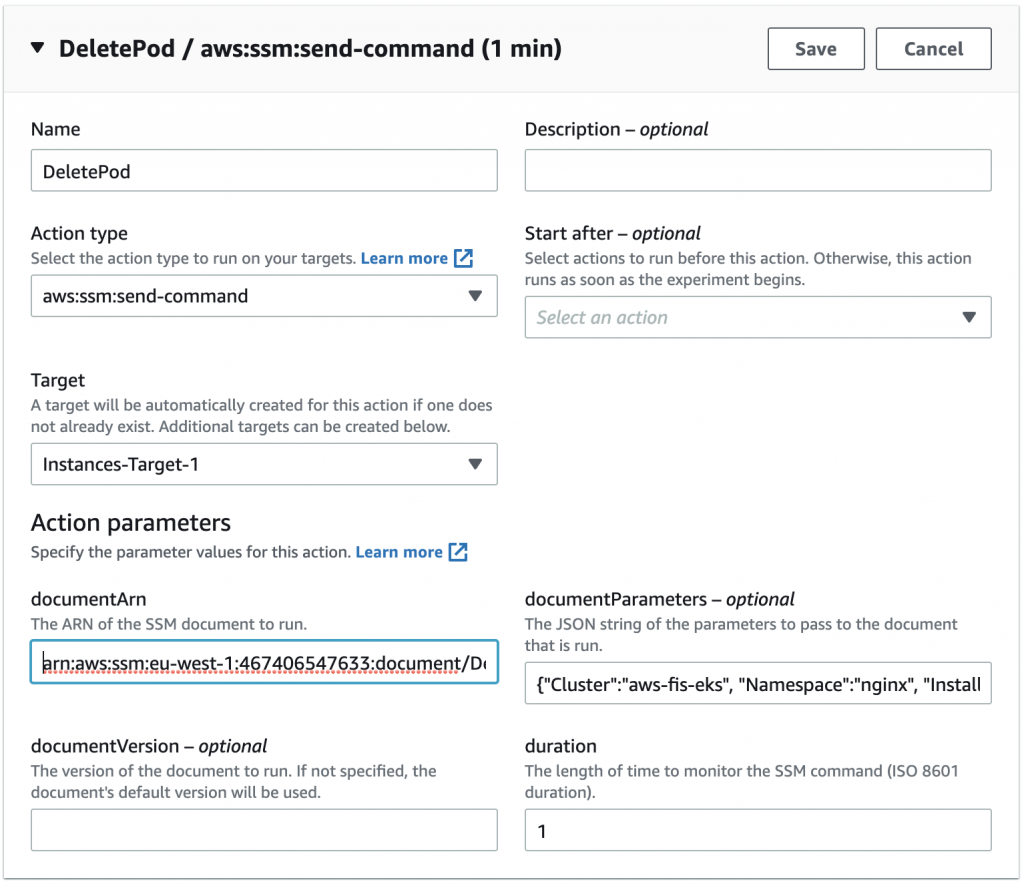
7. For Name, enter DeletePod.

8. For Action type, choose aws:ssm:send-command.

This runs the Systems Manager API action SendCommand to our target EC2 instances.

After choosing this action, we need to provide the ARN for the document we created earlier, and provide the appropriate values for the cluster and namespace. In our example, we named the document Delete-Pods, our cluster name is aws-fis-eks, and our namespace is nginx.

9. For documentARN, enter arn:aws:ssm:<region>:<accountId>:document/Delete-Pods.

10. For documentParameters, enter {"Cluster":"aws-fis-eks", "Namespace":"nginx", "InstallDependencies":"True"}.

11. Choose Save.

Figure 14: Select Action type

Figure 14: Select Action type

12. For our targets, we can either target our resources by resource IDs or resource tags. For this example we target one of our node instances by resource ID.

Figure 15: Specify target resource

Figure 15: Specify target resource

13. After you create the template successfully, start the experiment.

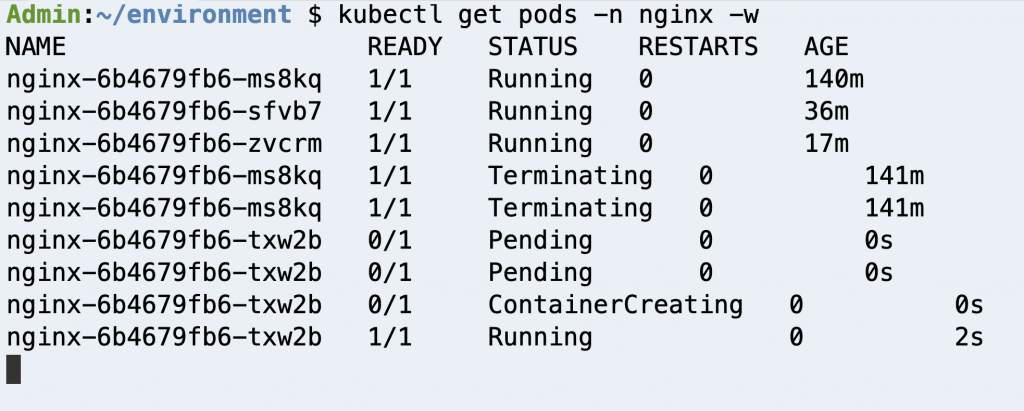
When the experiment is complete, check your application pods. In our case, AWS FIS stopped one of our pod replicas and because we use a Kubernetes deployment, as we discussed before, a new pod replica was created.

Figure 16: Check Deployment pods

Figure 16: Check Deployment pods

Clean up

To avoid incurring future charges, follow the steps below to remove all resources that was created following along with this post.

  1. From the AWS FIS console, delete the following experiments, TerminateWorkerNodes & DeletePod.
  2. From the AWS EKS console, delete the test cluster created following this post, aws-fis-eks.
  3. From the AWS Identity and Access Management (IAM) console, delete the IAM role AWSFISRole.
  4. From the Amazon CloudWatch console, delete the CloudWatch alarm CheckEKSNodes.
  5. From the AWS Systems Manager console, delete the Owned by me document Delete-Pods.

Conclusion

In this post, we showed two ways you can run fault injection experiments on Amazon EKS using AWS FIS. First, we used a native action supported by AWS FIS to terminate instances from our Amazon EKS cluster. Then, we extended AWS FIS to inject custom faults on our containerized applications running on Amazon EKS.

For more information about AWS FIS, check out the AWS re:Invent 2020 session AWS Fault Injection Simulator: Fully managed chaos engineering service. If you want to know more about chaos engineering, check out the AWS re:Invent session Testing resiliency using chaos engineering and The Chaos Engineering Collection. Finally, check out the following GitHub repo for additional example experiments, and how you can work with AWS FIS using the AWS Cloud Development Kit (AWS CDK).


About the authors


Omar is a Professional Services consultant who helps customers adopt DevOps culture and best practices. He also works to simplify the adoption of AWS services by automating and implementing complex solutions.


Daniel Arenhage is a Solutions Architect at Amazon Web Services based in Gothenburg, Sweden.


Increase your e-commerce website reliability using chaos engineering and AWS Fault Injection Simulator  

Post Syndicated from Bastien Leblanc original https://aws.amazon.com/blogs/devops/increase-e-commerce-reliability-using-chaos-engineering-with-aws-fault-injection-simulator/

Customer experience is a key differentiator for retailers, and improving this experience comes through speed and reliability. An e-commerce website is one of the first applications customers use to interact with your brand.

For a long time, testing an application has been the only way to battle-test an application before going live. Testing is very effective at identifying issues in an application, through processes like unit testing, regression testing, and performance testing. But this isn’t enough when you deploy a complex system such as an e-commerce website. Planning for unplanned events, circumstances, new deployment dependencies, and more is rarely covered by testing. That’s where chaos engineering plays its part.

In this post, we discuss a basic implementation of chaos engineering for an e-commerce website using AWS Fault Injection Simulator.

Chaos engineering for retail

At AWS, we help you build applications following the Well-Architected Framework. Each pillar has a different importance for each customer, but the reliability pillar has consistently been valued as high priority by retailers for their e-commerce website.

One of the recommendations of this pillar is to run game days on your application.

A game day simulates a failure or event to test systems, processes, and team responses. The purpose is to perform the actions the team would perform as if an exceptional event happened. These should be conducted regularly so that your team builds muscle memory of how to respond. Your game days should cover the areas of operations, security, reliability, performance, and cost.

Chaos engineering is the practice of stressing an application in testing or production environments by creating disruptive events, such as a sudden increase in CPU or memory consumption, observing how the system responds, and implementing improvements. E-commerce websites have increased in complexity to the point that you need automated processes to detect the unknown unknowns.

Let’s see how retailers can run game days, applying chaos engineering principles using AWS FIS.

Typical e-commerce components for chaos engineering

If we consider a typical e-commerce architecture, whether you have a monolith deployment, a well-known e-commerce software, or a microservices approach, all e-commerce websites contain critical components. The first task is to identify which components should be tested using chaos engineering.

We advise you to consider specific criteria when choosing which components to prioritize for chaos engineering. From our experience, the first step is to look at your critical customer journey:

  • Homepage
  • Search
  • Recommendations and personalization
  • Basket and checkout

From these critical components, consider focusing on the following:

  • High and peak traffic: Some components have specific or unpredictable traffic, such as slots, promotions, and the homepage.
  • Proven components: Some components have been tested and don’t have any existing issues. If the component isn’t tested, chaos engineering isn’t the right tool. You should return to unit testing, QA, stress testing, and performance testing and fix the known issues, then chaos engineering can help identify the unknown unknowns.

The following are some real-world examples of relevant e-commerce services that are great chaos engineering candidates:

  • Authentication – This is customer-facing because it’s part of every critical customer journey buying process
  • Search – Used by most customers, search is often more important than catalog browsing
  • Products – This is a critical component that is customer-facing
  • Ads – Ads may not be critical, but have high or peak traffic
  • Recommendations – A website without recommendations should still be 100% functional (to be checked with hypothesis during experiments), but without personal recommendations, a customer journey is greatly impacted

Solution overview

Let’s go through an example with a simplified recommendations service for an e-commerce application. The application is built with microservices, which is a typical target for chaos experiments. In a microservices architecture, unknown issues are potentially more frequent because of the distributed nature of the development. The following diagram illustrates our simplified architecture.

Recommendations Service architecture: ECS, DynamoDB, Personalize, SSM, Elasticsearch

Recommendations Service Architecture


Following the principles of chaos engineering, we define the following for each scenario:

  • A steady state
  • One or multiple hypothesis
  • One or multiple experimentations to test these hypotheses

Defining a steady state is about knowing what “good” looks like for your application. In our recommendations example, steady state is measured as follows:

  • Customer latency at p90 between 0.3–0.5 seconds (end-to-end latency when asking for a recommendations)
  • A success rate of 100% at the 95 percentile

For the sake of simplification of this article, we use a simplified version of a steady state than what is done in a real environment. You could go deeper by checking latency, for example (such as if the answer is fast but wrong). You could also analyze the metrics with an anomaly detection band instead of fixed metrics.

We could test the following situations and what should occur as a result:

  • What if Amazon DynamoDB isn’t accessible from the recommendations engine? In this case, the recommendations engine should fall back to using Amazon Elasticsearch (Amazon ES) only.
  • What if Amazon Personalize is slow to answer (over 2 seconds)? Recommendations should be served from a cache or reply with empty responses (which the front end should handle gracefully)
  • What if failures occur in Amazon Elastic Container Service (Amazon ECS), such as instances in the cluster failing or not being accessible? Scaling should kick in and continue serving customers.

Chaos experiments run the hypotheses and check the outcomes. Initially, we run the experiments individually to avoid any confusion, but going forward we can run these experiments regularly and concurrently (for example, what happens if you introduce failing tasks on Amazon ECS and DynamoDB).

Create an experiment

We measure observability and metrics through X-Ray and Amazon CloudWatch metrics. The service is fronted by a load balancer so we can use the native CloudWatch metrics for the customer-facing state. Based on our definitions, we include the metrics that matter for our customer, as summarized in the following table.

Metric Steady state CloudWatch Namespace Metric Name
Latency < 0.5 seconds AWS/X-Ray ResponseTime
Success Rate 100% at 95 percentile AWS/X-Ray OkRate

Now that we have ways to measure a steady state, we implement the hypothesis and experiments in AWS FIS. For this post, we test what happens if failures occur in Amazon ECS.

We use the action aws:ecs:drain-container-instances, which targets the cluster running the relevant task.

Let’s aim for 20% of instances that are impacted by the experiment. You should modify this percentage based on your environment, striking a balance between enough disturbance without failing the entire service.

1. On the AWS FIS console, choose Create experiment template to start creating your experiment.

FIS Home page -> create experiment template

Configure the experiment with an action aws:ecs:drain-container-instances

add action for experiment, drainage 30%, duration: 600sec

Setting up the experiment action using ECS drain instances

Configure the targeted ECS cluster(s) you want to include in your chaos experiment, we recommend to use tags to easily target a component without changing the experiment again.

set target as resource tag, key=chaos, value=true

Definition target for the chaos experiment

Before running an experiment, we have to define the stop conditions. It’s usually a combination of multiple CloudWatch alarms, which could be a manual stop (a specific alarm that can be set to the ALARM state to stop the experiment), but more importantly alarms on business metrics that you define as criteria for the applications to serve your customers. For an e-commerce website, this could be the following:

For this post, we focus on error rate.

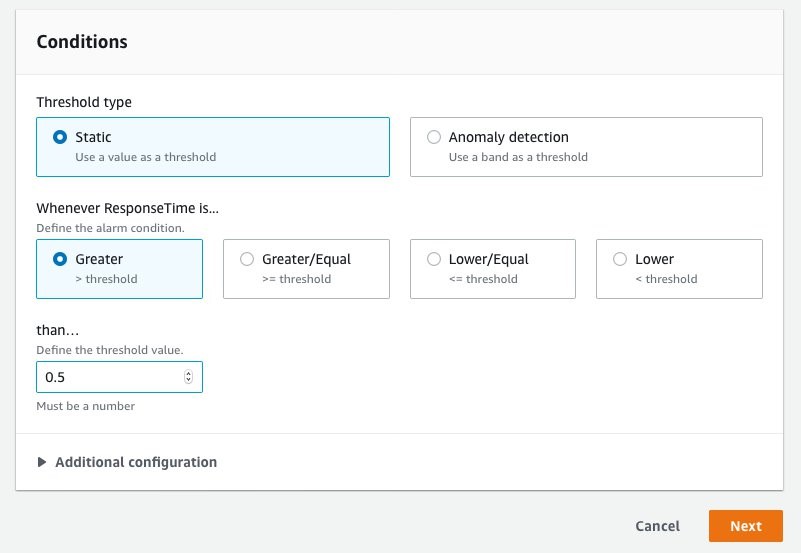
2. Create a CloudWatch alarm for error rate on the service.

CW graphs : X-ray responsetime to p50 and a second one on p90

Clouwatch alarm conditions : static, greater than 0.5

3. Configure this alarm in AWS FIS as a stop condition.

FIS Stop conditions = RecommendationResponseTime

Run the experiment

We’re now ready to run the experiment. Let’s generate some load on the e-commerce website and see how it copes before and after the experiment. For the purpose of this post, we assume we’re running in a performance or QA environment without actual customers, so the load generated should be representative of the typical load on the application.

In our example, we ingest the load using the open-source tool vegeta. Some general load is generated using a command similar to the following:

echo "GET http://xxxxx.elb.amazonaws.com/recommendations?userID=aaa&amp;currentItemID=&amp;numResults=12&amp;feature=home_product_recs&amp;fullyQualifyImageUrls=1" | vegeta attack -rate=5 -duration 0 &gt; add-results.bin

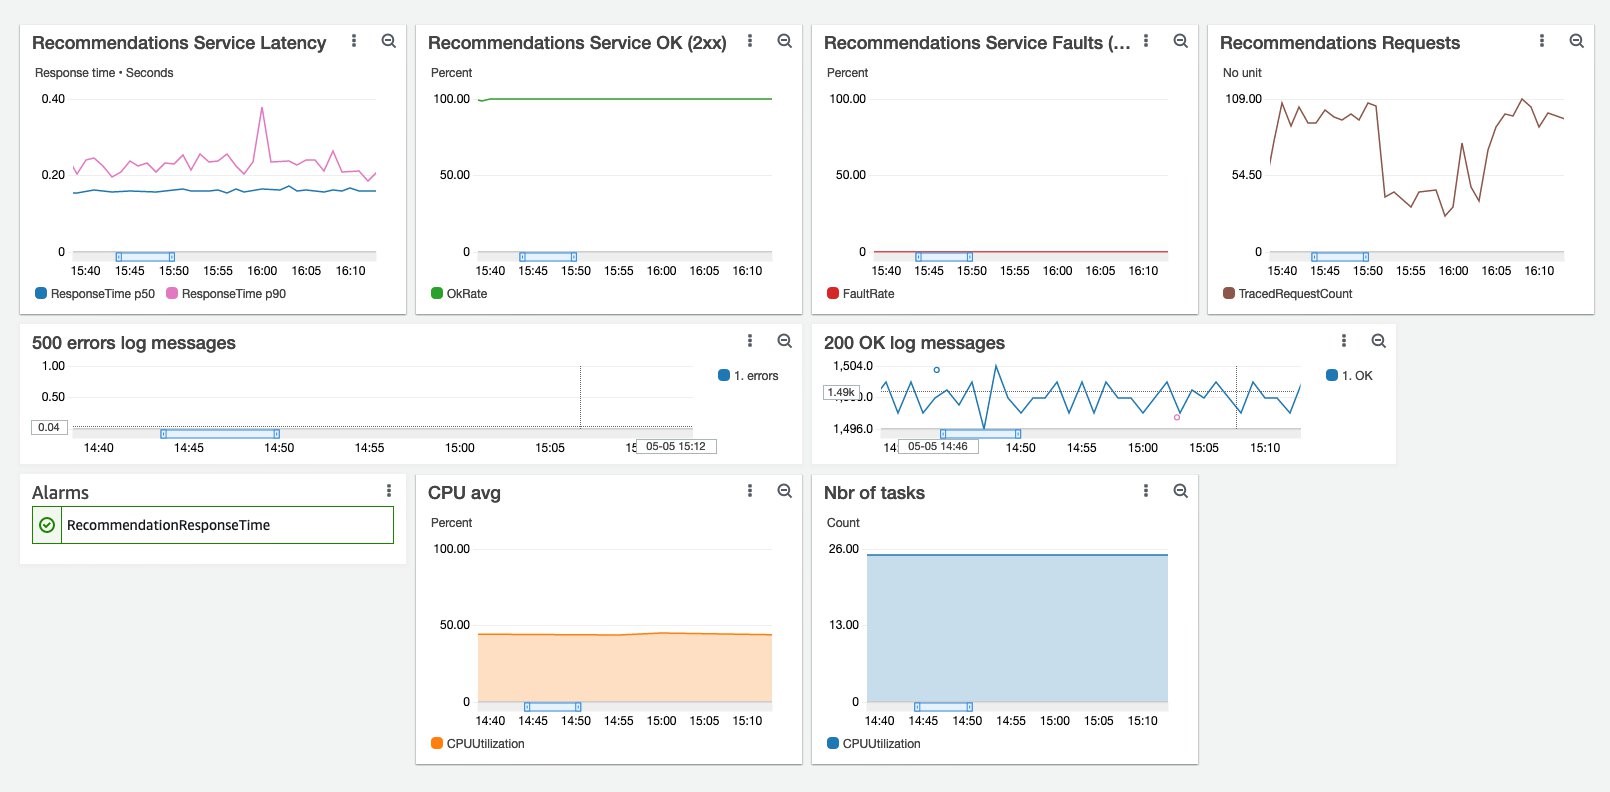
We created a dedicated CloudWatch dashboard to monitor how the recommendations service is serving customer workload. The steady state looks like the following screenshot.

Dashboard - steady state

The p90 latency is under 0.5 seconds, p90 of success is greater than x% , the number of requests varies, but the response time is steady.

Now let’s start the experiment on AWS FIS console.

FIS - start the experiment

After a few minutes, let’s check how the recommendations service is running.

Dashboard - 1st experiment, Responsetime < SLA, CPU at 80%

The number of tasks running on the ECS cluster has decreased as expected, but the service has enough room to avoid any issue due to losing part of the ECS cluster. However, the average CPU usage starts to go over 80%, so we can suspect that we’re close to saturation.

AWS FIS helped us prove that even with some degradation in the ECS cluster, the service-level agreement was still met.

But what if we increase the impact of the disruption and confirm this CPU saturation assumption? Let’s run the same experiment with more instances drained from the ECS cluster and observe our metrics.

Dashboard - breached SLA on response time, 100% CPU

With less capacity available, the response time has largely exceeded the SLA, and we have reached the limit of the architecture. We would recommend to explore optimizing the architecture with concepts like auto scaling, or caching.

Going further

Now that we have a simple chaos experiment up and running, what are the next steps? One way of expanding on this is by increasing the number of hypotheses.

As a second hypothesis, we suggest adding network latency to the application. Network latency, especially for a distributed application, is a very interesting use case for chaos engineering. It’s not easy to test manually, and often applications are designed with a “perfect” network mindset. We use the action arn:aws:ssm:send-command/AWSFIS-Run-Network-Latency to target the instances running our application.

For more information about actions, see SSM Agent for AWS FIS actions.

However, having only technical metrics (such as latency and success code) lacks a customer-centric view. When running an e-commerce website, customer experience matters. Think about how your customers are using your website and how to measure the actual outcome for a customer.

Conclusion

In this post, we covered a basic implementation of chaos engineering for an e-commerce website using AWS FIS. For more information about chaos engineering, see Principles of Chaos Engineering.

Amazon Fault Injection Simulator is now generally available, you can use it to run chaos experiments today. Click here to learn more

To go beyond these first steps, you should consider increasing the number of experiments in your application, targeting crucial elements, starting with your development and environments and moving gradually to run experiments in production.


Author bio

Bastien Leblanc - Profile PhotoBastien Leblanc is the AWS Retail technical lead for EMEA. He works with retailers focusing on delivering exceptional end-user experience using AWS Services. With a strong background in data and analytics he helps retailers transform their business with cutting-edge AWS technologies.