Tag Archives: Chaos Engineering

London Stock Exchange Group uses chaos engineering on AWS to improve resilience

Post Syndicated from Elias Bedmar original https://aws.amazon.com/blogs/architecture/london-stock-exchange-group-uses-chaos-engineering-on-aws-to-improve-resilience/

This post was co-written with Luke Sudgen, Lead DevOps Engineer Post Trade, and Padraig Murphy, Solutions Architect Post Trade, from London Stock Exchange Group.

In this post, we’ll discuss some failure scenarios that were tested by London Stock Exchange Group (LSEG) Post Trade Technology teams during a chaos engineering event supported by AWS. Chaos engineering allows LSEG to simulate real-world failures in their cloud systems as part of controlled experiments. This methodology improves resilience and observability, which reduces risk and helps achieve compliance with regulators before deploying to production.

Introduction, tooling, and methodology

As a heavily regulated provider of global financial markets infrastructure, LSEG is always looking for opportunities to enhance workload resilience. LSEG and AWS teamed up to organize and run a 3-day AWS Experience-Based Acceleration (EBA) event to perform chaos engineering experiments against key workloads. The event was sponsored and led by the architecture function and included cross-functional Post Trade technical teams across various workstreams. The experiments were run using AWS Fault Injection Service (FIS) following the experiment methodology described in the Verify the resilience of your workloads using Chaos Engineering blog post.

Resilience of modern distributed cloud systems can be continuously improved through reviewing workload architectures and recovery, assessing standard operating procedures (SOPs), and building SOP alerts and recovery automations. AWS Resilience Hub provides a comprehensive tooling suite to get started on these activities.

Another key activity to validate and enhance your resilience posture is chaos engineering, a methodology that induces controlled chaos into customer systems through real-world controlled experiments. Chaos engineering helps customers create real-world failure conditions that can uncover hidden bugs, monitor blind spots, and manage bottlenecks that are difficult to find in distributed systems. This makes it a very useful tool in regulated industries such as financial services.

Architectural overview

The architectural diagram in Figure 1 comprises a three-tier application deployed in virtual private clouds (VPCs) with a multi-AZ setup.

Chaos engineering pattern for hybrid architecture (3-tier application)

Figure 1. Chaos engineering pattern for hybrid architecture (3-tier application)

Operating within a public subnet, the web application creates a hybrid architecture by using an Amazon Elastic Compute Cloud (Amazon EC2) Auto Scaling group and connecting to an Amazon Relational Database Service (Amazon RDS) database that’s located in a private subnet and connected with on-premises services. Additionally, a number of internal services are hosted in a separate VPC, housed within containers. FIS provides a controlled environment to validate the robustness of the architecture against various failure scenarios, such as:

  • Amazon EC2 instance failure that causes the application or container pod on the machine to also fail
  • Amazon RDS database instance reboot or failover
  • Severe network latency degradation
  • Network connectivity disruption
  • Amazon Elastic Block Store (Amazon EBS) volume failure (IOPS pause, disk full)

Amazon EC2 instance and container failure

The objective of this use case is to evaluate the resilience of the application or container pod running on Amazon EC2 instances and identify how the system can adapt itself and continue functioning during unexpected disruptions or instability of an instance. You can use aws:ec2:stop-instances or aws:ec2:terminate-instances FIS actions to mimic different EC2 instance failure modes. The response of running containers to the different instance failures was also assessed. If you’re running containers within a managed AWS service such as Amazon Elastic Container Service (Amazon ECS) or Amazon Elastic Kubernetes Service (Amazon EKS), you can use FIS failure scenarios for ECS tasks and EKS pods.

Amazon RDS failure

RDS failure is another common scenario you can use to identify and troubleshoot database managed service failures from failovers and node reboots at a large scale. FIS can be used to inject reboot/failover failure conditions into the managed RDS instances to understand the bottlenecks and issues from disaster failovers, sync failures, and other database-related problems.

Severe network latency degradation

Network latency degradation injects latency in the network interface that connects two systems. This helps you understand how these systems handle a data transfer delay and your operational response readiness (alerts, metrics, and correction). This FIS action (aws:ssm:send-command/AWSFIS-Run-Network-Latency) uses the Linux traffic control (tc) utility.

Network connectivity disruption

Connectivity issues like traffic disruption or other network issues can be simulated with FIS network actions. FIS supports the aws:network:disrupt-connectivity action to test your application’s resilience in the event of total or partial connectivity loss within its subnet, as well as disruption (including cross-Region) with other AWS networking components such as route tables or AWS Transit Gateway.

Amazon EBS volume failure (IOPS pause)

Disk failure is a problematic issue in real-time operations-based systems. It can lead to transactions failing due to I/O failures or storage failure during peak activity in heavy workloads. The EBS volume failure actions test system performance under different disk failure scenarios. FIS supports the aws:ebs:pause-volume-io action to pause I/O operations on target EBS volumes, as well as other failure modes. The target volumes must be in the same Availability Zone and must be attached to instances built on the AWS Nitro System.

Outcomes and conclusion

Following the experiment, the teams from LSEG successfully identified a series of architectural improvements to reduce application recovery time and enhance metric granularity and alerting. As a second tangible output, the teams now have a reusable chaos engineering methodology and toolset. Running regular in-person cross-functional events is a great way to implement a chaos engineering practice in your organization.

You can start your resilience journey on AWS today with AWS Resilience Hub.

Securely validate business application resilience with AWS FIS and IAM

Post Syndicated from Dr. Rudolf Potucek original https://aws.amazon.com/blogs/devops/securely-validate-business-application-resilience-with-aws-fis-and-iam/

To avoid high costs of downtime, mission critical applications in the cloud need to achieve resilience against degradation of cloud provider APIs and services.

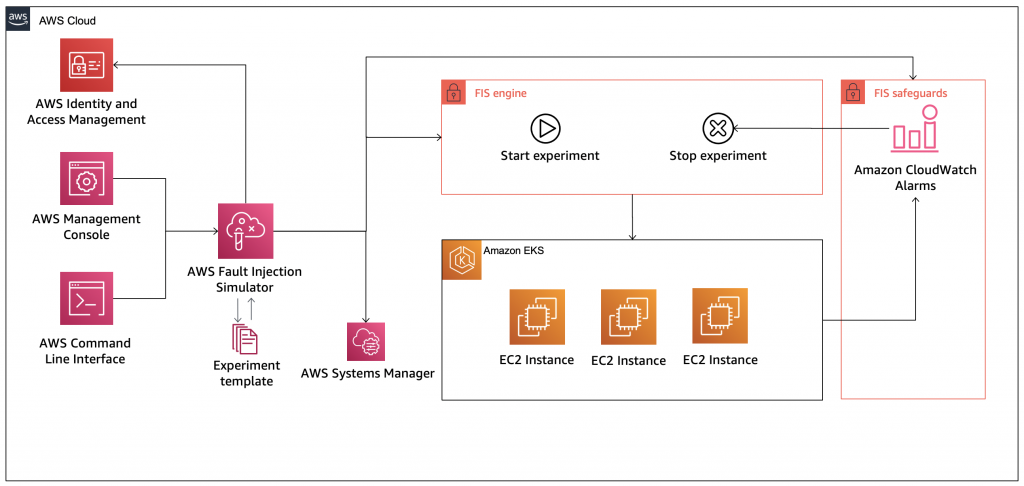
In 2021, AWS launched AWS Fault Injection Simulator (FIS), a fully managed service to perform fault injection experiments on workloads in AWS to improve their reliability and resilience. At the time of writing, FIS allows to simulate degradation of Amazon Elastic Compute Cloud (EC2) APIs using API fault injection actions and thus explore the resilience of workflows where EC2 APIs act as a fault boundary. 

In this post we show you how to explore additional fault boundaries in your applications by selectively denying access to any AWS API. This technique is particularly useful for fully managed, “black box” services like Amazon Simple Storage Service (S3) or Amazon Simple Queue Service (SQS) where a failure of read or write operations is sufficient to simulate problems in the service. This technique is also useful for injecting failures in serverless applications without needing to modify code. While similar results could be achieved with network disruption or modifying code with feature flags, this approach provides a fine granular degradation of an AWS API without the need to re-deploy and re-validate code.

Overview

We will explore a common application pattern: user uploads a file, S3 triggers an AWS Lambda function, Lambda transforms the file to a new location and deletes the original:

S3 upload and transform logical workflow: User uploads file to S3, upload triggers AWS Lambda execution, Lambda writes transformed file to a new bucket and deletes original. Workflow can be disrupted at file deletion.

Figure 1. S3 upload and transform logical workflow: User uploads file to S3, upload triggers AWS Lambda execution, Lambda writes transformed file to a new bucket and deletes original. Workflow can be disrupted at file deletion.

We will simulate the user upload with an Amazon EventBridge rate expression triggering an AWS Lambda function which creates a file in S3:

S3 upload and transform implemented demo workflow: Amazon EventBridge triggers a creator Lambda function, Lambda function creates a file in S3, file creation triggers AWS Lambda execution on transformer function, Lambda writes transformed file to a new bucket and deletes original. Workflow can be disrupted at file deletion.

Figure 2. S3 upload and transform implemented demo workflow: Amazon EventBridge triggers a creator Lambda function, Lambda function creates a file in S3, file creation triggers AWS Lambda execution on transformer function, Lambda writes transformed file to a new bucket and deletes original. Workflow can be disrupted at file deletion.

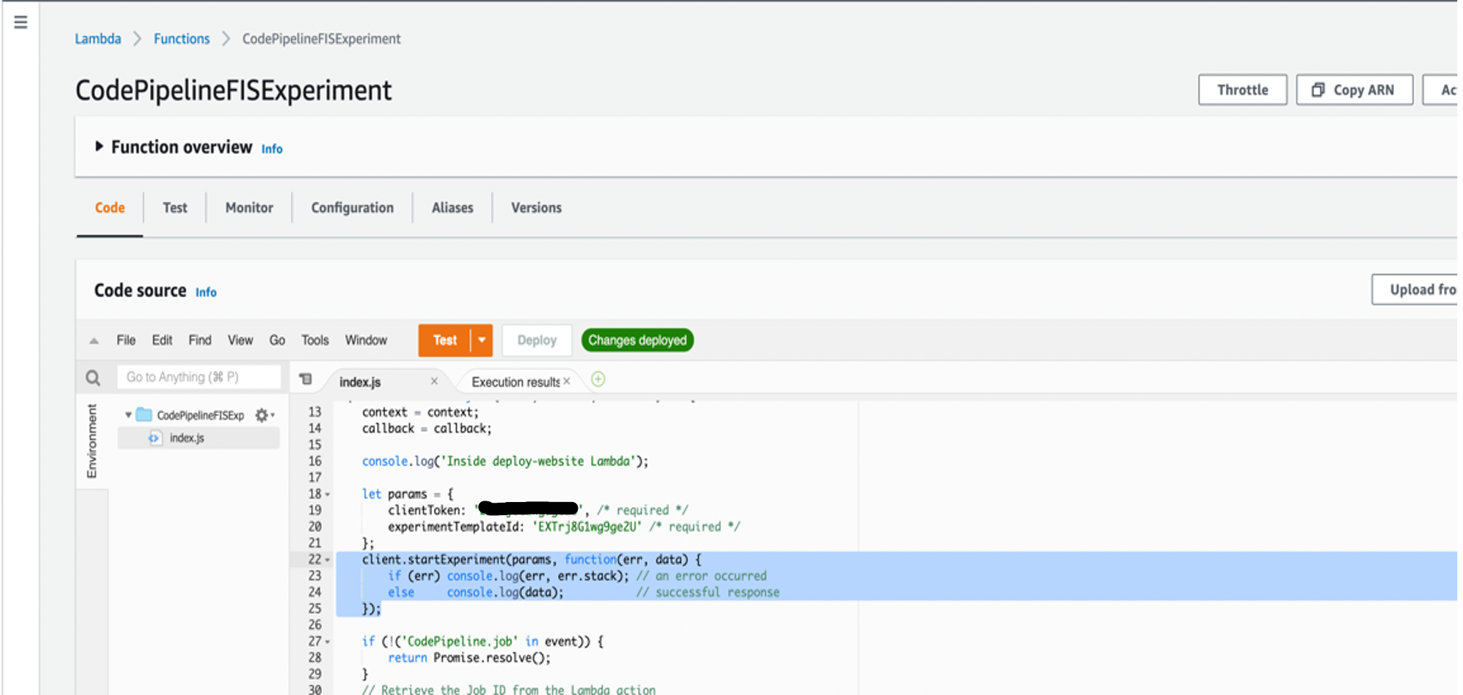
Using this architecture we can explore the effect of S3 API degradation during file creation and deletion. As shown, the API call to delete a file from S3 is an application fault boundary. The failure could occur, with identical effect, because of S3 degradation or because the AWS IAM role of the Lambda function denies access to the API.

To inject failures we use AWS Systems Manager (AWS SSM) automation documents to attach and detach IAM policies at the API fault boundary and FIS to orchestrate the workflow.

Each Lambda function has an IAM execution role that allows S3 write and delete access, respectively. If the processor Lambda fails, the S3 file will remain in the bucket, indicating a failure. Similarly, if the IAM execution role for the processor function is denied the ability to delete a file after processing, that file will remain in the S3 bucket.

Prerequisites

Following this blog posts will incur some costs for AWS services. To explore this test application you will need an AWS account. We will also assume that you are using AWS CloudShell or have the AWS CLI installed and have configured a profile with administrator permissions. With that in place you can create the demo application in your AWS account by downloading this template and deploying an AWS CloudFormation stack:

git clone https://github.com/aws-samples/fis-api-failure-injection-using-iam.git
cd fis-api-failure-injection-using-iam
aws cloudformation deploy --stack-name test-fis-api-faults --template-file template.yaml --capabilities CAPABILITY_NAMED_IAM

Fault injection using IAM

Once the stack has been created, navigate to the Amazon CloudWatch Logs console and filter for /aws/lambda/test-fis-api-faults. Under the EventBridgeTimerHandler log group you should find log events once a minute writing a timestamped file to an S3 bucket named fis-api-failure-ACCOUNT_ID. Under the S3TriggerHandler log group you should find matching deletion events for those files.

Once you have confirmed object creation/deletion, let’s take away the permission of the S3 trigger handler lambda to delete files. To do this you will attach the FISAPI-DenyS3DeleteObject  policy that was created with the template:

ROLE_NAME=FISAPI-TARGET-S3TriggerHandlerRole
ROLE_ARN=$( aws iam list-roles --query "Roles[?RoleName=='${ROLE_NAME}'].Arn" --output text )
echo Target Role ARN: $ROLE_ARN

POLICY_NAME=FISAPI-DenyS3DeleteObject
POLICY_ARN=$( aws iam list-policies --query "Policies[?PolicyName=='${POLICY_NAME}'].Arn" --output text )
echo Impact Policy ARN: $POLICY_ARN

aws iam attach-role-policy \
  --role-name ${ROLE_NAME}\
  --policy-arn ${POLICY_ARN}

With the deny policy in place you should now see object deletion fail and objects should start showing up in the S3 bucket. Navigate to the S3 console and find the bucket starting with fis-api-failure. You should see a new object appearing in this bucket once a minute:

S3 bucket listing showing files not being deleted because IAM permissions DENY file deletion during FIS experiment.

Figure 3. S3 bucket listing showing files not being deleted because IAM permissions DENY file deletion during FIS experiment.

If you would like to graph the results you can navigate to AWS CloudWatch, select “Logs Insights“, select the log group starting with /aws/lambda/test-fis-api-faults-S3CountObjectsHandler, and run this query:

fields @timestamp, @message
| filter NumObjects >= 0
| sort @timestamp desc
| stats max(NumObjects) by bin(1m)
| limit 20

This will show the number of files in the S3 bucket over time:

AWS CloudWatch Logs Insights graph showing the increase in the number of retained files in S3 bucket over time, demonstrating the effect of the introduced failure.

Figure 4. AWS CloudWatch Logs Insights graph showing the increase in the number of retained files in S3 bucket over time, demonstrating the effect of the introduced failure.

You can now detach the policy:

ROLE_NAME=FISAPI-TARGET-S3TriggerHandlerRole
ROLE_ARN=$( aws iam list-roles --query "Roles[?RoleName=='${ROLE_NAME}'].Arn" --output text )
echo Target Role ARN: $ROLE_ARN

POLICY_NAME=FISAPI-DenyS3DeleteObject
POLICY_ARN=$( aws iam list-policies --query "Policies[?PolicyName=='${POLICY_NAME}'].Arn" --output text )
echo Impact Policy ARN: $POLICY_ARN

aws iam detach-role-policy \
  --role-name ${ROLE_NAME}\
  --policy-arn ${POLICY_ARN}

We see that newly written files will once again be deleted but the un-processed files will remain in the S3 bucket. From the fault injection we learned that our system does not tolerate request failures when deleting files from S3. To address this, we should add a dead letter queue or some other retry mechanism.

Note: if the Lambda function does not return a success state on invocation, EventBridge will retry. In our Lambda functions we are cost conscious and explicitly capture the failure states to avoid excessive retries.

Fault injection using SSM

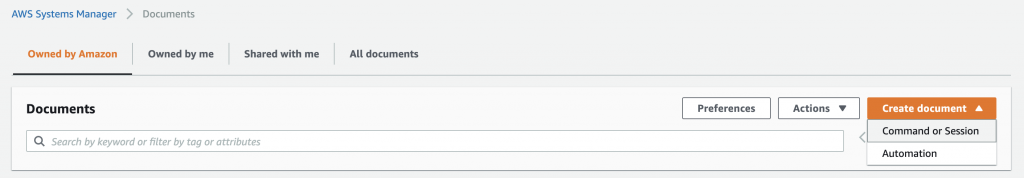
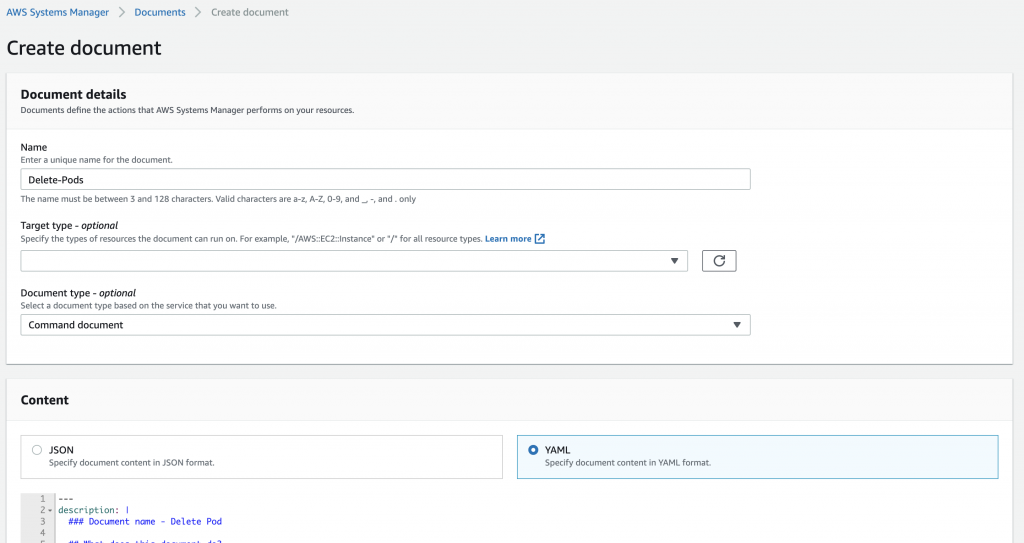
To use this approach from FIS and to always remove the policy at the end of the experiment, we first create an SSM document to automate adding a policy to a role. To inspect this document, open the SSM console, navigate to the “Documents” section, find the FISAPI-IamAttachDetach document under “Owned by me”, and examine the “Content” tab (make sure to select the correct region). This document takes the name of the Role you want to impact and the Policy you want to attach as parameters. It also requires an IAM execution role that grants it the power to list, attach, and detach specific policies to specific roles.

Let’s run the SSM automation document from the console by selecting “Execute Automation”. Determine the ARN of the FISAPI-SSM-Automation-Role from CloudFormation or by running:

POLICY_NAME=FISAPI-DenyS3DeleteObject
POLICY_ARN=$( aws iam list-policies --query "Policies[?PolicyName=='${POLICY_NAME}'].Arn" --output text )
echo Impact Policy ARN: $POLICY_ARN

Use FISAPI-SSM-Automation-Role, a duration of 2 minutes expressed in ISO8601 format as PT2M, the ARN of the deny policy, and the name of the target role FISAPI-TARGET-S3TriggerHandlerRole:

Image of parameter input field reflecting the instructions in blog text.

Figure 5. Image of parameter input field reflecting the instructions in blog text.

Alternatively execute this from a shell:

ASSUME_ROLE_NAME=FISAPI-SSM-Automation-Role
ASSUME_ROLE_ARN=$( aws iam list-roles --query "Roles[?RoleName=='${ASSUME_ROLE_NAME}'].Arn" --output text )
echo Assume Role ARN: $ASSUME_ROLE_ARN

ROLE_NAME=FISAPI-TARGET-S3TriggerHandlerRole
ROLE_ARN=$( aws iam list-roles --query "Roles[?RoleName=='${ROLE_NAME}'].Arn" --output text )
echo Target Role ARN: $ROLE_ARN

POLICY_NAME=FISAPI-DenyS3DeleteObject
POLICY_ARN=$( aws iam list-policies --query "Policies[?PolicyName=='${POLICY_NAME}'].Arn" --output text )
echo Impact Policy ARN: $POLICY_ARN

aws ssm start-automation-execution \
  --document-name FISAPI-IamAttachDetach \
  --parameters "{
      \"AutomationAssumeRole\": [ \"${ASSUME_ROLE_ARN}\" ],
      \"Duration\": [ \"PT2M\" ],
      \"TargetResourceDenyPolicyArn\": [\"${POLICY_ARN}\" ],
      \"TargetApplicationRoleName\": [ \"${ROLE_NAME}\" ]
    }"

Wait two minutes and then examine the content of the S3 bucket starting with fis-api-failure again. You should now see two additional files in the bucket, showing that the policy was attached for 2 minutes during which files could not be deleted, and confirming that our application is not resilient to S3 API degradation.

Permissions for injecting failures with SSM

Fault injection with SSM is controlled by IAM, which is why you had to specify the FISAPI-SSM-Automation-Role:

Visual representation of IAM permission used for fault injections with SSM. It shows the SSM execution role permitting access to use SSM automation documents as well as modify IAM roles and policies via the SSM document. It also shows the SSM user needing to have a pass-role permission to grant the SSM execution role to the SSM service.

Figure 6. Visual representation of IAM permission used for fault injections with SSM.

This role needs to contain an assume role policy statement for SSM to allow assuming the role:

      AssumeRolePolicyDocument:
        Statement:
          - Action:
             - 'sts:AssumeRole'
            Effect: Allow
            Principal:
              Service:
                - "ssm.amazonaws.com"

The role also needs to contain permissions to describe roles and their attached policies with an optional constraint on which roles and policies are visible:

          - Sid: GetRoleAndPolicyDetails
            Effect: Allow
            Action:
              - 'iam:GetRole'
              - 'iam:GetPolicy'
              - 'iam:ListAttachedRolePolicies'
            Resource:
              # Roles
              - !GetAtt EventBridgeTimerHandlerRole.Arn
              - !GetAtt S3TriggerHandlerRole.Arn
              # Policies
              - !Ref AwsFisApiPolicyDenyS3DeleteObject

Finally the SSM role needs to allow attaching and detaching a policy document. This requires

  1. an ALLOW statement
  2. a constraint on the policies that can be attached
  3. a constraint on the roles that can be attached to

In the role we collapse the first two requirements into an ALLOW statement with a condition constraint for the Policy ARN. We then express the third requirement in a DENY statement that will limit the '*' resource to only the explicit role ARNs we want to modify:

          - Sid: AllowOnlyTargetResourcePolicies
            Effect: Allow
            Action:  
              - 'iam:DetachRolePolicy'
              - 'iam:AttachRolePolicy'
            Resource: '*'
            Condition:
              ArnEquals:
                'iam:PolicyARN':
                  # Policies that can be attached
                  - !Ref AwsFisApiPolicyDenyS3DeleteObject
          - Sid: DenyAttachDetachAllRolesExceptApplicationRole
            Effect: Deny
            Action: 
              - 'iam:DetachRolePolicy'
              - 'iam:AttachRolePolicy'
            NotResource: 
              # Roles that can be attached to
              - !GetAtt EventBridgeTimerHandlerRole.Arn
              - !GetAtt S3TriggerHandlerRole.Arn

We will discuss security considerations in more detail at the end of this post.

Fault injection using FIS

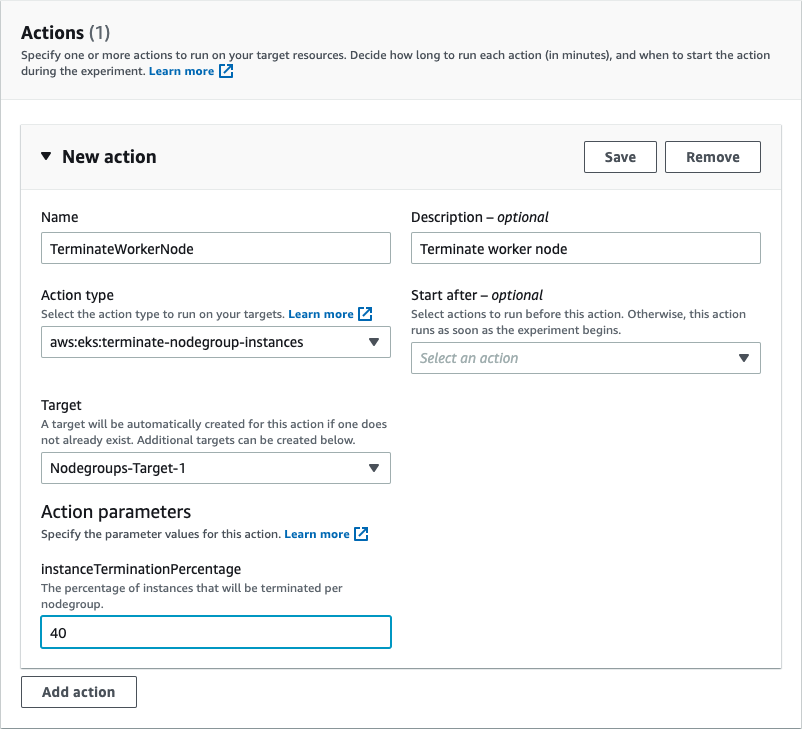
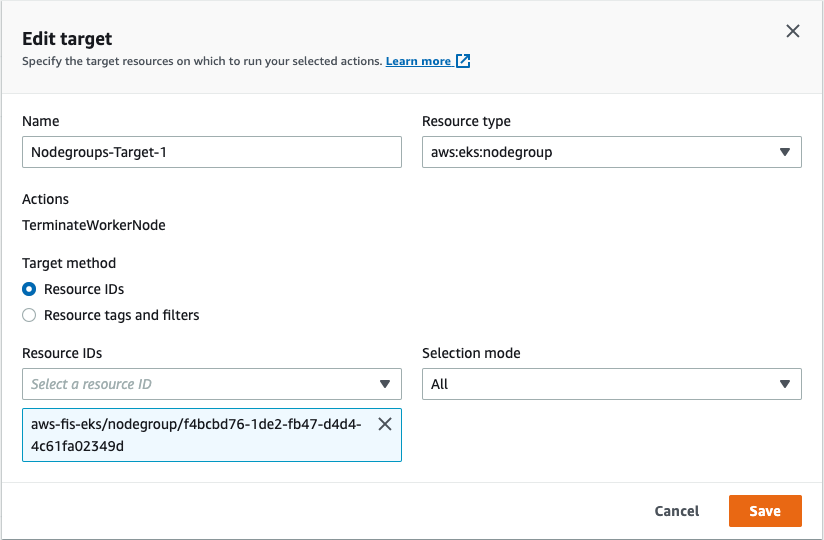
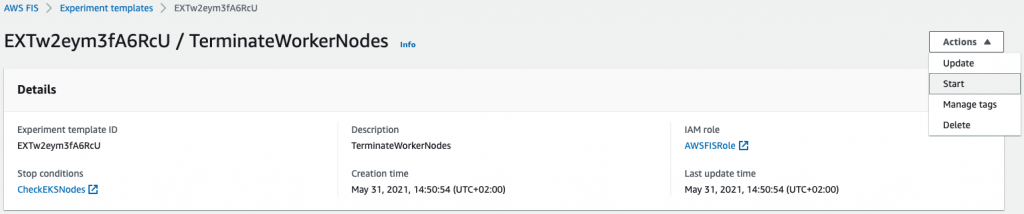
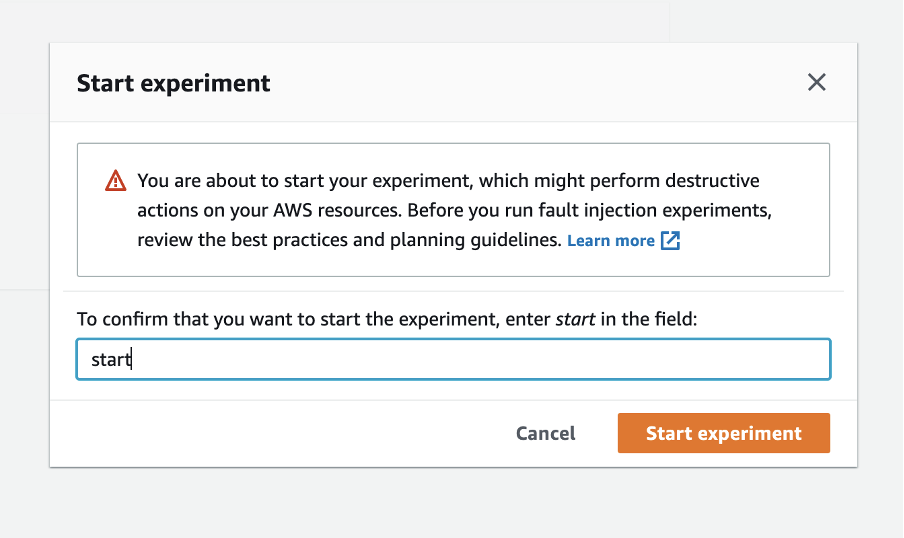
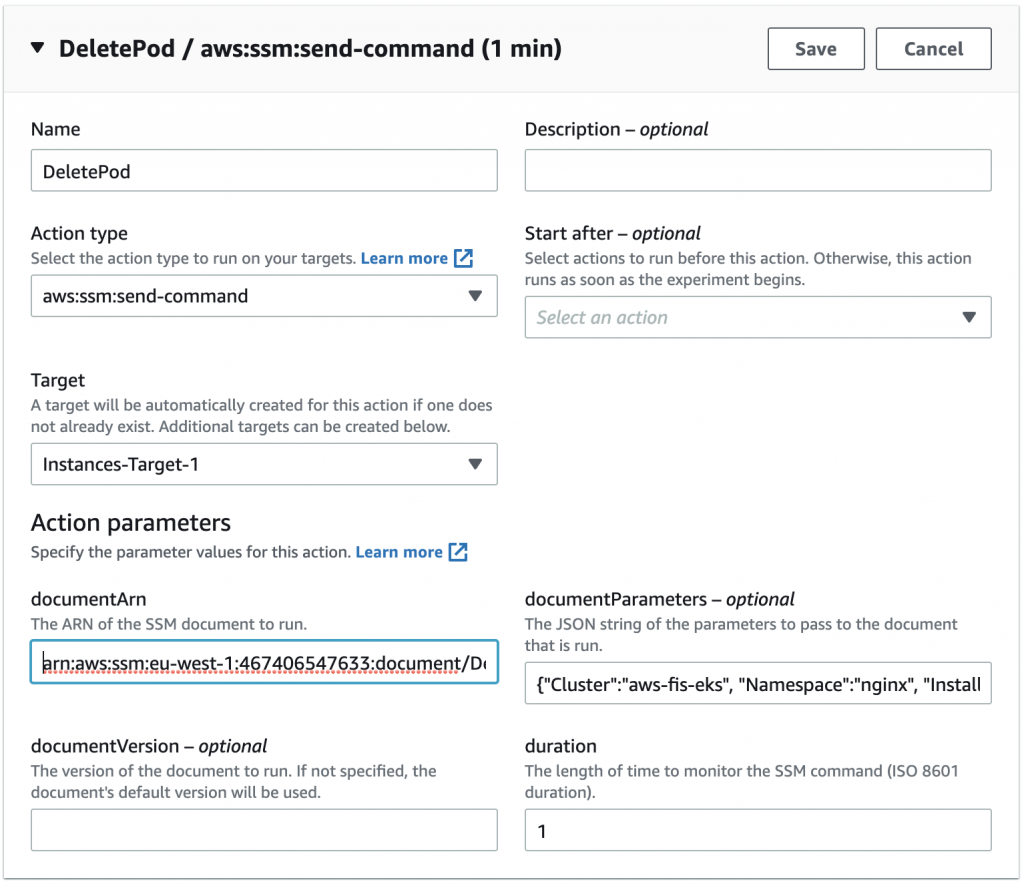
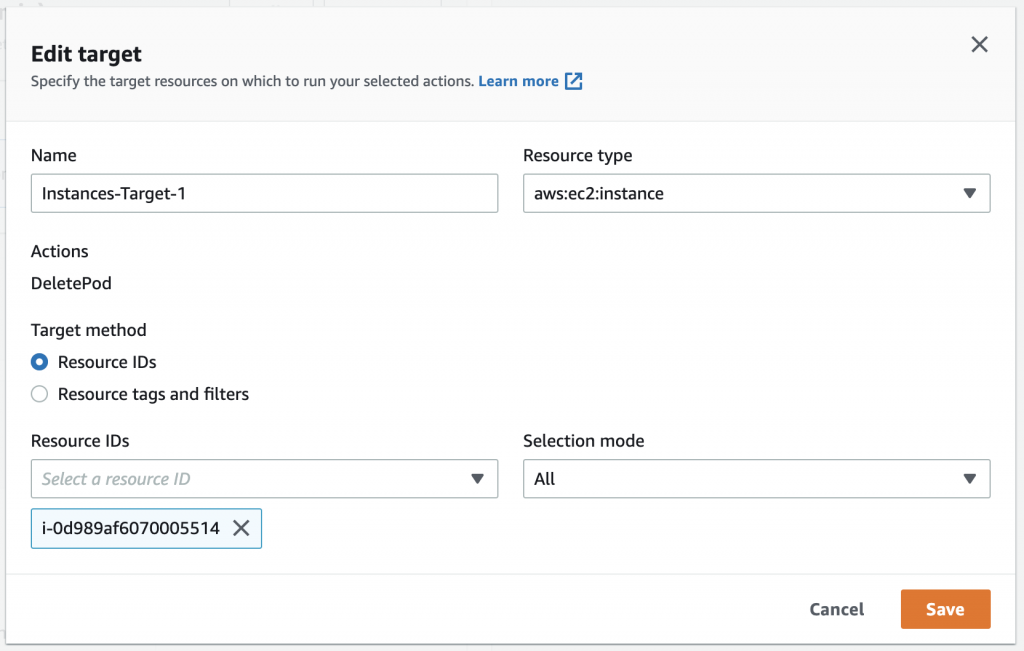
With the SSM document in place you can now create an FIS template that calls the SSM document. Navigate to the FIS console and filter for FISAPI-DENY-S3PutObject. You should see that the experiment template passes the same parameters that you previously used with SSM:

Image of FIS experiment template action summary. This shows the SSM document ARN to be used for fault injection and the JSON parameters passed to the SSM document specifying the IAM Role to modify and the IAM Policy to use.

Figure 7. Image of FIS experiment template action summary. This shows the SSM document ARN to be used for fault injection and the JSON parameters passed to the SSM document specifying the IAM Role to modify and the IAM Policy to use.

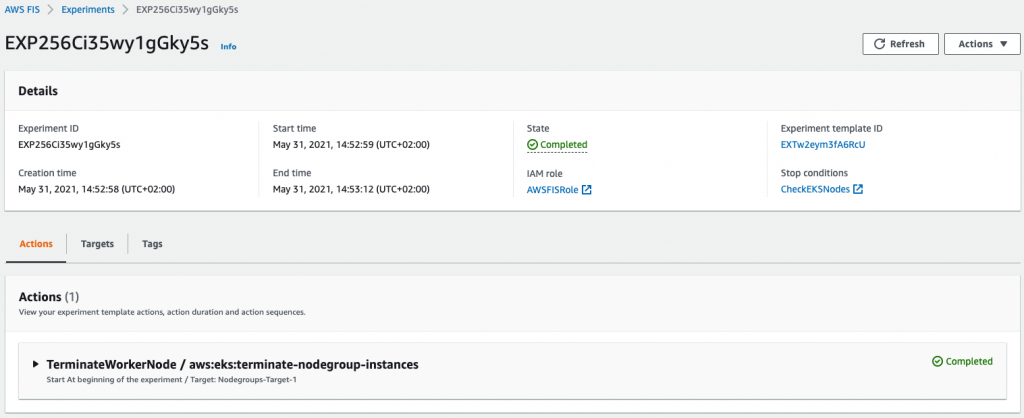
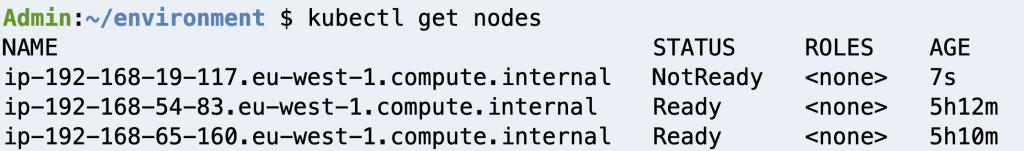
You can now run the FIS experiment and after a couple minutes once again see new files in the S3 bucket.

Permissions for injecting failures with FIS and SSM

Fault injection with FIS is controlled by IAM, which is why you had to specify the FISAPI-FIS-Injection-EperimentRole:

Visual representation of IAM permission used for fault injections with FIS and SSM. It shows the SSM execution role permitting access to use SSM automation documents as well as modify IAM roles and policies via the SSM document. It also shows the FIS execution role permitting access to use FIS templates, as well as the pass-role permission to grant the SSM execution role to the SSM service. Finally it shows the FIS user needing to have a pass-role permission to grant the FIS execution role to the FIS service.

Figure 8. Visual representation of IAM permission used for fault injections with FIS and SSM. It shows the SSM execution role permitting access to use SSM automation documents as well as modify IAM roles and policies via the SSM document. It also shows the FIS execution role permitting access to use FIS templates, as well as the pass-role permission to grant the SSM execution role to the SSM service. Finally it shows the FIS user needing to have a pass-role permission to grant the FIS execution role to the FIS service.

This role needs to contain an assume role policy statement for FIS to allow assuming the role:

      AssumeRolePolicyDocument:
        Statement:
          - Action:
              - 'sts:AssumeRole'
            Effect: Allow
            Principal:
              Service:
                - "fis.amazonaws.com"

The role also needs permissions to list and execute SSM documents:

            - Sid: RequiredReadActionsforAWSFIS
              Effect: Allow
              Action:
                - 'cloudwatch:DescribeAlarms'
                - 'ssm:GetAutomationExecution'
                - 'ssm:ListCommands'
                - 'iam:ListRoles'
              Resource: '*'
            - Sid: RequiredSSMStopActionforAWSFIS
              Effect: Allow
              Action:
                - 'ssm:CancelCommand'
              Resource: '*'
            - Sid: RequiredSSMWriteActionsforAWSFIS
              Effect: Allow
              Action:
                - 'ssm:StartAutomationExecution'
                - 'ssm:StopAutomationExecution'
              Resource: 
                - !Sub 'arn:aws:ssm:${AWS::Region}:${AWS::AccountId}:automation-definition/${SsmAutomationIamAttachDetachDocument}:$DEFAULT'

Finally, remember that the SSM document needs to use a Role of its own to execute the fault injection actions. Because that Role is different from the Role under which we started the FIS experiment, we need to explicitly allow SSM to assume that role with a PassRole statement which will expand to FISAPI-SSM-Automation-Role:

            - Sid: RequiredIAMPassRoleforSSMADocuments
              Effect: Allow
              Action: 'iam:PassRole'
              Resource: !Sub 'arn:aws:iam::${AWS::AccountId}:role/${SsmAutomationRole}'

Secure and flexible permissions

So far, we have used explicit ARNs for our guardrails. To expand flexibility, we can use wildcards in our resource matching. For example, we might change the Policy matching from:

            Condition:
              ArnEquals:
                'iam:PolicyARN':
                  # Explicitly listed policies - secure but inflexible
                  - !Ref AwsFisApiPolicyDenyS3DeleteObject

or the equivalent:

            Condition:
              ArnEquals:
                'iam:PolicyARN':
                  # Explicitly listed policies - secure but inflexible
                  - !Sub 'arn:${AWS::Partition}:iam::${AWS::AccountId}:policy/${FullPolicyName}

to a wildcard notation like this:

            Condition:
              ArnEquals:
                'iam:PolicyARN':
                  # Wildcard policies - secure and flexible
                  - !Sub 'arn:${AWS::Partition}:iam::${AWS::AccountId}:policy/${PolicyNamePrefix}*'

If we set PolicyNamePrefix to FISAPI-DenyS3 this would now allow invoking FISAPI-DenyS3PutObject and FISAPI-DenyS3DeleteObject but would not allow using a policy named FISAPI-DenyEc2DescribeInstances.

Similarly, we could change the Resource matching from:

            NotResource: 
              # Explicitly listed roles - secure but inflexible
              - !GetAtt EventBridgeTimerHandlerRole.Arn
              - !GetAtt S3TriggerHandlerRole.Arn

to a wildcard equivalent like this:

            NotResource: 
              # Wildcard policies - secure and flexible
              - !Sub 'arn:${AWS::Partition}:iam::${AWS::AccountId}:role/${RoleNamePrefixEventBridge}*'
              - !Sub 'arn:${AWS::Partition}:iam::${AWS::AccountId}:role/${RoleNamePrefixS3}*'
and setting RoleNamePrefixEventBridge to FISAPI-TARGET-EventBridge and RoleNamePrefixS3 to FISAPI-TARGET-S3.

Finally, we would also change the FIS experiment role to allow SSM documents based on a name prefix by changing the constraint on automation execution from:

            - Sid: RequiredSSMWriteActionsforAWSFIS
              Effect: Allow
              Action:
                - 'ssm:StartAutomationExecution'
                - 'ssm:StopAutomationExecution'
              Resource: 
                # Explicitly listed resource - secure but inflexible
                # Note: the $DEFAULT at the end could also be an explicit version number
                # Note: the 'automation-definition' is automatically created from 'document' on invocation
                - !Sub 'arn:aws:ssm:${AWS::Region}:${AWS::AccountId}:automation-definition/${SsmAutomationIamAttachDetachDocument}:$DEFAULT'

to

            - Sid: RequiredSSMWriteActionsforAWSFIS
              Effect: Allow
              Action:
                - 'ssm:StartAutomationExecution'
                - 'ssm:StopAutomationExecution'
              Resource: 
                # Wildcard resources - secure and flexible
                # 
                # Note: the 'automation-definition' is automatically created from 'document' on invocation
                - !Sub 'arn:aws:ssm:${AWS::Region}:${AWS::AccountId}:automation-definition/${SsmAutomationDocumentPrefix}*'

and setting SsmAutomationDocumentPrefix to FISAPI-. Test this by updating the CloudFormation stack with a modified template:

aws cloudformation deploy --stack-name test-fis-api-faults --template-file template2.yaml --capabilities CAPABILITY_NAMED_IAM

Permissions governing users

In production you should not be using administrator access to use FIS. Instead we create two roles FISAPI-AssumableRoleWithCreation and FISAPI-AssumableRoleWithoutCreation for you (see this template). These roles require all FIS and SSM resources to have a Name tag that starts with FISAPI-. Try assuming the role without creation privileges and running an experiment. You will notice that you can only start an experiment if you add a Name tag, e.g. FISAPI-secure-1, and you will only be able to get details of experiments and templates that have proper Name tags.

If you are working with AWS Organizations, you can add further guard rails by defining SCPs that control the use of the FISAPI-* tags similar to this blog post.

Caveats

For this solution we are choosing to attach policies instead of permission boundaries. The benefit of this is that you can attach multiple independent policies and thus simulate multi-step service degradation. However, this means that it is possible to increase the permission level of a role. While there are situations where this might be of interest, e.g. to simulate security breaches, please implement a thorough security review of any fault injection IAM policies you create. Note that modifying IAM Roles may trigger events in your security monitoring tools.

The AttachRolePolicy and DetachRolePolicy calls from AWS IAM are eventually consistent, meaning that in some cases permission propagation when starting and stopping fault injection may take up to 5 minutes each.

Cleanup

To avoid additional cost, delete the content of the S3 bucket and delete the CloudFormation stack:

# Clean up policy attachments just in case
CLEANUP_ROLES=$(aws iam list-roles --query "Roles[?starts_with(RoleName,'FISAPI-')].RoleName" --output text)
for role in $CLEANUP_ROLES; do
  CLEANUP_POLICIES=$(aws iam list-attached-role-policies --role-name $role --query "AttachedPolicies[?starts_with(PolicyName,'FISAPI-')].PolicyName" --output text)
  for policy in $CLEANUP_POLICIES; do
    echo Detaching policy $policy from role $role
    aws iam detach-role-policy --role-name $role --policy-arn $policy
  done
done
# Delete S3 bucket content
ACCOUNT_ID=$( aws sts get-caller-identity --query Account --output text )
S3_BUCKET_NAME=fis-api-failure-${ACCOUNT_ID}
aws s3 rm --recursive s3://${S3_BUCKET_NAME}
aws s3 rb s3://${S3_BUCKET_NAME}
# Delete cloudformation stack
aws cloudformation delete-stack --stack-name test-fis-api-faults
aws cloudformation wait stack-delete-complete --stack-name test-fis-api-faults

Conclusion 

AWS Fault Injection Simulator provides the ability to simulate various external impacts to your application to validate and improve resilience. We’ve shown how combining FIS with IAM to selectively deny access to AWS APIs provides a generic path to explore fault boundaries across all AWS services. We’ve shown how this can be used to identify and improve a resilience problem in a common S3 upload workflow. To learn about more ways to use FIS, see this workshop.

About the authors:

Dr. Rudolf Potucek

Dr. Rudolf Potucek is Startup Solutions Architect at Amazon Web Services. Over the past 30 years he gained a PhD and worked in different roles including leading teams in academia and industry, as well as consulting. He brings experience from working with academia, startups, and large enterprises to his current role of guiding startup customers to succeed in the cloud.

Rudolph Wagner

Rudolph Wagner is a Premium Support Engineer at Amazon Web Services who holds the CISSP and OSCP security certifications, in addition to being a certified AWS Solutions Architect Professional. He assists internal and external Customers with multiple AWS services by using his diverse background in SAP, IT, and construction.

Chaos Engineering in the cloud

Post Syndicated from Laurent Domb original https://aws.amazon.com/blogs/architecture/chaos-engineering-in-the-cloud/

For many years, Chaos Engineering was viewed as a mechanism to help surface the “known-unknowns” (things that we are aware of, but do not fully understand) in our environments or “unknown-unknowns” (things we are neither aware of, nor fully understand).

Using Chaos Engineering, chaos experiments have been conducted on infrastructure, applications, and business processes that identified weaknesses and prevented outages for many organizations; yet, while Chaos Engineering found a home across various industries, like Financial Services, Media and Entertainment, Healthcare, Telecommunication, Hospitality and others, it has been slow in its adoption.

A different perspective on Chaos Engineering

For the last decade, Chaos Engineering had the reputation of being a mechanism to “purposely break things in production”, which stopped many companies from adopting it. The ultimate goal of Chaos Engineering is not about breaking production systems.

Chaos Engineering offers a mechanism that allows your teams to gain deep insights into your workloads by executing controlled chaos experiments that are based on a real-world hypothesis. These experiments have a clear scope that defines the expected impact to the workload and includes a rollback mechanism where there is availability or recovery processes in place to mitigate the failure.

Chaos Engineering drives operational readiness and best practices around how your workloads should be observed, designed, and implemented to survive component failure with minimal to no impact to the end user. Therefore, Chaos Engineering can lead to improved resilience and observability, ultimately improving the end-user’s experience and increasing organizations’ uptime.

The Shared Responsibility Model for resilience

When you build a workload in the Amazon Web Services (AWS) Cloud, we (at AWS) are responsible for the “resilience of the cloud”; this means, we are responsible for the resilience of the services and infrastructure offered on the AWS Cloud. This infrastructure is composed of the hardware, software, networking, and facilities that run AWS Cloud services.

Your responsibility as a customer is the “resilience in the cloud”, meaning your responsibility is determined by the AWS Cloud services that you consume. This determines the amount of configuration work, recovery mechanisms, operational tooling, and observability logic that are needed to make the workload resilient (Figure 1).

AWS Shared Responsibility Model for resilience

Figure 1. AWS Shared Responsibility Model for resilience

Resilience in the cloud

Separation of duties creates interesting challenges in resilience:

  • How can you build workloads that will mitigate enough failure modes to meet your resilience objective, if you are not responsible for operating the underlying services that you rely on?
  • How are your workloads performing if one or more AWS services are impaired, a network disruption occurs, or a natural disaster strikes?

While there is distinct guidance on these questions in the AWS Well-Architected Framework’s Reliability Pillar, one question still remains: can your team/organization simulate a controlled event in pre-production or production that would give them confidence that the observability tooling, incident response, and recovery mechanisms will protect the workload from a disruption with minimal to no customer impact?

If you have been operating in a regulated environment, like the Financial Services industry, Healthcare, or the Federal Government, you can cite that the quarterly/yearly disaster-recovery (DR) exercises and your business continuity plan help with such simulations.

Planned DR exercises have a clear structure and scope: employees know that they have to be ready on a certain date and time, and they will execute the runbooks and playbooks that are hopefully up-to-date on that day. In essence, this validates a failover of a known-state. While DR exercises can provide a high level of confidence that operations will continue in a secondary region without being dependent on any services in the primary site, these exercises do not provide the ability to detect and mitigate the different types of failure modes that may be encountered in a real-world scenario.

Disaster recovery and failure in the real world

For example, in 2012, Hurricane Sandy took down critical infrastructure services when it struck the Northeast US, resulting in power and telecommunication outages on the East Coast. Many companies’ business continuity plans did not account for staff living in zones impacted by natural disaster. Clearly, these individuals would/will not be able to assist during a real-life DR event.

Executing a DR plan quarterly or yearly may not be enough to prepare an organization for real-world events: they can come without notice and in many different flavors, like faulty deployments or configurations, hardware failures, data and state corruption, the inability to connect to a third-party provider, or natural disasters. Most may not require the execution of your DR plan but, instead, challenge observability, high-availability strategy, and incident-response processes.

Chaos Engineering real-world events

How can you prepare for unknown events? Chaos Engineering provides value to your organization by allowing it to get ahead of unexpected disruptions by continuously injecting controlled, real-world disruptions as a scheduled job, in your software development lifecycle, and/or continuous integration and continuous delivery (CI/CD) pipelines at the cloud-provider, infrastructure, workload-component, and process level.

Consider Chaos Engineering a resilience guardian: it gives the confidence, control, and rigor needed to ensure the experiment does not impact the customer, or quickly stop the experiment if it does. Using these mechanisms, your teams can learn from faults in a controlled environment and observe, measure, and improve the workloads’ resilience, plus validate the logs, metrics, and that alarms are in place to notify operators within a predetermined timeframe.

Finding and amending deficiencies

When incorporating Chaos Engineering into your day-to-day operations, workload deficiencies will surface and need to be addressed. Chaos Engineering experiments run in production that surface unexpected behavior will only minimally impact customers, if at all, compared with real-world, unexpected disruptions. Controlled experiments are executed with a clear scope of impact. Experts are present to observe the experiment and automated rollback mechanisms executed. In the worst-case scenario, these experts will get hands-on and remediate the disruption on the spot.

If an experiment surfaces unknown behavior, there is a Correction of Error (COE) analysis. The COE is a process for improving quality by documenting and addressing issues, focusing on identifying and amending root causes.

Using the COE, we can explore the customer interaction with the workload and understand the customer impact. This can provide further insights on what happened during the event and give way to deep dives into the component that caused failure. If the fault is not identifiable, more observability should be added to the workload.

Additionally, incident-response mechanisms are reviewed to validate that a disruption was detected, key stakeholders are notified, and escalations processes begin in the predetermined timeframe. Prioritizing new findings and, based on impact, adding them to the issue back log, and addressing known risks are the keys to successful Chaos Engineering and mitigating future impact to the workload.

Chaos Engineering on AWS

To get started with Chaos Engineering on AWS, AWS Fault Injection Simulator (AWS FIS) was launched in early 2021. AWS FIS is a fully managed service used to run fault injection experiments that simulate real-world AWS faults. This service can be used as part of your CI/CD pipeline or otherwise outside the pipeline via cron jobs.

As demonstrated in Figure 2, AWS FIS can inject faults sequentially or simultaneously, introducing faults across different types of resources, Amazon Elastic Compute Cloud, Amazon Elastic Container Service, Amazon Elastic Kubernetes Service, and Amazon Relational Database Service. Some of these faults include:

  • Termination of resources
  • Forcing failovers
  • Stressing CPU or memory
  • Throttling
  • Latency
  • Packet loss

Since it is integrated with Amazon CloudWatch alarms, you can setup stop conditions as guardrails to rollback an experiment if it causes unexpected impact.

AWS Fault Injection Simulator integrates with AWS resources

Figure 2. AWS Fault Injection Simulator integrates with AWS resources

As Chaos Engineering should provide as much flexibility as possible when it comes to fault injection, AWS FIS integrates with external tools, such as Chaos Toolkit and Chaos Mesh, to expand the scope of failures that can be injected to your workload.

Conclusion

Chaos Engineering is not about breaking systems but rather creating resilient workloads that can survive real-world events with minimal-to-no customer impact, by finding the “known-unknowns” and/or “unknown-unknowns” that can cause such events. Additionally, these mechanisms help improve operational excellence and resilience through developer and observability best practices, allowing you to catch deficiencies before they escalate into large-scale events and therefore improve the customers experience.

If you’d like to know more, please join us at AWS re:Invent 2022, where we will present multiple sessions on Chaos Engineering. Also, explore Chaos Engineering Stories!

Chaos Testing with AWS Fault Injection Simulator and AWS CodePipeline

Post Syndicated from Matt Chastain original https://aws.amazon.com/blogs/architecture/chaos-testing-with-aws-fault-injection-simulator-and-aws-codepipeline/

The COVID-19 pandemic has proven to be the largest stress test of our technology infrastructures in generations. A meteoric increase in internet consumption followed, due in large part to working and schooling from home. The chaotic, early months of the pandemic have clearly demonstrated the value of resiliency in production. How can we better prepare our critical systems for these global events in the future? A more modern approach to testing and validating your application architecture is needed. Chaos engineering has emerged as an innovative approach to solving these types of challenges.

This blog shows an architecture pattern for automating chaos testing as part of your continuous integration/continuous delivery (CI/CD) process. By automating the implementation of chaos experiments inside CI/CD pipelines, complex risks and modeled failure scenarios can be tested against application environments with every deployment. Application teams can use the results of these experiments to prioritize improvements in their architecture. These results will give your team the confidence they need to operate in an unpredictable production environment.

AWS Fault Injection Simulator (FIS) is a managed service that enables you to perform fault injection experiments on your AWS workloads. Fault injection is based on the principles of chaos engineering. These experiments stress an application by creating disruptive events so that you can observe how your application responds. You can then use this information to improve the performance and resiliency of your applications. With AWS FIS, you set up and run experiments that help you create the real-world conditions needed to uncover application issues.

AWS CodePipeline is a fully managed continuous delivery service for fast and reliable application and infrastructure updates. You can use AWS CodePipeline to model and automate your software release processes. Automating your build, test, and release process allows you to quickly test each code change. You can ensure the quality of your application or infrastructure code by running each change through your staging and release process.

Continuous chaos testing

Figure 1. High-level architecture pattern for automating chaos engineering

Figure 1. High-level architecture pattern for automating chaos engineering

Create FIS experiments

Begin with creating an FIS experiment template by configuring one or more actions (action set) to run against the target resources of the application architecture. Here we have created an action to stop Amazon EC2 instances in our Amazon Elastic Container Service (ECS) cluster identified by a tag. Target resources can be identified by resource IDs, filters, or tags. We can also set up the action parameters for running the actions before or after the actions/duration. Additionally, you can set up Amazon CloudWatch alarms to stop running one or more fault experiments once a particular threshold or boundary has been reached. In Increase your e-commerce website reliability using chaos engineering and AWS Fault Injection Simulator, Bastien Leblanc shares how to set up CloudWatch metric thresholds as stop conditions for experiments.

Figure 2. AWS FIS experiment template

Figure 2. AWS FIS experiment template

Author AWS Lambda to initiate FIS experiments

Create/Add a FIS IAM role to the Lambda function in the configuration permissions section. To start a specific FIS experiment, we use the experimentTemplateId parameter in our Lambda code. Refer to the AWS FIS API Reference when writing your Lambda code. When integrating the Lambda function into your pipeline, a new AWS CodePipeline can be created or an existing one can be used. A new pipeline stage is added at the point we initiate our Lambda function (post deployment stage), which launches our FIS experiment.

Figure 3. AWS Lambda function initiating AWS FIS experiment

Figure 3. AWS Lambda function initiating AWS FIS experiment


Figure 4. AWS CodePipeline with AWS FIS experiment stage

Figure 4. AWS CodePipeline with AWS FIS experiment stage

The experimentTemplateId parameter can also be staged as a key/value ‘environment variable’ in your Lambda function configuration. This is useful as it allows you to change your FIS experiment template without having to adjust your function code. You can use the same Lambda function code by dynamically injecting the experimentTemplateId in multiple environments on your way to production.

Verify FIS experiment results on deployed application

By continuously performing fault injection post-deployment in AWS CodePipeline, you learn about complex failure conditions, which you must solve. User experience and availability testing on your application during the runtime of the FIS experiment can be started by a notification rule. In AWS CodePipeline, you can use an Amazon Simple Notification Service (SNS) topic or chatbot integration. CloudWatch Synthetics can be used for those looking to automate experience testing on the candidate application while other FIS experiments are running.

Figure 5. AWS CodePipeline notification rule setting

Figure 5. AWS CodePipeline notification rule setting

Summary

Using AWS CodePipeline to automate chaos engineering experiments on application architecture with AWS FIS is straightforward. Following are some benefits from automating fault injection testing in our CI/CD pipelines:

  • Our team can achieve a higher degree of confidence in meeting the resiliency requirements of our application. We use a more modern approach to testing and automating this experimentation inside our existing CI/CD process with AWS CodePipeline.
  • We know more about the unknown risks to our application. All testing results we receive provide benefit and learning opportunities for our team. We use these results to understand what we do well, where we need to improve, or what we are willing to tolerate based on our application requirements.
  • Continuously evaluating our architectural fitness inside CI/CD allows our team to validate the impact each feature or component iteration has on the resiliency of our application.

However, the sole value of automating chaos testing is not limited to finding, fixing, or documenting the risks that surface in our application. Additional confidence is gained through constantly validating your operational practices, such as alerts and alarms, monitoring, and notifications.

FIS gives you a controlled and repeatable way to reproduce necessary conditions to fine-tune your operational procedures and runbooks. Automating this testing inside a CI/CD pipeline ensures a nearly continuous feedback loop for these operational practices.

Chaos engineering on Amazon EKS using AWS Fault Injection Simulator

Post Syndicated from Omar Kahil original https://aws.amazon.com/blogs/devops/chaos-engineering-on-amazon-eks-using-aws-fault-injection-simulator/

In this post, we discuss how you can use AWS Fault Injection Simulator (AWS FIS), a fully managed fault injection service used for practicing chaos engineering. AWS FIS supports a range of AWS services, including Amazon Elastic Kubernetes Service (Amazon EKS), a managed service that helps you run Kubernetes on AWS without needing to install and operate your own Kubernetes control plane or worker nodes. In this post, we aim to show how you can simplify the process of setting up and running controlled fault injection experiments on Amazon EKS using pre-built templates as well as custom faults to find hidden weaknesses in your Amazon EKS workloads.

What is chaos engineering?

Chaos engineering is the process of stressing an application in testing or production environments by creating disruptive events, such as server outages or API throttling, observing how the system responds, and implementing improvements. Chaos engineering helps you create the real-world conditions needed to uncover the hidden issues and performance bottlenecks that are difficult to find in distributed systems. It starts with analyzing the steady-state behavior, building an experiment hypothesis (for example, stopping x number of instances will lead to x% more retries), running the experiment by injecting fault actions, monitoring rollback conditions, and addressing the weaknesses.

AWS FIS lets you easily run fault injection experiments that are used in chaos engineering, making it easier to improve an application’s performance, observability, and resiliency.

Solution overview

Figure 1: Solution Overview

Figure 1: Solution Overview

The following diagram illustrates our solution architecture.

In this post, we demonstrate two different fault experiments targeting an Amazon EKS cluster. This post doesn’t go into details about the creation process of an Amazon EKS cluster; for more information, see Getting started with Amazon EKS – eksctl and eksctl – The official CLI for Amazon EKS.

Prerequisites

Before getting started, make sure you have the following prerequisites:

We used the following configuration to create our cluster:

---
apiVersion: eksctl.io/v1alpha5
kind: ClusterConfig

metadata:
  name: aws-fis-eks
  region: eu-west-1
  version: "1.19"

iam:
  withOIDC: true

managedNodeGroups:
- name: nodegroup
  desiredCapacity: 3
  instanceType: t3.small
  ssh:
    enableSsm: true
  tags:
    Environment: Dev

Our cluster was created with the following features:

We have deployed a simple Nginx deployment with three replicas, each running on different instances for high availability.

In this post, we perform the following experiments:

  • Terminate node group instances In the first experiment, we will use the aws:eks:terminate-nodegroup-instance AWS FIS action that runs the Amazon EC2 API action TerminateInstances on the target node group. When the experiment starts, AWS FIS begins to terminate nodes, and we should be able to verify that our cluster replaces the terminated nodes with new ones as per our desired capacity configuration for the cluster.
  • Delete application pods In the second experiment, we show how you can use AWS FIS to run custom faults against the cluster. Although AWS FIS plans to expand on supported faults for Amazon EKS in the future, in this example we demonstrate how you can run a custom fault injection, running kubectl commands to delete a random pod for our Kubernetes deployment. Using a Kubernetes deployment is a good practice to define the desired state for the number of replicas you want to run for your application, and therefore ensures high availability in case one of the nodes or pods is stopped.

Experiment 1: Terminate node group instances

We start by creating an experiment to terminate Amazon EKS nodes.

  1. On the AWS FIS console, choose Create experiment template.
Figure 2: AWS FIS Console

Figure 2: AWS FIS Console

2. For Description, enter a description.

3. For IAM role, choose the IAM role you created.

Figure 3: Create experiment template

Figure 3: Create experiment template

   4. Choose Add action.

For our action, we want aws:eks:terminate-nodegroup-instances to terminate worker nodes in our cluster.

  5. For Name, enter TerminateWorkerNode.

  6. For Description, enter Terminate worker node.

  7. For Action type, choose aws:eks:terminate-nodegroup-instances.

  8. For Target, choose Nodegroups-Target-1.

  9. For instanceTerminationPercentage, enter 40 (the percentage of instances that are terminated per node group).

  10. Choose Save.

Figure 4: Select action type

Figure 4: Select action type

After you add the correct action, you can modify your target, which in this case is Amazon EKS node group instances.

11. Choose Edit target.

12. For Resource type, choose aws:eks:nodegroup.

13. For Target method, select Resource IDs.

14. For Resource IDs, enter your resource ID.

15. Choose Save.

With selection mode in AWS FIS, you can select your Amazon EKS cluster node group.

Figure 5: Specify target resource

Figure 5: Specify target resource

Finally, we add a stop condition. Even though this is optional, it’s highly recommended, because it makes sure we run experiments with the appropriate guardrails in place. The stop condition is a mechanism to stop an experiment if an Amazon CloudWatch alarm reaches a threshold that you define. If a stop condition is triggered during an experiment, AWS FIS stops the experiment, and the experiment enters the stopping state.

Because we have Container Insights configured for the cluster, we can monitor the number of nodes running in the cluster.

16. Through Container Insights, create a CloudWatch alarm to stop our experiment if the number of nodes is less than two.

17. Add the alarm as a stop condition.

18. Choose Create experiment template.

Figure 6: Create experiment template

Figure 6: Create experiment template

Figure 7: Check cluster nodes

Before we run our first experiment, let’s check our Amazon EKS cluster nodes. In our case, we have three nodes up and running.

19. On the AWS FIS console, navigate to the details page for the experiment we created.

20. On the Actions menu, choose Start.

Figure 8: Start experiment

Figure 8: Start experiment

Before we run our experiment, AWS FIS will ask you to confirm if you want to start the experiment. This is another example of safeguards to make sure you’re ready to run an experiment against your resources.

21. Enter start in the field.

22. Choose Start experiment.

Figure 9: Confirm to start experiment

Figure 9: Confirm to start experiment

After you start the experiment, you can see the experiment ID with its current state. You can also see the action the experiment is running.

Figure 10: Check experiment state

Figure 10: Check experiment state

Next, we can check the status of our cluster worker nodes. The process of adding a new node to the cluster takes a few minutes, but after a while we can see that Amazon EKS has launched new instances to replace the terminated ones.

The number of terminated instances should reflect the percentage that we provided as part of our action configuration. Because our experiment is complete, we can verify our hypothesis—our cluster eventually reached a steady state with a number of nodes equal to the desired capacity within a few minutes.

Figure 11: Check new worker node

Figure 11: Check new worker node

Experiment 2: Delete application pods

Now, let’s create a custom fault injection, targeting a specific containerized application (pod) running on our Amazon EKS cluster.

As a prerequisite for this experiment, you need to update your Amazon EKS cluster configmap, adding the IAM role that is attached to your worker nodes. The reason for adding this role to the configmap is because the experiment uses kubectl, the Kubernetes command-line tool that allows us to run commands against our Kubernetes cluster. For instructions, see Managing users or IAM roles for your cluster.

  1. On the Systems Manager console, choose Documents.
  2. On the Create document menu, choose Command or Session.
Figure 12: Create AWS Systems Manager Document

Figure 12: Create AWS Systems Manager Document

3. For Name, enter a name (for example, Delete-Pods).

4. In the Content section, enter the following code:

---
description: |
  ### Document name - Delete Pod

  ## What does this document do?
  Delete Pod in a specific namespace via kubectl

  ## Input Parameters
  * Cluster: (Required)
  * Namespace: (Required)
  * InstallDependencies: If set to True, Systems Manager installs the required dependencies on the target instances. (default True)

  ## Output Parameters
  None.

schemaVersion: '2.2'
parameters:
  Cluster:
    type: String
    description: '(Required) Specify the cluster name'
  Namespace:
    type: String
    description: '(Required) Specify the target Namespace'
  InstallDependencies:
    type: String
    description: 'If set to True, Systems Manager installs the required dependencies on the target instances (default: True)'
    default: 'True'
    allowedValues:
      - 'True'
      - 'False'
mainSteps:
  - action: aws:runShellScript
    name: InstallDependencies
    precondition:
      StringEquals:
        - platformType
        - Linux
    description: |
      ## Parameter: InstallDependencies
      If set to True, this step installs the required dependecy via operating system's repository.
    inputs:
      runCommand:
        - |
          #!/bin/bash
          if [[ "{{ InstallDependencies }}" == True ]] ; then
            if [[ "$( which kubectl 2>/dev/null )" ]] ; then echo Dependency is already installed. ; exit ; fi
            echo "Installing required dependencies"
            sudo mkdir -p $HOME/bin && cd $HOME/bin
            sudo curl -o kubectl https://amazon-eks.s3.us-west-2.amazonaws.com/1.20.4/2021-04-12/bin/linux/amd64/kubectl
            sudo chmod +x ./kubectl
            export PATH=$PATH:$HOME/bin
          fi
  - action: aws:runShellScript
    name: ExecuteKubectlDeletePod
    precondition:
      StringEquals:
        - platformType
        - Linux
    description: |
      ## Parameters: Namespace, Cluster, Namespace
      This step will terminate the random first pod based on namespace provided
    inputs:
      maxAttempts: 1
      runCommand:
        - |
          if [ -z "{{ Cluster }}" ] ; then echo Cluster not specified && exit; fi
          if [ -z "{{ Namespace }}" ] ; then echo Namespace not specified && exit; fi
          pgrep kubectl && echo Another kubectl command is already running, exiting... && exit
          EC2_REGION=$(curl -s http://169.254.169.254/latest/dynamic/instance-identity/document|grep region | awk -F\" '{print $4}')
          aws eks --region $EC2_REGION update-kubeconfig --name {{ Cluster }} --kubeconfig /home/ssm-user/.kube/config
          echo Running kubectl command...
          TARGET_POD=$(kubectl --kubeconfig /home/ssm-user/.kube/config get pods -n {{ Namespace }} -o jsonpath={.items[0].metadata.name})
          echo "TARGET_POD: $TARGET_POD"
          kubectl --kubeconfig /home/ssm-user/.kube/config delete pod $TARGET_POD -n {{ Namespace }} --grace-period=0 --force
          echo Finished kubectl delete pod command.

Figure 13: Add Document details

Figure 13: Add Document details

For this post, we create a Systems Manager command document that does the following:

  • Installs kubectl on the target Amazon EKS cluster instances
  • Uses two required parameters—the Amazon EKS cluster name and namespace where your application pods are running
  • Runs kubectl delete, deleting one of our application pods from a specific namespace

5. Choose Create document.

6. Create a new experiment template on the AWS FIS console.

7. For Name, enter DeletePod.

8. For Action type, choose aws:ssm:send-command.

This runs the Systems Manager API action SendCommand to our target EC2 instances.

After choosing this action, we need to provide the ARN for the document we created earlier, and provide the appropriate values for the cluster and namespace. In our example, we named the document Delete-Pods, our cluster name is aws-fis-eks, and our namespace is nginx.

9. For documentARN, enter arn:aws:ssm:<region>:<accountId>:document/Delete-Pods.

10. For documentParameters, enter {"Cluster":"aws-fis-eks", "Namespace":"nginx", "InstallDependencies":"True"}.

11. Choose Save.

Figure 14: Select Action type

Figure 14: Select Action type

12. For our targets, we can either target our resources by resource IDs or resource tags. For this example we target one of our node instances by resource ID.

Figure 15: Specify target resource

Figure 15: Specify target resource

13. After you create the template successfully, start the experiment.

When the experiment is complete, check your application pods. In our case, AWS FIS stopped one of our pod replicas and because we use a Kubernetes deployment, as we discussed before, a new pod replica was created.

Figure 16: Check Deployment pods

Figure 16: Check Deployment pods

Clean up

To avoid incurring future charges, follow the steps below to remove all resources that was created following along with this post.

  1. From the AWS FIS console, delete the following experiments, TerminateWorkerNodes & DeletePod.
  2. From the AWS EKS console, delete the test cluster created following this post, aws-fis-eks.
  3. From the AWS Identity and Access Management (IAM) console, delete the IAM role AWSFISRole.
  4. From the Amazon CloudWatch console, delete the CloudWatch alarm CheckEKSNodes.
  5. From the AWS Systems Manager console, delete the Owned by me document Delete-Pods.

Conclusion

In this post, we showed two ways you can run fault injection experiments on Amazon EKS using AWS FIS. First, we used a native action supported by AWS FIS to terminate instances from our Amazon EKS cluster. Then, we extended AWS FIS to inject custom faults on our containerized applications running on Amazon EKS.

For more information about AWS FIS, check out the AWS re:Invent 2020 session AWS Fault Injection Simulator: Fully managed chaos engineering service. If you want to know more about chaos engineering, check out the AWS re:Invent session Testing resiliency using chaos engineering and The Chaos Engineering Collection. Finally, check out the following GitHub repo for additional example experiments, and how you can work with AWS FIS using the AWS Cloud Development Kit (AWS CDK).


About the authors


Omar is a Professional Services consultant who helps customers adopt DevOps culture and best practices. He also works to simplify the adoption of AWS services by automating and implementing complex solutions.


Daniel Arenhage is a Solutions Architect at Amazon Web Services based in Gothenburg, Sweden.


Increase your e-commerce website reliability using chaos engineering and AWS Fault Injection Simulator  

Post Syndicated from Bastien Leblanc original https://aws.amazon.com/blogs/devops/increase-e-commerce-reliability-using-chaos-engineering-with-aws-fault-injection-simulator/

Customer experience is a key differentiator for retailers, and improving this experience comes through speed and reliability. An e-commerce website is one of the first applications customers use to interact with your brand.

For a long time, testing an application has been the only way to battle-test an application before going live. Testing is very effective at identifying issues in an application, through processes like unit testing, regression testing, and performance testing. But this isn’t enough when you deploy a complex system such as an e-commerce website. Planning for unplanned events, circumstances, new deployment dependencies, and more is rarely covered by testing. That’s where chaos engineering plays its part.

In this post, we discuss a basic implementation of chaos engineering for an e-commerce website using AWS Fault Injection Simulator.

Chaos engineering for retail

At AWS, we help you build applications following the Well-Architected Framework. Each pillar has a different importance for each customer, but the reliability pillar has consistently been valued as high priority by retailers for their e-commerce website.

One of the recommendations of this pillar is to run game days on your application.

A game day simulates a failure or event to test systems, processes, and team responses. The purpose is to perform the actions the team would perform as if an exceptional event happened. These should be conducted regularly so that your team builds muscle memory of how to respond. Your game days should cover the areas of operations, security, reliability, performance, and cost.

Chaos engineering is the practice of stressing an application in testing or production environments by creating disruptive events, such as a sudden increase in CPU or memory consumption, observing how the system responds, and implementing improvements. E-commerce websites have increased in complexity to the point that you need automated processes to detect the unknown unknowns.

Let’s see how retailers can run game days, applying chaos engineering principles using AWS FIS.

Typical e-commerce components for chaos engineering

If we consider a typical e-commerce architecture, whether you have a monolith deployment, a well-known e-commerce software, or a microservices approach, all e-commerce websites contain critical components. The first task is to identify which components should be tested using chaos engineering.

We advise you to consider specific criteria when choosing which components to prioritize for chaos engineering. From our experience, the first step is to look at your critical customer journey:

  • Homepage
  • Search
  • Recommendations and personalization
  • Basket and checkout

From these critical components, consider focusing on the following:

  • High and peak traffic: Some components have specific or unpredictable traffic, such as slots, promotions, and the homepage.
  • Proven components: Some components have been tested and don’t have any existing issues. If the component isn’t tested, chaos engineering isn’t the right tool. You should return to unit testing, QA, stress testing, and performance testing and fix the known issues, then chaos engineering can help identify the unknown unknowns.

The following are some real-world examples of relevant e-commerce services that are great chaos engineering candidates:

  • Authentication – This is customer-facing because it’s part of every critical customer journey buying process
  • Search – Used by most customers, search is often more important than catalog browsing
  • Products – This is a critical component that is customer-facing
  • Ads – Ads may not be critical, but have high or peak traffic
  • Recommendations – A website without recommendations should still be 100% functional (to be checked with hypothesis during experiments), but without personal recommendations, a customer journey is greatly impacted

Solution overview

Let’s go through an example with a simplified recommendations service for an e-commerce application. The application is built with microservices, which is a typical target for chaos experiments. In a microservices architecture, unknown issues are potentially more frequent because of the distributed nature of the development. The following diagram illustrates our simplified architecture.

Recommendations Service architecture: ECS, DynamoDB, Personalize, SSM, Elasticsearch

Recommendations Service Architecture


Following the principles of chaos engineering, we define the following for each scenario:

  • A steady state
  • One or multiple hypothesis
  • One or multiple experimentations to test these hypotheses

Defining a steady state is about knowing what “good” looks like for your application. In our recommendations example, steady state is measured as follows:

  • Customer latency at p90 between 0.3–0.5 seconds (end-to-end latency when asking for a recommendations)
  • A success rate of 100% at the 95 percentile

For the sake of simplification of this article, we use a simplified version of a steady state than what is done in a real environment. You could go deeper by checking latency, for example (such as if the answer is fast but wrong). You could also analyze the metrics with an anomaly detection band instead of fixed metrics.

We could test the following situations and what should occur as a result:

  • What if Amazon DynamoDB isn’t accessible from the recommendations engine? In this case, the recommendations engine should fall back to using Amazon Elasticsearch (Amazon ES) only.
  • What if Amazon Personalize is slow to answer (over 2 seconds)? Recommendations should be served from a cache or reply with empty responses (which the front end should handle gracefully)
  • What if failures occur in Amazon Elastic Container Service (Amazon ECS), such as instances in the cluster failing or not being accessible? Scaling should kick in and continue serving customers.

Chaos experiments run the hypotheses and check the outcomes. Initially, we run the experiments individually to avoid any confusion, but going forward we can run these experiments regularly and concurrently (for example, what happens if you introduce failing tasks on Amazon ECS and DynamoDB).

Create an experiment

We measure observability and metrics through X-Ray and Amazon CloudWatch metrics. The service is fronted by a load balancer so we can use the native CloudWatch metrics for the customer-facing state. Based on our definitions, we include the metrics that matter for our customer, as summarized in the following table.

Metric Steady state CloudWatch Namespace Metric Name
Latency < 0.5 seconds AWS/X-Ray ResponseTime
Success Rate 100% at 95 percentile AWS/X-Ray OkRate

Now that we have ways to measure a steady state, we implement the hypothesis and experiments in AWS FIS. For this post, we test what happens if failures occur in Amazon ECS.

We use the action aws:ecs:drain-container-instances, which targets the cluster running the relevant task.

Let’s aim for 20% of instances that are impacted by the experiment. You should modify this percentage based on your environment, striking a balance between enough disturbance without failing the entire service.

1. On the AWS FIS console, choose Create experiment template to start creating your experiment.

FIS Home page -> create experiment template

Configure the experiment with an action aws:ecs:drain-container-instances

add action for experiment, drainage 30%, duration: 600sec

Setting up the experiment action using ECS drain instances

Configure the targeted ECS cluster(s) you want to include in your chaos experiment, we recommend to use tags to easily target a component without changing the experiment again.

set target as resource tag, key=chaos, value=true

Definition target for the chaos experiment

Before running an experiment, we have to define the stop conditions. It’s usually a combination of multiple CloudWatch alarms, which could be a manual stop (a specific alarm that can be set to the ALARM state to stop the experiment), but more importantly alarms on business metrics that you define as criteria for the applications to serve your customers. For an e-commerce website, this could be the following:

For this post, we focus on error rate.

2. Create a CloudWatch alarm for error rate on the service.

CW graphs : X-ray responsetime to p50 and a second one on p90

Clouwatch alarm conditions : static, greater than 0.5

3. Configure this alarm in AWS FIS as a stop condition.

FIS Stop conditions = RecommendationResponseTime

Run the experiment

We’re now ready to run the experiment. Let’s generate some load on the e-commerce website and see how it copes before and after the experiment. For the purpose of this post, we assume we’re running in a performance or QA environment without actual customers, so the load generated should be representative of the typical load on the application.

In our example, we ingest the load using the open-source tool vegeta. Some general load is generated using a command similar to the following:

echo "GET http://xxxxx.elb.amazonaws.com/recommendations?userID=aaa&amp;currentItemID=&amp;numResults=12&amp;feature=home_product_recs&amp;fullyQualifyImageUrls=1" | vegeta attack -rate=5 -duration 0 &gt; add-results.bin

We created a dedicated CloudWatch dashboard to monitor how the recommendations service is serving customer workload. The steady state looks like the following screenshot.

Dashboard - steady state

The p90 latency is under 0.5 seconds, p90 of success is greater than x% , the number of requests varies, but the response time is steady.

Now let’s start the experiment on AWS FIS console.

FIS - start the experiment

After a few minutes, let’s check how the recommendations service is running.

Dashboard - 1st experiment, Responsetime < SLA, CPU at 80%

The number of tasks running on the ECS cluster has decreased as expected, but the service has enough room to avoid any issue due to losing part of the ECS cluster. However, the average CPU usage starts to go over 80%, so we can suspect that we’re close to saturation.

AWS FIS helped us prove that even with some degradation in the ECS cluster, the service-level agreement was still met.

But what if we increase the impact of the disruption and confirm this CPU saturation assumption? Let’s run the same experiment with more instances drained from the ECS cluster and observe our metrics.

Dashboard - breached SLA on response time, 100% CPU

With less capacity available, the response time has largely exceeded the SLA, and we have reached the limit of the architecture. We would recommend to explore optimizing the architecture with concepts like auto scaling, or caching.

Going further

Now that we have a simple chaos experiment up and running, what are the next steps? One way of expanding on this is by increasing the number of hypotheses.

As a second hypothesis, we suggest adding network latency to the application. Network latency, especially for a distributed application, is a very interesting use case for chaos engineering. It’s not easy to test manually, and often applications are designed with a “perfect” network mindset. We use the action arn:aws:ssm:send-command/AWSFIS-Run-Network-Latency to target the instances running our application.

For more information about actions, see SSM Agent for AWS FIS actions.

However, having only technical metrics (such as latency and success code) lacks a customer-centric view. When running an e-commerce website, customer experience matters. Think about how your customers are using your website and how to measure the actual outcome for a customer.

Conclusion

In this post, we covered a basic implementation of chaos engineering for an e-commerce website using AWS FIS. For more information about chaos engineering, see Principles of Chaos Engineering.

Amazon Fault Injection Simulator is now generally available, you can use it to run chaos experiments today. Click here to learn more

To go beyond these first steps, you should consider increasing the number of experiments in your application, targeting crucial elements, starting with your development and environments and moving gradually to run experiments in production.


Author bio

Bastien Leblanc - Profile PhotoBastien Leblanc is the AWS Retail technical lead for EMEA. He works with retailers focusing on delivering exceptional end-user experience using AWS Services. With a strong background in data and analytics he helps retailers transform their business with cutting-edge AWS technologies.

Keeping Netflix Reliable Using Prioritized Load Shedding

Post Syndicated from Netflix Technology Blog original https://netflixtechblog.com/keeping-netflix-reliable-using-prioritized-load-shedding-6cc827b02f94

How viewers are able to watch their favorite show on Netflix while the infrastructure self-recovers from a system failure

By Manuel Correa, Arthur Gonigberg, and Daniel West

Getting stuck in traffic is one of the most frustrating experiences for drivers around the world. Everyone slows to a crawl, sometimes for a minor issue or sometimes for no reason at all. As engineers at Netflix, we are constantly reevaluating how to redesign traffic management. What if we knew the urgency of each traveler and could selectively route cars through, rather than making everyone wait?

In Netflix engineering, we’re driven by ensuring Netflix is there when you need it to be. Yet, as recent as last year, our systems were susceptible to metaphorical traffic jams; we had on/off circuit breakers, but no progressive way to shed load. Motivated by improving the lives of our members, we’ve introduced priority-based progressive load shedding.

The animation below shows the behavior of the Netflix viewer experience when the backend is throttling traffic based on priority. While the lower priority requests are throttled, the playback experience remains uninterrupted and the viewer is able to enjoy their title. Let’s dig into how we accomplished this.

Failure can occur due to a myriad of reasons: misbehaving clients that trigger a retry storm, an under-scaled service in the backend, a bad deployment, a network blip, or issues with the cloud provider. All such failures can put a system under unexpected load, and at some point in the past, every single one of these examples has prevented our members’ ability to play. With these incidents in mind, we set out to make Netflix more resilient with these goals:

  1. Consistently prioritize requests across device types (Mobile, Browser, and TV)
  2. Progressively throttle requests based on priority
  3. Validate assumptions by using Chaos Testing (deliberate fault injection) for requests of specific priorities

The resulting architecture that we envisioned with priority throttling and chaos testing included is captured below.

High level playback architecture with priority throttling and chaos testing

Building a request taxonomy

We decided to focus on three dimensions in order to categorize request traffic: throughput, functionality, and criticality. Based on these characteristics, traffic was classified into the following:

  • NON_CRITICAL: This traffic does not affect playback or members’ experience. Logs and background requests are examples of this type of traffic. These requests are usually high throughput which contributes to a large percentage of load in the system.
  • DEGRADED_EXPERIENCE: This traffic affects members’ experience, but not the ability to play. The traffic in this bucket is used for features like: stop and pause markers, language selection in the player, viewing history, and others.
  • CRITICAL: This traffic affects the ability to play. Members will see an error message when they hit play if the request fails.

Using attributes of the request, the API gateway service (Zuul) categorizes the requests into NON_CRITICAL, DEGRADED_EXPERIENCE and CRITICAL buckets, and computes a priority score between 1 to 100 for each request given its individual characteristics. The computation is done as a first step so that it is available for the rest of the request lifecycle.

Most of the time, the request workflow proceeds normally without taking the request priority into account. However, as with any service, sometimes we reach a point when either one of our backends is in trouble or Zuul itself is in trouble. When that happens requests with higher priority get preferential treatment. The higher priority requests will get served, while the lower priority ones will not. The implementation is analogous to a priority queue with a dynamic priority threshold. This allows Zuul to drop requests with a priority lower than the current threshold.

Finding the best place to throttle traffic

Zuul can apply load shedding in two moments during the request lifecycle: when it routes requests to a specific back-end service (service throttling) or at the time of initial request processing, which affects all back-end services (global throttling).

Service throttling

Zuul can sense when a back-end service is in trouble by monitoring the error rates and concurrent requests to that service. Those two metrics are approximate indicators of failures and latency. When the threshold percentage for one of these two metrics is crossed, we reduce load on the service by throttling traffic.

Global throttling

Another case is when Zuul itself is in trouble. As opposed to the scenario above, global throttling will affect all back-end services behind Zuul, rather than a single back-end service. The impact of this global throttling can cause much bigger problems for members. The key metrics used to trigger global throttling are CPU utilization, concurrent requests, and connection count. When any of the thresholds for those metrics are crossed, Zuul will aggressively throttle traffic to keep itself up and healthy while the system recovers. This functionality is critical: if Zuul goes down, no traffic can get through to our backend services, resulting in a total outage.

Introducing priority-based progressive load shedding

Once we had the prioritization piece in place, we were able to combine it with our load shedding mechanism to dramatically improve streaming reliability. When we’re in a bad situation (i.e. any of the thresholds above are exceeded), we progressively drop traffic, starting with the lowest priority. A cubic function is used to manage the level of throttling. If things get really, really bad the level will hit the sharp side of the curve, throttling everything.

The graph above is an example of how the cubic function is applied. As the overload percentage increases (i.e. the range between the throttling threshold and the max capacity), the priority threshold trails it very slowly: at 35%, it’s still in the mid-90s. If the system continues to degrade, we hit priority 50 at 80% exceeded and then eventually 10 at 95%, and so on.

Given that a relatively small amount of requests impact streaming availability, throttling low priority traffic may affect certain product features but will not prevent members pressing “play” and watching their favorite show. By adding progressive priority-based load shedding, Zuul can shed enough traffic to stabilize services without members noticing.

Handling retry storms

When Zuul decides to drop traffic, it sends a signal to devices to let them know that we need them to back off. It does this by indicating how many retries they can perform and what kind of time window they can perform them in. For example:

{ “maxRetries” : <max-retries>, “retryAfterSeconds”: <seconds> }

Using this backpressure mechanism, we can stop retry storms much faster than we could in the past. We automatically adjust these two dials based on the priority of the request. Requests with higher priority will retry more aggressively than lower ones, also increasing streaming availability.

Validating which requests are right for the job

To validate our request taxonomy assumptions on whether a specific request fell into the NON_CRITICAL, DEGRADED, or CRITICAL bucket, we needed a way to test the user’s experience when that request was shed. To accomplish this, we leveraged our internal failure injection tool (FIT) and created a failure injection point in Zuul that allowed us to shed any request based on a supplied priority. This enabled us to manually simulate a load shedded experience by blocking ranges of priorities for a specific device or member, giving us an idea of which requests could be safely shed without impacting the user.

Continually ensuring those requests are still right for the job

One of the goals here is to reduce members’ pain by shedding requests that are not expected to affect the user’s streaming experience. However, Netflix changes quickly and requests that were thought to be noncritical can unexpectedly become critical. In addition, Netflix has a wide variety of client devices, client versions, and ways to interact with the system. To make sure we weren’t causing members pain when throttling NON_CRITICAL requests in any of these scenarios, we leveraged our infrastructure experimentation platform ChAP.

This platform allows us to stage an A/B experiment that will allocate a small number of production users to either a control or treatment group for 45 minutes while throttling a range of priorities for the treatment group. This lets us capture a variety of live use cases and measure the impact to their playback experience. ChAP analyzes the members’ KPIs per device to determine if there is a deviation between the control and the treatment groups.

In our first experiment, we detected a race condition in both Android and iOS devices for a low priority request that caused sporadic playback errors. Since we practice continuous experimentation, once the initial experiments were run and the bugs were fixed, we scheduled them to run on a periodic basis. This allows us to detect regressions early and keep users streaming.

Experiment regression detection before and after fix (SPS indicates streaming availability)

Reaping the benefits

In 2019, before progressive load shedding was in place, the Netflix streaming services experienced an outage that resulted in a sizable percentage of members who were not able to play for a period of time. In 2020, days after the implementation was deployed, the team started seeing the benefit of the solution. Netflix experienced a similar issue with the same potential impact as the outage seen in 2019. Unlike then, Zuul’s progressive load shedding kicked in and started shedding traffic until the service was in a healthy state without impacting members’ ability to play at all.

The graph below shows a stable streaming availability metric stream per second (SPS) while Zuul is performing progressive load shedding based on request priority during the incident. The different colors in the graph represent requests with different priority being throttled.

Members were happily watching their favorite show on Netflix while the infrastructure was self-recovering from a system failure.

We are not done yet

For future work, the team is looking into expanding the use of request priority for other use cases like better retry policies between devices and back-ends, dynamically changing load shedding thresholds, tuning the request priorities using Chaos Testing as a guiding principle, and other areas that will make Netflix even more resilient.

If you’re interested in helping Netflix stay up in the face of shifting systems and unexpected failures, reach out to us. We’re hiring!


Keeping Netflix Reliable Using Prioritized Load Shedding was originally published in Netflix TechBlog on Medium, where people are continuing the conversation by highlighting and responding to this story.