Post Syndicated from Yiwen Zhang original https://aws.amazon.com/blogs/architecture/build-resilient-generative-ai-agents/
Generative AI agents in production environments demand resilience strategies that go beyond traditional software patterns. AI agents make autonomous decisions, consume substantial computational resources, and interact with external systems in unpredictable ways. These characteristics create failure modes that conventional resilience approaches might not address.
This post presents a framework for AI agent resilience risk analysis that applies to most AI developments and deployment architectures. We also explore practical strategies to help prevent, detect, and mitigate the most common resilience challenges when deploying and scaling AI agents.
Generative AI agent resilience risk dimensions
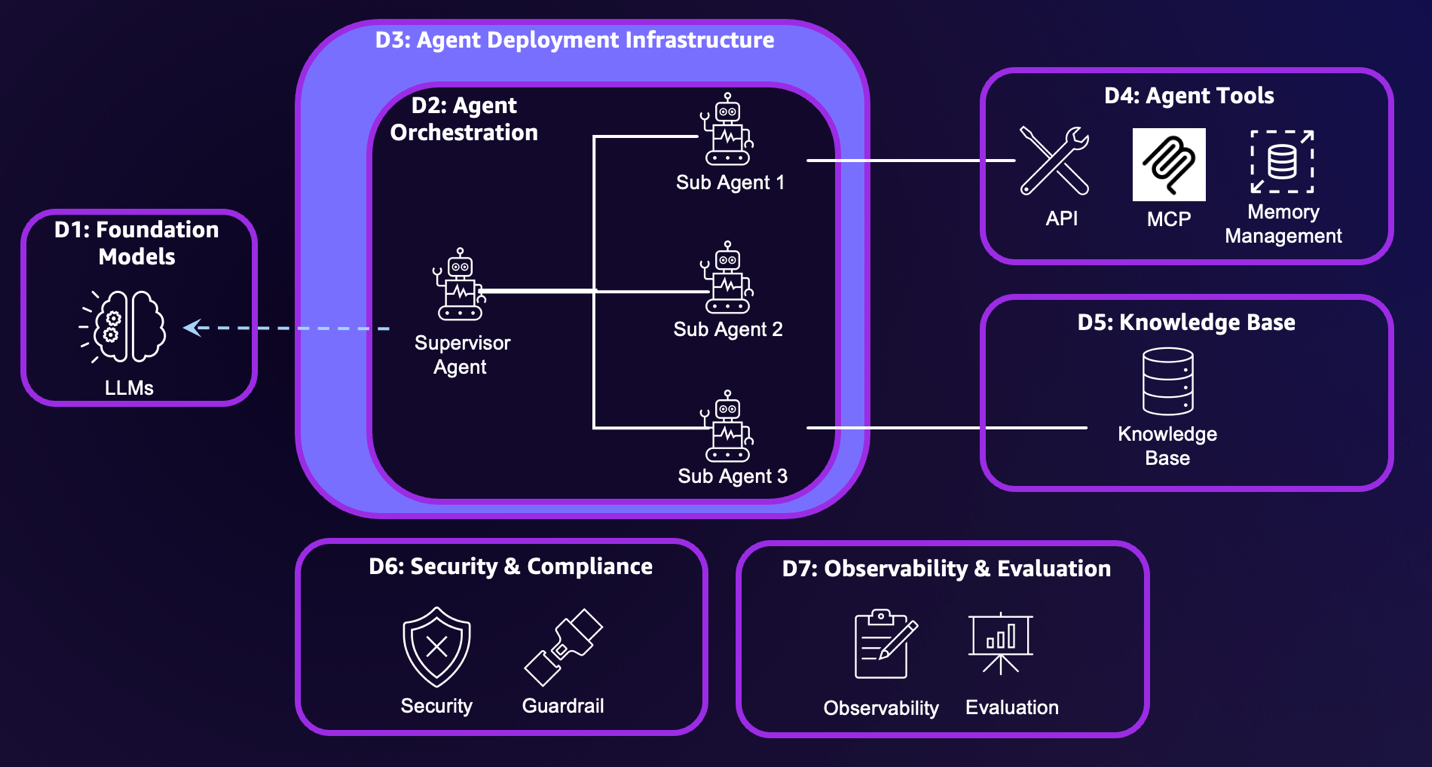
To identify resilience risks, we break down the generative AI agent systems into seven dimensions:
- Foundation models – Foundation models (FMs) provide core reasoning and planning capabilities. Your deployment choice determines your resilience responsibilities and costs. The three deployment approaches are fully self-managed such as using Amazon Elastic Compute Cloud (Amazon EC2), server-based managed services such as using Amazon SageMaker AI, or serverless managed services such as Amazon Bedrock.
- Agent orchestration – This component controls how multiple AI agents and tools coordinate to achieve complex goals, containing logic for tool selection, human escalation triggers, and multi-step workflow management.
- Agent deployment infrastructure – The infrastructure encompasses the underlying hardware and system where agents run. The infrastructure options include using fully self-managed EC2 instances, managed services such as Amazon Elastic Container Services (Amazon ECS), and specialized managed services designed specifically for agent deployment, such as Amazon Bedrock AgentCore Runtime.
- Knowledge base – The knowledge base includes vector database storage, embedding models, and data pipelines that create vector embeddings, forming the foundation for Retrieval Augmented Generation (RAG) applications. Amazon Bedrock Knowledge Bases supports fully managed RAG workflows.
- Agent tools – This includes API tools, Model Context Protocol (MCP) servers, memory management, and prompt caching features that extend agent capabilities.
- Security and compliance – This component encompasses user and agent security controls as well as content compliance monitoring, supporting proper authentication, authorization, and content validation. Security includes inbound authentication that manages users’ access to agents, and outbound authentication and authorization that manages agents’ access to other resources. Outbound authorization is more complex because agents might require their own identity. Amazon Bedrock AgentCore Identity is the identity and credential management service designed specifically for AI agents, providing inbound and outbound authentication and authorization capabilities. To help prevent compliance violations, organizations should establish comprehensive responsible AI policies. Amazon Bedrock Guardrails provides configurable safeguards for responsible AI policy implementation.
- Evaluation and observability – These systems track metrics from basic infrastructure statistics to detailed AI-specific traces, including ongoing performance evaluation and detection of behavioral deviations. Agent evaluation and observability requires a combination of traditional system metrics and agent-specific signals, such as reasoning traces and tool invocation results.
The following diagram illustrates these dimensions.
This configuration provides visibility into agent applications, enabling subsequent sessions to deliver targeted resilience analysis and mitigation recommendations.
Top 5 resilience problems for agents and mitigation plans
The Resilience Analysis Framework defines fundamental failure modes that production systems should avoid. In this post, we identify generative AI agents’ five primary failure modes and provide strategies that can help establish resilient properties.
Shared fate
Shared fate occurs when a failure in one agent component cascades across system boundaries, affecting the entire agent. Fault isolation is the desired property. To achieve fault isolation, you must understand how agent components interact and identify their shared dependencies.
The relationship between FMs, knowledge bases, and agent orchestration requires clear isolation boundaries. For example, in RAG applications, knowledge bases might return irrelevant search results. Implementing guardrails with relevance checks can help prevent these query errors from cascading through the rest of the agent workflow.
Tools should align with fault isolation boundaries to contain impact in case of failure. When building custom tools, design each tool as its own containment domain. When using MCP servers or existing tools, make sure you use strict, versioned request/response schemas and validate them at the boundary. Add semantic validations such as date ranges, cross-field rules, and data freshness checks. Internal tools can also be deployed across different AWS Availability Zones for additional resilience.
At the orchestration dimension, implement circuit breakers that monitor failure rates and latency, activating when dependencies become unavailable. Set bounded retry limits with exponential backoff and jitter to control cost and contention. For connectivity resilience, implement robust JSON-RPC error mapping and per-call timeouts, and maintain healthy connection pools to tools, MCP servers, and downstream services. The orchestration dimension should also manage contract-compatible fallbacks—routing from a failed tool or MCP server to alternatives—while maintaining consistent schemas and providing degraded functionality.
When isolation boundaries fail, you can implement graceful degradation that maintains core functionality while advanced features become unavailable. Conduct resilience testing with AI-specific failure injection, such as simulating model inference failures or knowledge base inconsistencies, to test your isolation boundaries before problems occur in production.
Insufficient capacity
Excessive load can overwhelm even well-provisioned systems, potentially leading to performance degradation or system failure. Sufficient capacity makes sure your systems have the resources needed to handle both expected traffic patterns and unexpected surges in demand.
AI agent capacity planning involves demand forecasting, resource assessment, and quota analysis. The primary consideration when planning capacity is estimating Requests Per Minute (RPM) and Tokens Per Minute (TPM). However, estimating RPM and TPM presents unique challenges due to the stochastic nature of agents. AI agents typically use recursive processing, where the agent’s reasoning engine repeatedly calls the FMs until reaching final answers. This creates two major planning difficulties. First, the number of iterative calls is hard to predict because it’s based on task complexity and reasoning paths. Second, each call’s token length is also hard to predict because it includes the user prompt, system instructions, agent-generated reasoning steps, and conversation history. This compounding effect makes capacity planning for agents difficult.
Through heuristic analysis during development, teams can set a reasonable recursion limit to help prevent redundant loops and runaway resource consumption. Additionally, because agent outputs become inputs for subsequent recursions, managing maximum completion tokens helps control one component of the growing token consumption in recursive reasoning chains.
The following equations help translate agent configurations to these capacity estimates:
Token per second (TPS) is different for each model, and can be found in model release documentation and open source benchmark results, such as artificial analysis.
This calculation is assuming no prompt caching feature is implemented.
Unlike external tools where resilience is managed by third-party providers, internally developed tools rely on proper configuration by the development team to scale based on demand. When resource needs spike unexpectedly, only the affected tools require scaling.
For example, AWS Lambda functions can be converted to MCP-compatible tools using Amazon Bedrock AgentCore Gateway. If popular tools cause Lambda functions to reach capacity limits, you can increase the account-level concurrent execution limit or implement provisioned concurrency to handle the increased load.
For scenarios involving multiple action groups executing simultaneously, Lambda functions’ reserved concurrency controls provide essential resource isolation by allocating dedicated capacity to each action group. This helps prevent a single tool from consuming all available resources during orchestrated invocations, facilitating resource availability for high-priority functions.
When capacity limits are reached, you can use intelligent request queuing with priority-based allocation to make sure essential services continue operating. Implementing graceful degradation during high-load periods can be helpful. This maintains core functionality while temporarily reducing non-essential features.
Excessive latency
Excessive latency compromises user experience, reduces throughput, and undermines the practical value of AI agents in production. Agentic workload development requires balancing speed, cost, and accuracy. Accuracy is the cornerstone for AI agents to gain user trust. Achieving high accuracy requires allowing agents to perform multiple reasoning iterations, which inevitably creates latency challenges.
Managing user expectations becomes critical—establishing service level objective (SLO) metrics before project initiation sets realistic targets for agent response times. Teams should define specific latency thresholds for different agent capabilities, such as subsecond responses for simple queries vs. longer windows for analytical tasks requiring multiple tool interactions or extensive reasoning chains. Clear communication of the expected response times helps prevent user frustration and allows for appropriate system design decisions.
Prompt engineering offers the greatest opportunity for latency improvement by reducing unnecessary reasoning loops. Vague prompts take agents into extensive deliberation cycles, whereas clear instructions accelerate decision-making. Asking an agent to “approve if the use case is of strategic value” creates a complex reasoning chain. The agent must first define strategic value criteria, then evaluate which criteria apply, and finally determine significance thresholds. Conversely, clearly stating the criteria in the system prompt can largely reduce agent iterations. The following examples illustrate the difference between ambiguous and clear instructions.
The following is an example of an ambiguous agent instruction:
The following is an example of a clear, well-defined agent instruction:
Prompt caching delivers substantial latency reductions by storing repeated prompt prefixes between requests. Amazon Bedrock prompt caching can reduce latency by up to 85% for supported models, particularly benefiting agents with long system prompts and contextual information that remains stable across sessions.
Asynchronous processing for agents and tools reduces latency by enabling parallel execution. Multi-agent workflows achieve dramatic speedups when independent agents execute in parallel rather than waiting for sequential completion. For agents with tools, asynchronous processing enables continued reasoning and preparation of subsequent actions while tools execute in the background, optimizing workflow by overlapping cognitive processing with I/O operations.
Security and compliance checks must minimize latency impact while maintaining protection across dimensions. Content moderation agents implement streaming compliance scanning that evaluates agent outputs during generation rather than waiting for complete responses, flagging potentially problematic content in real time while allowing safe content to flow through immediately.
Incorrect agent response
Correct output makes sure your AI agent performs reliably within its defined scope, delivering accurate and consistent responses that meet user expectations and business requirements. However, misconfiguration, software bugs, and model hallucinations can compromise output quality, leading to incorrect responses that undermine user trust.
To improve accuracy, use deterministic orchestration flows whenever possible. Letting agents rely on LLMs to improvise their way through tasks creates opportunities to deviation from your intended path. Instead, define explicit workflows that specify how agents should interact and sequence their operations. This structured approach reduces both inter-agent calling errors and tool-calling mistakes. Additionally, implementing input and output guardrails significantly enhances agent accuracy. Amazon Bedrock Guardrails can scan user input for compliance checks before model invocations, and provide output validation to detect hallucinations, harmful responses, sensitive information, and blocked topics.
When response quality issues occur, you can deploy human-in-the-loop validation for high-stakes decisions where accuracy is essential, and implement automatic retry mechanisms with refined prompts when initial responses don’t meet quality standards.
Single point of failure
Redundancy creates multiple paths to success by minimizing single points of failure that can cause system-wide impairments. Single points of failure undermine redundancy when multiple components depend on a single resource or service, creating vulnerabilities that bypass protective boundaries. Effective redundancy requires both redundant components and redundant pathways, making sure that if one component fails, alternative components can take over, and if one pathway becomes unavailable, traffic can flow through different routes.
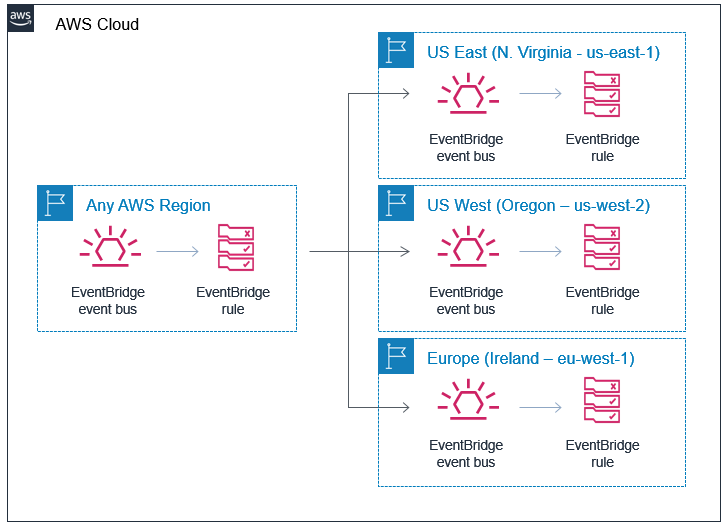
Agents require coordinated redundancy for their FMs. If the models are self-managed, you can implement multi-Region model deployment with automated failover. When using managed services, Amazon Bedrock offers cross-Region inference to provide built-in redundancy for supported models, automatically routing requests to alternative AWS Regions when primary endpoints experience issues.
The agent tools dimension must coordinate tool redundancy to facilitate graceful degradation when primary tools become unavailable. Rather than failing entirely, the system should automatically route to alternative tools that provide similar functionality, even if they’re less sophisticated. For example, when the internal chat assistant’s knowledge base fails, it can fall back to a search tool to deliver alternative output to users.
Maintaining permission consistency across redundant environments is essential. This helps prevent security gaps during failover scenarios. Because overly permissive access controls pose significant security risks, it’s critical to validate that both end-user permissions and tool-level access rights are identical between primary and failover components. This consistency makes sure security boundaries are maintained regardless of which environment is actively serving requests, helping prevent privilege escalation or unauthorized access that could occur when systems switch between different permission models during operational transitions.
Operational excellence: Integrating traditional and AI-specific practices
Operational excellence in agentic AI integrates proven DevOps practices with AI-specific requirements for running agentic systems reliably in production. Continuous integration and continuous delivery (CI/CD) pipelines orchestrate the full agent lifecycle, and infrastructure as code (IaC) standardizes deployments across environments, reducing manual error and improving reproducibility.
Agent observability requires a combination of traditional metrics and agent-specific signals such as reasoning traces and tool invocation results. Although traditional system metrics and logs can be obtained from Amazon CloudWatch, agent-level tracing requires additional software build. The recently announced Amazon Bedrock AgentCore Observability (preview) supports OpenTelemetry to integrate agent telemetry data with existing observability services, including CloudWatch, Datadog, LangSmith, and Langfuse. For more details the Amazon Bedrock AgentCore Observability features, see Launching Amazon CloudWatch generative AI observability (Preview).
Beyond monitoring, testing and validation of agents also extend beyond conventional software practices. Automated test suites such as promptfoo help development teams configure tests to evaluate reasoning quality, task completion, and dialogue coherence. Pre-deployment checks confirm tool connectivity and knowledge access, and fault injection simulates tool outages, API failures, and data inconsistencies to surface reasoning flaws before they affect users.
When issues arise, mitigation relies on playbooks covering both infrastructure-level and agent-specific issues. These playbooks support live sessions, enabling seamless handoffs to fallback agents or human operators without losing context.
Summary
In this post, we introduced a seven-dimension architecture model to map your AI agents and analyze where resilience risks emerge. We also identified five common failure modes related to AI agents, and their mitigation strategies.
These strategies illustrated how resilience principles apply to common agentic workloads, but they are not exhaustive. Each AI system has unique characteristics and dependencies. You must analyze your specific architecture across the seven risk dimensions to identify the resilience challenges within your own workloads, prioritizing areas based on user impact and business criticality rather than technical complexity.
Resilience represents an ongoing journey rather than a destination. As your AI agents evolve and handle new use cases, your resilience strategies must evolve accordingly. You can establish regular testing, monitoring, and improvement processes to make sure your AI systems remain resilient as they scale. For more information about generative AI agents and resilience on AWS, refer to the following resources:
- Chaos Engineering Scenarios for GenAI workloads
- Designing generative AI workloads for resilience
- Introducing Amazon Bedrock AgentCore: Securely deploy and operate AI agents at any scale (preview)
- Implement effective data authorization mechanisms to secure your data used in generative AI applications: Part 1 and Part 2


 Deepmala Agarwal works as an AWS Data Specialist Solutions Architect. She is passionate about helping customers build out scalable, distributed, and data-driven solutions on AWS. When not at work, Deepmala likes spending time with family, walking, listening to music, watching movies, and cooking!
 Ravi Kumar Singh is a Senior Product Manager Technical-ES (PMT) at Amazon Web Services, specialized in building petabyte-scale data infrastructure and analytics platforms. With a passion for building innovative tools, he helps customers unlock valuable insights from their structured and unstructured data. Ravi’s expertise lies in creating robust data foundations using open source technologies and advanced cloud computing that power advanced artificial intelligence and machine learning use cases. A recognized thought leader in the field, he advances the data and AI ecosystem through pioneering solutions and collaborative industry initiatives. As a strong advocate for customer-centric solutions, Ravi constantly seeks ways to simplify complex data challenges and enhance user experiences. Outside of work, Ravi is an avid technology enthusiast who enjoys exploring emerging trends in data science, cloud computing, and machine learning.
 Mandisa Nxumalo is a Cloud Engineer at Amazon Web Services (AWS) with over 5 years experience in topics related to cloud services (databases, automation, and others). Currently, specializing in Big data service Amazon EMR. She is passionate about engaging customers to effectively adopt and utilize data driven approaches to improve their big data workflows. Outside work, Mandisa enjoys hiking mountains, chasing waterfalls and travelling across countries.
 Kashif Khan is a Sr. Analytics Specialist Solutions Architect at AWS, specializing in big data services like Amazon EMR, AWS Lake Formation, AWS Glue, Amazon Athena, and Amazon DataZone. With over a decade of experience in the big data domain, he possesses extensive expertise in architecting scalable and robust solutions. His role involves providing architectural guidance and collaborating closely with customers to design tailored solutions using AWS analytics services to unlock the full potential of their data.
 Gaurav Sharma is a Specialist Solutions Architect (Analytics) at AWS, supporting US public sector customers on their cloud journey. Outside of work, Gaurav enjoys spending time with his family and reading books.


 Raghu Boppanna works as an Enterprise Architect at Vanguard’s Chief Technology Office. Raghu specializes in Data Analytics, Data Migration/Replication including CDC Pipelines, Disaster Recovery and Databases. He has earned several AWS Certifications including AWS Certified Security – Specialty & AWS Certified Data Analytics – Specialty.
 Parameswaran V Vaidyanathan is a Senior Cloud Resilience Architect with Amazon Web Services. He helps large enterprises achieve the business goals by architecting and building scalable and resilient solutions on the AWS Cloud.
 Mithil Prasad is a Principal Customer Solutions Manager with Amazon Web Services. In his role, Mithil works with Customers to drive cloud value realization, provide thought leadership to help businesses achieve speed, agility, and innovation.