Tag Archives: retail

Case of success: phygital environment monitoring with Zabbix

Post Syndicated from Aurea Araujo original https://blog.zabbix.com/case-of-success-phygital-environment-monitoring-with-zabbix/27108/

When retail needs involve monitoring diverse and complex environments, with digital and physical operations, the tool chosen to meet those needs must be versatile, scalable and capable of collecting and analyzing data to generate insights for managers and support decision-making.

With this in mind, Unirede – a Zabbix Premium Partner – developed a use case consisting of monitoring a client in the retail segment, using Zabbix as the main tool for data collection, consolidation and event management.

The result: a reduction of up to 70% in operational costs and other benefits related to data-based decision-making, following the data driven concept and automation at the technological environment level for rapid responses to incidents.

Continue reading to understand, in detail, how monitoring can support retail needs, based on this case of success.

Retail needs

Currently, stores and brands that offer an omnichannel experience are standing out in the market. This means that they are available 24 hours a day, 7 days a week, not only in physical spaces (such as the stores themselves), but also digitally (through e-commerce and mobile app operations). These retailers also have critical operations in distribution centers that operate without interruption.

As a result, the environment to be monitored becomes what we call phygital – both physical and digital, at the same time. This is a concept the origins of which are closely linked to the Internet and global digitalization.

With this, customers can choose to buy from home, on their cell phone, wherever they are. However, if necessary, they can find the support they need in physical stores, with the same rules and prices across all channels.

Therefore, retailers need to ensure that the operation is able to deliver, full-time, a consistent customer experience on any channel, mitigating or preventing unavailability and loss of service performance. Additionally, they need to provide support to requests for help that may arise from managers who are responsible for the company’s results.

And this is not limited to just one type of retail. Segments such as supermarkets, fast fashion, specialists, fast food and pharmaceutical, among others, can benefit from data monitoring to improve the work carried out in activities such as:

  • Understanding the purchasing journey of omnibuyer customers (on-line/off-line):
  • Complete monitoring of user experience;
  • Maximizing the operation of distribution centers;
  • Monitoring points of sale (POS);
  • Developing technical and executive dashboardswith the main KPIs of the business;
  • Reports with information for making decisions in real time.

So, through monitoring with Zabbix, it is possible to collect data from different points, organize these data as information in visual dashboards and generate knowledge to improve internal and external customer service from end to end.

How monitoring with Zabbix works

We talk about the benefits and needs regarding retailers, but we also need to explain how monitoring with Zabbix works in this type of environment.

Beginning with the basics: Zabbix collects, categorizes, analyzes and generates information from data.

This process divided into 4 stages:

  • Data collection;
  • Problem detection;
  • Visualization;
  • Reaction.
Zabbix activity cycle

In the first stage, Zabbix captures data from different sources, which can be cloud systems, containers, networks, servers, databases, APIs, stocks, payment methods, applications, services and the Internet of Things. At this stage, there is a lot of flexibility in the tool itself, and it is also possible to create completely customized collection methods.

The data are encrypted, as Zabbix follows the premise of Security by Design, and they are analyzed in a processing stage to detect possible problems or behaviors that the business wants to be detected.

At this stage, data processing categorizes information into events by severity, indicates the root cause of the potential problem or anomaly, correlates these events based on predefinitions established by system administrators or business managers, begins self-remediation of this problem, and creates predictions based on metrics behaviors so that the business is ready and prepared to deal with events that have not yet occurred.

Afterwards, the information generated is allocated to dashboards for better visualization and, consequently, administrators choose how to react to what is shown.

Reactions can take the form of alerts via message, e-mail and applications, by generating tickets to the support team, by establishing a connection to other applications and systems, and by automating problem solving – or self-healing.

Main on-line and off-line retail indicators

By monitoring systems and the main resources of the retail environment, in addition to ensuring better availability and performance, it is possible to extract critical indicators for your business in real time.

There are indicators that are found both in physical and digital retail operations. With Zabbix, it is possible to collect and measure each one of these indicators, such as:

  • Gross sales;
  • Average ticket;
  • Sales by product category;
  • Sales by payment method;
  • Number of sales;
  • Accumulated sales in a given period;
  • Inventory value;
  • Sales by M2;
  • Sales by collaborator;
  • Year-over-Year Sales (YoY);
  • Goals achieved;
  • Conversion rate (from visitor to customer);
  • Traffic origin channels;
  • Time spent in e-commerce;
  • New visitors vs. returning visitors;
  • Cart abandonment.

By analyzing the elements mentioned above, also through monitoring, it is possible to understand how the performance of on-line sales is compared to off-line sales, helping business owners to make a decision on which of the means – or all of them – should receive more or less investments to generate more revenue.

We mentioned automating manual processes not long ago.

In retail, this can happen with the discovery of events and the indication of root causes, such as identifying the unavailability of a service or component that impacts the proper operation of a given system and, based on rules defined in Zabbix, triggering a self-recovery command, without human intervention, as in the following example:

Example of self-healing with Zabbix, used by Unirede.

What are the benefits of monitoring for retailers?

How can monitoring become essential for the digital transformation of retailers?

In order to do this, we need to understand the benefits of collecting and analyzing data with Zabbix.

The first and most objective one is the monitoring of support services, both in physical and digital operations. Here, we are talking about networks, connections, and IT infrastructure in general.

But there is also monitoring distribution centers in order to optimize supply chains, and capturing data from stores, points of sale, data centers and clouds.

With this duly adjusted, we move on to how the monitoring and sustainment of basic services helps retailers to have a better view of environments, analyzing performance indicators in real time and managing SLAs.

The result of a monitoring system with Zabbix in retail is having operations focused on customer experience, ensuring cost reductions and gains in operational efficiency.

Lessons learned from retailer monitoring

With so many possibilities and advantages resulting from using Zabbix in retail, it is difficult to choose where to start.

We need to bear in mind that, when implementing Zabbix in this area, it is important to focus on what is essential, that is, monitoring only what is necessary, instead of monitoring data that will not result in any type of action or analysis in case of an event. Avoid standard templates without the necessary adjustments to meet the specificities of your environment and the analysis practices your business requires..

Automating as much as possible is also a crucial practice, as it allows the team to dedicate more time to strategic activities in the area, thus spending less time dealing with incidents and adding new hosts.

And, of course, even if it is possible to have an integration with other tools, it is worth carrying out a thorough review of existing monitoring efforts in other tools to avoid generating events that are irrelevant, that is, that do not require any type of action by the team. This approach ensures that integration is smooth and does not compromise the effectiveness of the system and operations by generating excessive or unnecessary events.

Last but not least: it is important to recognize the essential and crucial role of the people who use the tool. They not only operate Zabbix, but also play an active role in the development and continuous evolution of business monitoring efforts.

By giving these users a voice and promoting training sessions, your company can invest in more meaningful collaborations, contributing to the continuous adaptation of Zabbix to the specific needs of the retail segment.

About Unirede

Unirede is a technology company, with roots in the State of Rio Grande do Sul and headquartered in Porto Alegre. It was created in 1999 and is dedicated to provide its clients with effective consulting services to improve business performance. Its activities aim to increase productivity, minimize downtime and drive the integration of technological innovations through managed services.

With a philosophy centered on simplicity, Unirede focuses on human relationships, both internally and with clients. There is a conscious effort to not only provide services, but also to establish relationships, favoring the delivery of intelligent solutions that add value to clients.

Unirede has achieved a level of excellence and commitment to results that has resulted in the establishment of strategic partnerships with technology market leaders. It stands out as the first Zabbix Premium Partner in Latin America, since 2008, and was the first Zabbix Training Partner in the world, in 2012.

Find out more about the Official Zabbix Partner Program.

The post Case of success: phygital environment monitoring with Zabbix appeared first on Zabbix Blog.

AWS Clean Rooms ML helps customers and partners apply ML models without sharing raw data (preview)

Post Syndicated from Donnie Prakoso original https://aws.amazon.com/blogs/aws/aws-clean-rooms-ml-helps-customers-and-partners-apply-ml-models-without-sharing-raw-data-preview/

Today, we’re introducing AWS Clean Rooms ML (preview), a new capability of AWS Clean Rooms that helps you and your partners apply machine learning (ML) models on your collective data without copying or sharing raw data with each other. With this new capability, you can generate predictive insights using ML models while continuing to protect your sensitive data.

During this preview, AWS Clean Rooms ML introduces its first model specialized to help companies create lookalike segments for marketing use cases. With AWS Clean Rooms ML lookalike, you can train your own custom model, and you can invite partners to bring a small sample of their records to collaborate and generate an expanded set of similar records while protecting everyone’s underlying data.

In the coming months, AWS Clean Rooms ML will release a healthcare model. This will be the first of many models that AWS Clean Rooms ML will support next year.

AWS Clean Rooms ML helps you to unlock various opportunities for you to generate insights. For example:

  • Airlines can take signals about loyal customers, collaborate with online booking services, and offer promotions to users with similar characteristics.
  • Auto lenders and car insurers can identify prospective auto insurance customers who share characteristics with a set of existing lease owners.
  • Brands and publishers can model lookalike segments of in-market customers and deliver highly relevant advertising experiences.
  • Research institutions and hospital networks can find candidates similar to existing clinical trial participants to accelerate clinical studies (coming soon).

AWS Clean Rooms ML lookalike modeling helps you apply an AWS managed, ready-to-use model that is trained in each collaboration to generate lookalike datasets in a few clicks, saving months of development work to build, train, tune, and deploy your own model.

How to use AWS Clean Rooms ML to generate predictive insights
Today I will show you how to use lookalike modeling in AWS Clean Rooms ML and assume you have already set up a data collaboration with your partner. If you want to learn how to do that, check out the AWS Clean Rooms Now Generally Available — Collaborate with Your Partners without Sharing Raw Data post.

With your collective data in the AWS Clean Rooms collaboration, you can work with your partners to apply ML lookalike modeling to generate a lookalike segment. It works by taking a small sample of representative records from your data, creating a machine learning (ML) model, then applying the particular model to identify an expanded set of similar records from your business partner’s data.

The following screenshot shows the overall workflow for using AWS Clean Rooms ML.

By using AWS Clean Rooms ML, you don’t need to build complex and time-consuming ML models on your own. AWS Clean Rooms ML trains a custom, private ML model, which saves months of your time while still protecting your data.

Eliminating the need to share data
As ML models are natively built within the service, AWS Clean Rooms ML helps you protect your dataset and customer’s information because you don’t need to share your data to build your ML model.

You can specify the training dataset using the AWS Glue Data Catalog table, which contains user-item interactions.

Under Additional columns to train, you can define numerical and categorical data. This is useful if you need to add more features to your dataset, such as the number of seconds spent watching a video, the topic of an article, or the product category of an e-commerce item.

Applying custom-trained AWS-built models
Once you have defined your training dataset, you can now create a lookalike model. A lookalike model is a machine learning model used to find similar profiles in your partner’s dataset without either party having to share their underlying data with each other.

When creating a lookalike model, you need to specify the training dataset. From a single training dataset, you can create many lookalike models. You also have the flexibility to define the date window in your training dataset using Relative range or Absolute range. This is useful when you have data that is constantly updated within AWS Glue, such as articles read by users.

Easy-to-tune ML models
After you create a lookalike model, you need to configure it to use in AWS Clean Rooms collaboration. AWS Clean Rooms ML provides flexible controls that enable you and your partners to tune the results of the applied ML model to garner predictive insights.

On the Configure lookalike model page, you can choose which Lookalike model you want to use and define the Minimum matching seed size you need. This seed size defines the minimum number of profiles in your seed data that overlap with profiles in the training data.

You also have the flexibility to choose whether the partner in your collaboration receives metrics in Metrics to share with other members.

With your lookalike models properly configured, you can now make the ML models available for your partners by associating the configured lookalike model with a collaboration.

Creating lookalike segments
Once the lookalike models have been associated, your partners can now start generating insights by selecting Create lookalike segment and choosing the associated lookalike model for your collaboration.

Here on the Create lookalike segment page, your partners need to provide the Seed profiles. Examples of seed profiles include your top customers or all customers who purchased a specific product. The resulting lookalike segment will contain profiles from the training data that are most similar to the profiles from the seed.

Lastly, your partner will get the Relevance metrics as the result of the lookalike segment using the ML models. At this stage, you can use the Score to make a decision.

Export data and use programmatic API
You also have the option to export the lookalike segment data. Once it’s exported, the data is available in JSON format and you can process this output by integrating with AWS Clean Rooms API and your applications.

Join the preview
AWS Clean Rooms ML is now in preview and available via AWS Clean Rooms in US East (Ohio, N. Virginia), US West (Oregon), Asia Pacific (Seoul, Singapore, Sydney, Tokyo), and Europe (Frankfurt, Ireland, London). Support for additional models is in the works.

Learn how to apply machine learning with your partners without sharing underlying data on the AWS Clean Rooms ML page.

Happy collaborating!
— Donnie

Online Retail Hack

Post Syndicated from Bruce Schneier original https://www.schneier.com/blog/archives/2023/11/online-retail-hack.html

Selling miniature replicas to unsuspecting shoppers:

Online marketplaces sell tiny pink cowboy hats. They also sell miniature pencil sharpeners, palm-size kitchen utensils, scaled-down books and camping chairs so small they evoke the Stonehenge scene in “This Is Spinal Tap.” Many of the minuscule objects aren’t clearly advertised.

[…]

But there is no doubt some online sellers deliberately trick customers into buying smaller and often cheaper-to-produce items, Witcher said. Common tactics include displaying products against a white background rather than in room sets or on models, or photographing items with a perspective that makes them appear bigger than they really are. Dimensions can be hidden deep in the product description, or not included at all.

In those instances, the duped consumer “may say, well, it’s only $1, $2, maybe $3­—what’s the harm?” Witcher said. When the item arrives the shopper may be confused, amused or frustrated, but unlikely to complain or demand a refund.

“When you aggregate that to these companies who are selling hundreds of thousands, maybe millions of these items over time, that adds up to a nice chunk of change,” Witcher said. “It’s finding a loophole in how society works and making money off of it.”

Defrauding a lot of people out of a small amount each can be a very successful way of making money.

AWS Clean Rooms Now Generally Available — Collaborate with Your Partners without Sharing Raw Data

Post Syndicated from Donnie Prakoso original https://aws.amazon.com/blogs/aws/aws-clean-rooms-now-generally-available/

Companies across multiple industries, such as advertising and marketing, retail, consumer packaged goods (CPG), travel and hospitality, media and entertainment, and financial services, increasingly look to supplement their data with data from business partners, to build a complete view of their business.

Let’s take a marketing use case as an example. Brands, publishers, and their partners need to collaborate using datasets that are stored across many channels and applications to improve the relevance of their campaigns and better engage with consumers. At the same time, they also want to protect sensitive consumer information and eliminate the sharing of raw data. Data clean rooms can help solve this challenge by allowing multiple companies to analyze their collective data in a private environment.

However, it’s difficult to build data clean rooms. It requires complex privacy controls, specialized tools to protect each collaborator’s data, and months of development time customizing analytics tools. The effort and complexity grows when a new collaborator is added, or a different type of analysis is needed, as companies have to spend even more development time. Finally, companies prefer to limit data movement as much as possible, usually leading to less collaboration and missed opportunities to generate new business insights.

Introducing AWS Clean Rooms
Today, I’m excited to announce the general availability of AWS Clean Rooms which we first announced at AWS re:Invent 2022 and released the preview of in January 2023. AWS Clean Rooms is an analytics service of AWS Applications that helps companies and their partners more easily and securely analyze and collaborate on their collective datasets without sharing or copying each other’s data. AWS Clean Rooms enables customers to generate unique insights about advertising campaigns, investment decisions, clinical research, and more, while helping them protect data.

Now, with AWS Clean Rooms, companies are able to easily create a secure data clean room on the AWS Cloud in minutes and collaborate with their partners. They can use a broad set of built-in, privacy-enhancing controls for clean rooms. These controls allow companies to customize restrictions on the queries run by each clean room participant, including query controls, query output restrictions, and query logging. AWS Clean Rooms also includes advanced cryptographic computing tools that keep data encrypted—even as queries are processed—to help comply with stringent data handling policies.

Key Features of AWS Clean Rooms
Let me share with you the key features and how easy it is to collaborate with AWS Clean Rooms.

Create Your Own Clean Rooms
AWS Clean Rooms helps you to start a collaboration in minutes and then select the other companies you want to collaborate with. You can collaborate with any of your partners that agree to participate in your clean room collaboration. You can create a collaboration by following several steps.

After creating a collaboration in AWS Clean Rooms, you can select additional collaboration members who can contribute. Currently, AWS Clean Rooms supports up to five collaboration members, including you as the collaboration creator.

The next step is to define which collaboration member can perform a query in collaboration with the member abilities setting.

Then, collaboration members will get notifications in their accounts, see detailed info from a collaboration, and decide whether to join the collaboration by selecting Create membership in their AWS Clean Rooms dashboard.

Collaborate without Moving Data Outside AWS
AWS Clean Rooms works by analyzing Amazon S3 data in place. This eliminates the need for companies to copy and load their data into destinations outside their respective AWS environments of the collaboration members or using third-party services.

Each collaboration member can create configured tables, an AWS Clean Rooms resource that contains reference to the AWS Glue catalog with underlying data that define how that data can be used. The configured table can be used across many collaborations.

Protecting Data
AWS Clean Rooms provides you with a broad set of privacy-enhancing controls to protect your customers’ and partners’ data. Each collaboration member has the flexibility to determine what columns can be accessed in a collaboration.

In addition to column-level privacy controls, as in the example above, AWS Clean Rooms also provides fine-grained query controls called analysis rules. With built-in and flexible analysis rules, customers can tailor queries to specific business needs. AWS Clean Rooms provides two types of analysis rules for customers to use:

  • Aggregation analysis rules allows queries that aggregate analysis without revealing user-level information using COUNT, SUM, and AVG functions along optional dimensions.
  • List analysis rules allow queries that output user-level attribute analysis of the overlap between the customer’s table and the tables of the member who can query.

Both analysis rule types allow data owners to require a join between their datasets and the datasets of the collaborator running the query. This limits the results to just their intersection of the collaborators datasets.

After defining the analysis rules, the member who can query and receive results can start writing queries according to the restrictions defined by each participating collaboration member. The following is an example query in the collaboration.

Analysis rules allow collaboration members to restrict the types of queries that can be performed against their datasets and the usable output of the query results. The following screenshot is an example of a query that will not be successful because it does not satisfy the analysis rule since the hashed_email column cannot be used in SELECT queries.

Full Programmatic Access
Any functionality offered by AWS Clean Rooms can also be accessed via the API using AWS SDKs or AWS CLI. This makes it easier for you to integrate AWS Clean Rooms into your products or workflows. This programmatic access also unlocks the opportunity for you to host clean rooms for your customers with your own branding.

Query Logging
This feature allows collaboration members to review and audit the queries that use their datasets to make sure data is being used as intended. With query logging, collaboration members who have query control and other members whose data is part of the query, can receive logs if they enable query logging.

If this feature is enabled, query logs are written to Amazon CloudWatch Logs in each collaboration member’s account. You can access the summary of the log queries in the last 7 days from the collaboration dashboard.

Cryptographic Computing
With this feature, you have the option to perform client-side encryption for sensitive data with cryptographic computing. You can encrypt your dataset to add a protection layer, and the data will use a cryptographic computing protocol called private-set intersection to keep data encrypted even as the query runs.

To use the cryptographic computing feature, you need to download and use the Cryptographic Computing for Clean Rooms (C3R) encryption client to encrypt and decrypt your data. C3R keeps your data cryptographically protected while in use in AWS Clean Rooms. C3R supports a subset of SQL queries, including JOIN, SELECT, GROUP BY, COUNT, and other supported statements on cryptographically protected data.

The following image shows how you can enable cryptographic computing when creating a collaboration:

Customer Voices
During the preview period, we heard lots of feedback from our customers about AWS Clean Rooms. Here’s what our customers say:

Comscore is a measurement and analytics company that brings trust and transparency to media. Brian Pugh, Chief Information Officer at Comscore, said, “As advertisers and marketers adapt to deliver relevant campaigns leveraging their combined datasets while protecting consumer data, Comscore’s Media Metrix suite, powered by Unified Digital Measurement 2.0 and Campaign Ratings services, will continue to support critical measurement and planning needs with services like AWS Clean Rooms. AWS Clean Rooms will enable new methods of collaboration among media owners, brands, or agency customers through customized data access controls managed and set by each data owner without needing to share underlying data.”

DISH Media is a leading TV provider that offers over-the-top IPTV service. “At DISH Media, we empower brands and agencies to run their own analyses of prior campaigns to allow for flexibility, visibility, and ease in optimizing future campaigns to reach DISH Media’s 31 million consumers. With AWS Clean Rooms, we believe advertisers will benefit from the ease of use of these services with their analysis, including data access and security controls,” said Kemal Bokhari, Head of Data, Measurement, and Analytics at DISH Media.

Fox Corporation is a leading producer and distributor of ad-supported content through its sports, news, and entertainment brands. Lindsay Silver, Senior Vice President of Data and Commercial Technology at Fox Corporation, said, “It can be challenging for our advertising clients to figure out how to best leverage more data sources to optimize their media spend across their combined portfolio of entertainment, sports, and news brands which reach 200 million monthly viewers. We are excited to use AWS Clean Rooms to enable data collaborations easily and securely in the AWS Cloud that will help our advertising clients unlock new insights across every Fox brand and screen while protecting consumer data.”

Amazon Marketing Cloud (AMC) is a secure, privacy-safe clean room application from Amazon Ads that supports thousands of marketers with custom analytics and cross-channel analysis.

“Providing marketers with greater control over their own signals while being able to analyze them in conjunction with signals from Amazon Ads is crucial in today’s marketing landscape. By migrating AMC’s compute infrastructure to AWS Clean Rooms under the hood, marketers can use their own signals in AMC without storing or maintaining data outside of their AWS environment. This simplifies how marketers can manage their signals and enables AMC teams to focus on building new capabilities for brands,” said Paula Despins, Vice President of Ads Measurement at Amazon Ads.

Watch this video to learn more about AWS Clean Rooms:

Availability
AWS Clean Rooms is generally available in the following AWS Regions: US East (Ohio), US East (N. Virginia), US West (Oregon), Asia Pacific (Seoul), Asia Pacific (Singapore), Asia Pacific (Sydney), Asia Pacific (Tokyo), Europe (Frankfurt), Europe (Ireland), Europe (London), and Europe (Stockholm).

Pricing & Free Tier
AWS Clean Rooms measures compute capacity in Clean Rooms Processing Units (CRPUs). You only pay the compute capacity of queries that you run in CRPU-hours on a per-second basis (with a 60-second minimum charge). AWS Clean Rooms automatically scales up or down to meet your query workload demands and shuts down during periods of inactivity, saving you administration time and costs. AWS Clean Rooms free tier provides a tier of 9 CRPU-hours per month for the first 12 months per new customer.

AWS Clean Rooms helps companies and their partners more easily and securely analyze and collaborate on their collective datasets without sharing or copying each other’s data. Learn more about benefits, use cases, how to get started, and pricing details on the AWS Clean Rooms page.

Happy collaborating!

Donnie

Build a Virtual Waiting Room with Amazon DynamoDB and AWS Lambda at SeatGeek

Post Syndicated from Umesh Kalaspurkar original https://aws.amazon.com/blogs/architecture/build-a-virtual-waiting-room-with-amazon-dynamodb-and-aws-lambda-at-seatgeek/

As retail sales, products, and customers continue to expand online, we’ve seen a trend towards releasing products in limited quantities to larger audiences. Demand of these products can be high, due to limited production capacity, venue capacity limits, or product exclusivity. Providers can then experience spikes in transaction volume, especially when multiple event sales occur simultaneously. This increased traffic and load can negatively impact customer experience and infrastructure.

To enhance the customer experience when releasing tickets to high demand events, SeatGeek has introduced a prioritization and queueing mechanism based on event type, venue, and customer type. For example, Dallas Cowboys’ tickets could have a different priority depending on seat type, or whether it’s a suite or a general admission ticket.

SeatGeek previously used a third-party waiting room solution, but it presented a number of shortcomings:

  • Lack of configuration and customization capabilities
  • More manual process that resulted in limiting the number of concurrent events could be set up
  • Inability to capture custom insights and metrics (for example, how long was the customer waiting in the queue before they dropped?)

Resolving these issues is crucial to improve the customer experience and audience engagement. SeatGeek decided to build a custom solution on AWS, in order to create a more robust system and address these third-party issues.

Virtual Waiting Room overview

Our solution redirects overflow customers waiting to complete their purchase to a separate queue. Personalized content is presented to improve the waiting experience. Public services such as school or voting registration can use this solution for limited spots or time slot management.

Figure 1. User path through a Virtual Waiting Room

Figure 1. User path through a Virtual Waiting Room

During a sale event, all customers begin their purchase journey in the Virtual Waiting Room (see Figure 1). When the sale starts, they will be moved from the Virtual Waiting Room to the ticket selection page. This is referred to as the Protected Zone. Here is where the customer will complete their purchase. The Protected Zone is a group of customized pages that guide the user through the purchasing process.

When the virtual waiting room is enabled, it can operate in three modes: Waiting Room mode, Queueing mode, or a combination of the two.

In Waiting Room mode, any request made to an event ticketing page before the designated start time of sale is routed to a separate screen. This displays the on-sale information and other marketing materials. At the desired time, users are then routed to the event page at a predefined throughput rate. Figure 2 shows a screenshot of the Waiting Room mode:

Figure 2. Waiting Room mode

Figure 2. Waiting Room mode

In Queueing mode, the event can be configured to allow a preset number of concurrent users to access the Protected Zone. Those beyond that preconfigured number wait in a First-In-First-Out (FIFO) queue. Exempt users, such as the event coordinator, can bypass the queue for management and operational visibility.

Figure 3. Queueing mode flow

Figure 3. Queueing mode flow


Figure 4. Queueing mode

Figure 4. Queueing mode

In some cases, the two modes can work together sequentially. This can occur when the Waiting Room mode is used before a sale starts and the Queueing mode takes over to control flow.

Once the customers move to the front of the queue, they are next in line for the Protected Zone. A ticket selection page, shown in Figure 5, must be protected from an overflow of customers, which could result in overselling.

Figure 5. Ticket selection page

Figure 5. Ticket selection page

Virtual Waiting Room implementation

In the following diagram, you can see the AWS services and flow that SeatGeek implemented for the Virtual Waiting Room solution. When a SeatGeek customer requests a protected resource like a concert ticket, a gate keeper application scans to see if the resource has an active waiting room. It also confirms if the configuration rules are satisfied in order to grant the customer access. If the customer isn’t allowed access to the protected resource for whatever reason, then that customer is redirected to the Virtual Waiting Room.

Figure 6. Architecture overview

Figure 6. Architecture overview

SeatGeek built this initial iteration of the gate keeper service on Fastly’s Computer@Edge service to leverage its existing content delivery network (CDN) investment. However, similar functionality could be built using Amazon CloudFront and AWS Lambda@Edge.

The Bouncer, handling the user flow into either the protected zone or the waiting room, consists of 3 components – Amazon API Gateway, AWS Lambda, and a Token Service. The token service is at the heart of the Waiting Room’s core logic. Before a concert event sale goes live at SeatGeek, the number of access tokens generated is equivalent to the number of available tickets. The order of assigning access tokens to customers in the waiting room can be based on FIFO or customer status (VIP customers first). Tokens are allocated when the customer is admitted to the waiting room and expire when tickets are purchased or when the customer exits.

For data storage, SeatGeek uses Amazon DynamoDB to monitor protected resources, tokens, and queues. The key tables are:

  • Protected Zone table: This table contains metadata about available protected zones
  • Counters table: Monitors the number of access tokens issued per minute for a specific protected zone
  • User Connection table: Every time a customer connects to the Amazon API Gateway, a record is created in this table recording their visitor token and connection ID using AWS Lambda
  • Queue table: This is the main table where the visitor token to access token mapping is saved

For analytics, two types of metrics are captured to ensure operational integrity:

  • System metrics: These are built into the AWS runtime infrastructure, and are stored in Amazon CloudWatch. These metrics provide telemetry of each component of the solution: Lambda latency, DynamoDB throttle (read and write), API Gateway connections, and more.
  • Business metrics: These are used to understand previous user behavior to improve infrastructure provisioning and user experiences. SeatGeek uses an AWS Lambda function to capture metrics from data in a DynamoDB stream. It then forwards it to Amazon Timestream for time-based analytics processing. Metrics captured include queue length, waiting time per queue, number of users in the protected zone, and more.

For historical needs, long-lived data can be streamed to tiered data storage options such as Amazon Simple Storage Service (S3). They can then be used later for other purposes, such as auditing and data analysis.

Considerations and enhancements for the Virtual Waiting Room

  • Tokens: We recommend using first-party cookies and token confirmations to track the number of sessions. Use the same token at the same time to stop users from checking out multiple times and cutting in line.
  • DDoS protection: Token and first-party cookies usage must also comply with General Data Protection Regulation (GDPR) and California Consumer Privacy Act (CCPA) guidelines depending on the geographic region. This system is susceptible to DDoS attacks, XSS attacks, and others, like any web-based solution. But these threats can be mitigated by using AWS Shield, a DDoS protection service, and AWS WAF – Web Application Firewall. For more information on DDoS protection, read this security blog post.
  • Marketing: Opportunities to educate the customer about the venue or product(s) while they wait in the Virtual Waiting Room (for example, parking or food options).
  • Alerts: Customers can be alerted via SMS or voice when their turn is up by using Amazon Pinpoint as a marketing communication service.

Conclusion

We have shown how to set up a Virtual Waiting Room for your customers. This can be used to improve the customer experience while they wait to complete their registration or purchase through your website. The solution takes advantage of several AWS services like AWS Lambda, Amazon DynamoDB, and Amazon Timestream.

While this references a retail use case, the waiting room concept can be used whenever throttling access to a specific resource is required. It can be useful during an infrastructure or application outage. You can use it during a load spike, while more resources (EC2 instances) are being launched. To block access to an unreleased feature or product, temporarily place all users in the waiting room and let them in as needed per your own configuration.

Providing a friendly, streamlined, and responsive user experience, even during peak load times, is a valuable way to keep existing customers and gain new ones.

Be mindful that there are costs associated with running these services. To be cost-efficient, see the following pages for details: AWS Lambda, Amazon S3, Amazon DynamoDB, Amazon Timestream.

Increase your e-commerce website reliability using chaos engineering and AWS Fault Injection Simulator  

Post Syndicated from Bastien Leblanc original https://aws.amazon.com/blogs/devops/increase-e-commerce-reliability-using-chaos-engineering-with-aws-fault-injection-simulator/

Customer experience is a key differentiator for retailers, and improving this experience comes through speed and reliability. An e-commerce website is one of the first applications customers use to interact with your brand.

For a long time, testing an application has been the only way to battle-test an application before going live. Testing is very effective at identifying issues in an application, through processes like unit testing, regression testing, and performance testing. But this isn’t enough when you deploy a complex system such as an e-commerce website. Planning for unplanned events, circumstances, new deployment dependencies, and more is rarely covered by testing. That’s where chaos engineering plays its part.

In this post, we discuss a basic implementation of chaos engineering for an e-commerce website using AWS Fault Injection Simulator.

Chaos engineering for retail

At AWS, we help you build applications following the Well-Architected Framework. Each pillar has a different importance for each customer, but the reliability pillar has consistently been valued as high priority by retailers for their e-commerce website.

One of the recommendations of this pillar is to run game days on your application.

A game day simulates a failure or event to test systems, processes, and team responses. The purpose is to perform the actions the team would perform as if an exceptional event happened. These should be conducted regularly so that your team builds muscle memory of how to respond. Your game days should cover the areas of operations, security, reliability, performance, and cost.

Chaos engineering is the practice of stressing an application in testing or production environments by creating disruptive events, such as a sudden increase in CPU or memory consumption, observing how the system responds, and implementing improvements. E-commerce websites have increased in complexity to the point that you need automated processes to detect the unknown unknowns.

Let’s see how retailers can run game days, applying chaos engineering principles using AWS FIS.

Typical e-commerce components for chaos engineering

If we consider a typical e-commerce architecture, whether you have a monolith deployment, a well-known e-commerce software, or a microservices approach, all e-commerce websites contain critical components. The first task is to identify which components should be tested using chaos engineering.

We advise you to consider specific criteria when choosing which components to prioritize for chaos engineering. From our experience, the first step is to look at your critical customer journey:

  • Homepage
  • Search
  • Recommendations and personalization
  • Basket and checkout

From these critical components, consider focusing on the following:

  • High and peak traffic: Some components have specific or unpredictable traffic, such as slots, promotions, and the homepage.
  • Proven components: Some components have been tested and don’t have any existing issues. If the component isn’t tested, chaos engineering isn’t the right tool. You should return to unit testing, QA, stress testing, and performance testing and fix the known issues, then chaos engineering can help identify the unknown unknowns.

The following are some real-world examples of relevant e-commerce services that are great chaos engineering candidates:

  • Authentication – This is customer-facing because it’s part of every critical customer journey buying process
  • Search – Used by most customers, search is often more important than catalog browsing
  • Products – This is a critical component that is customer-facing
  • Ads – Ads may not be critical, but have high or peak traffic
  • Recommendations – A website without recommendations should still be 100% functional (to be checked with hypothesis during experiments), but without personal recommendations, a customer journey is greatly impacted

Solution overview

Let’s go through an example with a simplified recommendations service for an e-commerce application. The application is built with microservices, which is a typical target for chaos experiments. In a microservices architecture, unknown issues are potentially more frequent because of the distributed nature of the development. The following diagram illustrates our simplified architecture.

Recommendations Service architecture: ECS, DynamoDB, Personalize, SSM, Elasticsearch

Recommendations Service Architecture


Following the principles of chaos engineering, we define the following for each scenario:

  • A steady state
  • One or multiple hypothesis
  • One or multiple experimentations to test these hypotheses

Defining a steady state is about knowing what “good” looks like for your application. In our recommendations example, steady state is measured as follows:

  • Customer latency at p90 between 0.3–0.5 seconds (end-to-end latency when asking for a recommendations)
  • A success rate of 100% at the 95 percentile

For the sake of simplification of this article, we use a simplified version of a steady state than what is done in a real environment. You could go deeper by checking latency, for example (such as if the answer is fast but wrong). You could also analyze the metrics with an anomaly detection band instead of fixed metrics.

We could test the following situations and what should occur as a result:

  • What if Amazon DynamoDB isn’t accessible from the recommendations engine? In this case, the recommendations engine should fall back to using Amazon Elasticsearch (Amazon ES) only.
  • What if Amazon Personalize is slow to answer (over 2 seconds)? Recommendations should be served from a cache or reply with empty responses (which the front end should handle gracefully)
  • What if failures occur in Amazon Elastic Container Service (Amazon ECS), such as instances in the cluster failing or not being accessible? Scaling should kick in and continue serving customers.

Chaos experiments run the hypotheses and check the outcomes. Initially, we run the experiments individually to avoid any confusion, but going forward we can run these experiments regularly and concurrently (for example, what happens if you introduce failing tasks on Amazon ECS and DynamoDB).

Create an experiment

We measure observability and metrics through X-Ray and Amazon CloudWatch metrics. The service is fronted by a load balancer so we can use the native CloudWatch metrics for the customer-facing state. Based on our definitions, we include the metrics that matter for our customer, as summarized in the following table.

Metric Steady state CloudWatch Namespace Metric Name
Latency < 0.5 seconds AWS/X-Ray ResponseTime
Success Rate 100% at 95 percentile AWS/X-Ray OkRate

Now that we have ways to measure a steady state, we implement the hypothesis and experiments in AWS FIS. For this post, we test what happens if failures occur in Amazon ECS.

We use the action aws:ecs:drain-container-instances, which targets the cluster running the relevant task.

Let’s aim for 20% of instances that are impacted by the experiment. You should modify this percentage based on your environment, striking a balance between enough disturbance without failing the entire service.

1. On the AWS FIS console, choose Create experiment template to start creating your experiment.

FIS Home page -> create experiment template

Configure the experiment with an action aws:ecs:drain-container-instances

add action for experiment, drainage 30%, duration: 600sec

Setting up the experiment action using ECS drain instances

Configure the targeted ECS cluster(s) you want to include in your chaos experiment, we recommend to use tags to easily target a component without changing the experiment again.

set target as resource tag, key=chaos, value=true

Definition target for the chaos experiment

Before running an experiment, we have to define the stop conditions. It’s usually a combination of multiple CloudWatch alarms, which could be a manual stop (a specific alarm that can be set to the ALARM state to stop the experiment), but more importantly alarms on business metrics that you define as criteria for the applications to serve your customers. For an e-commerce website, this could be the following:

For this post, we focus on error rate.

2. Create a CloudWatch alarm for error rate on the service.

CW graphs : X-ray responsetime to p50 and a second one on p90

Clouwatch alarm conditions : static, greater than 0.5

3. Configure this alarm in AWS FIS as a stop condition.

FIS Stop conditions = RecommendationResponseTime

Run the experiment

We’re now ready to run the experiment. Let’s generate some load on the e-commerce website and see how it copes before and after the experiment. For the purpose of this post, we assume we’re running in a performance or QA environment without actual customers, so the load generated should be representative of the typical load on the application.

In our example, we ingest the load using the open-source tool vegeta. Some general load is generated using a command similar to the following:

echo "GET http://xxxxx.elb.amazonaws.com/recommendations?userID=aaa&amp;currentItemID=&amp;numResults=12&amp;feature=home_product_recs&amp;fullyQualifyImageUrls=1" | vegeta attack -rate=5 -duration 0 &gt; add-results.bin

We created a dedicated CloudWatch dashboard to monitor how the recommendations service is serving customer workload. The steady state looks like the following screenshot.

Dashboard - steady state

The p90 latency is under 0.5 seconds, p90 of success is greater than x% , the number of requests varies, but the response time is steady.

Now let’s start the experiment on AWS FIS console.

FIS - start the experiment

After a few minutes, let’s check how the recommendations service is running.

Dashboard - 1st experiment, Responsetime < SLA, CPU at 80%

The number of tasks running on the ECS cluster has decreased as expected, but the service has enough room to avoid any issue due to losing part of the ECS cluster. However, the average CPU usage starts to go over 80%, so we can suspect that we’re close to saturation.

AWS FIS helped us prove that even with some degradation in the ECS cluster, the service-level agreement was still met.

But what if we increase the impact of the disruption and confirm this CPU saturation assumption? Let’s run the same experiment with more instances drained from the ECS cluster and observe our metrics.

Dashboard - breached SLA on response time, 100% CPU

With less capacity available, the response time has largely exceeded the SLA, and we have reached the limit of the architecture. We would recommend to explore optimizing the architecture with concepts like auto scaling, or caching.

Going further

Now that we have a simple chaos experiment up and running, what are the next steps? One way of expanding on this is by increasing the number of hypotheses.

As a second hypothesis, we suggest adding network latency to the application. Network latency, especially for a distributed application, is a very interesting use case for chaos engineering. It’s not easy to test manually, and often applications are designed with a “perfect” network mindset. We use the action arn:aws:ssm:send-command/AWSFIS-Run-Network-Latency to target the instances running our application.

For more information about actions, see SSM Agent for AWS FIS actions.

However, having only technical metrics (such as latency and success code) lacks a customer-centric view. When running an e-commerce website, customer experience matters. Think about how your customers are using your website and how to measure the actual outcome for a customer.

Conclusion

In this post, we covered a basic implementation of chaos engineering for an e-commerce website using AWS FIS. For more information about chaos engineering, see Principles of Chaos Engineering.

Amazon Fault Injection Simulator is now generally available, you can use it to run chaos experiments today. Click here to learn more

To go beyond these first steps, you should consider increasing the number of experiments in your application, targeting crucial elements, starting with your development and environments and moving gradually to run experiments in production.


Author bio

Bastien Leblanc - Profile PhotoBastien Leblanc is the AWS Retail technical lead for EMEA. He works with retailers focusing on delivering exceptional end-user experience using AWS Services. With a strong background in data and analytics he helps retailers transform their business with cutting-edge AWS technologies.

Automate thousands of mainframe tests on AWS with the Micro Focus Enterprise Suite

Post Syndicated from Kevin Yung original https://aws.amazon.com/blogs/devops/automate-mainframe-tests-on-aws-with-micro-focus/

Micro Focus – AWS Advanced Technology Parnter, they are a global infrastructure software company with 40 years of experience in delivering and supporting enterprise software.

We have seen mainframe customers often encounter scalability constraints, and they can’t support their development and test workforce to the scale required to support business requirements. These constraints can lead to delays, reduce product or feature releases, and make them unable to respond to market requirements. Furthermore, limits in capacity and scale often affect the quality of changes deployed, and are linked to unplanned or unexpected downtime in products or services.

The conventional approach to address these constraints is to scale up, meaning to increase MIPS/MSU capacity of the mainframe hardware available for development and testing. The cost of this approach, however, is excessively high, and to ensure time to market, you may reject this approach at the expense of quality and functionality. If you’re wrestling with these challenges, this post is written specifically for you.

To accompany this post, we developed an AWS prescriptive guidance (APG) pattern for developer instances and CI/CD pipelines: Mainframe Modernization: DevOps on AWS with Micro Focus.

Overview of solution

In the APG, we introduce DevOps automation and AWS CI/CD architecture to support mainframe application development. Our solution enables you to embrace both Test Driven Development (TDD) and Behavior Driven Development (BDD). Mainframe developers and testers can automate the tests in CI/CD pipelines so they’re repeatable and scalable. To speed up automated mainframe application tests, the solution uses team pipelines to run functional and integration tests frequently, and uses systems test pipelines to run comprehensive regression tests on demand. For more information about the pipelines, see Mainframe Modernization: DevOps on AWS with Micro Focus.

In this post, we focus on how to automate and scale mainframe application tests in AWS. We show you how to use AWS services and Micro Focus products to automate mainframe application tests with best practices. The solution can scale your mainframe application CI/CD pipeline to run thousands of tests in AWS within minutes, and you only pay a fraction of your current on-premises cost.

The following diagram illustrates the solution architecture.

Mainframe DevOps On AWS Architecture Overview, on the left is the conventional mainframe development environment, on the left is the CI/CD pipelines for mainframe tests in AWS

Figure: Mainframe DevOps On AWS Architecture Overview


Best practices

Before we get into the details of the solution, let’s recap the following mainframe application testing best practices:

  • Create a “test first” culture by writing tests for mainframe application code changes
  • Automate preparing and running tests in the CI/CD pipelines
  • Provide fast and quality feedback to project management throughout the SDLC
  • Assess and increase test coverage
  • Scale your test’s capacity and speed in line with your project schedule and requirements

Automated smoke test

In this architecture, mainframe developers can automate running functional smoke tests for new changes. This testing phase typically “smokes out” regression of core and critical business functions. You can achieve these tests using tools such as py3270 with x3270 or Robot Framework Mainframe 3270 Library.

The following code shows a feature test written in Behave and test step using py3270:

# home_loan_calculator.feature
Feature: calculate home loan monthly repayment
  the bankdemo application provides a monthly home loan repayment caculator 
  User need to input into transaction of home loan amount, interest rate and how many years of the loan maturity.
  User will be provided an output of home loan monthly repayment amount

  Scenario Outline: As a customer I want to calculate my monthly home loan repayment via a transaction
      Given home loan amount is <amount>, interest rate is <interest rate> and maturity date is <maturity date in months> months 
       When the transaction is submitted to the home loan calculator
       Then it shall show the monthly repayment of <monthly repayment>

    Examples: Homeloan
      | amount  | interest rate | maturity date in months | monthly repayment |
      | 1000000 | 3.29          | 300                     | $4894.31          |


# home_loan_calculator_steps.py
import sys, os
from py3270 import Emulator
from behave import *

@given("home loan amount is {amount}, interest rate is {rate} and maturity date is {maturity_date} months")
def step_impl(context, amount, rate, maturity_date):
    context.home_loan_amount = amount
    context.interest_rate = rate
    context.maturity_date_in_months = maturity_date

@when("the transaction is submitted to the home loan calculator")
def step_impl(context):
    # Setup connection parameters
    tn3270_host = os.getenv('TN3270_HOST')
    tn3270_port = os.getenv('TN3270_PORT')
	# Setup TN3270 connection
    em = Emulator(visible=False, timeout=120)
    em.connect(tn3270_host + ':' + tn3270_port)
    em.wait_for_field()
	# Screen login
    em.fill_field(10, 44, 'b0001', 5)
    em.send_enter()
	# Input screen fields for home loan calculator
    em.wait_for_field()
    em.fill_field(8, 46, context.home_loan_amount, 7)
    em.fill_field(10, 46, context.interest_rate, 7)
    em.fill_field(12, 46, context.maturity_date_in_months, 7)
    em.send_enter()
    em.wait_for_field()    

    # collect monthly replayment output from screen
    context.monthly_repayment = em.string_get(14, 46, 9)
    em.terminate()

@then("it shall show the monthly repayment of {amount}")
def step_impl(context, amount):
    print("expected amount is " + amount.strip() + ", and the result from screen is " + context.monthly_repayment.strip())
assert amount.strip() == context.monthly_repayment.strip()

To run this functional test in Micro Focus Enterprise Test Server (ETS), we use AWS CodeBuild.

We first need to build an Enterprise Test Server Docker image and push it to an Amazon Elastic Container Registry (Amazon ECR) registry. For instructions, see Using Enterprise Test Server with Docker.

Next, we create a CodeBuild project and uses the Enterprise Test Server Docker image in its configuration.

The following is an example AWS CloudFormation code snippet of a CodeBuild project that uses Windows Container and Enterprise Test Server:

  BddTestBankDemoStage:
    Type: AWS::CodeBuild::Project
    Properties:
      Name: !Sub '${AWS::StackName}BddTestBankDemo'
      LogsConfig:
        CloudWatchLogs:
          Status: ENABLED
      Artifacts:
        Type: CODEPIPELINE
        EncryptionDisabled: true
      Environment:
        ComputeType: BUILD_GENERAL1_LARGE
        Image: !Sub "${EnterpriseTestServerDockerImage}:latest"
        ImagePullCredentialsType: SERVICE_ROLE
        Type: WINDOWS_SERVER_2019_CONTAINER
      ServiceRole: !Ref CodeBuildRole
      Source:
        Type: CODEPIPELINE
        BuildSpec: bdd-test-bankdemo-buildspec.yaml

In the CodeBuild project, we need to create a buildspec to orchestrate the commands for preparing the Micro Focus Enterprise Test Server CICS environment and issue the test command. In the buildspec, we define the location for CodeBuild to look for test reports and upload them into the CodeBuild report group. The following buildspec code uses custom scripts DeployES.ps1 and StartAndWait.ps1 to start your CICS region, and runs Python Behave BDD tests:

version: 0.2
phases:
  build:
    commands:
      - |
        # Run Command to start Enterprise Test Server
        CD C:\
        .\DeployES.ps1
        .\StartAndWait.ps1

        py -m pip install behave

        Write-Host "waiting for server to be ready ..."
        do {
          Write-Host "..."
          sleep 3  
        } until(Test-NetConnection 127.0.0.1 -Port 9270 | ? { $_.TcpTestSucceeded } )

        CD C:\tests\features
        MD C:\tests\reports
        $Env:Path += ";c:\wc3270"

        $address=(Get-NetIPAddress -AddressFamily Ipv4 | where { $_.IPAddress -Match "172\.*" })
        $Env:TN3270_HOST = $address.IPAddress
        $Env:TN3270_PORT = "9270"
        
        behave.exe --color --junit --junit-directory C:\tests\reports
reports:
  bankdemo-bdd-test-report:
    files: 
      - '**/*'
    base-directory: "C:\\tests\\reports"

In the smoke test, the team may run both unit tests and functional tests. Ideally, these tests are better to run in parallel to speed up the pipeline. In AWS CodePipeline, we can set up a stage to run multiple steps in parallel. In our example, the pipeline runs both BDD tests and Robot Framework (RPA) tests.

The following CloudFormation code snippet runs two different tests. You use the same RunOrder value to indicate the actions run in parallel.

#...
        - Name: Tests
          Actions:
            - Name: RunBDDTest
              ActionTypeId:
                Category: Build
                Owner: AWS
                Provider: CodeBuild
                Version: 1
              Configuration:
                ProjectName: !Ref BddTestBankDemoStage
                PrimarySource: Config
              InputArtifacts:
                - Name: DemoBin
                - Name: Config
              RunOrder: 1
            - Name: RunRbTest
              ActionTypeId:
                Category: Build
                Owner: AWS
                Provider: CodeBuild
                Version: 1
              Configuration:
                ProjectName : !Ref RpaTestBankDemoStage
                PrimarySource: Config
              InputArtifacts:
                - Name: DemoBin
                - Name: Config
              RunOrder: 1  
#...

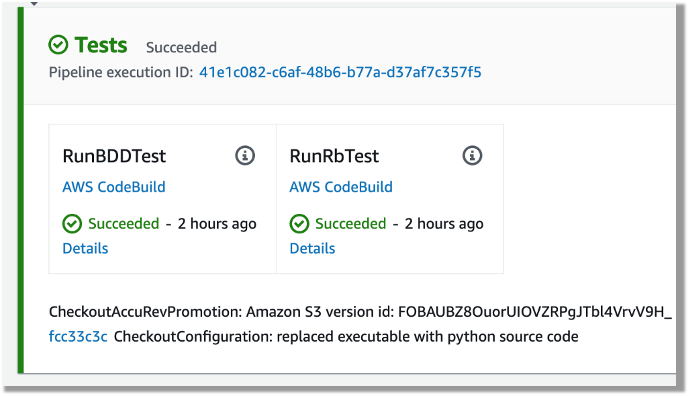
The following screenshot shows the example actions on the CodePipeline console that use the preceding code.

Screenshot of CodePipeine parallel execution tests using a same run order value

Figure – Screenshot of CodePipeine parallel execution tests

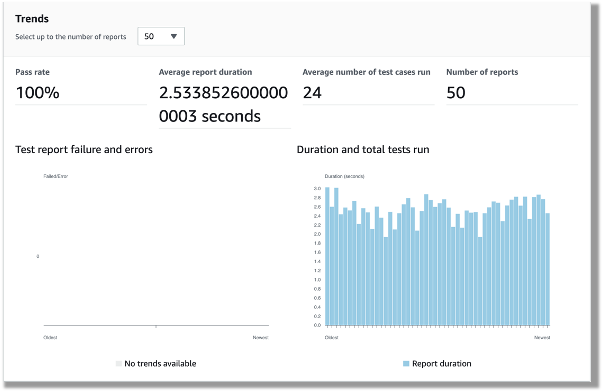
Both DBB and RPA tests produce jUnit format reports, which CodeBuild can ingest and show on the CodeBuild console. This is a great way for project management and business users to track the quality trend of an application. The following screenshot shows the CodeBuild report generated from the BDD tests.

CodeBuild report generated from the BDD tests showing 100% pass rate

Figure – CodeBuild report generated from the BDD tests

Automated regression tests

After you test the changes in the project team pipeline, you can automatically promote them to another stream with other team members’ changes for further testing. The scope of this testing stream is significantly more comprehensive, with a greater number and wider range of tests and higher volume of test data. The changes promoted to this stream by each team member are tested in this environment at the end of each day throughout the life of the project. This provides a high-quality delivery to production, with new code and changes to existing code tested together with hundreds or thousands of tests.

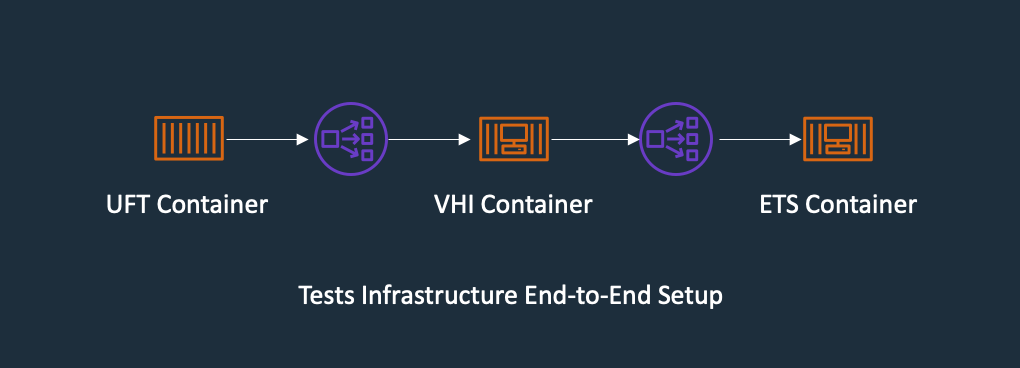
In enterprise architecture, it’s commonplace to see an application client consuming web services APIs exposed from a mainframe CICS application. One approach to do regression tests for mainframe applications is to use Micro Focus Verastream Host Integrator (VHI) to record and capture 3270 data stream processing and encapsulate these 3270 data streams as business functions, which in turn are packaged as web services. When these web services are available, they can be consumed by a test automation product, which in our environment is Micro Focus UFT One. This uses the Verastream server as the orchestration engine that translates the web service requests into 3270 data streams that integrate with the mainframe CICS application. The application is deployed in Micro Focus Enterprise Test Server.

The following diagram shows the end-to-end testing components.

Regression Test the end-to-end testing components using ECS Container for Exterprise Test Server, Verastream Host Integrator and UFT One Container, all integration points are using Elastic Network Load Balancer

Figure – Regression Test Infrastructure end-to-end Setup

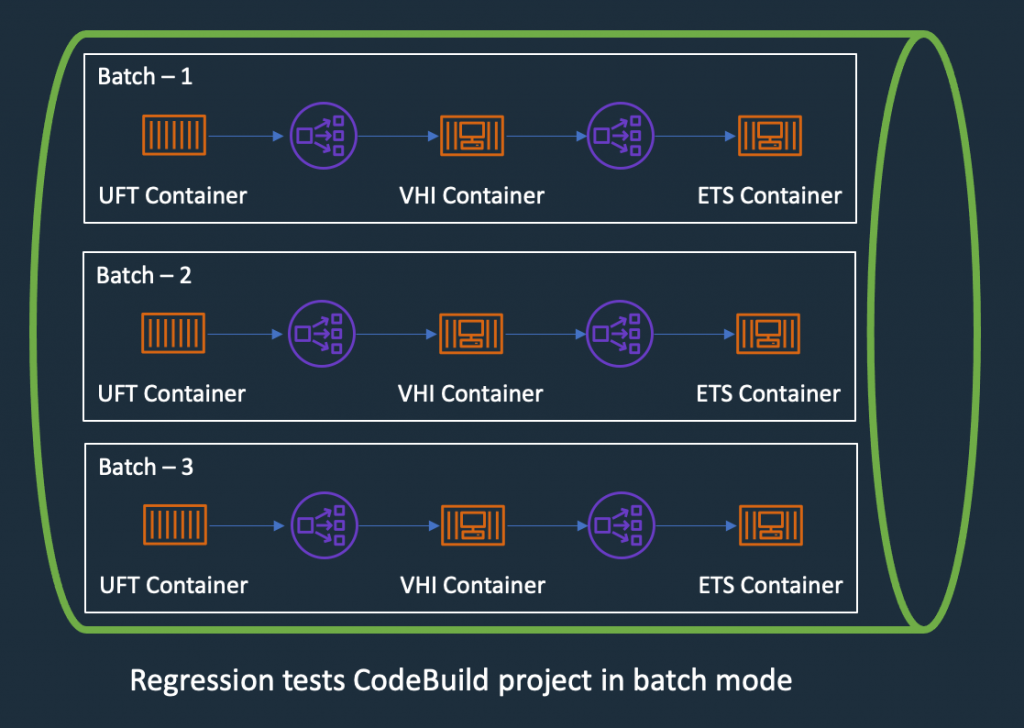
To ensure we have the coverage required for large mainframe applications, we sometimes need to run thousands of tests against very large production volumes of test data. We want the tests to run faster and complete as soon as possible so we reduce AWS costs—we only pay for the infrastructure when consuming resources for the life of the test environment when provisioning and running tests.

Therefore, the design of the test environment needs to scale out. The batch feature in CodeBuild allows you to run tests in batches and in parallel rather than serially. Furthermore, our solution needs to minimize interference between batches, a failure in one batch doesn’t affect another running in parallel. The following diagram depicts the high-level design, with each batch build running in its own independent infrastructure. Each infrastructure is launched as part of test preparation, and then torn down in the post-test phase.

Regression Tests in CodeBuoild Project setup to use batch mode, three batches running in independent infrastructure with containers

Figure – Regression Tests in CodeBuoild Project setup to use batch mode

Building and deploying regression test components

Following the design of the parallel regression test environment, let’s look at how we build each component and how they are deployed. The followings steps to build our regression tests use a working backward approach, starting from deployment in the Enterprise Test Server:

  1. Create a batch build in CodeBuild.
  2. Deploy to Enterprise Test Server.
  3. Deploy the VHI model.
  4. Deploy UFT One Tests.
  5. Integrate UFT One into CodeBuild and CodePipeline and test the application.

Creating a batch build in CodeBuild

We update two components to enable a batch build. First, in the CodePipeline CloudFormation resource, we set BatchEnabled to be true for the test stage. The UFT One test preparation stage uses the CloudFormation template to create the test infrastructure. The following code is an example of the AWS CloudFormation snippet with batch build enabled:

#...
        - Name: SystemsTest
          Actions:
            - Name: Uft-Tests
              ActionTypeId:
                Category: Build
                Owner: AWS
                Provider: CodeBuild
                Version: 1
              Configuration:
                ProjectName : !Ref UftTestBankDemoProject
                PrimarySource: Config
                BatchEnabled: true
                CombineArtifacts: true
              InputArtifacts:
                - Name: Config
                - Name: DemoSrc
              OutputArtifacts:
                - Name: TestReport                
              RunOrder: 1
#...

Second, in the buildspec configuration of the test stage, we provide a build matrix setting. We use the custom environment variable TEST_BATCH_NUMBER to indicate which set of tests runs in each batch. See the following code:

version: 0.2
batch:
  fast-fail: true
  build-matrix:
    static:
      ignore-failure: false
    dynamic:
      env:
        variables:
          TEST_BATCH_NUMBER:
            - 1
            - 2
            - 3 
phases:
  pre_build:
commands:
#...

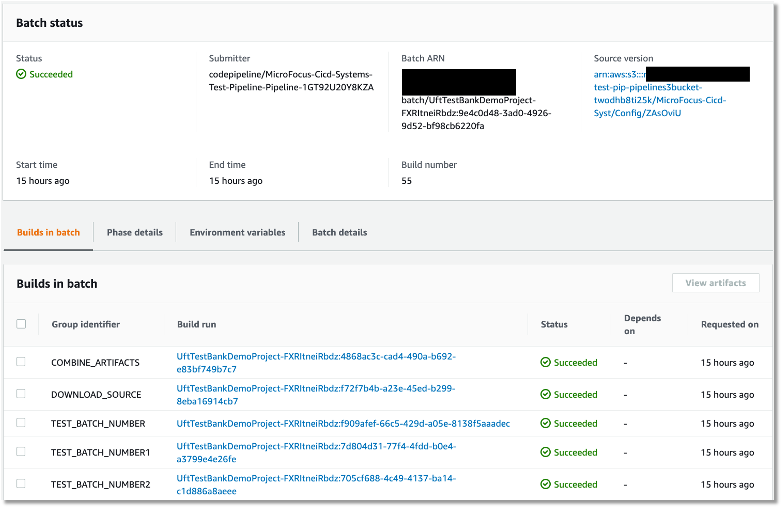
After setting up the batch build, CodeBuild creates multiple batches when the build starts. The following screenshot shows the batches on the CodeBuild console.

Regression tests Codebuild project ran in batch mode, three batches ran in prallel successfully

Figure – Regression tests Codebuild project ran in batch mode

Deploying to Enterprise Test Server

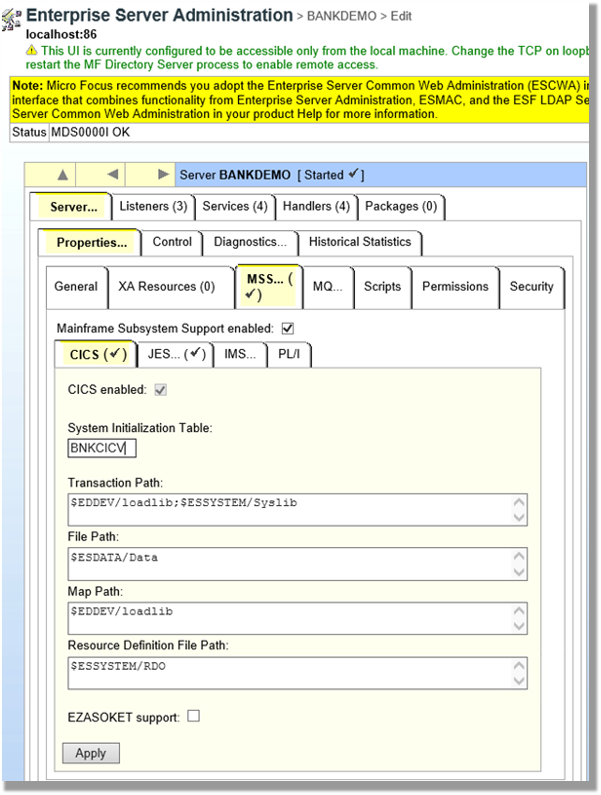
ETS is the transaction engine that processes all the online (and batch) requests that are initiated through external clients, such as 3270 terminals, web services, and websphere MQ. This engine provides support for various mainframe subsystems, such as CICS, IMS TM and JES, as well as code-level support for COBOL and PL/I. The following screenshot shows the Enterprise Test Server administration page.

Enterprise Server Administrator window showing configuration for CICS

Figure – Enterprise Server Administrator window

In this mainframe application testing use case, the regression tests are CICS transactions, initiated from 3270 requests (encapsulated in a web service). For more information about Enterprise Test Server, see the Enterprise Test Server and Micro Focus websites.

In the regression pipeline, after the stage of mainframe artifact compiling, we bake in the artifact into an ETS Docker container and upload the image to an Amazon ECR repository. This way, we have an immutable artifact for all the tests.

During each batch’s test preparation stage, a CloudFormation stack is deployed to create an Amazon ECS service on Windows EC2. The stack uses a Network Load Balancer as an integration point for the VHI’s integration.

The following code is an example of the CloudFormation snippet to create an Amazon ECS service using an Enterprise Test Server Docker image:

#...
  EtsService:
    DependsOn:
    - EtsTaskDefinition
    - EtsContainerSecurityGroup
    - EtsLoadBalancerListener
    Properties:
      Cluster: !Ref 'WindowsEcsClusterArn'
      DesiredCount: 1
      LoadBalancers:
        -
          ContainerName: !Sub "ets-${AWS::StackName}"
          ContainerPort: 9270
          TargetGroupArn: !Ref EtsPort9270TargetGroup
      HealthCheckGracePeriodSeconds: 300          
      TaskDefinition: !Ref 'EtsTaskDefinition'
    Type: "AWS::ECS::Service"

  EtsTaskDefinition:
    Properties:
      ContainerDefinitions:
        -
          Image: !Sub "${AWS::AccountId}.dkr.ecr.us-east-1.amazonaws.com/systems-test/ets:latest"
          LogConfiguration:
            LogDriver: awslogs
            Options:
              awslogs-group: !Ref 'SystemsTestLogGroup'
              awslogs-region: !Ref 'AWS::Region'
              awslogs-stream-prefix: ets
          Name: !Sub "ets-${AWS::StackName}"
          cpu: 4096
          memory: 8192
          PortMappings:
            -
              ContainerPort: 9270
          EntryPoint:
          - "powershell.exe"
          Command: 
          - '-F'
          - .\StartAndWait.ps1
          - 'bankdemo'
          - C:\bankdemo\
          - 'wait'
      Family: systems-test-ets
    Type: "AWS::ECS::TaskDefinition"
#...

Deploying the VHI model

In this architecture, the VHI is a bridge between mainframe and clients.

We use the VHI designer to capture the 3270 data streams and encapsulate the relevant data streams into a business function. We can then deliver this function as a web service that can be consumed by a test management solution, such as Micro Focus UFT One.

The following screenshot shows the setup for getCheckingDetails in VHI. Along with this procedure we can also see other procedures (eg calcCostLoan) defined that get generated as a web service. The properties associated with this procedure are available on this screen to allow for the defining of the mapping of the fields between the associated 3270 screens and exposed web service.

example of VHI designer to capture the 3270 data streams and encapsulate the relevant data streams into a business function getCheckingDetails

Figure – Setup for getCheckingDetails in VHI

The following screenshot shows the editor for this procedure and is initiated by the selection of the Procedure Editor. This screen presents the 3270 screens that are involved in the business function that will be generated as a web service.

VHI designer Procedure Editor shows the procedure

Figure – VHI designer Procedure Editor shows the procedure

After you define the required functional web services in VHI designer, the resultant model is saved and deployed into a VHI Docker image. We use this image and the associated model (from VHI designer) in the pipeline outlined in this post.

For more information about VHI, see the VHI website.

The pipeline contains two steps to deploy a VHI service. First, it installs and sets up the VHI models into a VHI Docker image, and it’s pushed into Amazon ECR. Second, a CloudFormation stack is deployed to create an Amazon ECS Fargate service, which uses the latest built Docker image. In AWS CloudFormation, the VHI ECS task definition defines an environment variable for the ETS Network Load Balancer’s DNS name. Therefore, the VHI can bootstrap and point to an ETS service. In the VHI stack, it uses a Network Load Balancer as an integration point for UFT One test integration.

The following code is an example of a ECS Task Definition CloudFormation snippet that creates a VHI service in Amazon ECS Fargate and integrates it with an ETS server:

#...
  VhiTaskDefinition:
    DependsOn:
    - EtsService
    Type: AWS::ECS::TaskDefinition
    Properties:
      Family: systems-test-vhi
      NetworkMode: awsvpc
      RequiresCompatibilities:
        - FARGATE
      ExecutionRoleArn: !Ref FargateEcsTaskExecutionRoleArn
      Cpu: 2048
      Memory: 4096
      ContainerDefinitions:
        - Cpu: 2048
          Name: !Sub "vhi-${AWS::StackName}"
          Memory: 4096
          Environment:
            - Name: esHostName 
              Value: !GetAtt EtsInternalLoadBalancer.DNSName
            - Name: esPort
              Value: 9270
          Image: !Ref "${AWS::AccountId}.dkr.ecr.us-east-1.amazonaws.com/systems-test/vhi:latest"
          PortMappings:
            - ContainerPort: 9680
          LogConfiguration:
            LogDriver: awslogs
            Options:
              awslogs-group: !Ref 'SystemsTestLogGroup'
              awslogs-region: !Ref 'AWS::Region'
              awslogs-stream-prefix: vhi

#...

Deploying UFT One Tests

UFT One is a test client that uses each of the web services created by the VHI designer to orchestrate running each of the associated business functions. Parameter data is supplied to each function, and validations are configured against the data returned. Multiple test suites are configured with different business functions with the associated data.

The following screenshot shows the test suite API_Bankdemo3, which is used in this regression test process.

the screenshot shows the test suite API_Bankdemo3 in UFT One test setup console, the API setup for getCheckingDetails

Figure – API_Bankdemo3 in UFT One Test Editor Console

For more information, see the UFT One website.

Integrating UFT One and testing the application

The last step is to integrate UFT One into CodeBuild and CodePipeline to test our mainframe application. First, we set up CodeBuild to use a UFT One container. The Docker image is available in Docker Hub. Then we author our buildspec. The buildspec has the following three phrases:

  • Setting up a UFT One license and deploying the test infrastructure
  • Starting the UFT One test suite to run regression tests
  • Tearing down the test infrastructure after tests are complete

The following code is an example of a buildspec snippet in the pre_build stage. The snippet shows the command to activate the UFT One license:

version: 0.2
batch: 
# . . .
phases:
  pre_build:
    commands:
      - |
        # Activate License
        $process = Start-Process -NoNewWindow -RedirectStandardOutput LicenseInstall.log -Wait -File 'C:\Program Files (x86)\Micro Focus\Unified Functional Testing\bin\HP.UFT.LicenseInstall.exe' -ArgumentList @('concurrent', 10600, 1, ${env:AUTOPASS_LICENSE_SERVER})        
        Get-Content -Path LicenseInstall.log
        if (Select-String -Path LicenseInstall.log -Pattern 'The installation was successful.' -Quiet) {
          Write-Host 'Licensed Successfully'
        } else {
          Write-Host 'License Failed'
          exit 1
        }
#...

The following command in the buildspec deploys the test infrastructure using the AWS Command Line Interface (AWS CLI)

aws cloudformation deploy --stack-name $stack_name `
--template-file cicd-pipeline/systems-test-pipeline/systems-test-service.yaml `
--parameter-overrides EcsCluster=$cluster_arn `
--capabilities CAPABILITY_IAM

Because ETS and VHI are both deployed with a load balancer, the build detects when the load balancers become healthy before starting the tests. The following AWS CLI commands detect the load balancer’s target group health:

$vhi_health_state = (aws elbv2 describe-target-health --target-group-arn $vhi_target_group_arn --query 'TargetHealthDescriptions[0].TargetHealth.State' --output text)
$ets_health_state = (aws elbv2 describe-target-health --target-group-arn $ets_target_group_arn --query 'TargetHealthDescriptions[0].TargetHealth.State' --output text)          

When the targets are healthy, the build moves into the build stage, and it uses the UFT One command line to start the tests. See the following code:

$process = Start-Process -Wait  -NoNewWindow -RedirectStandardOutput UFTBatchRunnerCMD.log `
-FilePath "C:\Program Files (x86)\Micro Focus\Unified Functional Testing\bin\UFTBatchRunnerCMD.exe" `
-ArgumentList @("-source", "${env:CODEBUILD_SRC_DIR_DemoSrc}\bankdemo\tests\API_Bankdemo\API_Bankdemo${env:TEST_BATCH_NUMBER}")

The next release of Micro Focus UFT One (November or December 2020) will provide an exit status to indicate a test’s success or failure.

When the tests are complete, the post_build stage tears down the test infrastructure. The following AWS CLI command tears down the CloudFormation stack:


#...
	post_build:
	  finally:
	  	- |
		  Write-Host "Clean up ETS, VHI Stack"
		  #...
		  aws cloudformation delete-stack --stack-name $stack_name
          aws cloudformation wait stack-delete-complete --stack-name $stack_name

At the end of the build, the buildspec is set up to upload UFT One test reports as an artifact into Amazon Simple Storage Service (Amazon S3). The following screenshot is the example of a test report in HTML format generated by UFT One in CodeBuild and CodePipeline.

UFT One HTML report shows regression testresult and test detals

Figure – UFT One HTML report

A new release of Micro Focus UFT One will provide test report formats supported by CodeBuild test report groups.

Conclusion

In this post, we introduced the solution to use Micro Focus Enterprise Suite, Micro Focus UFT One, Micro Focus VHI, AWS developer tools, and Amazon ECS containers to automate provisioning and running mainframe application tests in AWS at scale.

The on-demand model allows you to create the same test capacity infrastructure in minutes at a fraction of your current on-premises mainframe cost. It also significantly increases your testing and delivery capacity to increase quality and reduce production downtime.

A demo of the solution is available in AWS Partner Micro Focus website AWS Mainframe CI/CD Enterprise Solution. If you’re interested in modernizing your mainframe applications, please visit Micro Focus and contact AWS mainframe business development at [email protected].

References

Micro Focus


Peter Woods

Peter Woods

Peter has been with Micro Focus for almost 30 years, in a variety of roles and geographies including Technical Support, Channel Sales, Product Management, Strategic Alliances Management and Pre-Sales, primarily based in Europe but for the last four years in Australia and New Zealand. In his current role as Pre-Sales Manager, Peter is charged with driving and supporting sales activity within the Application Modernization and Connectivity team, based in Melbourne.

Leo Ervin

Leo Ervin

Leo Ervin is a Senior Solutions Architect working with Micro Focus Enterprise Solutions working with the ANZ team. After completing a Mathematics degree Leo started as a PL/1 programming with a local insurance company. The next step in Leo’s career involved consulting work in PL/1 and COBOL before he joined a start-up company as a technical director and partner. This company became the first distributor of Micro Focus software in the ANZ region in 1986. Leo’s involvement with Micro Focus technology has continued from this distributorship through to today with his current focus on cloud strategies for both DevOps and re-platform implementations.

Kevin Yung

Kevin Yung

Kevin is a Senior Modernization Architect in AWS Professional Services Global Mainframe and Midrange Modernization (GM3) team. Kevin currently is focusing on leading and delivering mainframe and midrange applications modernization for large enterprise customers.