Tag Archives: Backend

One small step closer to containerising service binaries

Post Syndicated from Grab Tech original https://engineering.grab.com/reducing-your-go-binary-size

Grab’s engineering teams currently own and manage more than 250+ microservices. Depending on the business problems that each team tackles, our development ecosystem ranges from Golang, Java, and everything in between.

Although there are centralised systems that help automate most of the build and deployment tasks, there are still some teams working on different technologies that manage their own build, test and deployment systems at different maturity levels. Managing a varied build and deploy ecosystems brings their own challenges.

Build challenges

  • Broken external dependencies.
  • Non-reproducible builds due to changes in AMI, configuration keys and other build parameters.
  • Missing security permissions between different repositories.

Deployment challenges

  • Varied deployment environments necessitating a bigger learning curve.
  • Managing the underlying infrastructure as code.
  • Higher downtime when bringing the systems up after a scale down event.

Grab’s appetite for customer obsession and quality drives the engineering teams to innovate and deliver value rapidly. The time that the team spends in fixing build issues or deployment-related tasks has a direct impact on the time they spend on delivering business value.

Introduction to containerisation

Using the Container architecture helps the team deploy and run multiple applications, isolated from each other, on the same virtual machine or server and with much less overhead.

At Grab, both the platform and the core engineering teams wanted to move to the containerisation architecture to achieve the following goals:

  • Support to build and push container images during the CI process.
  • Create a standard virtual machine image capable of running container workloads. The AMI is maintained by a central team and comes with Grab infrastructure components such as (DataDog, Filebeat, Vault, etc.).
  • A deployment experience which allows existing services to migrate to container workload safely by initially running both types of workloads concurrently.

The core engineering teams wanted to adopt container workloads to achieve the following benefits:

  • Provide a containerised version of the service that can be run locally and on different cloud providers without any dependency on Grab’s internal (runtime) tooling.
  • Allow reuse of common Grab tools in different projects by running the zero dependency version of the tools on demand whenever needed.
  • Allow a more flexible staging/dev/shadow deployment of new features.

Adoption of containerisation

Engineering teams at Grab use the containerisation model to build and deploy services at scale. Our containerisation effort helps the development teams move faster by:

  • Providing a consistent environment across development, testing and production
  • Deploying software efficiently
  • Reducing infrastructure cost
  • Abstracting OS dependency
  • Increasing scalability between cloud vendors

When we started using containers we realised that building smaller containers had some benefits over bigger containers. For example, smaller containers:

  • Include only the needed libraries and therefore are more secure.
  • Build and deploy faster as they can be pulled to the running container cluster quickly.
  • Utilise disk space and memory efficiently.

During the course of containerising our applications, we noted that some service binaries appeared to be bigger (~110 MB) than they should be. For a statically-linked Golang binary, that’s pretty big! So how do we figure out what’s bloating the size of our binary?

Go binary size visualisation tool

In the course of poking around for tools that would help us analyse the symbols in a Golang binary, we found go-binsize-viz based on this article. We particularly liked this tool, because it utilises the existing Golang toolchain (specifically, Go tool nm) to analyse imports, and provides a straightforward mechanism for traversing through the symbols present via treemap. We will briefly outline the steps that we did to analyse a Golang binary here.

  1. First, build your service using the following command (important for consistency between builds):

    $ go build -a -o service_name ./path/to/main.go
    
  2. Next, copy the binary over to the cloned directory of go-binsize-viz repository.
  3. Run the following script that covers the steps in the go-binsize-viz README.

    #!/usr/bin/env bash
    #
    # This script needs more input parsing, but it serves the needs for now.
    #
    mkdir dist
    # step 1
    go tool nm -size $1 | c++filt > dist/$1.symtab
    # step 2
    python3 tab2pydic.py dist/$1.symtab > dist/$1-map.py
    # step 3
    # must be data.js
    python3 simplify.py dist/$1-map.py > dist/$1-data.js
    rm data.js
    ln -s dist/$1-data.js data.js
    

    Running this script creates a dist folder where each intermediate step is deposited, and a data.js symlink in the top-level directory which points to the consumable .js file by treemap.html.

    # top-level directory
    $ ll
    -rw-r--r--   1 stan.halka  staff   1.1K Aug 20 09:57 README.md
    -rw-r--r--   1 stan.halka  staff   6.7K Aug 20 09:57 app3.js
    -rw-r--r--   1 stan.halka  staff   1.6K Aug 20 09:57 cockroach_sizes.html
    lrwxr-xr-x   1 stan.halka  staff        65B Aug 25 16:49 data.js -> dist/v2.0.709356.segments-paxgroups-macos-master-go1.13-data.js
    drwxr-xr-x   8 stan.halka  staff   256B Aug 25 16:49 dist
    ...
    # dist folder
    $ ll dist
    total 71728
    drwxr-xr-x   8 stan.halka  staff   256B Aug 25 16:49 .
    drwxr-xr-x  21 stan.halka  staff   672B Aug 25 16:49 ..
    -rw-r--r--   1 stan.halka  staff   4.2M Aug 25 16:37 v2.0.709356.segments-paxgroups-macos-master-go1.13-data.js
    -rw-r--r--   1 stan.halka  staff   3.4M Aug 25 16:37 v2.0.709356.segments-paxgroups-macos-master-go1.13-map.py
    -rw-r--r--   1 stan.halka  staff    11M Aug 25 16:37 v2.0.709356.segments-paxgroups-macos-master-go1.13.symtab
    

    As you can probably tell from the file names, these steps were explored on the segments-paxgroups service, which is a microservice used for segment information at Grab. You can ignore the versioning metadata, branch name, and Golang information embedded in the name.

  4. Finally, run a local python3 server to visualise the binary components.

    $ python3 -m http.server
    Serving HTTP on 0.0.0.0 port 8000 (http://0.0.0.0:8000/) ...
    

    So now that we have a methodology to consistently generate a service binary, and a way to explore the symbols present, let’s dive in!

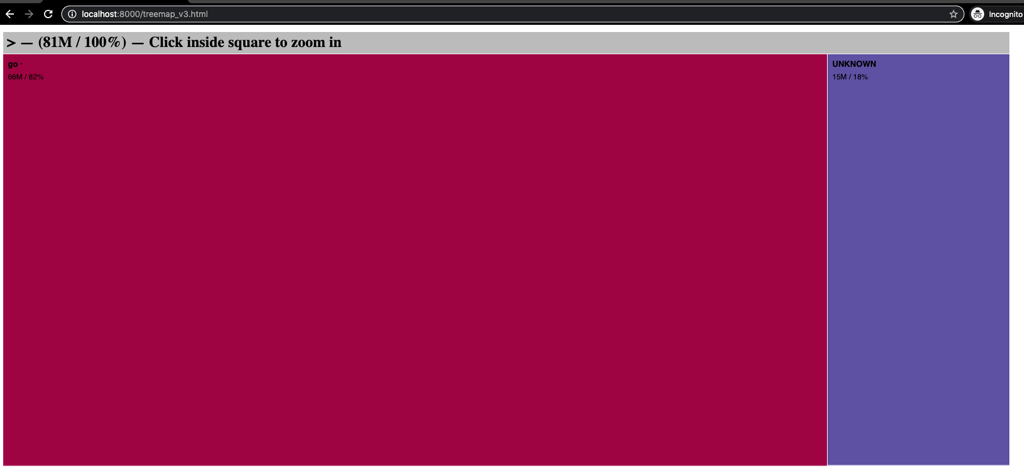
  5. Open your browser and visit http://localhost:8000/treemap_v3.html:

    Of the 103MB binary produced, 81MB are recognisable, with 66MB recognised as Golang (UNKNOWN is present, and also during parsing there were a fair number of warnings. Note that we haven’t spent enough time with the tool to understand why we aren’t able to recognise and index all the symbols present).

    Treemap

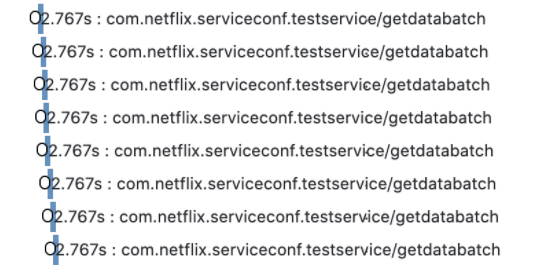
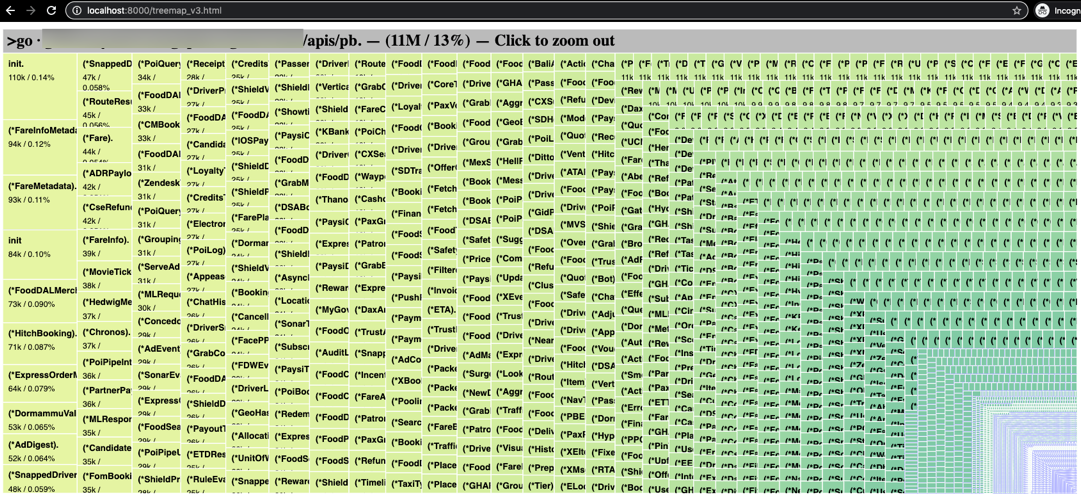
    The next step is to figure out where the symbols are coming from. There’s a bunch of Grab-internal stuff that for the sake of this blog isn’t necessary to go into, and it was reasonably easy to come to the right answer based on the intuitiveness of the go-binsize-viz tool.

    This visualisation shows us the source of how 11 MB of symbols are sneaking into the segments-paxgroups binary.

    Visualisation

    Every message format for any service that reads from, or writes to, streams at Grab is included in every service binary! Not cloud native!

How did this happen?

The short answer is that Golang doesn’t import only the symbols that it requires, but rather all the symbols defined within an imported directory and transitive symbols as well. So, when we think we’re importing just one directory, if our code structure doesn’t follow principles of encapsulation or isolation, we end up importing 11 MB of symbols that we don’t need! In our case, this occurred because a generic Message interface was included in the same directory with all the auto-generated code you see in the pretty picture above.

The Streams team did an awesome job of restructuring the code, which when built again, led to this outcome:

$$ ll | grep paxgroups
-rwxr-xr-x   1 stan.halka  staff   110M Aug 21 14:53 v2.0.709356.segments-paxgroups-macos-master-go1.12
-rwxr-xr-x   1 stan.halka  staff   103M Aug 25 16:34 v2.0.709356.segments-paxgroups-macos-master-go1.13
-rwxr-xr-x   1 stan.halka  staff        80M Aug 21 14:53 v2.0.709356.segments-paxgroups-macos-tinkered-go1.12
-rwxr-xr-x   1 stan.halka  staff        78M Aug 25 16:34 v2.0.709356.segments-paxgroups-macos-tinkered-go1.13

Not a bad reduction in service binary size!

Lessons learnt

The go-binsize-viz utility offers a treemap representation for imported symbols, and is very useful in determining what symbols are contributing to the overall size.

Code architecture matters: Keep binaries as small as possible!

To reduce your binary size, follow these best practices:

  • Structure your code so that the interfaces and common classes/utilities are imported from different locations than auto-generated classes.
  • Avoid huge, flat directory structures.
  • If it’s a platform offering and has too many interwoven dependencies, try to decouple the actual platform offering from the company specific instantiations. This fosters creating isolated, minimalistic code.

Join us

Grab is more than just the leading ride-hailing and mobile payments platform in Southeast Asia. We use data and technology to improve everything from transportation to payments and financial services across a region of more than 620 million people. We aspire to unlock the true potential of Southeast Asia and look for like-minded individuals to join us on this ride.

If you share our vision of driving South East Asia forward, apply to join our team today.

Optimally scaling Kafka consumer applications

Post Syndicated from Grab Tech original https://engineering.grab.com/optimally-scaling-kafka-consumer-applications

Earlier this year, we took you on a journey on how we built and deployed our event sourcing and stream processing framework at Grab. We’re happy to share that we’re able to reliably maintain our uptime and continue to service close to 400 billion events a week. We haven’t stopped there though. To ensure that we can scale our framework as the Grab business continuously grows, we have spent efforts optimizing our infrastructure.

In this article, we will dive deeper into our Kubernetes infrastructure setup for our stream processing framework. We will cover why and how we focus on optimal scalability and availability of our infrastructure.

Quick Architecture Recap

Coban Platform Architecture

The Coban platform provides lightweight Golang plugin architecture-based data processing pipelines running in Kubernetes. These are essentially Kafka consumer pods that consume data, process it, and then materialize the results into various sinks (RDMS, other Kafka topics).

Anatomy of a Processing Pod

Anatomy of a Processing Pod

Each stream processing pod (the smallest unit of a pipeline’s deployment) has three top level components:

  • Trigger: An interface that connects directly to the source of the data and converts it into an event channel.
  • Runtime: This is the app’s entry point and the orchestrator of the pod. It manages the worker pools, triggers, event channels, and lifecycle events.
  • Pipeline plugin: This is provided by the user, and conforms to a contract that the platform team publishes. It contains the domain logic for the pipeline and houses the pipeline orchestration defined by a user based on our Stream Processing Framework.

Optimal Scaling

We initially architected our Kubernetes setup around horizontal pod autoscaling (HPA), which scales the number of pods per deployment based on CPU and memory usage. HPA keeps CPU and memory per pod specified in the deployment manifest and scales horizontally as the load changes.

These were the areas of application wastage we observed on our platform:

  • As Grab’s traffic is uneven, we’d always have to provision for peak traffic. As users would not (or could not) always account for ramps, they would be fairly liberal with setting limit values (CPU and memory), leading to resource wastage.
  • Pods often had uneven traffic distribution despite fairly even partition load distribution in Kafka. The Stream Processing Framework(SPF) is essentially Kafka consumers consuming from Kafka topics, hence the number of pods scaling in and out resulted in unequal partition load per pod.

Vertically Scaling with Fixed Number of Pods

We initially kept the number of pods for a pipeline equal to the number of partitions in the topic the pipeline consumes from. This ensured even distribution of partitions to each pod providing balanced consumption. In order to abstract this from the end user, we automated the application deployment process to directly call the Kafka API to fetch the number of partitions during runtime.

After achieving a fixed number of pods for the pipeline, we wanted to move away from HPA. We wanted our pods to scale up and down as the load increases or decreases without any manual intervention. Vertical pod autoscaling (VPA) solves this problem as it relieves us from any manual operation for setting up resources for our deployment.

We just deploy the application and let VPA handle the resources required for its operation. It’s known to not be very susceptible to quick load changes as it trains its model to monitor the deployment’s load trend over a period of time before recommending an optimal resource. This process ensures the optimal resource allocation for our pipelines considering the historic trends on throughput.

We saw a ~45% reduction in our total resource usage vs resource requested after moving to VPA with a fixed number of pods from HPA.

Anatomy of a Processing Pod

Managing Availability

We broadly classify our workloads as latency sensitive (critical) and latency tolerant (non-critical). As a result, we could optimize scheduling and cost efficiency using priority classes and overprovisioning on heterogeneous node types on AWS.

Kubernetes Priority Classes

The main cost of running EKS in AWS is attributed to the EC2 machines that form the worker nodes for the Kubernetes cluster. Running On-Demand brings all the guarantees of instance availability but it is definitely very expensive. Hence, our first action to drive cost optimisation was to include Spot instances in our worker node group.

With the uncertainty of losing a spot instance, we started assigning priority to our various applications. We then let the user choose the priority of their pipeline depending on their use case. Different priorities would result in different node affinity to different kinds of instance groups (On-Demand/Spot). For example, Critical pipelines (latency sensitive) run on On-Demand worker node groups and Non-critical pipelines (latency tolerant) on Spot instance worker node groups.

We use priority class as a method of preemption, as well as a node affinity that chooses a certain priority pipeline for the node group to deploy to.

Overprovisioning

With spot instances running we realised a need to make our cluster quickly respond to failures. We wanted to achieve quick rescheduling of evicted pods, hence we added overprovisioning to our cluster. This means we keep some noop pods occupying free space running in our worker node groups for the quick scheduling of evicted or deploying pods.

The overprovisioned pods are the lowest priority pods, thus can be preempted by any pod waiting in the queue for scheduling. We used cluster proportional autoscaler to decide the right number of these overprovisioned pods, which scales up and down proportionally to cluster size (i.e number of nodes and CPU in worker node group). This relieves us from tuning the number of these noop pods as the cluster scales up or down over the period keeping the free space proportional to current cluster capacity.

Lastly, overprovisioning also helped improve the deployment time because there is no  dependency on the time required for Auto Scaling Groups (ASG) to add a new node to the cluster every time we want to deploy a new application.

Future Improvements

Evolution is an ongoing process. In the next few months, we plan to work on custom resources for combining VPA and fixed deployment size. Our current architecture setup works fine for now, but we would like to create a more tuneable in-house CRD(Custom Resource Definition) for VPA that incorporates rightsizing our Kubernetes deployment horizontally.


Authored By Shubham Badkur on behalf of the Coban team at Grab – Ryan Ooi, Karan Kamath, Hui Yang, Yuguang Xiao, Jump Char, Jason Cusick, Shrinand Thakkar, Dean Barlan, Shivam Dixit, Andy Nguyen, and Ravi Tandon.


Join us

Grab is more than just the leading ride-hailing and mobile payments platform in Southeast Asia. We use data and technology to improve everything from transportation to payments and financial services across a region of more than 620 million people. We aspire to unlock the true potential of Southeast Asia and look for like-minded individuals to join us on this ride.

If you share our vision of driving South East Asia forward, apply to join our team today.

Seamlessly Swapping the API backend of the Netflix Android app

Post Syndicated from Netflix Technology Blog original https://netflixtechblog.com/seamlessly-swapping-the-api-backend-of-the-netflix-android-app-3d4317155187

How we migrated our Android endpoints out of a monolith into a new microservice

by Rohan Dhruva, Ed Ballot

As Android developers, we usually have the luxury of treating our backends as magic boxes running in the cloud, faithfully returning us JSON. At Netflix, we have adopted the Backend for Frontend (BFF) pattern: instead of having one general purpose “backend API”, we have one backend per client (Android/iOS/TV/web). On the Android team, while most of our time is spent working on the app, we are also responsible for maintaining this backend that our app communicates with, and its orchestration code.

Recently, we completed a year-long project rearchitecting and decoupling our backend from the centralized model used previously. We did this migration without slowing down the usual cadence of our releases, and with particular care to avoid any negative effects to the user experience. We went from an essentially serverless model in a monolithic service, to deploying and maintaining a new microservice that hosted our app backend endpoints. This allowed Android engineers to have much more control and observability over how we get our data. Over the course of this post, we will talk about our approach to this migration, the strategies that we employed, and the tools we built to support this.

Background

The Netflix Android app uses the falcor data model and query protocol. This allows the app to query a list of “paths” in each HTTP request, and get specially formatted JSON (jsonGraph) that we use to cache the data and hydrate the UI. As mentioned earlier, each client team owns their respective endpoints: which effectively means that we’re writing the resolvers for each of the paths that are in a query.

Screenshot from the Netflix Android app

As an example, to render the screen shown here, the app sends a query that looks like this:

paths: ["videos", 80154610, "detail"]

A path starts from a root object, and is followed by a sequence of keys that we want to retrieve the data for. In the snippet above, we’re accessing the detail key for the video object with id 80154610.

For that query, the response is:

Response for the query [“videos”, 80154610, “detail”]

In the Monolith

In the example you see above, the data that the app needs is served by different backend microservices. For example, the artwork service is separate from the video metadata service, but we need the data from both in the detail key.

We do this orchestration on our endpoint code using a library provided by our API team, which exposes an RxJava API to handle the downstream calls to the various backend microservices. Our endpoint route handlers are effectively fetching the data using this API, usually across multiple different calls, and massaging it into data models that the UI expects. These handlers we wrote were deployed into a service run by the API team, shown in the diagram below.

Diagram of Netflix API monolith
Image taken from a previously published blog post

As you can see, our code was just a part (#2 in the diagram) of this monolithic service. In addition to hosting our route handlers, this service also handled the business logic necessary to make the downstream calls in a fault tolerant manner. While this gave client teams a very convenient “serverless” model, over time we ran into multiple operational and devex challenges with this service. You can read more about this in our previous posts here: part 1, part 2.

The Microservice

It was clear that we needed to isolate the endpoint code (owned by each client team), from the complex logic of fault tolerant downstream calls. Essentially, we wanted to break out the client-specific code from this monolith into its own service. We tried a few iterations of what this new service should look like, and eventually settled on a modern architecture that aimed to give more control of the API experience to the client teams. It was a Node.js service with a composable JavaScript API that made downstream microservice calls, replacing the old Java API.

Java…Script?

As Android developers, we’ve come to rely on the safety of a strongly typed language like Kotlin, maybe with a side of Java. Since this new microservice uses Node.js, we had to write our endpoints in JavaScript, a language that many people on our team were not familiar with. The context around why the Node.js ecosystem was chosen for this new service deserves an article in and of itself. For us, it means that we now need to have ~15 MDN tabs open when writing routes 🙂

Let’s briefly discuss the architecture of this microservice. It looks like a very typical backend service in the Node.js world: a combination of Restify, a stack of HTTP middleware, and the Falcor-based API. We’ll gloss over the details of this stack: the general idea is that we’re still writing resolvers for paths like [videos, <id>, detail], but we’re now writing them in JavaScript.

The big difference from the monolith, though, is that this is now a standalone service deployed as a separate “application” (service) in our cloud infrastructure. More importantly, we’re no longer just getting and returning requests from the context of an endpoint script running in a service: we’re now getting a chance to handle the HTTP request in its entirety. Starting from “terminating” the request from our public gateway, we then make downstream calls to the api application (using the previously mentioned JS API), and build up various parts of the response. Finally, we return the required JSON response from our service.

The Migration

Before we look at what this change meant for us, we want to talk about how we did it. Our app had ~170 query paths (think: route handlers), so we had to figure out an iterative approach to this migration. Let’s take a look at what we built in the app to support this migration. Going back to the screenshot above, if you scroll a bit further down on that page, you will see the section titled “more like this”:

Screenshot from the Netflix app showing “more like this”

As you can imagine, this does not belong in the video details data for this title. Instead, it is part of a different path: [videos, <id>, similars]. The general idea here is that each UI screen (Activity/Fragment) needs data from multiple query paths to render the UI.

To prepare ourselves for a big change in the tech stack of our endpoint, we decided to track metrics around the time taken to respond to queries. After some consultation with our backend teams, we determined the most effective way to group these metrics were by UI screen. Our app uses a version of the repository pattern, where each screen can fetch data using a list of query paths. These paths, along with some other configuration, builds a Task. These Tasks already carry a uiLabel that uniquely identifies each screen: this label became our starting point, which we passed in a header to our endpoint. We then used this to log the time taken to respond to each query, grouped by the uiLabel. This meant that we could track any possible regressions to user experience by screen, which corresponds to how users navigate through the app. We will talk more about how we used these metrics in the sections to follow.

Fast forward a year: the 170 number we started with slowly but surely whittled down to 0, and we had all our “routes” (query paths) migrated to the new microservice. So, how did it go…?

The Good

Today, a big part of this migration is done: most of our app gets its data from this new microservice, and hopefully our users never noticed. As with any migration of this scale, we hit a few bumps along the way: but first, let’s look at good parts.

Migration Testing Infrastructure

Our monolith had been around for many years and hadn’t been created with functional and unit testing in mind, so those were independently bolted on by each UI team. For the migration, testing was a first-class citizen. While there was no technical reason stopping us from adding full automation coverage earlier, it was just much easier to add this while migrating each query path.

For each route we migrated, we wanted to make sure we were not introducing any regressions: either in the form of missing (or worse, wrong) data, or by increasing the latency of each endpoint. If we pare down the problem to absolute basics, we essentially have two services returning JSON. We want to make sure that for a given set of paths as input, the returned JSON is always exactly the same. With lots of guidance from other platform and backend teams, we took a 3-pronged approach to ensure correctness for each route migrated.

Functional Testing
Functional testing was the most straightforward of them all: a set of tests alongside each path exercised it against the old and new endpoints. We then used the excellent Jest testing framework with a set of custom matchers that sanitized a few things like timestamps and uuids. It gave us really high confidence during development, and helped us cover all the code paths that we had to migrate. The test suite automated a few things like setting up a test user, and matching the query parameters/headers sent by a real device: but that’s as far as it goes. The scope of functional testing was limited to the already setup test scenarios, but we would never be able to replicate the variety of device, language and locale combinations used by millions of our users across the globe.

Replay Testing
Enter replay testing. This was a custom built, 3-step pipeline:

  • Capture the production traffic for the desired path(s)
  • Replay the traffic against the two services in the TEST environment
  • Compare and assert for differences

It was a self-contained flow that, by design, captured entire requests, and not just the one path we requested. This test was the closest to production: it replayed real requests sent by the device, thus exercising the part of our service that fetches responses from the old endpoint and stitches them together with data from the new endpoint. The thoroughness and flexibility of this replay pipeline is best described in its own post. For us, the replay test tooling gave the confidence that our new code was nearly bug free.

Canaries
Canaries were the last step involved in “vetting” our new route handler implementation. In this step, a pipeline picks our candidate change, deploys the service, makes it publicly discoverable, and redirects a small percentage of production traffic to this new service. You can find a lot more details about how this works in the Spinnaker canaries documentation.

This is where our previously mentioned uiLabel metrics become relevant: for the duration of the canary, Kayenta was configured to capture and compare these metrics for all requests (in addition to the system level metrics already being tracked, like server CPU and memory). At the end of the canary period, we got a report that aggregated and compared the percentiles of each request made by a particular UI screen. Looking at our high traffic UI screens (like the homepage) allowed us to identify any regressions caused by the endpoint before we enabled it for all our users. Here’s one such report to get an idea of what it looks like:

Graph showing a 4–5% regression in the homepage latency.

Each identified regression (like this one) was subject to a lot of analysis: chasing down a few of these led to previously unidentified performance gains! Being able to canary a new route let us verify latency and error rates were within acceptable limits. This type of tooling required time and effort to create, but in the end, the feedback it provided was well worth the cost.

Observability

Many Android engineers will be familiar with systrace or one of the excellent profilers in Android Studio. Imagine getting a similar tracing for your endpoint code, traversing along many different microservices: that is effectively what distributed tracing provides. Our microservice and router were already integrated into the Netflix request tracing infrastructure. We used Zipkin to consume the traces, which allowed us to search for a trace by path. Here’s what a typical trace looks like:

Zipkin trace for a call
A typical zipkin trace (truncated)

Request tracing has been critical to the success of Netflix infrastructure, but when we operated in the monolith, we did not have the ability to get this detailed look into how our app interacted with the various microservices. To demonstrate how this helped us, let us zoom into this part of the picture:

Serialized calls to this service adds a few ms latency

It’s pretty clear here that the calls are being serialized: however, at this point we’re already ~10 hops disconnected from our microservice. It’s hard to conclude this, and uncover such problems, from looking at raw numbers: either on our service or the testservice above, and even harder to attribute them back to the exact UI platform or screen. With the rich end-to-end tracing instrumented in the Netflix microservice ecosystem and made easily accessible via Zipkin, we were able to pretty quickly triage this problem to the responsible team.

End-to-end Ownership

As we mentioned earlier, our new service now had the “ownership” for the lifetime of the request. Where previously we only returned a Java object back to the api middleware, now the final step in the service was to flush the JSON down the request buffer. This increased ownership gave us the opportunity to easily test new optimisations at this layer. For example, with about a day’s worth of work, we had a prototype of the app using the binary msgpack response format instead of plain JSON. In addition to the flexible service architecture, this can also be attributed to the Node.js ecosystem and the rich selection of npm packages available.

Local Development

Before the migration, developing and debugging on the endpoint was painful due to slow deployment and lack of local debugging (this post covers that in more detail). One of the Android team’s biggest motivations for doing this migration project was to improve this experience. The new microservice gave us fast deployment and debug support by running the service in a local Docker instance, which has led to significant productivity improvements.

The Not-so-good

In the arduous process of breaking a monolith, you might get a sharp shard or two flung at you. A lot of what follows is not specific to Android, but we want to briefly mention these issues because they did end up affecting our app.

Latencies

The old api service was running on the same “machine” that also cached a lot of video metadata (by design). This meant that data that was static (e.g. video titles, descriptions) could be aggressively cached and reused across multiple requests. However, with the new microservice, even fetching this cached data needed to incur a network round trip, which added some latency.

This might sound like a classic example of “monoliths vs microservices”, but the reality is somewhat more complex. The monolith was also essentially still talking to a lot of downstream microservices: it just happened to have a custom-designed cache that helped a lot. Some of this increased latency was mitigated by better observability and more efficient batching of requests. But, for a small fraction of requests, after a lot of attempts at optimization, we just had to take the latency hit: sometimes, there are no silver bullets.

Increased Partial Query Errors

As each call to our endpoint might need to make multiple requests to the api service, some of these calls can fail, leaving us with partial data. Handling such partial query errors isn’t a new problem: it is baked into the nature of composite protocols like Falcor or GraphQL. However, as we moved our route handlers into a new microservice, we now introduced a network boundary for fetching any data, as mentioned earlier.

This meant that we now ran into partial states that weren’t possible before because of the custom caching. We were not completely aware of this problem in the beginning of our migration: we only saw it when some of our deserialized data objects had null fields. Since a lot of our code uses Kotlin, these partial data objects led to immediate crashes, which helped us notice the problem early: before it ever hit production.

As a result of increased partial errors, we’ve had to improve overall error handling approach and explore ways to minimize the impact of the network errors. In some cases, we also added custom retry logic on either the endpoint or the client code.

Final Thoughts

This has been a long (you can tell!) and a fulfilling journey for us on the Android team: as we mentioned earlier, on our team we typically work on the app and, until now, we did not have a chance to work with our endpoint with this level of scrutiny. Not only did we learn more about the intriguing world of microservices, but for us working on this project, it provided us the perfect opportunity to add observability to our app-endpoint interaction. At the same time, we ran into some unexpected issues like partial errors and made our app more resilient to them in the process.

As we continue to evolve and improve our app, we hope to share more insights like these with you.

The planning and successful migration to this new service was the combined effort of multiple backend and front end teams.

On the Android team, we ship the Netflix app on Android to millions of members around the world. Our responsibilities include extensive A/B testing on a wide variety of devices by building highly performant and often custom UI experiences. We work on data driven optimizations at scale in a diverse and sometimes unforgiving device and network ecosystem. If you find these challenges interesting, and want to work with us, we have an open position.


Seamlessly Swapping the API backend of the Netflix Android app was originally published in Netflix TechBlog on Medium, where people are continuing the conversation by highlighting and responding to this story.