Tag Archives: Android

Scaling developer experience: How we improved Android Studio in a large monorepo

Post Syndicated from Grab Tech original https://engineering.grab.com/how-we-improved-android-studio-in-large-monorepo

Introduction

Long integrated development environment (IDE) sync/indexing times can quietly erode developer productivity, making code navigation sluggish, spiking memory usage, and slowing down Jetpack Compose preview updates, turning the IDE into a bottleneck rather than a helpful tool. For Android engineers working in a large monorepo, this was a daily reality. In this post, we will share how we built a custom Focus plugin that dramatically reduced Android Studio sync times by leveraging our existing investments, such as the Gradle-to-Bazel migration workflow.

Our Android monorepo at scale

The Grab passenger Android (PAX) repository contains roughly 2,000 Android modules and 11,000,000 lines of code. As the repository grows year over year, a natural consequence of scaling our superapp, which combines ride-hailing, food delivery, payments, and more into a single application, is the increase in time required to build and sync the project.

What makes this growth especially pronounced today is the shift in how code gets written. Development assisted by artificial intelligence (AI) has enabled engineers to produce more code faster than before. At the same time, non-engineering personnel such as designers, product managers, and other non-technical contributors have started making changes to low-risk features under engineering provision. Together, these two forces are pushing the codebase to grow at its fastest rate ever, which in turn compounds the pressure on every developer’s IDE and build tooling to keep up.

We previously adopted Bazel to speed up incremental and cached builds, but build time was only part of the picture. We intentionally kept Android Studio syncing with Gradle, so developers get fast Bazel builds while the IDE uses the standard Gradle toolchain, thereby preserving compatibility and avoiding the friction and tooling gaps of full Bazel IDE integration. This trade-off gives us the best of both worlds, but it also means Gradle sync remains a first-class concern. Even though Bazel handles the builds, Android Studio still depends on Gradle sync to import the project model that powers IDE features such as code navigation, autocompletion, and error highlighting. That sync process, which evaluates every module declared in settings.gradle, had quietly become a major pain point.

The problem

Over time, we noticed a growing number of reports stating that IDE syncs were too slow and memory-intensive. A single full sync could take more than 35 minutes on a cold start. The pain was especially acute after a rebase or branch checkout. Since these operations often modify build configuration files, Android Studio would detect the changes and trigger a full re-sync just to restore basic IDE functionality.

We conducted a developer experience survey to quantify the issue. From 55 responses, the results painted a clearer picture:

  • 76% said long sync times significantly or very significantly impacted their productivity.
  • 60% were unsatisfied or very unsatisfied with IDE sync time.
  • 47% were unsatisfied or very unsatisfied with Compose preview update speed.
  • 82% said they would benefit from the option to exclude modules from syncing.
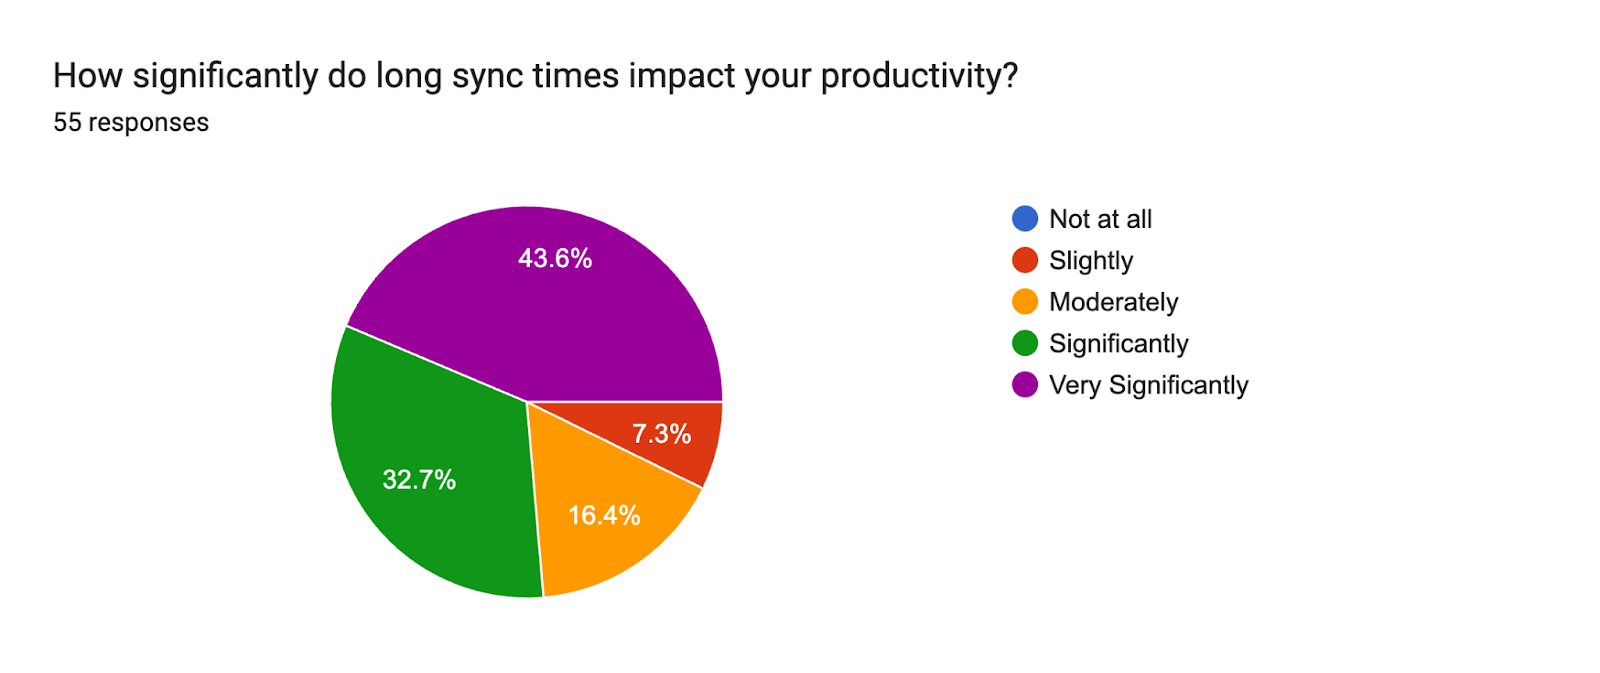
Figure 1. Results of developer experience survey.

The survey validated our anecdotal feedback: developers were frustrated. Slow, sluggish IDE performance was eroding productivity and disrupting flow. We set out to determine whether developers really needed to load every module to work on just one.

Investigation

Root cause

The root cause was straightforward: module count. With roughly 2,000 modules in the codebase, a full sync required Gradle to configure every single module, including parsing build files, resolving dependencies, and generating IDE project models, regardless of whether the developer actually needed them. A developer working on the Payments feature still had to wait for Gradle to process Food, Transport, Mart, and every other module. The configuration time and resulting memory consumption grew roughly in proportion to module count, and the count kept rising.

Exploring community solutions

We looked at existing solutions in the Android community. One promising candidate was the Focus plugin from Dropbox. Here’s how the Focus plugin works:

  1. The developer runs a Gradle command to focus on a specific module (e.g. ./gradlew :module:focus).
  2. The Gradle task calculates the dependency graph, generates a separate focused settings file, and writes a .focus marker file that tells Gradle to use it instead of the full project settings.
  3. The developer syncs the IDE, which now only configures the focused modules.

This approach works because instead of syncing the entire repository, the developer only configures the module they are working on, along with its required dependencies. Everything else is excluded.

For example, if you are working on the Payments module, only Payments and its dependency chain get loaded. Food, Transport, and Mart modules are excluded entirely.
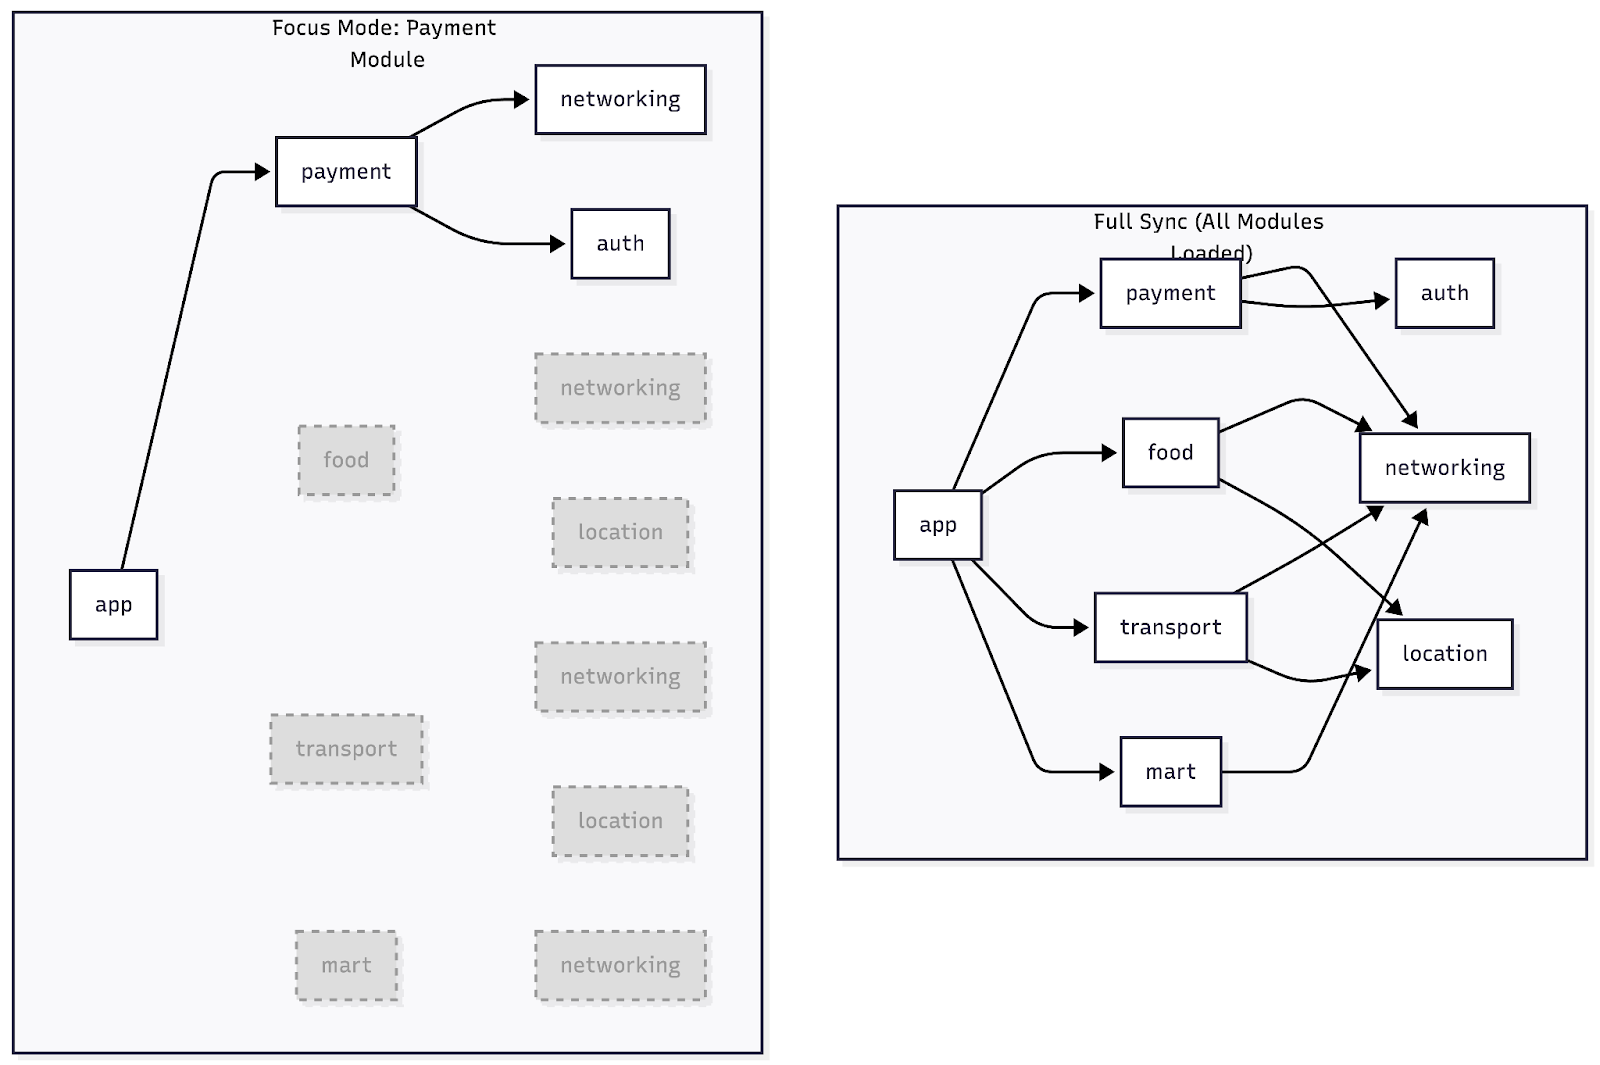
Figure 2. Focus mode sync vs. full sync.

Depending on the size of the target module, this approach can cut the number of loaded modules by 50% or more, especially with a well-structured modularization architecture. We wanted to adopt this approach and saw an opportunity to improve it further by leveraging our existing Gradle-to-Bazel migration workflow.

Our solution: Building a custom Focus plugin

The Dropbox Focus plugin was a great starting point, but it introduced several friction points in our setup:

  • We would need to move all non-essential declarations from settings.gradle into a separate settings-all.gradle file.
  • We would need guardrails to ensure new modules are declared in the correct file.
  • Most critically, focusing on a module requires running a Gradle task (e.g., ./gradlew :module:focus), which itself goes through Gradle’s configuration phase and adds a noticeable delay before a developer can even start an IDE sync.

We set out to address each of these issues.

Challenge 1: Eliminating the configuration phase

The Dropbox Focus plugin recalculates the dependency graph every time a developer runs the focus command. This means every Focus operation pays the cost of Gradle’s configuration phase, parsing every build.gradle file in the project to resolve the full dependency tree.

We realized we already had this information. Our build infrastructure includes Grazel, which migrates Gradle build files to their Bazel equivalents via a migrateToBazel task, and our Continuous Integration (CI) validations ensure that both are aligned. This task already traverses the full dependency graph for migration purposes.

Our insight: generate a dependency graph as a static file during migrateToBazel and reuse it for focus operations.
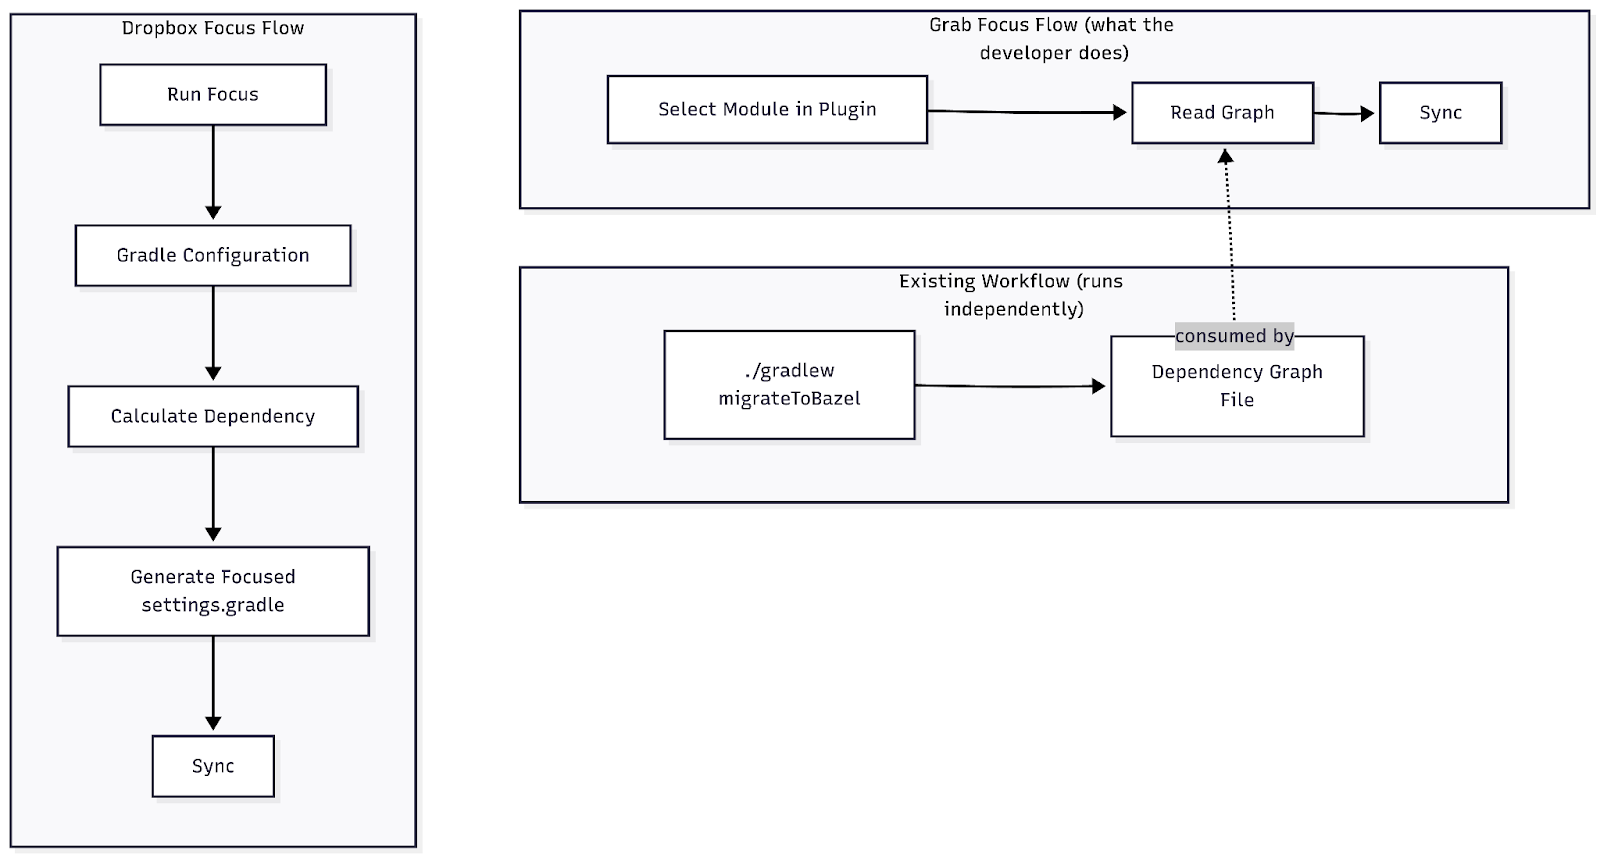
Figure 3. Focus flow vs. Grab’s customized focus flow.

By pre-computing and persisting the dependency graph, we skip the Gradle configuration phase entirely. The focus operation becomes a fast, local file lookup instead of a lengthy Gradle computation. The developer simply selects their module and syncs.

The dependency graph is stored as a JSON file, which is lightweight and fast to read. The trade-off is that it requires a migrateToBazel run to stay up-to-date. When creating a new module or changing module dependencies, developers need to rerun ./gradlew migrateToBazel to regenerate the graph. We accepted this because developers already had to run migrateToBazel before merging to master (to ensure Bazel files are current). The graph stays fresh as part of their existing workflow, and no extra step is required.

Challenge 2: Minimizing developer friction with a Gradle plugin

We did not want to introduce a process that adds cognitive load. Migrating all module declarations to a new settings.gradle file would require every team to change their workflow. Instead, we adopted a more elegant approach.

The include shadow trick

In a standard Android project, modules are declared in settings.gradle using the include function:

include 'app'
include 'payment'
include 'food'
// ... hundreds more

The include function is part of the Gradle Settings API. In Groovy, you can define a local closure variable with the same name as an existing method. Since Groovy resolves local variables before delegate methods, the closure effectively shadows the original include method and all subsequent include calls in the script invoke the closure instead.

We created a custom Gradle plugin with a focusInclude function that decides whether to include or exclude a module based on the current focus configuration. By adding just three lines to the top of settings.gradle, we redirect all include calls through our plugin:

// After applying the focus plugin in the buildscript block
def include = { module ->
 com.grab.focus.GradleFocusPluginKt.focusInclude(settings, module)
}
include 'app'
include 'payment'
include 'food'

The rest of the file remains untouched. Every existing include call now passes through focusInclude, which checks whether the module should be loaded based on the developer’s focus selection. If no focus is active, all modules are included as usual with zero behavior change.

This approach meant zero migration effort for feature teams. The settings.gradle file stays as-is, and the plugin integrates seamlessly.

Early implementation: Property-based focus

In the early days of this plugin’s development, the way to specify focus modules was via a Gradle property in the command line:

./gradlew build -Pmodules-to-sync=":app,:payment"

The focusInclude function reads this Gradle property. If present, it activates focus mode and only includes the specified modules (and their transitive dependencies resolved from the graph file). If absent, all modules are included normally.

Challenge 3: Making it seamless with an Android Studio plugin
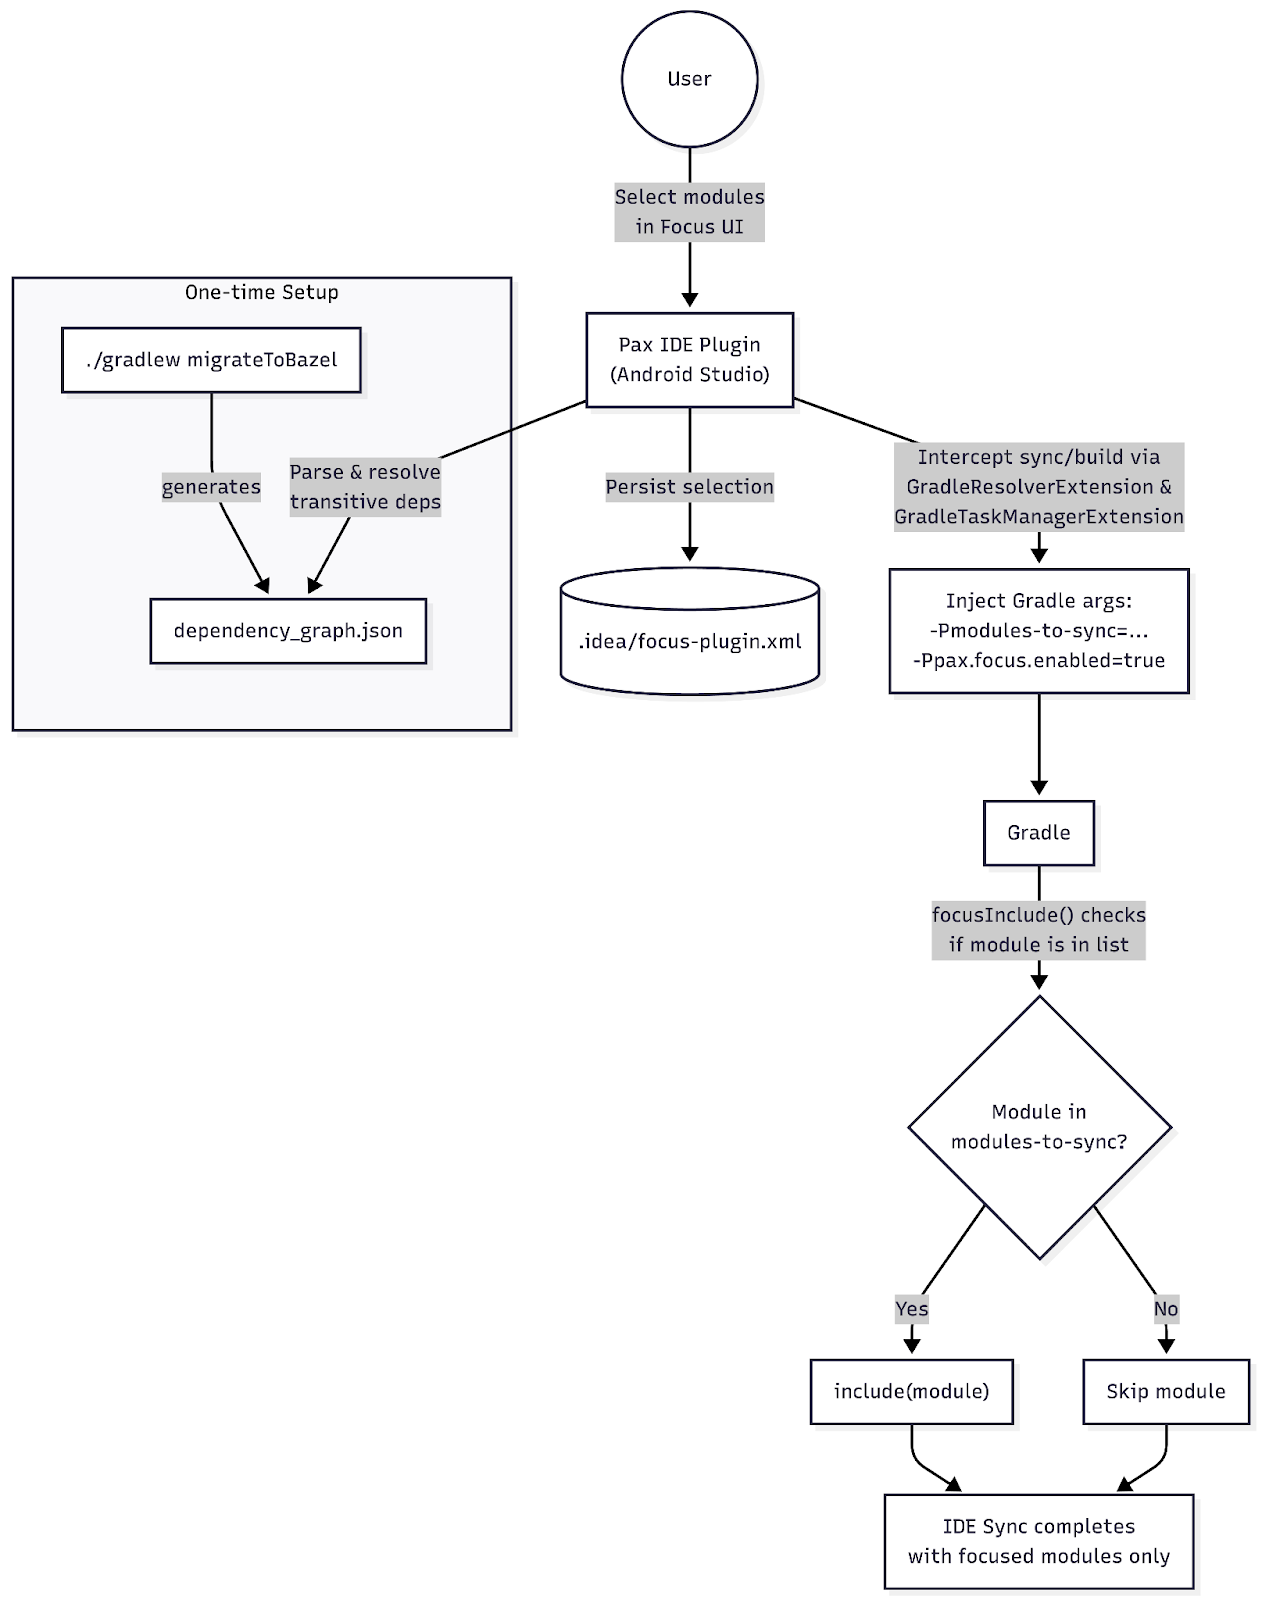
Figure 4. User flow.

Manually passing Gradle properties on the command line was functional but not ideal. We needed a better developer experience. The Gradle property approach opened the door to IDE integration; this led to an Android Studio plugin (an IntelliJ plugin) being built that automates the entire flow through a user interface (UI):

  1. Module selection: The plugin presents a list of all available modules, parsed from the pre-computed dependency graph file. Developers select which modules they want to work on.
  2. Dependency count indicator: Since we have the full dependency graph, the plugin displays how many transitive dependencies each module requires. This gives developers immediate visibility into module “weight” and encourages teams to keep their modules lean.
  3. Automatic argument injection: The plugin uses two IntelliJ Gradle extension points to inject the -Pmodules-to-sync property: a GradleResolverExtension that adds the argument during project sync, and a GradleTaskManagerExtension that injects it before any Gradle task execution (including Compose preview builds). The developer just clicks sync; the plugin handles the rest.
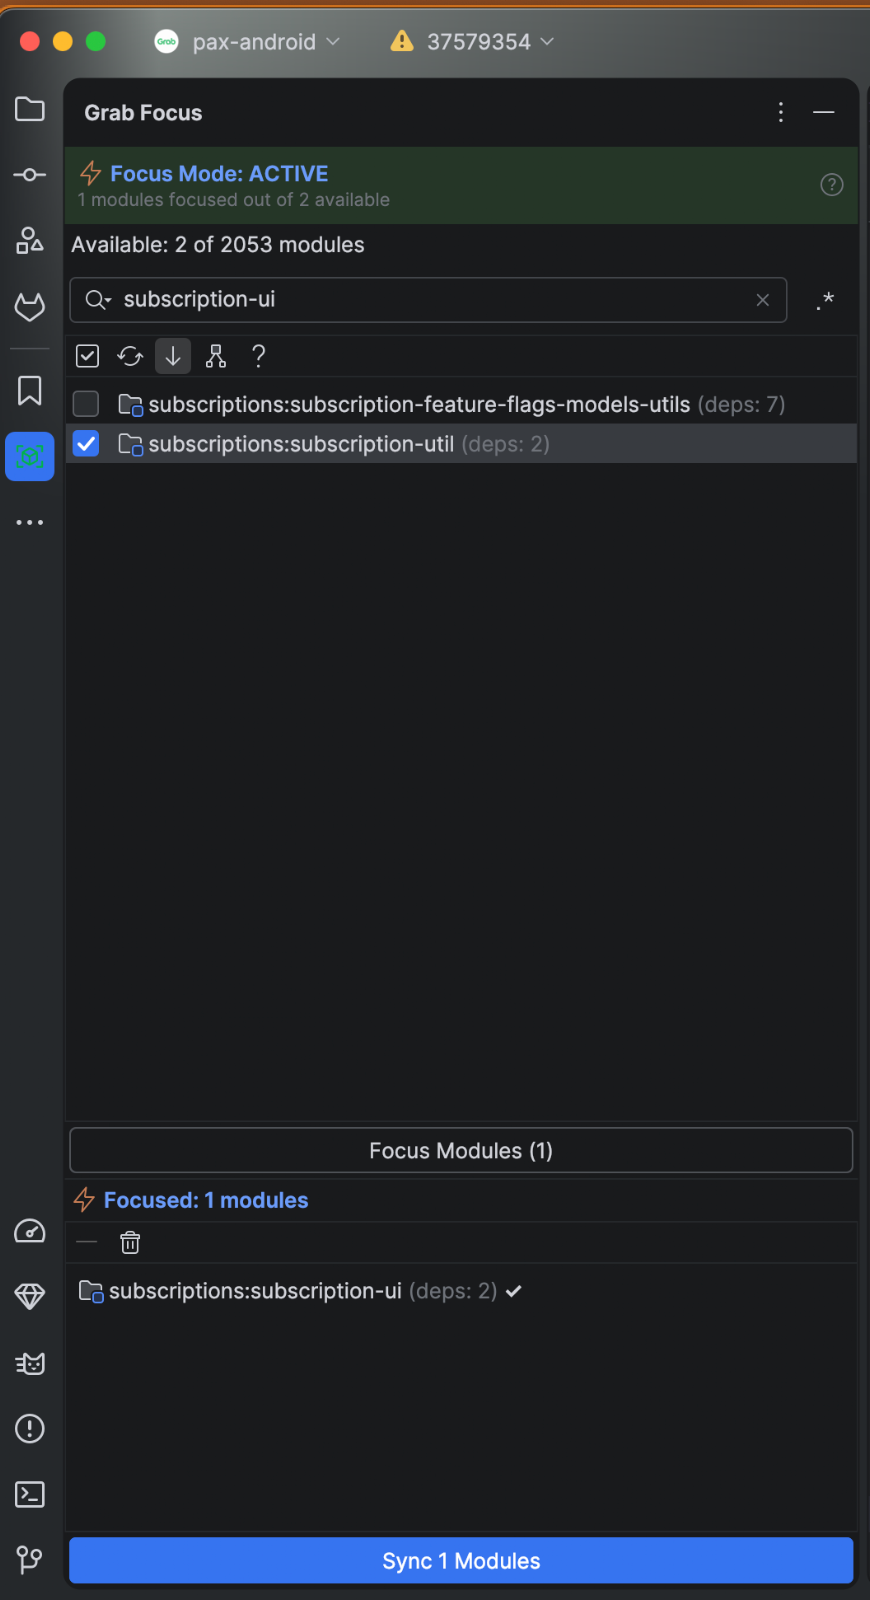
Figure 5. Example of Automatic Argument Injection.

Beyond the core functionality, we added several usability enhancements to the plugin:

  • Indirect focus indicator: Modules that will be synced as a transitive dependency of a focused module are marked as “indirectly focused,” giving developers visibility into exactly what will be loaded.
  • Search and filtering: With hundreds of modules, finding the right one matters. The plugin supports fuzzy matching and regular expression (regex) search to quickly narrow down the module list.
  • Sort by dependency count: Modules can be sorted by name or by dependency count, making it easy to spot the heaviest modules at a glance.
  • Status bar widget: A persistent “Focus: X/Y” indicator in the IDE status bar shows how many modules are currently focused out of the total, with a click-through to the Focus tool window.
  • State persistence: The developer’s focus selection is saved and restored between IDE sessions, so they do not need to reselect modules after restarting Android Studio.

Encouraging lean module architecture

An unplanned but welcome side effect of the focus plugin was that it nudged teams toward a cleaner module architecture. With dependency counts now visible in the IDE, developers became more aware of their module’s size, which in turn encouraged a clearer separation between interface and implementation.

  • Interface module (e.g., :payment-api): Contains only the public API definitions (interfaces, data classes, contracts). This is the module that other teams depend on. Because it has no implementation details, it carries very few transitive dependencies.
  • Implementation module (e.g., :payment-impl): Contains the actual implementation of those interfaces. This module typically has a larger dependency footprint, but only the owning team needs to load it.

By depending on the interface module rather than the implementation module, teams avoid pulling in a large tree of transitive dependencies. This keeps the dependency count low for consumers, which directly translates to faster focus sync times and leaner Compose preview builds.

How we measure

Instrumentation: The PAX IDE plugin

The PAX IDE plugin is a mandatory install for every PAX Android engineer in Grab. This gives us a consistent, organization-wide data collection baseline without requiring any opt-in. The plugin registers four IntelliJ Platform listeners that automatically capture metrics on every relevant IDE event:

IntelliJ API What it tracks
GradleSyncListenerWithRoot Sync time
ProjectIndexingActivityHistoryListener Indexing time
ProjectIndexingActivityHistoryListener Scanning time
PerformanceListener IDE freezes

Each metric event is enriched with shared context captured at event time: IDE version and build number, heap memory usage, focus state (enabled/disabled, number of focused modules), Operating System (OS) info, and project name. This means every data point is automatically segmented by whether focus mode was active, which is exactly what we need for before/after comparisons.

What each metric captures

  • Sync time: We implement GradleSyncListenerWithRoot and calculate wall-clock duration from syncStarted() to syncSucceeded() or syncFailed(). This covers the full Gradle configuration, dependency resolution, and IDE model generation phase.

  • Indexing time: ProjectIndexingActivityHistoryListener.onFinishedDumbIndexing() provides a ProjectDumbIndexingHistory object. We read history.times.totalUpdatingTime, the time IntelliJ spent updating its symbol index after the sync.

  • Scanning time: ProjectIndexingActivityHistoryListener.onFinishedScanning() provides a ProjectScanningHistory object. We read history.times.totalUpdatingTime and history.times.scanningType (full vs. partial) for additional segmentation.

  • IDE freezes: PerformanceListener.uiFreezeFinished(durationMs) is called by the platform whenever the Event Dispatch Thread (EDT) is blocked long enough to be classified as a freeze. The duration arrives directly as a parameter.

  • IDE memory usage: Captured at the moment of each metric event via Runtime.getRuntime(). Captures used memory (totalMemory – freeMemory) and max heap. Attached to every event as part of the shared context.

  • IDE version: From ApplicationInfo.getInstance(), captures version name, full version string, and build number. Also attached to every event, enabling per-version breakdowns.

Survey

After each successful sync, the plugin triggers an in-IDE notification prompting developers to fill out a short survey. The notification respects developer attention; it uses a weekly reset cycle with a “Don’t remind me again” option that appears after the second prompt. These periodic qualitative check-ins complement the telemetry data and help surface pain points that raw numbers alone may not capture.

Establishing the baseline

The plugin collects focus_enabled on every event. Therefore, baseline numbers come directly from the same pipeline; they are simply the subset of metric events where focus_enabled = false. This means the before/after comparison is an apples-to-apples measurement from the same instrumentation, same engineers, same codebase, with no separate manual benchmarking required.

Results

Compose preview build

The focus approach also improved Jetpack Compose preview builds. Compose previews require a module build to render, and with fewer modules loaded, the IDE has significantly less indexing overhead. A typical UI module has just 5–10 local dependencies. With the focus plugin, a developer configures only those modules instead of all 2,000. Developers consistently report that Compose previews feel significantly more responsive in focus mode.

As a best practice, we recommend that teams separate their UI into dedicated modules containing only composable functions and minimal dependencies. This maximizes the benefit of focus mode for preview builds.

Memory usage

In focus mode, excluded modules are not configured by Gradle and not indexed by the IDE, significantly reducing both build-process and editor memory consumption from approximately 10 GB down to 2 GB. This frees up memory for Bazel builds and other tooling. Developers reported fewer freezes, faster code navigation, and more responsive autocompletion.

Sync time

We observed a dramatic reduction in per-sync IDE sync time. A full sync previously took around 26 minutes at the 95th percentile (p95). With the Focus plugin, sync times dropped to under 2 minutes for typical feature work. The p95 remains higher for modules with deep dependency trees, but in practice, sync times vary significantly depending on module size. A typical UI module with 5 to 10 dependencies syncs in roughly 2 minutes, while heavier modules with deep dependency graphs take longer. For most developers working on focused feature work, the improvement is dramatic.

Tradeoffs

Focus mode does come with limitations. IDE features like “Find Usages” and cross-module refactoring only cover the focused modules; developers occasionally need to expand their focus set or temporarily switch to a full sync for repo-wide operations. In practice, this has been a minor inconvenience compared to the productivity gained.

Conclusion

IDE sync time is one of those problems that slowly degrades the developer experience without a single dramatic breaking point.

Our solution combined three key ideas:

  • Reuse existing infrastructure: By generating the dependency graph during migrateToBazel, we eliminated the expensive Gradle configuration phase without adding a new build step.

  • Minimize adoption friction: The Groovy include shadow trick let us integrate the focus mechanism with just three lines of code, requiring zero changes from feature teams.

  • Invest in user experience (UX): The Android Studio plugin turned a manual, error-prone process into a one-click operation with useful module health indicators.

The results spoke for themselves. IDE sync time dropped from 35 minutes to under 1 minute (depending on module size). IDE memory consumption fell from 10 GB down to 2 GB, freeing up headroom for Bazel builds to run alongside the IDE. Compose preview update times improved significantly due to reduced indexing overhead. And adoption was frictionless. Engineers went from a manual, multi-step process to a simple Select → Focus → Sync flow with native IntelliJ integration.

As the codebase continues to grow, accelerated by AI-assisted development and a broader contributor base, we are also investing in guardrails to keep quality in check. An area we are actively exploring is using skills.md to guide AI coding agents when they generate new modules, encoding architectural conventions and dependency rules directly into the context that AI tools consume. This helps ensure that AI-generated code lands in the right shape from the start, rather than accumulating structural debt that compounds the sync and build problems described above.

Join us

Grab is a leading superapp in Southeast Asia, operating across the deliveries, mobility, and digital financial services sectors, serving over 900 cities in eight Southeast Asian countries: Cambodia, Indonesia, Malaysia, Myanmar, the Philippines, Singapore, Thailand, and Vietnam. Grab enables millions of people every day to order food or groceries, send packages, hail a ride or taxi, pay for online purchases or access services such as lending and insurance, all through a single app. We operate supermarkets in Malaysia under Jaya Grocer and Everrise, which enables us to bring the convenience of on-demand grocery delivery to more consumers in the country. As part of our financial services offerings, we also provide digital banking services through GXS Bank in Singapore and GXBank in Malaysia. Grab was founded in 2012 with the mission to drive Southeast Asia forward by creating economic empowerment for everyone. Grab strives to serve a triple bottom line. We aim to simultaneously deliver financial performance for our shareholders and have a positive social impact, which includes economic empowerment for millions of people in the region, while mitigating our environmental footprint.

Powered by technology and driven by heart, our mission is to drive Southeast Asia forward by creating economic empowerment for everyone. If this mission speaks to you, join our team today!
Demystifying user journeys: Revolutionizing troubleshooting with auto tracking

Post Syndicated from Grab Tech original https://engineering.grab.com/auto-track-sdk

Introduction

Troubleshooting critical issues by deciphering a user’s journey on the Grab app is an extremely challenging task. With countless user journeys and multiple paths through the User Interface (UI), it’s akin to searching for a needle in a vast haystack. This challenge frequently resonates with us, the dedicated developers at Grab, as we strive to understand user behaviors, views, and interactions.

The challenge

The distinction between resolving an issue effectively versus spending hours on a wild goose chase is understanding our user journey in real-time.

The development team initially attempted to address the issue of the incomplete user journey tracking by implementing a system where a click stream event would be sent with every user interaction. However, this approach presented significant challenges due to the sheer volume of UI components—often numbering in the hundreds—and the reliance on individual developers to correctly instrument each one.

A common pitfall was that developers would occasionally overlook or forget to instrument certain user interactions, leading to breaks in the recorded user journey. This created a highly frustrating situation for both the development and product teams, as the integrity of the user journey data was consistently compromised. Despite continuous efforts to patch these bugs and address the omissions, the team found themselves in a perpetual state of reaction, constantly trying to catch up with newly discovered breaches rather than proactively preventing them. This reactive approach consumed valuable resources and hindered the ability to gain a complete and accurate understanding of user behavior.

Diagnosing system failures, application bugs, or poor user experiences in complex applications becomes inefficient without real-time performance metrics and detailed session tracking. When engineering teams rely on outdated or fragmented data, they are forced to piece together issue narratives reactively, long after the issues occur. This significantly delays the Mean Time To Resolution (MTTR). Such a reactive approach leads to increased downtime, higher operational costs, customer dissatisfaction, and a waste of developers’ time, as they spend more time “hunting” for clues rather than deploying solutions or new features.

Our ‘Eureka’ moment: AutoTrack SDK

The pivotal breakthrough that provides our unique advantage was the creation of auto tracking user journeys—our “Eureka” moment. To deliver this, we developed the new Software Development Kit (SDK) called AutoTrack.

AutoTrack is system that comprehensively records application state, UI view state, as well as user interactions – a solution that pieces together a chronicle of the user journey, from launch to interactions, as they navigate through the screens. AutoTrack SDK is built on the three core pillars:

  1. Application state
  2. User interactions
  3. UI screens

Let’s delve deeper into the mechanics of how this operates.

Application state

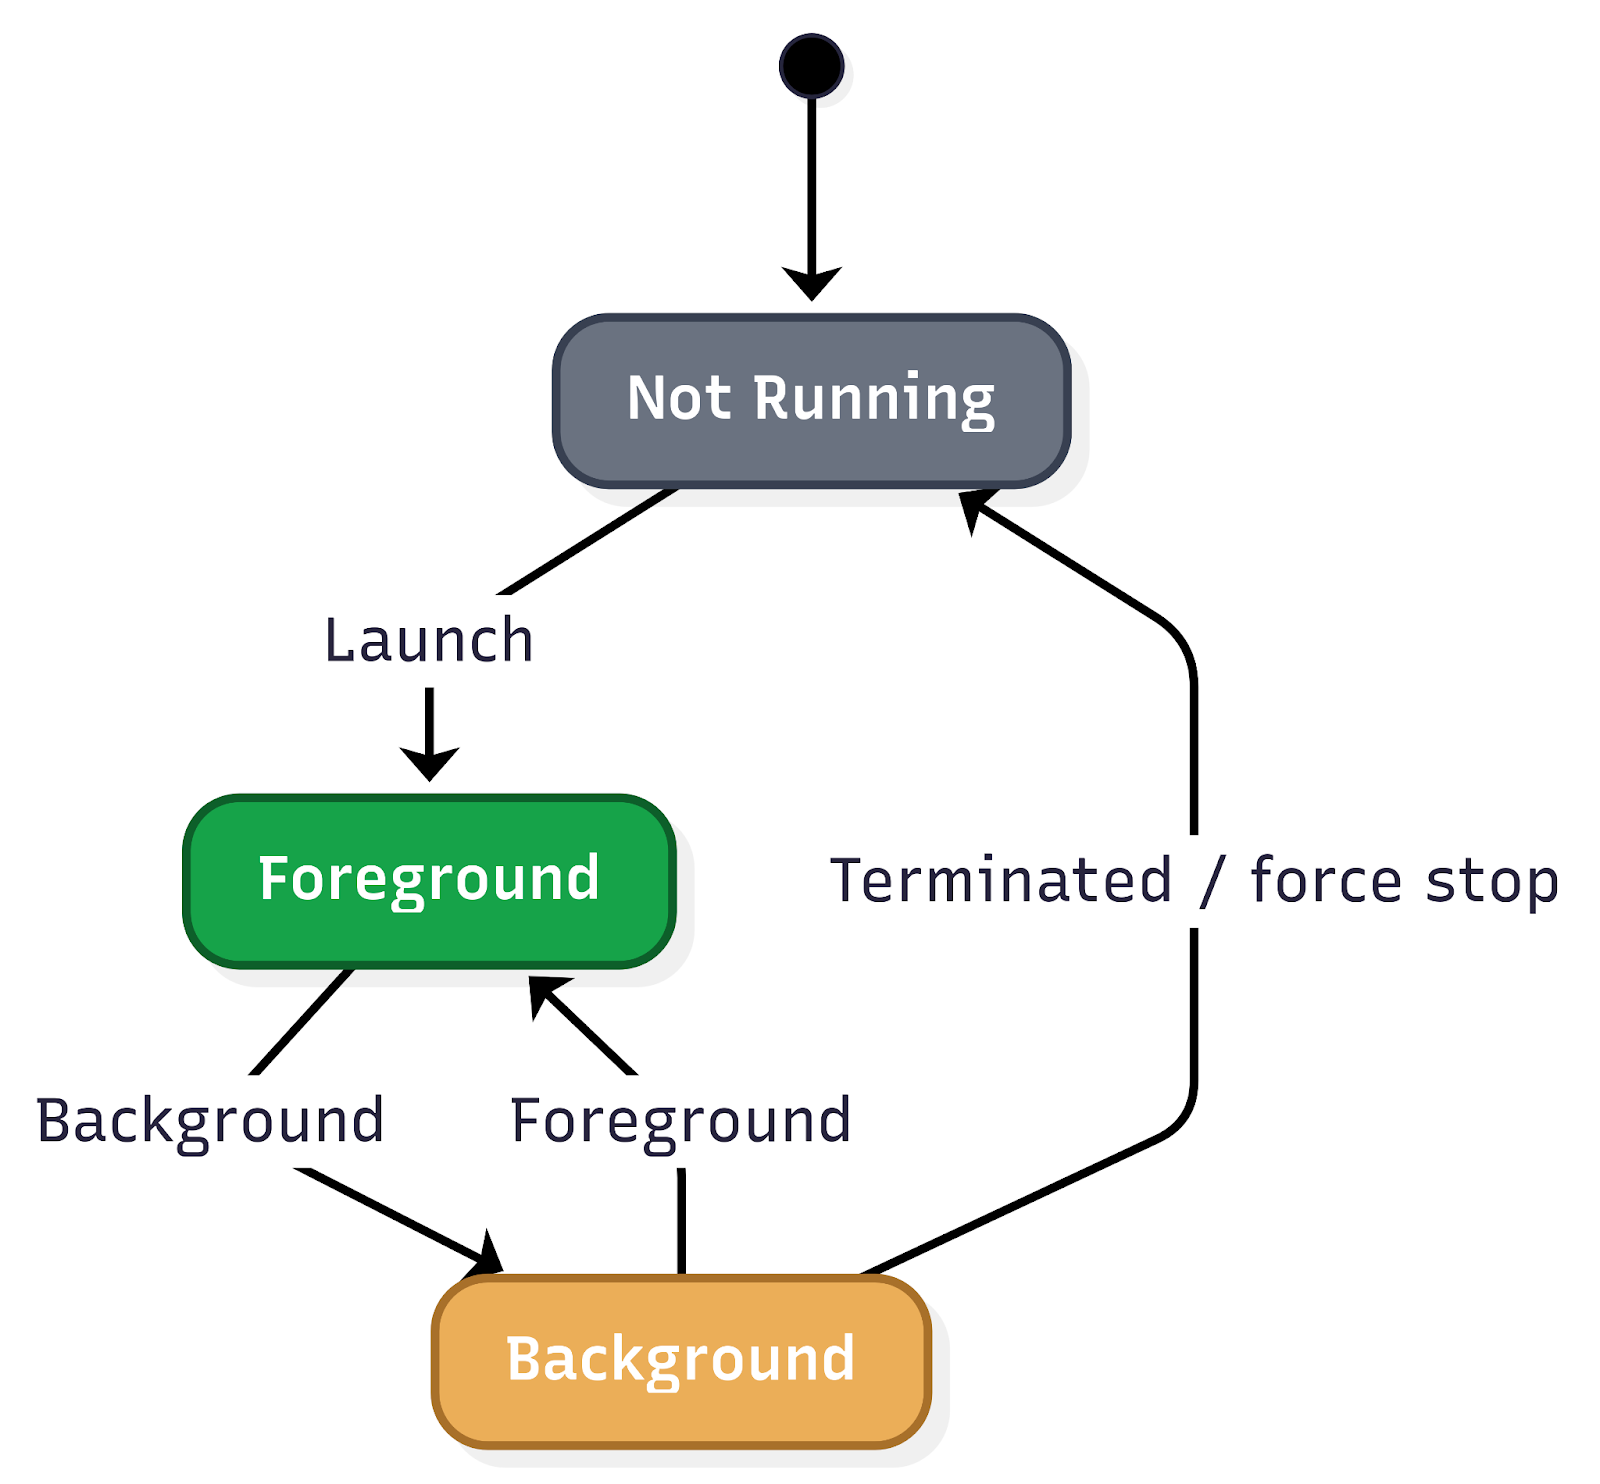
Understanding the application state is fundamental to comprehending user behavior and, consequently, executing effective troubleshooting. The application state provides crucial insights into how a user interacts with the app, particularly concerning its visibility and how it was initiated. This encompasses tracking when the app moves between the background and foreground, as well as the various launch mechanisms.

Figure 1. Application state user flow.

Key aspects of application state that are vital to monitor include:
Application lifecycle transitions:

  • Background state: When the app is running but not actively displayed to the user (e.g., the user switches to another app, or the device is locked). Understanding how frequently and for how long an app resides in the background can inform power consumption analysis and the effectiveness of background tasks.
  • Foreground state: When the app is actively in use and displayed to the user. Monitoring transitions into and out of the foreground provides a real-time view of user engagement.
  • Inactive state: A temporary state where the app is in the foreground but not receiving events (e.g., an incoming call temporarily interrupts the app).
  • Suspended state: An app that is in the background and has been explicitly suspended by the operating system to free up resources.
  • Terminated state: When the app has been completely closed or crashed. Differentiating between intentional termination and crashes is critical for identifying stability issues.

Application launch mechanisms:

The way an app is launched significantly impacts the initial user experience and can influence subsequent interactions. Tracking these different launch types is essential for understanding user entry points and for debugging issues that might be specific to a particular launch method.

  • Explicit user launch: This is the most straightforward launch mechanism, where the user directly taps on the app icon from their device’s home screen or app drawer. This indicates a deliberate intent to use the app and often signifies a primary entry point for regular users.
  • Deeplinks: Deeplinks are URLs that, when clicked, open a specific page or section within a mobile app rather than a web page. They are powerful tools for enhancing user experience and engagement by providing direct access to relevant content.
  • Push notifications: Push notifications are messages sent by an app to a user’s device even when the app is not actively in use. Tapping on a push notification often launches the app and directs the user to a specific context related to the notification’s content.
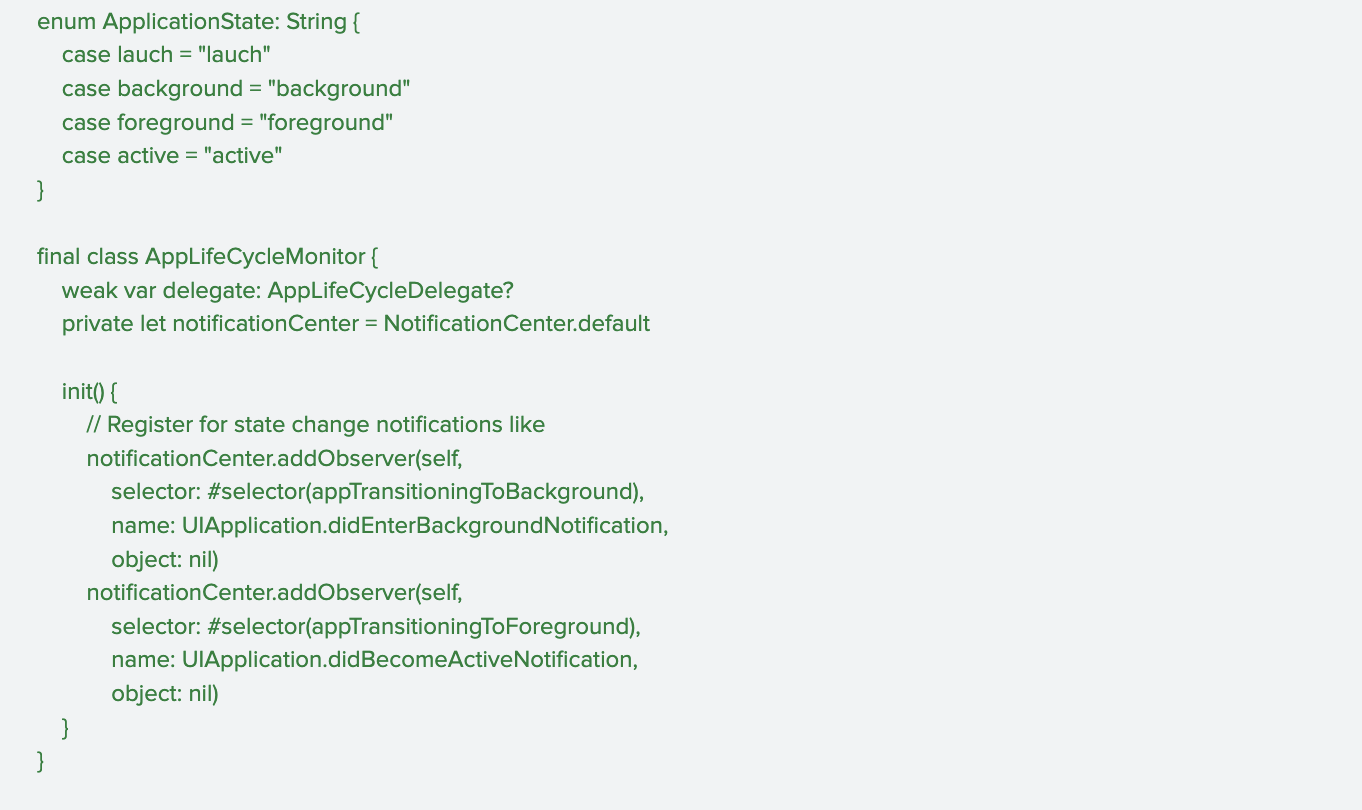
Figure 2. Code sample for tracking application lifecycle transition.

User interactions

Real-time session tracking is a crucial component in understanding user behavior and optimizing app performance. By meticulously tracking a wide array of user interactions, the system provides invaluable insights into how users navigate and engage with the app. This granular data forms the bedrock for constructing comprehensive user journeys, allowing development teams to visualise the path a user takes from their initial entry point to achieving their goals within the app.

This deep understanding of user interactions is the most important pillar in creating accurate and insightful user journey maps. These maps, in turn, are instrumental in identifying patterns of user behavior, both positive and negative. For instance, tracking helps to identify pain points, bugs, or areas of confusion that might lead to user frustration or abandonment.

Figure 3. Sample code for real-time session tracking.

UI screen

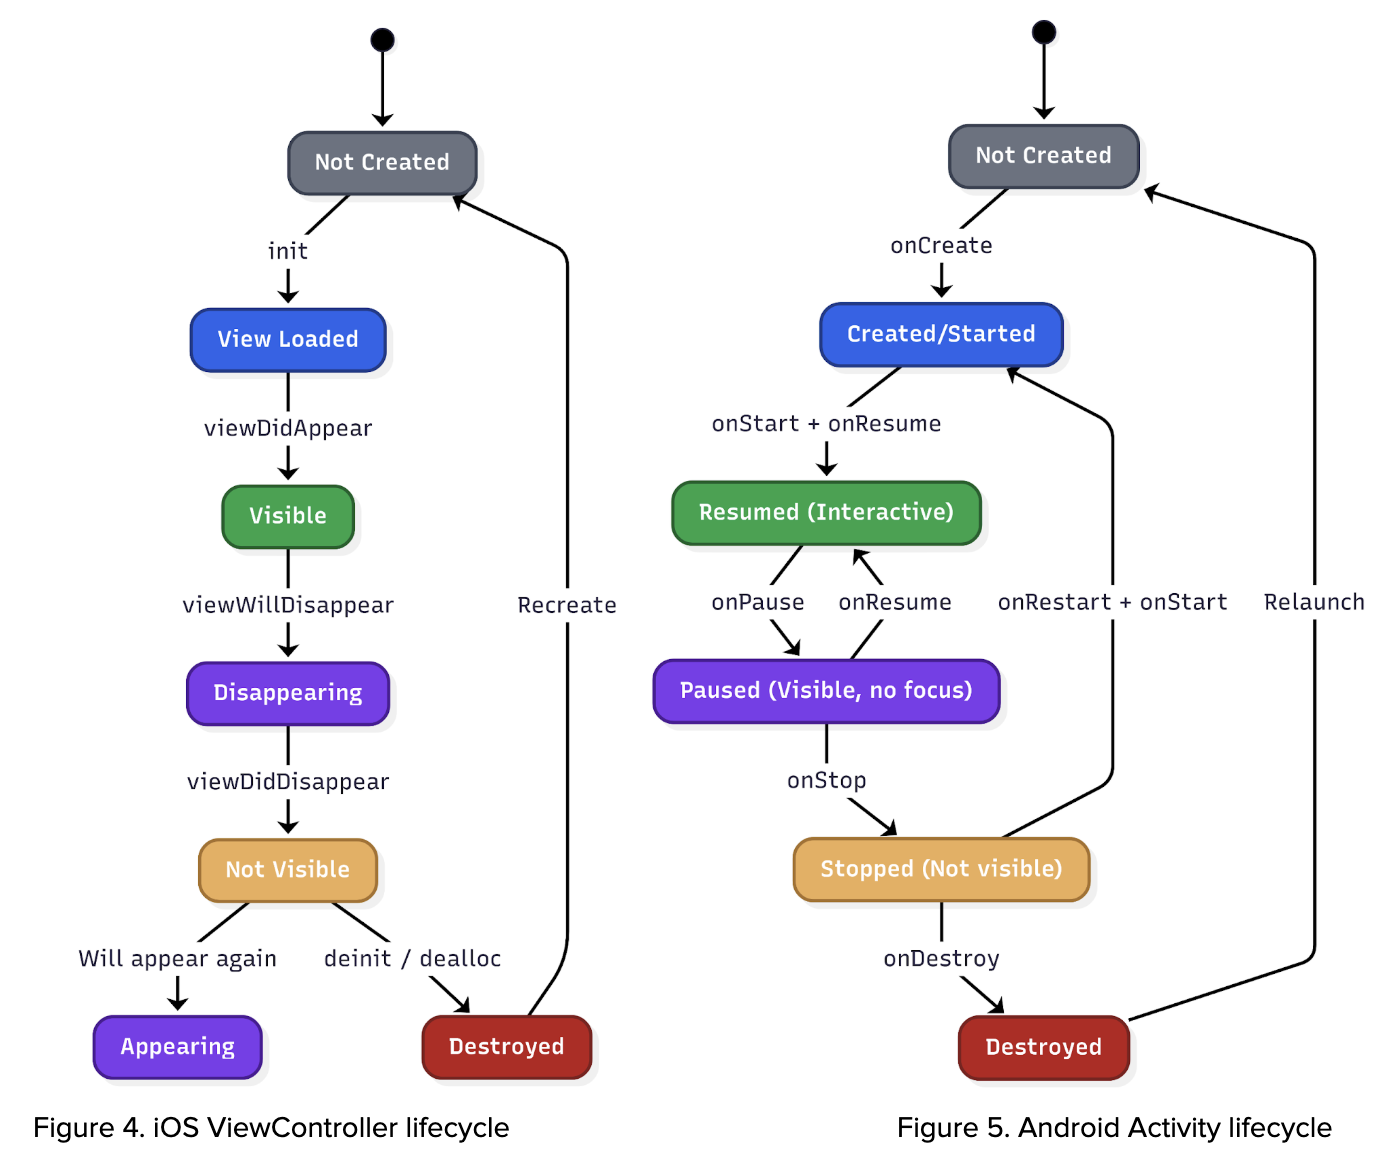
The system leverages lifecycle events from UIViewController (iOS), Activity (Android), and Fragments (Android) to accurately identify and track which specific screen is currently displayed to the user. This granular level of screen tracking is crucial because it significantly enriches the contextual information available to us. By understanding the precise UI that users are interacting with, we can account for the dynamic nature of our app. Different geographical regions, diverse user segments, and varying operational scenarios can lead to distinct user interfaces being presented. This capability ensures that our analysis and troubleshooting efforts are always based on the actual user experience, allowing for more precise problem identification and more effective solutions.

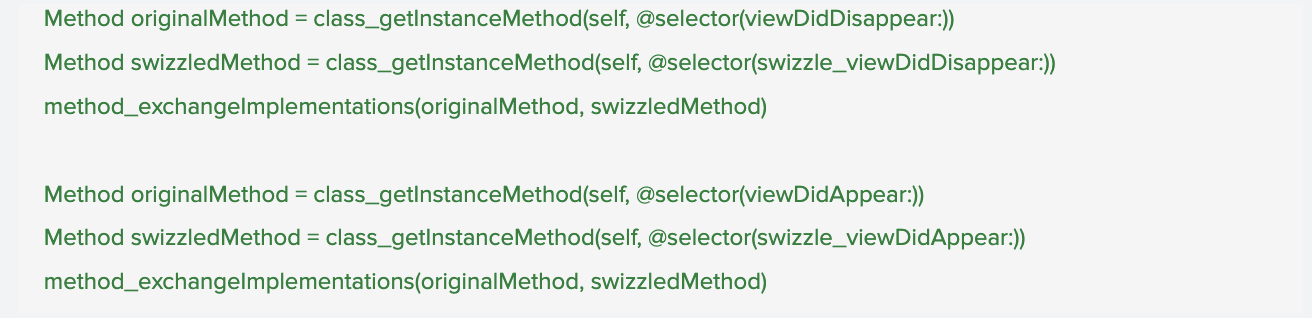
Figure 6. Sample code of UIViewController configuration.

UI screen data

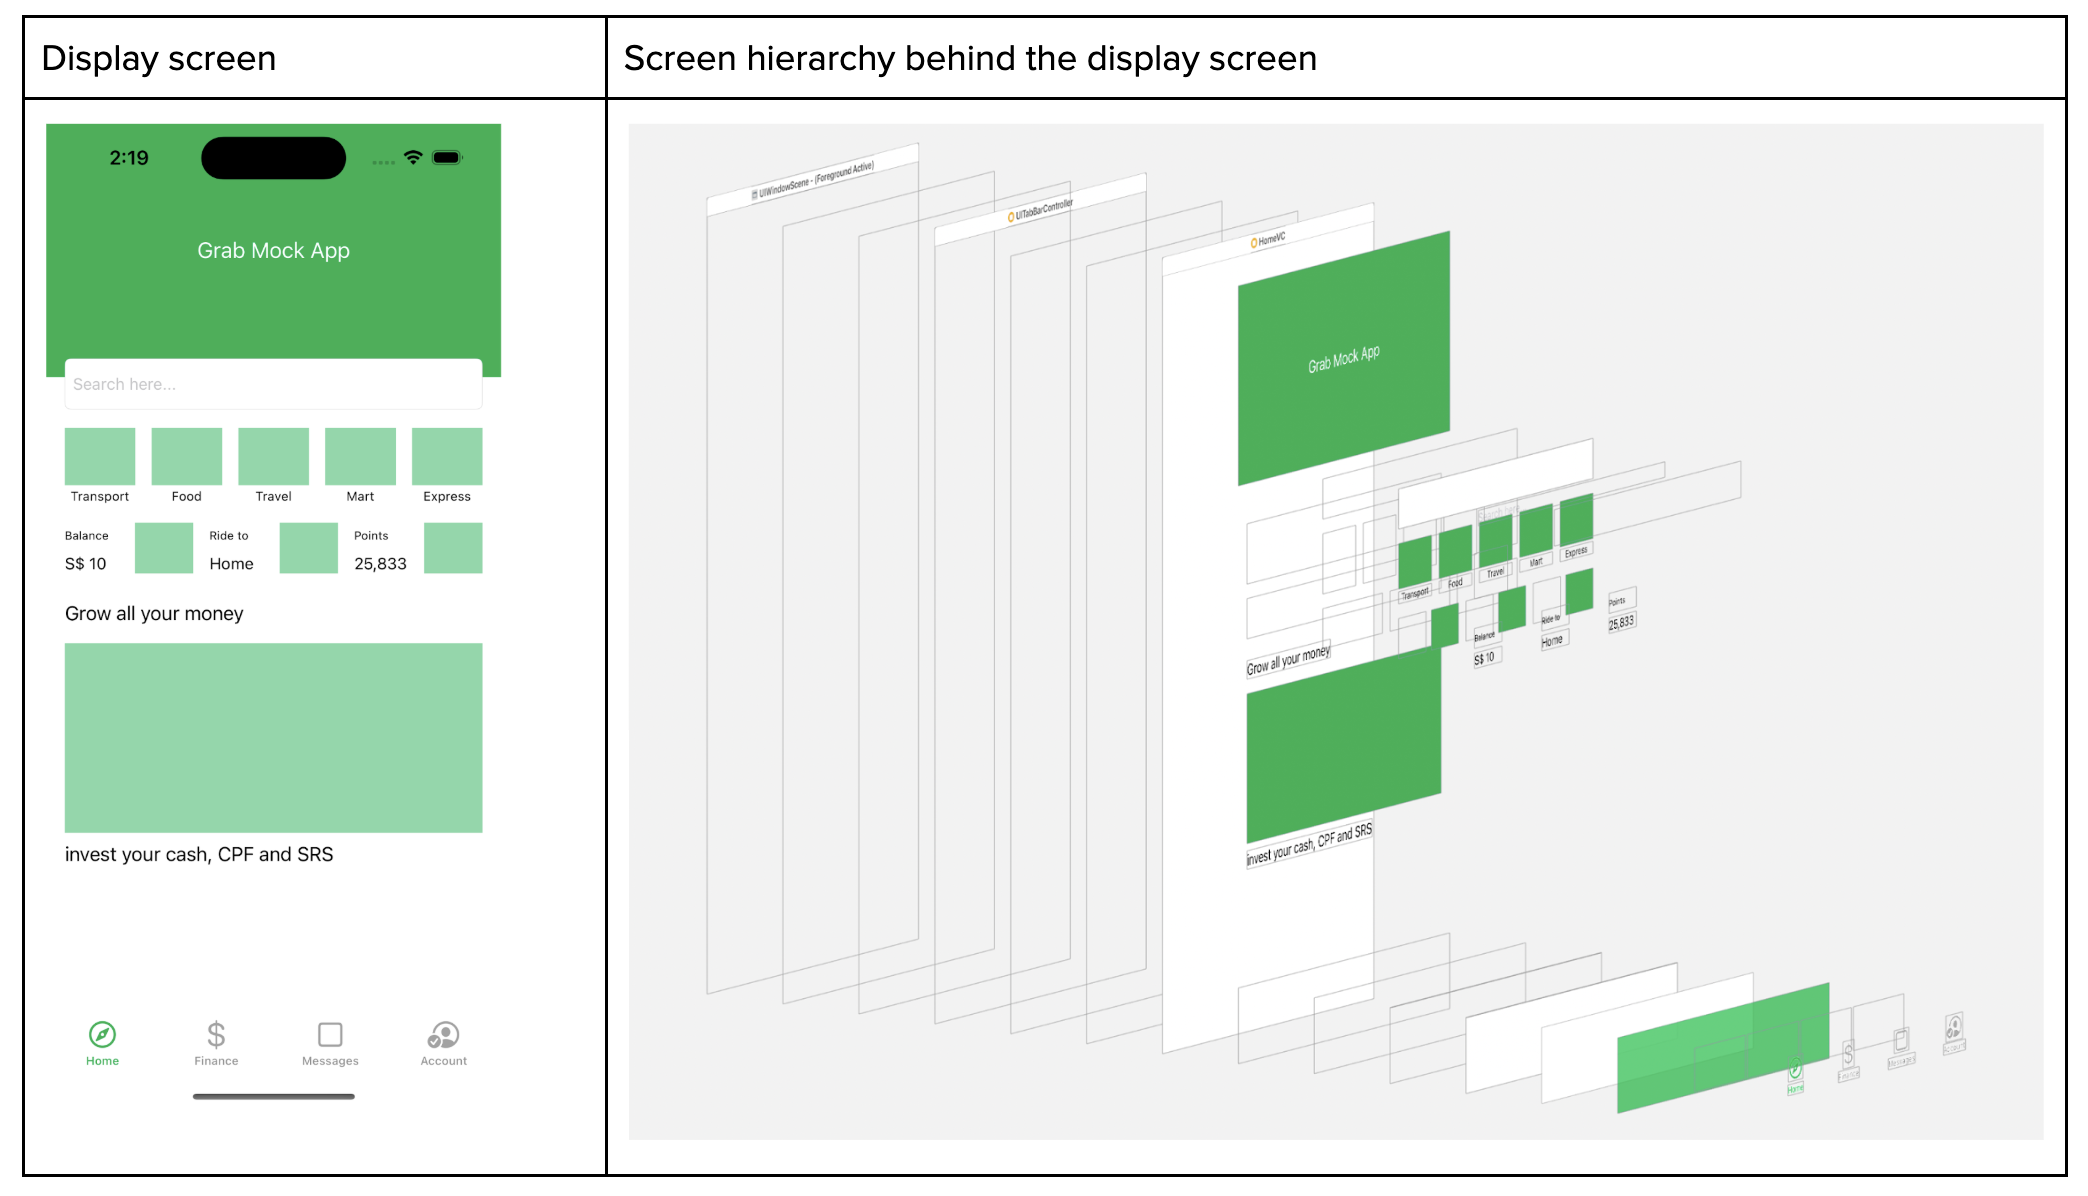
On top of that, whenever the screen appears, we capture the screen metadata where we read the full screen hierarchy. With the Screen hierarchy JSON data at hand, we employ it to train an AI model. This model, consequently, can generate an HTML file, which mirrors the user’s screen and interaction.

Disclaimer: information is redacted in compliance with GDPR/PDPA, personal data protection laws.

Figure 7. Screen hierarchy.

Applications of AutoTrack

Key applications of AutoTrack data:

  • Reconstructing user journeys and reproducing elusive bugs: One of the most significant benefits of AutoTrack is its ability to meticulously record user interactions within the app. This detailed session data allows our teams to precisely recreate the user journey that led to a reported issue. For bugs that are notoriously difficult to reproduce, this capability is a game-changer, eliminating hours of manual guesswork and dramatically accelerating the identification and resolution of underlying problems.
  • Automated issue assignment: When an issue is reported, AutoTrack data can be leveraged to automatically assign it to the most relevant team. By analysing the context of the issue within the recorded session, including the specific features or modules involved, the system can intelligently route the problem to the engineers best equipped to address it. This automation reduces triage time, ensures issues are handled by subject matter experts, and improves overall response efficiency.
  • Automating UI test case generation: The rich dataset provided by AutoTrack offers a powerful foundation for automating the creation of UI test cases. By observing how users interact with the interface, we can automatically generate test scripts that mimic real-world usage patterns. This not only speeds up the testing phase but also leads to more comprehensive test coverage, identifying edge cases and user flows that might otherwise be missed by manually written tests.
  • Understanding analytics event triggers: AutoTrack data provides a granular view into when and why specific analytics events are triggered within the application. This allows us to validate the accuracy of our analytics instrumentation, ensure that events are firing as expected, and gain deeper insights into user behavior. By understanding the precise context surrounding event triggers, we can refine our data collection strategies and derive more meaningful insights from our analytics.

Key takeaways and what’s next

AutoTrack replaces fragile manual instrumentation with a unified, real-time view of application state, screen context, and user interactions. That end-to-end trace makes elusive bugs reproducible, routes issues to the right owners, and seeds reliable UI tests—turning guesswork into grounded evidence so teams can ship fixes faster and with greater confidence.

Looking ahead, we are expanding AutoTrack across surfaces and deepening the context it captures—pairing sessions with network and performance signals, strengthening privacy guardrails, and integrating with automated triage and test generation. Look forward to reading more of our deep dives on auto-generated UI tests and how these journeys will power proactive quality across Grab’s app.

Join us

Grab is a leading superapp in Southeast Asia, operating across the deliveries, mobility and digital financial services sectors. Serving over 800 cities in eight Southeast Asian countries, Grab enables millions of people everyday to order food or groceries, send packages, hail a ride or taxi, pay for online purchases or access services such as lending and insurance, all through a single app. Grab was founded in 2012 with the mission to drive Southeast Asia forward by creating economic empowerment for everyone. Grab strives to serve a triple bottom line – we aim to simultaneously deliver financial performance for our shareholders and have a positive social impact, which includes economic empowerment for millions of people in the region, while mitigating our environmental footprint.

Powered by technology and driven by heart, our mission is to drive Southeast Asia forward by creating economic empowerment for everyone. If this mission speaks to you, join our team today!

Put Zabbix at your Fingertips with the IntelliTrend Mobile App

Post Syndicated from Wolfgang Alper original https://blog.zabbix.com/put-zabbix-at-your-fingertips-with-the-intellitrend-mobile-app/31830/

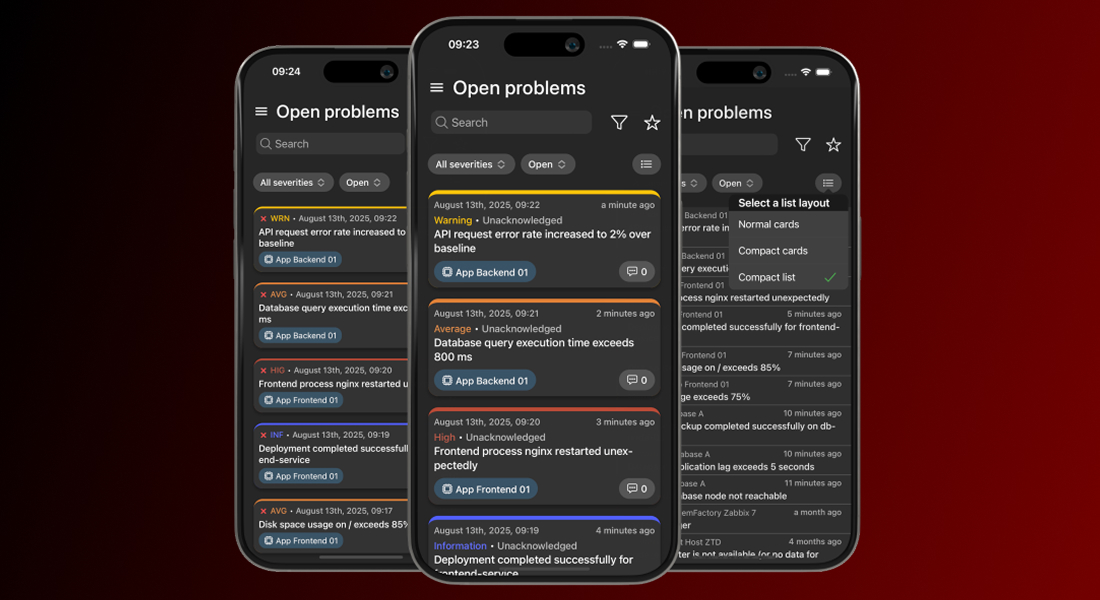
The official Zabbix frontend works great on desktop, but it isn’t built for mobile. Monitoring doesn’t end when you step away from your workstation, and a reliable Zabbix mobile app keeps you connected to your Zabbix environment, gives you instant notifications, and allows you to react to problems or just check your host configuration at any time.

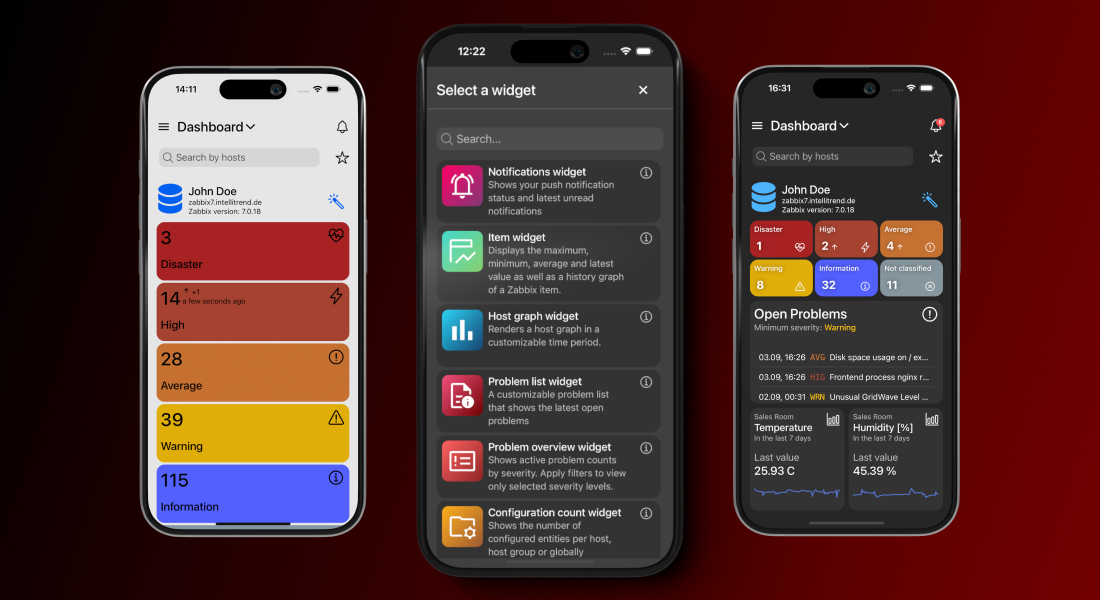
With IntelliTrend Mobile for Zabbix, you get a free, feature-rich mobile app for Zabbix, including real-time push notifications, custom mobile dashboards with unique widgets, built-in responsive host and item graphs, a detailed host viewer, and much more!


Mobile-optimized dashboards

Zabbix dashboards are great and powerful, but they are built for desktop screens and don’t always scale well on mobile devices. IntelliTrend Mobile solves that by giving you the ability to build as many dashboards as you need, each tailored to a specific purpose.

One dashboard can focus on infrastructure health, another on critical issues, and another on a single customer or environment. Every dashboard is an independent workspace, featuring its own layout, collection of widgets, and set of filter criteria.

Grid-based dashboard layout

Every IntelliTrend Mobile dashboard is powered by a grid-based layout system that gives you full control over how your dashboard looks and feels. You are not stuck with fixed widget sizes or a predefined structure – you can place widgets exactly where you want them, drag them around freely, and resize them to give each widget the space it really needs.

This grid system keeps everything orderly without boxing you in. Whether you build a clean, minimal dashboard or pack it with data-rich widgets, the editor helps you shape a layout that looks intentional and stays easy to work with.

Highly customizable widgets

The app offers a variety of unique and customizable widgets, each designed to display key monitoring information clearly and efficiently. Each widget comes with its own set of configuration options, so you can decide what it shows and how it shows it. You can filter widgets by hosts, host groups, severities, and much more in order to keep the view focused on what matters the most to you.

Besides that, widgets let you adjust their appearance by hiding or revealing extra details, switching between compact and extended modes or adjusting how much data they present. The result is a dashboard that is fine-tuned to the way you work.

Smart problem management

When issues happen, speed and context are everything. That’s why problem management is the most important part of any Zabbix mobile app. IntelliTrend Mobile is built to keep you informed the moment something goes wrong and to let you take action without wasting time or switching devices.

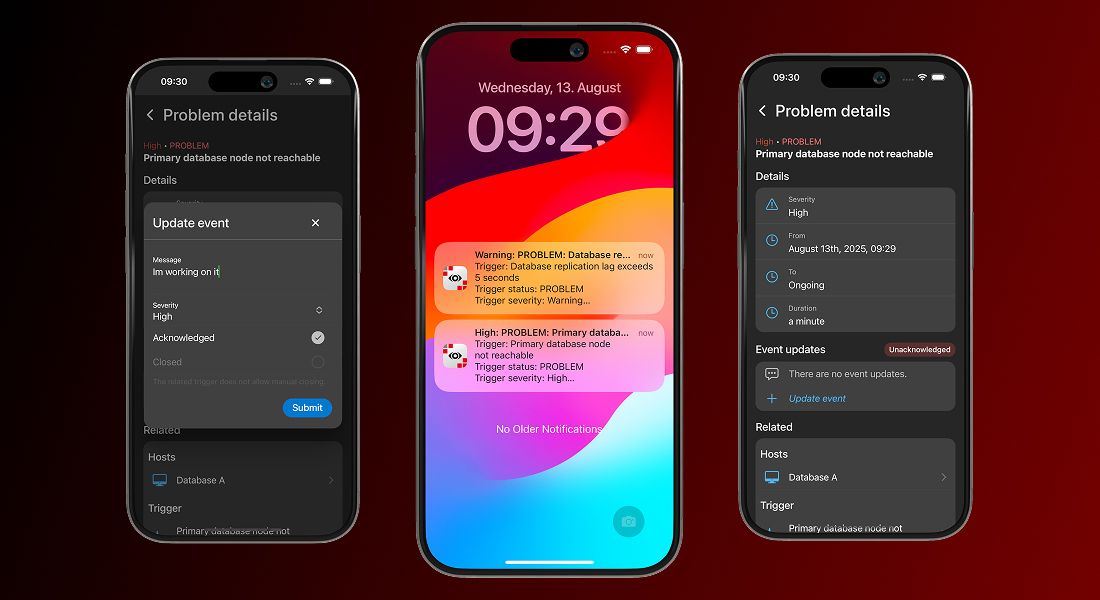
The problem view in the app gives you complete visibility into open and resolved issues, with filtering, sorting, and search options that let you quickly focus on the problems that require your attention. From the same interface, you can update and acknowledge problems without leaving the app.

Opening a problem takes you straight to a detailed view containing all the relevant information – severity, duration, related hosts, triggers, items, and historical data. What makes this view especially powerful is the ability to jump directly from the problem to the related host, item, or trigger within the app.

With a single tap, you can inspect the affected host, review item metrics, or analyze trigger history, all without leaving the mobile environment. This seamless navigation transforms problem management from a static list of alerts into a fully integrated, on-the-go investigation and resolution workflow.

Real-time response with Smart Alerts

The real game-changer, however, is IntelliTrend Mobile’s Smart Alerts feature. This isn’t just push notifications – it’s intelligent, actionable routing straight to the exact problem view in the app.

The moment a problem occurs, you’re notified in real time. Tap the alert and you’re immediately taken to the detailed problem screen. From there, you can analyze the issue, review metrics and history, acknowledge it, or take corrective action without ever opening the Zabbix web interface. No delays, no barriers, no switching devices!

With Smart Alerts, your team reacts faster, stays informed, and keeps systems running smoothly, turning mobile monitoring from passive alerts into active, on-the-go problem management.

Flexible problem list views

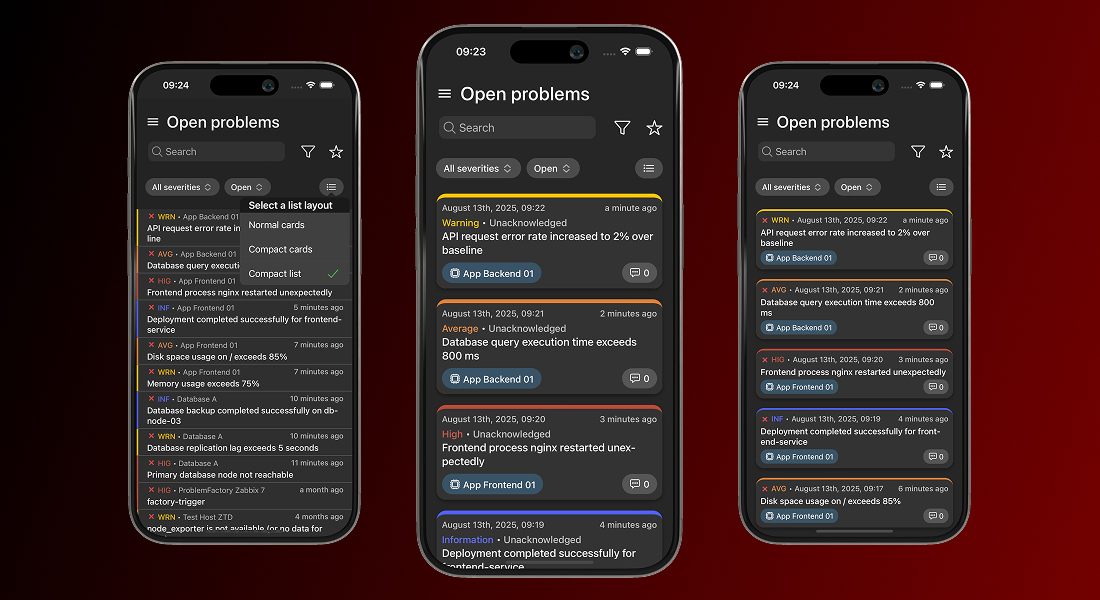
IntelliTrend Mobile lets you choose how problems are displayed in the list. By default, each problem appears as a detailed card showing all relevant information. If you prefer a cleaner overview, you can switch to a compact card view or even a compact list view, for maximum information density.

This flexibility is especially helpful when your Zabbix server generates many problems, allowing you to scan large numbers of problems at a glance while keeping the interface tidy and manageable.

View item and host graphs with mobile-optimized charts

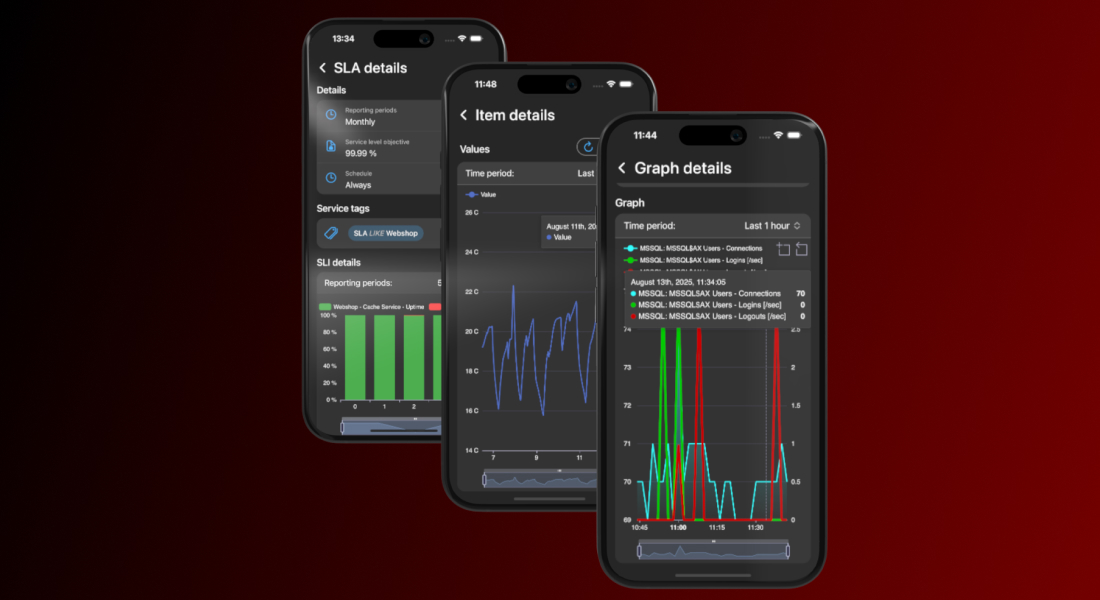
IntelliTrend Mobile reshapes the way you view Zabbix data while you’re on the move. Instead of relying on Zabbix’s static, desktop-focused graphs, the app renders item histories, host graphs, service uptimes, and SLA metrics using fully native, mobile-friendly charts. These charts are responsive, adapting seamlessly to your screen size and orientation for a smooth and clear viewing experience, whether you’re on a phone or tablet.

Every graph is interactive. You can zoom in to inspect a specific time window, pan across the timeline, or hover with your finger to see precise data points. Multiple data series can be toggled on or off, making it easy to focus on the metrics that matter.

You can quickly switch between time periods and pinpoint when an issue started, track its progression, or confirm when it was resolved – without ever opening the Zabbix web interface.

Complete host overview

You can also view all the essential details about any host right from the mobile app. Every host has a detailed view that puts all relevant information at your fingertips, making management simple, efficient, and fully mobile.

For each host, you can quickly see its visible and technical names, current status (enabled or disabled), and maintenance state, including whether data collection continues during maintenance. If the host is monitored by a proxy, you see the proxy that monitors it.

The host details view gives you instant access to all related configurations and objects:

Templates and host groups

You can view all templates assigned to a host and dive into any template’s full details with a single tap, making it easy to understand the monitoring configuration at a glance. Host groups work the same way – just tap a group to see every host it contains, giving you instant insight into related systems.

Host interfaces

IntelliTrend Mobile gives you a complete view of each host interface, including agent, SNMP, JMX, and IPMI types. For every interface, you can see its IP address, DNS name, port, and the interface type configured in Zabbix.

The app also shows the current availability status, highlighting interfaces that are unreachable or experiencing errors. This makes it easy to quickly identify connectivity problems, verify which monitoring protocols are active, and troubleshoot issues with data collection.

Macros

Macros are displayed with full detail (including type, value, and description) so you can verify configuration settings quickly or troubleshoot dynamically, all without leaving the host view.

Inventory

The host inventory view in IntelliTrend Mobile gives you full access to the complete Zabbix host inventory. All inventory fields configured in Zabbix are displayed directly in the app, giving you a complete overview of the host’s recorded details. You can also see the inventory mode for the host (Disabled, Manual, or Automatic) so it’s immediately clear how the inventory is being managed.

Open and resolved problems

From the host details page, you can jump straight into all open or resolved problems related to that specific host. One tap takes you directly to a filtered problem list, making it effortless to review recent problems or check the current state of the host without navigating through multiple menus.

Items, triggers, and graphs

All items, triggers, and graphs tied to the host are just one step away. Each entry opens a filtered list focused solely on that host, letting you move from the host view into any related object instantly. Whether you need to inspect a value, review a trigger, or explore a graph, the app keeps the entire chain of information connected.

Scripts

Execute host scripts directly from your mobile device, whether you’re restarting a service, collecting diagnostics, or triggering an automated workflow. It’s a fast, practical way to take action remotely, enabling real operations work even when you’re away from your desk.

With all these features combined, the host details view becomes a powerful, fully mobile workflow. Everything you need to monitor, analyze, and take action is right at your fingertips, making host management faster, more efficient, and truly on-the-go.

Customize your views

Favorites

You can create favorites for specific hosts or host groups and quickly switch your global scope to focus on them. Once a favorite is active, the app automatically filters all dashboards and list pages to show only data related to that host or host group.

Favorites make it easier to concentrate on the systems you manage most often, so you don’t have to reapply filters or navigate through long lists every time. You can switch between favorites at any time, giving you a fast way to move between different parts of your environment.

Layout modes

Everyone works differently, so the app comes with useful customization options. In addition to the filtering and sorting available on every list page, you can switch between different layout modes for all list pages.

Choose from the standard layout, a compact card layout, or a compact list layout for maximum information density. This lets you decide how much information you want to see at once and allows you to apply layout preferences individually for each page or set them globally in the app settings.

Many more features

The app already supports a wide range of features designed to give you full visibility into your Zabbix environment. Beyond the previously mentioned features, the app includes many more features, such as accessing services and SLAs to keep track of service performance and availability, explore templates, and view triggers, items, and graphs in detail.

But our development doesn’t stop here. We are constantly expanding app functionality and improving existing features based on user feedback. If you haven’t tried the app yet, now is a great time! We’d love to hear your honest thoughts about what works well, what could be better, and which features you’d like to see next. Your feedback helps to shape the future of IntelliTrend Mobile, and we take every suggestion seriously.


Submit feedback

The post Put Zabbix at your Fingertips with the IntelliTrend Mobile App appeared first on Zabbix Blog.

New Way to Covertly Track Android Users

Post Syndicated from Bruce Schneier original https://www.schneier.com/blog/archives/2025/06/new-way-to-track-covertly-android-users.html

Researchers have discovered a new way to covertly track Android users. Both Meta and Yandex were using it, but have suddenly stopped now that they have been caught.

The details are interesting, and worth reading in detail:

Tracking code that Meta and Russia-based Yandex embed into millions of websites is de-anonymizing visitors by abusing legitimate Internet protocols, causing Chrome and other browsers to surreptitiously send unique identifiers to native apps installed on a device, researchers have discovered. Google says it’s investigating the abuse, which allows Meta and Yandex to convert ephemeral web identifiers into persistent mobile app user identities.

The covert tracking—­implemented in the Meta Pixel and Yandex Metrica trackers­—allows Meta and Yandex to bypass core security and privacy protections provided by both the Android operating system and browsers that run on it. Android sandboxing, for instance, isolates processes to prevent them from interacting with the OS and any other app installed on the device, cutting off access to sensitive data or privileged system resources. Defenses such as state partitioning and storage partitioning, which are built into all major browsers, store site cookies and other data associated with a website in containers that are unique to every top-level website domain to ensure they’re off-limits for every other site.

Washington Post article.

Bringing Grab’s Live Activity to Android: Enhancing user experience through custom notifications

Post Syndicated from Grab Tech original https://engineering.grab.com/live-activity-2

In May 2023, Grab unveiled the Live Activity feature for iOS, which received positive feedback from users. Live Activity is a feature that enhances user experience by displaying a user interface (UI) outside of the app, delivering real-time updates and interactive content. At Grab, we leverage this feature to keep users informed about their order updates without requiring them to manually open the app.

While Live Activity is a native iOS feature provided by Apple, there is currently no official Android equivalent. However, we are determined to bring this immersive experience to Android users. Inspired by the success of Live Activity on iOS, we have embarked on design explorations and feasibility studies to ensure the seamless integration of Live Activity into the Android platform. Our ultimate goal is to provide Android users with the same level of convenience and real-time updates, elevating their Grab experience.

Product Exploration

In July 2023, we took a proactive step by forming a dedicated working group with the specific goal of exploring Live Activity on the Android platform. Our mindset was focused on quickly enabling the MVP (Minimum Viable Product) of this feature for Android users. We focused on enabling Grab users to track food and mart orders on Live Activity as our first use-case. We also designed the Live Activity module as an extendable platform, allowing easy adoption by other Grab internal verticals such as the Express and Transport teams.

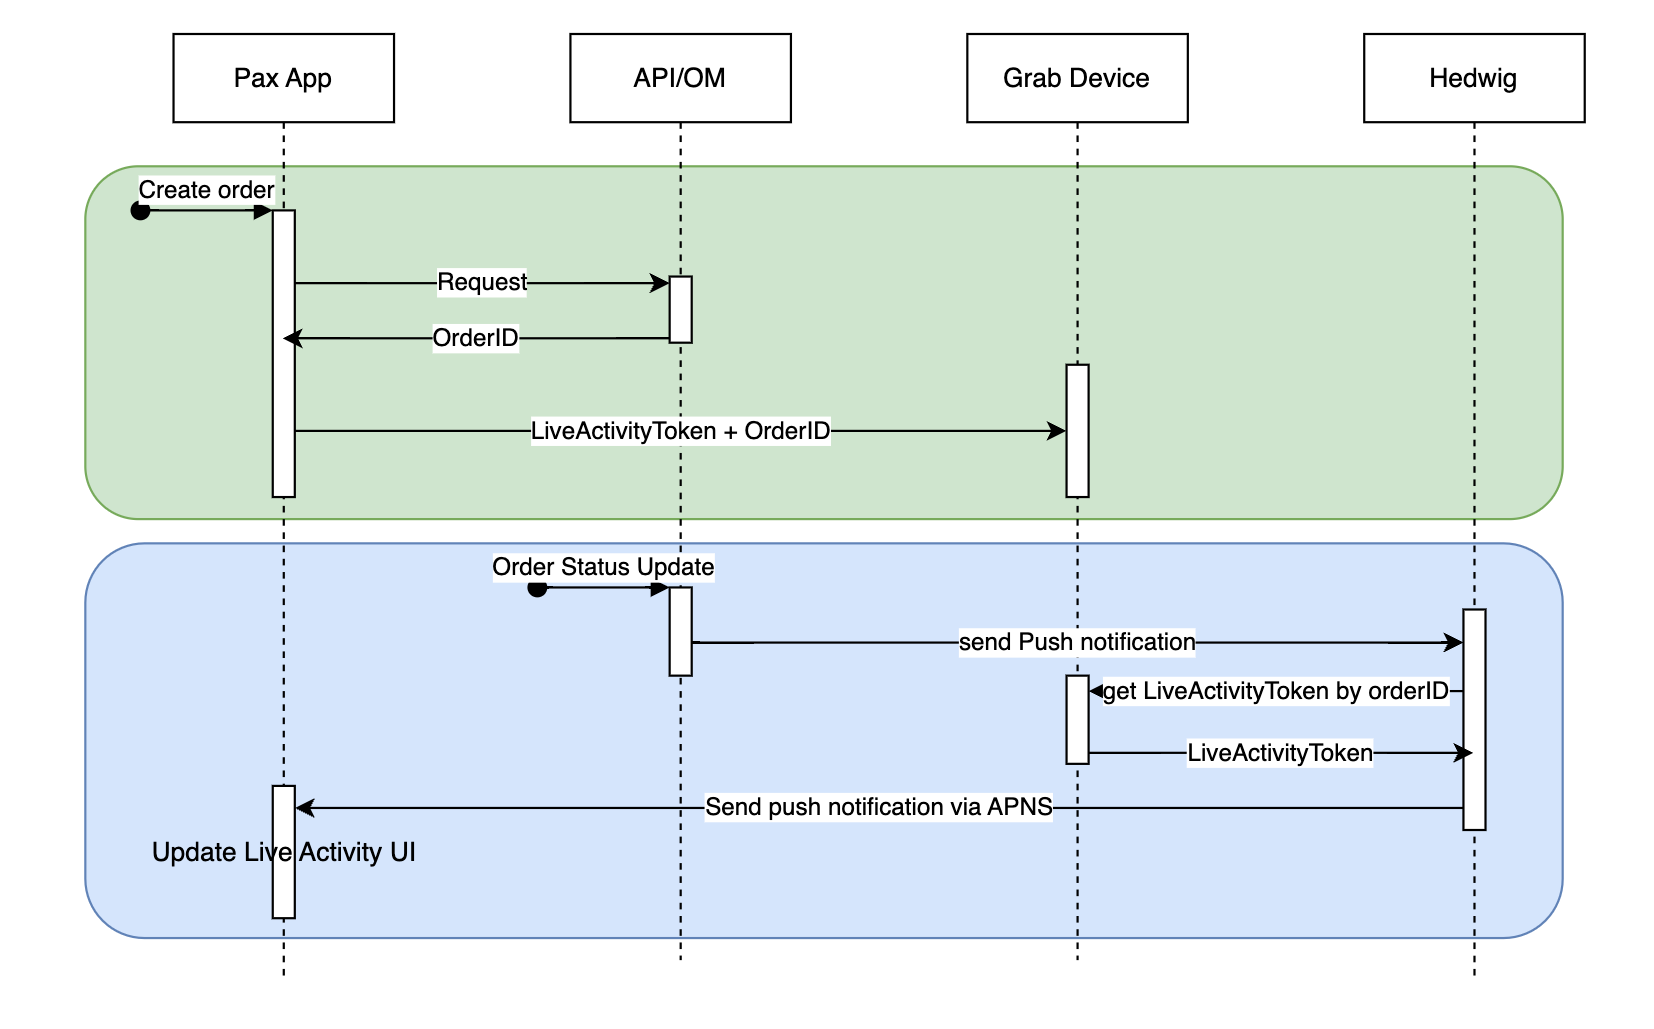
The team kicked off by analysing the current solution and end-to-end flow of Live Activity on iOS. The objective was to uncover opportunities on how we could leverage the existing platform approach.

Figure 1. Grab iOS Live Activity flow.

The first thing that caught our attention was that there is no Live Activity Token (also known as Push Token) concept on Android. Push Token is a token generated from the ActivityKit framework and used to remotely start, update, and end Live Activity notifications on iOS.

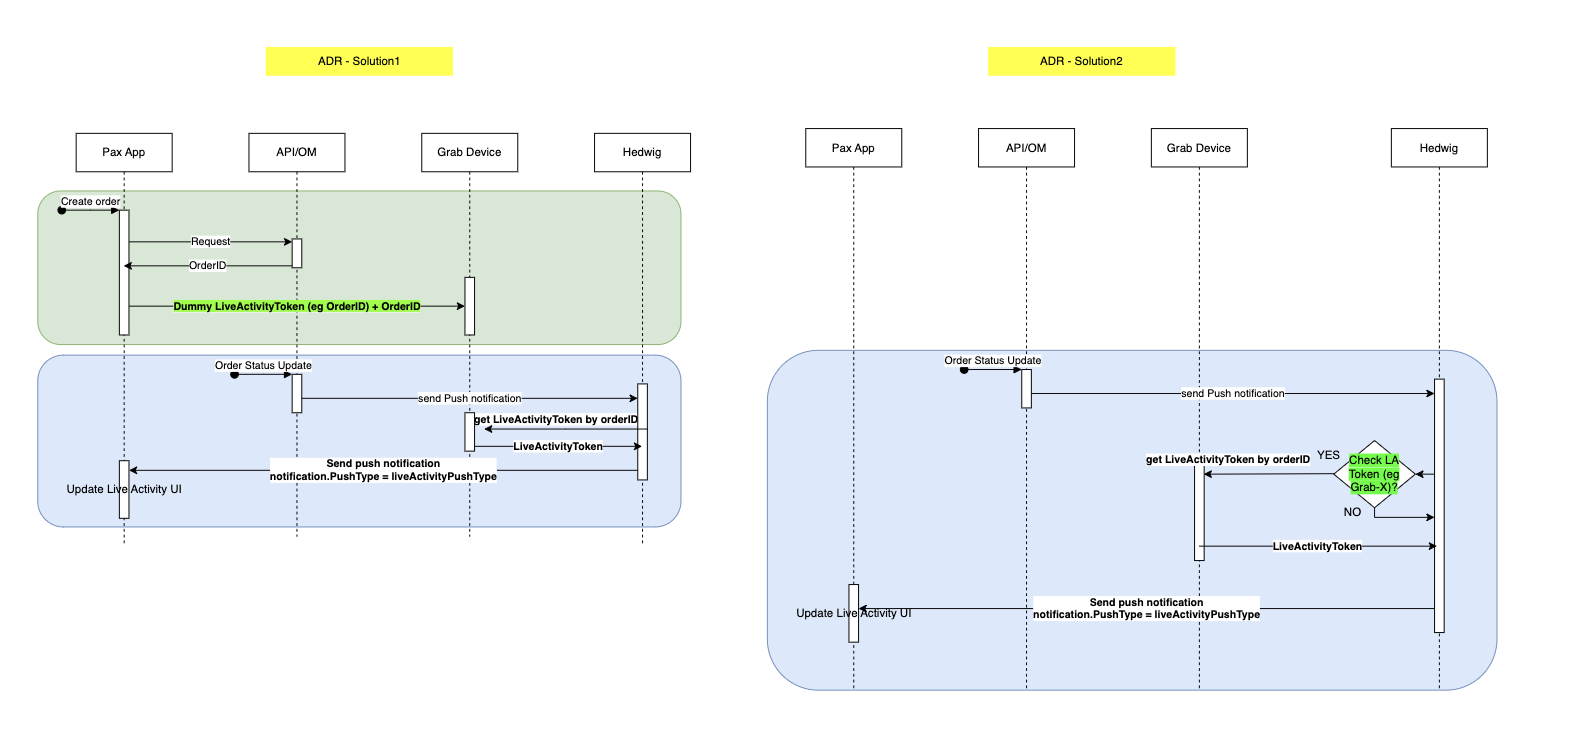
Our goal was to match the Live Activity set-up of iOS in Android, which was a challenge due to the missing Push Token. This required us to think outside the box and develop an innovative workaround. After multiple brainstorming sessions, the team developed two potential solutions, Solution 1 and Solution 2, as illustrated below:

Figure 2. Proposed solutions for Live Activity for Android.

We evaluated the two solutions. The first solution is to substitute the Push Token with a placeholder value, serving as a distinctive notification identifier. Whereas, the second solution involves the Hedwig service, our in-house message delivery service. We proposed to bypass the Live Activity token check process specifically for Android devices. Following extensive discussions, we decided to proceed with the first solution, which ensures consistency in the technical approach between Android and iOS platforms. Additionally, this solution allows us to ensure that notifications are only pushed to the devices that support the Live Activity feature. This decision strikes a good balance between efficiency and compatibility.

UI Components

Starting with a kick-off project meeting where we showcased our plans and proposed solutions to our stakeholders, the engineering team presented two native Android UI components that could be utilised to replicate Live Activity: the Notification View and the Floating View.

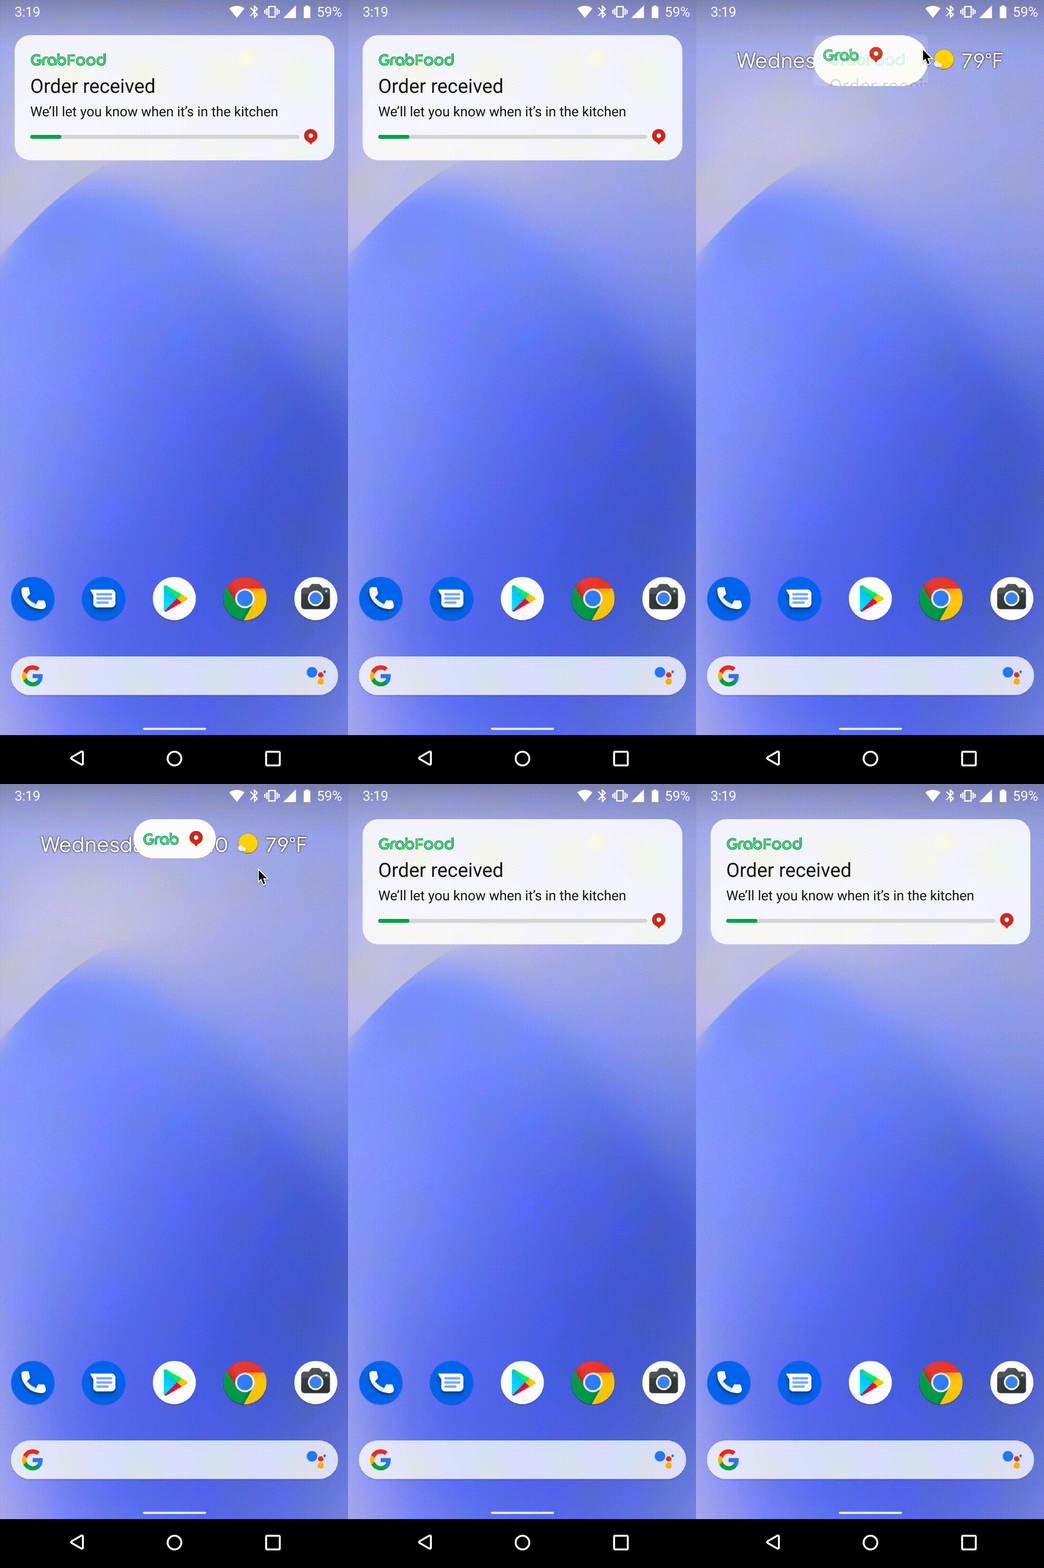
The Notification View is a component located in the notification drawer (and potentially on the Lock Screen) that fulfils the most basic use-case of the Live Activity feature. It enables Android users to access information without the need to open the app. Since the standard notification template only allows developers to display a single content title, a content subtitle, and one image, it falls short of meeting our Live Activity UI requirements. To overcome this limitation, custom notifications with custom layouts are needed.

Figure 3. Early design spec of Grab’s LA using custom notification.

One of the key advantages of custom notifications is that they do not require any additional new permissions, ensuring a smooth user experience. Additionally, Android users are accustomed to checking their notifications from the notification tray, making it a familiar and intuitive interaction. However, it is important to acknowledge that custom notifications rely on a remote view, which can pose restrictions on rendering only specific views. On top of that, custom notifications provide a limited space for content – limited to 48dp when collapsed and 252dp when expanded.

The Floating View is a component that will appear above all the applications in Android. It adds the convenience of accessing the information when the device is unlocked or when the user is on another app.

Figure 4. Early design spec of Grab’s LA using floating view.

The use of a Floating View offers greater flexibility to the view by eliminating the reliance on a remote view. However, it’s important to be aware of the potential limitations associated with this approach. These limitations include the requirement for screen space, which can potentially impact other app functionalities and cause frustration for users. Additionally, if we intend to display multiple order updates, we may require even more space, taking into account that Grab allows users to place multiple orders. Furthermore, the Floating View feature requires an extra “Draw over other apps” permission, a setting that allows an app to display information on top of other apps on your screen.

After thoughtful deliberation, we concluded that custom notifications provide a more consistent and user-friendly solution for implementing Grab’s Live Activity feature on Android. They offer compatibility, non-intrusiveness, no extra permissions, and the flexibility of silent notifications, ensuring an optimised user experience.

Building Grab Android’s “Live Activity”

We began developing the Live Activity feature by focusing on Food and Mart for the MVP. However, we prioritised potential future use cases for other verticals by examining the existing functionality of the Grab iOS Live Activity feature. By considering these factors from the start, we need to make sure that we build an extendable and flexible solution that caters to different verticals and their various use-cases.

Figure 5. Grab’s Android Live Activity.

As we set out to design Grab’s Android Live Activity module, we broke down the task into three key components:

  1. Registering Live Activity Token

In order to enable Hedwig services to send Live Activity notifications to devices, it is necessary to register a Live Activity Token for a specific order to Grab Devices services (refer to figure 1 for the iOS flow). As this use-case is applicable across various verticals in iOS, we have designed a LiveActivityIntegrationManager class specifically to handle this functionality.

interface LiveActivityIntegrationManager {  
    /\*\*  
     \* To start live activity journey  
     \* @param vertical refers to vertical name  
     \* @param id refers to unique id which is used to differentiate live activity UI instances  
     \* eg: Food will use orderID as id, transport can pass rideID  
     \*\*/  
    fun startLiveActivity(vertical: Vertical, id: String): Completable

    fun updateLiveActivity(id: String, attributes: LiveActivityAttributes)

    fun cancelLiveActivity(id: String)  
}  

Our goal is to provide developers with an easy implementation of Live Activity in the Grab app. Developers can simply utilize the startLiveActivity() function to register the token to Grab Devices by passing the vertical name and unique ID as parameters.

  1. Notification Listener and Payload Mapping

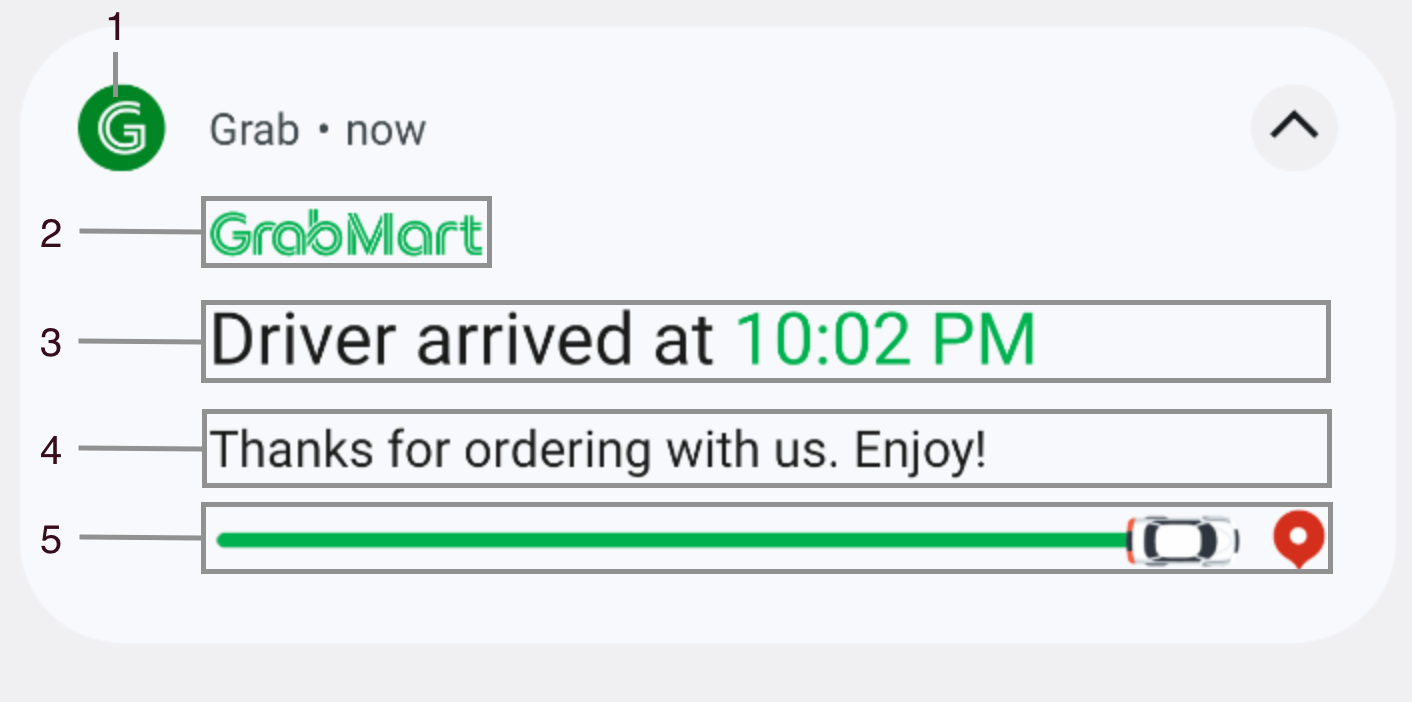
To handle Live Activity notifications in Android, it is necessary to listen to the Live Activity notification payload and map it to LiveActivityAttributes. Taking into consideration the initial Live Activity design (refer to figure 3), we need to analyse the variables necessary for this process. As a result, we break down the Live Activity UI into different UI elements and layouts, as follows:

Figure 6. Android Live Activity view breakdown.
  1. App Icon – labeled as 1 in Figure 6.
    This view always shows the Grab app icon.
  2. Header Icon – labeled as 2 in Figure 6.
    This view is an image view that could be set with icon resources.
  3. Content Title View – labeled as 3 in Figure 6.
    This view is a placeholder that could be set with a text or custom remote view.
  4. Content Text View – labeled as 4 in Figure 6.
    This view is a placeholder that could be set with a text or custom remote view.
  5. Footer View – labeled as 5 in Figure 6.
    This view is a placeholder that could be set with icon resources, bitmap, or custom remote view.

Decomposing the UI into different parts allows us to clearly understand of the UI components that need to maintain consistency across different use-cases, as well as the elements that can be easily customised and configured based on specific requirements. As a result, we have designed the LiveActivityAttributes class that serves as a container that encompasses all the necessary configurations required for rendering the Live Activity.

 
class LiveActivityAttributes private constructor(  
    val iconRes: Int?,  
    val headerIconRes: Int?,  
    val contentTitle: CharSequence?,  
    val contentTitleStyle: ContentStyle.TitleStyle?,  
    val customContentTitleView: LiveActivityCustomView?,  
    val contentText: CharSequence?,  
    val contentTextStyle: ContentStyle.TextStyle?,  
    val customContentTextView: LiveActivityCustomView?,  
    val footerIconRes: Int?,  
    val footerBitmap: Bitmap?,  
    val footerProgressBarProgress: Float?,  
    val footerProgressBarStyle: ProgressBarStyle?,  
    val footerRatingBarAttributes: RatingBarAttributes?,  
    val customFooterView: LiveActivityCustomView?,  
    val contentIntent: PendingIntent?,  
    …  
)  

  1. Payload Rendering

To ensure a clear separation of responsibilities, we have designed a separate class called LiveActivityManager. This dedicated class is responsible for the mapping of LiveActivityAttributes to Notifications. The generated notifications are then utilised by Android’s NotificationManager class to be posted and displayed accordingly.


interface LiveActivityManager {  
    /\*\*  
     \* Post a Live Activity to be shown in the status bar, stream, etc.  
     \*  
     \* @param id           the ID of the Live Activity  
     \* @param attributes the LiveActivity to post to the system  
     \*/  
    fun notify(id: Int, attributes: LiveActivityAttributes)

    fun cancel(id: Int)  
}

What’s Next?

We are delighted to announce that we have successfully implemented Grab’s Android version of the Live Activity feature for Express and Transport products. Furthermore, we plan to extend this feature to the Driver and Merchant applications as well. We understand the value this feature brings to our users and are committed to enhancing it further. Stay tuned for upcoming updates and enhancements to the Live Activity feature as we continue to improve and expand its capabilities across various verticals.

Join us

Grab is the leading superapp platform in Southeast Asia, providing everyday services that matter to consumers. More than just a ride-hailing and food delivery app, Grab offers a wide range of on-demand services in the region, including mobility, food, package and grocery delivery services, mobile payments, and financial services across 428 cities in eight countries.

Powered by technology and driven by heart, our mission is to drive Southeast Asia forward by creating economic empowerment for everyone. If this mission speaks to you, join our team today!
PIN-Stealing Android Malware

Post Syndicated from Bruce Schneier original https://www.schneier.com/blog/archives/2024/01/pin-stealing-android-malware.html

This is an old piece of malware—the Chameleon Android banking Trojan—that now disables biometric authentication in order to steal the PIN:

The second notable new feature is the ability to interrupt biometric operations on the device, like fingerprint and face unlock, by using the Accessibility service to force a fallback to PIN or password authentication.

The malware captures any PINs and passwords the victim enters to unlock their device and can later use them to unlock the device at will to perform malicious activities hidden from view.

A Security Issue in Android That Remains Unfixed – Pull-down Menu On Lock Screen

Post Syndicated from Bozho original https://techblog.bozho.net/a-security-issue-in-android-that-remains-unfixed-pull-down-menu-on-lock-screen/

Having your phone lying around when your kids are playing with everything they find is a great security test. They immediately discover new features and ways to go beyond the usual flow.

This is the way I recently discovered a security issue with Android. Apparently, even if the phone is locked, the pull-down menu with quick settings works. Also, volume control works. Not every functionality inside the quick settings menu works fully while unlocked, but you can disable mobile data and Wi-Fi, you can turn on your hotspot, you can switch to Airplane mode.

While this has been pointed out on Google Pixel forums, on reddit and Stack Exchange, it has not been fixed in stock Android. Different manufacturers seem to have acknowledged the issue in their custom ROMs, but that’s not a reliable long-term solution.

Let me explain why this is an issue. First, it breaks the assumption that when the phone is locked nothing works. Breaking user assumptions is bad by itself.

Second, it allows criminals to steal your phone and put in in Airplane mode, thus disabling any ability to track the phone – either through “find my phone” services, or by the police through mobile carriers. They can silence the phone, so that it’s not found with “ring my phone” functionality. It’s true that an attacker can just take out the SIM card, but having the Wi-Fi on still allows tracking using wifi networks through which the phone passes.

Third, the hotspot (similar issues go with Bluetooth). Allowing a connection can be used to attack the device. It’s not trivial, but it’s not impossible either. It can also be used to do all sorts of network attacks on other devices connected to the hotspot (e.g. you enable the hotspot, a laptop connects automatically, and you execute an APR poisoning attack). The hotspot also allows attackers to use a device to commit online crimes and frame the owner. Especially if they do not steal the phone, but leave it lying where it originally was, just with the hotspot turned on. Of course, they would need to get the password for the hotspot, but this can be obtained through social engineering.

The interesting thing is that when you use Google’s Family Link to lock a device that’s given to a child, the pull-down menu doesn’t work. So the basic idea that “once locked, nothing should be accessible” is there, it’s just not implemented in the default use-case.

While the things described above are indeed edge-cases and may be far fetched, I think they should be fixed. The more functionality is available on a locked phone, the more attack surface it has (including for the exploitation of 0days).

The post A Security Issue in Android That Remains Unfixed – Pull-down Menu On Lock Screen appeared first on Bozho's tech blog.

Leaked Signing Keys Are Being Used to Sign Malware

Post Syndicated from Bruce Schneier original https://www.schneier.com/blog/archives/2022/12/leaked-signing-keys-are-being-used-to-sign-malware.html

A bunch of Android OEM signing keys have been leaked or stolen, and they are actively being used to sign malware.

Łukasz Siewierski, a member of Google’s Android Security Team, has a post on the Android Partner Vulnerability Initiative (AVPI) issue tracker detailing leaked platform certificate keys that are actively being used to sign malware. The post is just a list of the keys, but running each one through APKMirror or Google’s VirusTotal site will put names to some of the compromised keys: Samsung, LG, and Mediatek are the heavy hitters on the list of leaked keys, along with some smaller OEMs like Revoview and Szroco, which makes Walmart’s Onn tablets.

This is a huge problem. The whole system of authentication rests on the assumption that signing keys are kept secret by the legitimate signers. Once that assumption is broken, all bets are off:

Samsung’s compromised key is used for everything: Samsung Pay, Bixby, Samsung Account, the phone app, and a million other things you can find on the 101 pages of results for that key. It would be possible to craft a malicious update for any one of these apps, and Android would be happy to install it overtop of the real app. Some of the updates are from today, indicating Samsung has still not changed the key.

Leaked Android Platform Certificates Create Risks for Users

Post Syndicated from Erick Galinkin original https://blog.rapid7.com/2022/12/02/leaked-android-platform-certificates-create-risks-for-users/

Leaked Android Platform Certificates Create Risks for Users

On November 30, 2022, a Google apvi report from Łukasz Siewierski initially filed on November 11, 2022 was made public. The report contained 10 different platform certificates and malware sample SHA256 sums where the malware sample had been signed by a platform certificate — the application signing certificate used to sign the “Android” application on the system image. Applications signed with platform certificates can therefore run with the same level of privileges as the “Android” application, yielding system privileges on the operating system without user input. Google has recommended that affected parties should rotate their platform certificate. However, platform certificates are considered very sensitive, and the source of these certificates is unknown at this time.

Impact and Remediation

This use of platform certificates to sign malware indicates that a sophisticated adversary has gained privileged access to very sensitive code signing certificates. Any application signed by these certificates could gain complete control over the victim device. Rapid7 does not have any information that would indicate a particular threat actor group as being responsible, but historically, these types of techniques have been preferred by state-sponsored actors. That said, a triage-level analysis of the malicious applications reported shows that the signed applications are adware — a malware type generally considered less sophisticated. This finding suggests that these platform certificates may have been widely available, as state-sponsored actors tend to be more subtle in their approach to highly privileged malware.

We note that although these platform certificates are very sensitive, the over-the-air update certificates are different, and so these cannot be used to push malicious updates.

In cases where the malware can be detected on user devices, it should be remediated immediately. The Google apvi report contains the relevant hashes and we have also listed them at the bottom of this post.

Indicators of Compromise

SHA256 File Hashes

e4e28de8ad3f826fe50a456217d11e9e6a80563b35871ac37845357628b95f6a
5c173df9e86e959c2eadcc3ef9897c8e1438b7a154c7c692d0fe054837530458
b1f191b1ee463679c7c2fa7db5a224b6759c5474b73a59be3e133a6825b2a284
19c84a2386abde0c0dae8661b394e53bf246f6f0f9a12d84cfc7864e4a809697
0251bececeffbf4bf90eaaad27c147bb023388817d9fbec1054fac1324c6f8bf
c612917d68803efbd2f0e960ade1662be9751096afe0fd81cee283c5a35e7618
6792324c1095458d6b78e92d5ae003a317fe3991d187447020d680e99d9b6129
091733658c7a32f4673415b11733ae729b87e2a2540c87d08ba9adf7bc62d7ed
5aaefc5b4fb1e1973832f44ba2d82a70106d3e8999680df6deed3570cd30fb97
32b9a33ad3d5a063cd4f08e0739a6ce1e11130532fd0b7e13a3a37edaf9893eb

Differences in App Security/Privacy Based on Country

Post Syndicated from Bruce Schneier original https://www.schneier.com/blog/archives/2022/09/differences-in-app-security-privacy-based-on-country.html

Depending on where you are when you download your Android apps, it might collect more or less data about you.

The apps we downloaded from Google Play also showed differences based on country in their security and privacy capabilities. One hundred twenty-seven apps varied in what the apps were allowed to access on users’ mobile phones, 49 of which had additional permissions deemed “dangerous” by Google. Apps in Bahrain, Tunisia and Canada requested the most additional dangerous permissions.

Three VPN apps enable clear text communication in some countries, which allows unauthorized access to users’ communications. One hundred and eighteen apps varied in the number of ad trackers included in an app in some countries, with the categories Games, Entertainment and Social, with Iran and Ukraine having the most increases in the number of ad trackers compared to the baseline number common to all countries.

One hundred and three apps have differences based on country in their privacy policies. Users in countries not covered by data protection regulations, such as GDPR in the EU and the California Consumer Privacy Act in the U.S., are at higher privacy risk. For instance, 71 apps available from Google Play have clauses to comply with GDPR only in the EU and CCPA only in the U.S. Twenty-eight apps that use dangerous permissions make no mention of it, despite Google’s policy requiring them to do so.

Research paper: “A Large-scale Investigation into Geodifferences in Mobile Apps“:

Abstract: Recent studies on the web ecosystem have been raising alarms on the increasing geodifferences in access to Internet content and services due to Internet censorship and geoblocking. However, geodifferences in the mobile app ecosystem have received limited attention, even though apps are central to how mobile users communicate and consume Internet content. We present the first large-scale measurement study of geodifferences in the mobile app ecosystem. We design a semi-automatic, parallel measurement testbed that we use to collect 5,684 popular apps from Google Play in 26 countries. In all, we collected 117,233 apk files and 112,607 privacy policies for those apps. Our results show high amounts of geoblocking with 3,672 apps geoblocked in at least one of our countries. While our data corroborates anecdotal evidence of takedowns due to government requests, unlike common perception, we find that blocking by developers is significantly higher than takedowns in all our countries, and has the most influence on geoblocking in the mobile app ecosystem. We also find instances of developers releasing different app versions to different countries, some with weaker security settings or privacy disclosures that expose users to higher security and privacy risks. We provide recommendations for app market proprietors to address the issues discovered.

Samsung Encryption Flaw

Post Syndicated from Bruce Schneier original https://www.schneier.com/blog/archives/2022/03/samsung-encryption-flaw.html

Researchers have found a major encryption flaw in 100 million Samsung Galaxy phones.

From the abstract:

In this work, we expose the cryptographic design and implementation of Android’s Hardware-Backed Keystore in Samsung’s Galaxy S8, S9, S10, S20, and S21 flagship devices. We reversed-engineered and provide a detailed description of the cryptographic design and code structure, and we unveil severe design flaws. We present an IV reuse attack on AES-GCM that allows an attacker to extract hardware-protected key material, and a downgrade attack that makes even the latest Samsung devices vulnerable to the IV reuse attack. We demonstrate working key extraction attacks on the latest devices. We also show the implications of our attacks on two higher-level cryptographic protocols between the TrustZone and a remote server: we demonstrate a working FIDO2 WebAuthn login bypass and a compromise of Google’s Secure Key Import.

Here are the details:

As we discussed in Section 3, the wrapping key used to encrypt the key blobs (HDK) is derived using a salt value computed by the Keymaster TA. In v15 and v20-s9 blobs, the salt is a deterministic function that depends only on the application ID and application data (and constant strings), which the Normal World client fully controls. This means that for a given application, all key blobs will be encrypted using the same key. As the blobs are encrypted in AES-GCM mode-of-operation, the security of the resulting encryption scheme depends on its IV values never being reused.

Gadzooks. That’s a really embarrassing mistake. GSM needs a new nonce for every encryption. Samsung took a secure cipher mode and implemented it insecurely.

News article.

Malicious Barcode Scanner App

Post Syndicated from Bruce Schneier original https://www.schneier.com/blog/archives/2021/02/malicious-barcode-scanner-app.html

Interesting story about a barcode scanner app that has been pushing malware on to Android phones. The app is called Barcode Scanner. It’s been around since 2017 and is owned by the Ukrainian company Lavabird Ldt. But a December 2020 update included some new features:

However, a rash of malicious activity was recently traced back to the app. Users began noticing something weird going on with their phones: their default browsers kept getting hijacked and redirected to random advertisements, seemingly out of nowhere.

Generally, when this sort of thing happens it’s because the app was recently sold. That’s not the case here.

It is frightening that with one update an app can turn malicious while going under the radar of Google Play Protect. It is baffling to me that an app developer with a popular app would turn it into malware. Was this the scheme all along, to have an app lie dormant, waiting to strike after it reaches popularity? I guess we will never know.

NoxPlayer Android Emulator Supply-Chain Attack

Post Syndicated from Bruce Schneier original https://www.schneier.com/blog/archives/2021/02/noxplayer-android-emulator-supply-chain-attack.html

It seems to be the season of sophisticated supply-chain attacks.

This one is in the NoxPlayer Android emulator:

ESET says that based on evidence its researchers gathered, a threat actor compromised one of the company’s official API (api.bignox.com) and file-hosting servers (res06.bignox.com).

Using this access, hackers tampered with the download URL of NoxPlayer updates in the API server to deliver malware to NoxPlayer users.

[…]

Despite evidence implying that attackers had access to BigNox servers since at least September 2020, ESET said the threat actor didn’t target all of the company’s users but instead focused on specific machines, suggesting this was a highly-targeted attack looking to infect only a certain class of users.

Until today, and based on its own telemetry, ESET said it spotted malware-laced NoxPlayer updates being delivered to only five victims, located in Taiwan, Hong Kong, and Sri Lanka.

I don’t know if there are actually more supply-chain attacks occurring right now. More likely is that they’ve been happening for a while, and we have recently become more diligent about looking for them.

Optimizing the Aural Experience on Android Devices with xHE-AAC

Post Syndicated from Netflix Technology Blog original https://netflixtechblog.com/optimizing-the-aural-experience-on-android-devices-with-xhe-aac-c27714292a33

By Phill Williams and Vijay Gondi

Introduction

At Netflix, we are passionate about delivering great audio to our members. We began streaming 5.1 channel surround sound in 2010, Dolby Atmos in 2017, and adaptive bitrate audio in 2019. Continuing in this tradition, we are proud to announce that Netflix now streams Extended HE-AAC with MPEG-D DRC (xHE-AAC) to compatible Android Mobile devices (Android 9 and newer). With its capability to improve intelligibility in noisy environments, adapt to variable cellular connections, and scale to studio-quality, xHE-AAC will be a sonic delight to members who stream on these devices.

xHE-AAC Features

MPEG-D DRC

One way that xHE-AAC brings value to Netflix members is through its mandatory MPEG-D DRC metadata. We use APIs described in the MediaFormat class to control the experience in decoders. In this section we will first describe loudness and dynamic range, and then explain how MPEG-D DRC in xHE-AAC works and how we use it.

Dialogue Levels and Dynamic Range

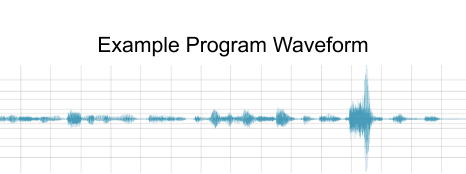
In order to understand the utility of loudness management & dynamic range control, we first must understand the phenomena that we are controlling. As an example, let’s start with the waveform of a program, shown below in Figure 1.

Example program waveform
Figure 1. Example program waveform

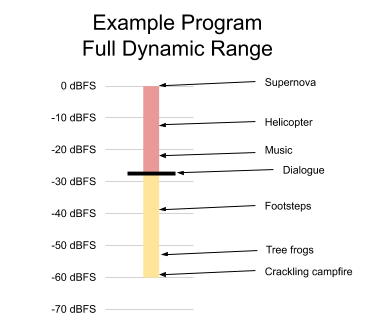
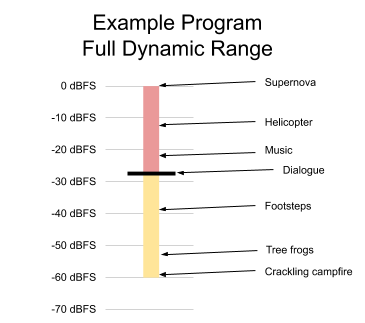
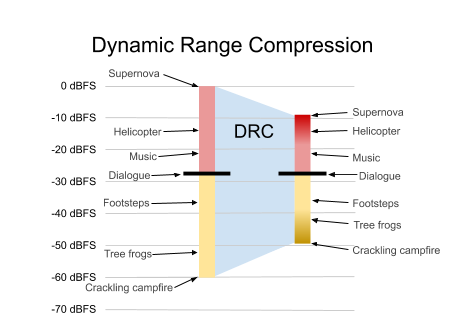
To measure a program’s dynamic range, we break the waveform into short segments, such as half-second intervals, and compute the RMS level of each segment in dBFS. The summary of those measurements can be plotted on a single vertical line, as shown below in Figure 2. The ambient sound of a campfire may be up to 60 dB softer than the exploding car in an action scene. The dynamic range of a program is the difference between its quietest and the loudest sounds. So in our example, we would say that the program has a dynamic range of 60 dB. We will revisit this example in the section that discusses dynamic range control.

Figure 2. Dynamic range of a program with some examples
Figure 2. Dynamic range of a program with some examples

Loudness is the subjective perception of sound pressure. Although it is most directly correlated with sound pressure level, it is also affected by the duration and spectral makeup of the sound. Research has shown that, in cinematic and television content, the dialogue level is the most important element to viewers’ perception of a program’s loudness. Since it is the critical component of program loudness, dialogue level is indicated with a bold black line in Figure 2.

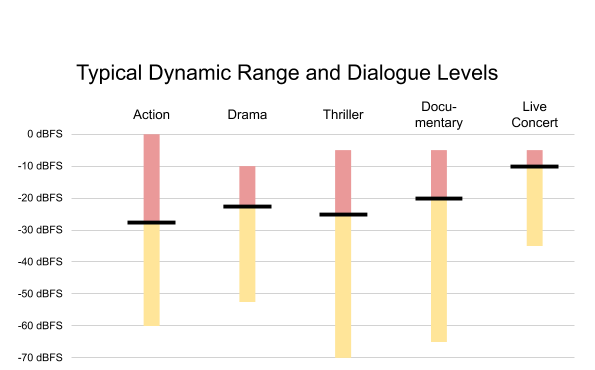
Not every program has the same dialogue level or the same dynamic range. Figure 3 shows a variety of dialogue levels and dynamic ranges for different programs.

Figure 3. Typical dynamic range and dialogue levels of a variety of content. Black lines indicate average dialogue level; red
Figure 3. Typical dynamic range and dialogue levels of a variety of content. Black lines indicate average dialogue level; red and yellow are used for louder/softer sounds.

The action film contains dialogue at -27 dBFS, leaving headroom for loud effects like explosions. On the other hand, the live concert has a relatively small dynamic range, with dialogue near the top of the mix. Other shows have varying dialogue levels and varying dynamic ranges. Each show is mixed based on a unique set of conditions.

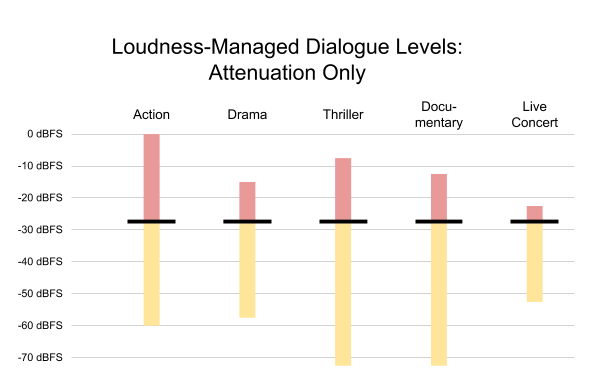
Now, imagine you were watching these shows, one after the other. If you switched from the action show to the live concert, you would likely be diving for the volume control to turn it down! Then, when the drama comes on, you might not be able to understand the dialogue until you turn the volume back up. If you were to switch partway through shows, the effect might even be more pronounced. This is what loudness management aims to solve.
Loudness Management

The goal of loudness management is to play all titles at a consistent volume, relative to each other. When it is working effectively, once you set your volume to a comfortable level, you never have to change it, even as you switch from a movie to a documentary, to a live concert. Netflix specifically aims to play all dialogue at the same level. This is consistent with the North American television broadcasting standard ATSC A/85 and AES71 recommendations for online video distribution.

The loudness metrics of all Netflix content are measured before encoding. Since our goal is to play all dialogue at the same level, we use anchor-based (dialogue) measurement, as recommended in A/85. The measured dialog level is delivered in MPEG-D DRC metadata in the xHE-AAC bitstream, using the anchorLoudness metadata set. In the example from Figure 3, the action show would have an anchorLoudness of -27 dBFS; the documentary, -20 dBFS.

On Android, Netflix uses KEY_AAC_DRC_TARGET_REFERENCE_LEVEL to set the output level. The decoder applies a gain equal to the difference between the output level and the anchorLoudness metadata, to normalize all content such that dialogue is always output at the same level. In Figure 4, the output level is set to -27 dBFS. Content with higher anchor loudness is attenuated accordingly.

Figure 4. Content from Figure 3, normalized to achieve consistent dialogue levels
Figure 4. Content from Figure 3, normalized to achieve consistent dialogue levels

Now, in our imaginary playback scenario, you no longer reach for the volume control when switching from the action program to the live concert — or when switching to any other program.

Each device can set a target output level based on its capabilities and the member’s environment. For example, on a mobile device with small speakers, it is often desirable to use a higher output level, such as -16 dBFS, as shown in Figure 5.

Figure 5. Content from Figure 3, normalized to a higher output level, with peak limiting applied as needed (dark red)
Figure 5. Content from Figure 3, normalized to a higher output level, with peak limiting applied as needed (dark red)

Some programs — notably, the action and the thriller — were amplified to achieve the desired output level. In so doing, the loudest content in these programs would be clipped, introducing undesirable harmonic distortion into the sound — so the decoder must apply peak limiting to prevent spurious output. This is not ideal, but it may be a desirable tradeoff to achieve a sufficient output level on some devices. Fortunately, xHE-AAC provides an option to improve peak protection, as described in the Peak Audio Sample Metadata section below.

By using metadata and decode-side gain to normalize loudness, Netflix leverages xHE-AAC to minimize the total number of gain stages in the end-to-end system, maximizing audio quality. Devices retain the ability to customize output level based on unique listening conditions. We also retain the option to defeat loudness normalization completely, for a ‘pure’ mode, when listening conditions are optimal, as in a home theater setting.

Dynamic Range Control

Dynamic range control (DRC) has a wide variety of creative and practical uses in audio production. When playing back content, the goal of dynamic range control is to optimize the dynamic range of a program to provide the best listening experience on any device, in any environment. Netflix leverages the uniDRC() payload metadata, contained in xHE-AAC MPEG-D DRC, to carefully and thoughtfully apply a sophisticated DRC when we know it will be beneficial to our members, based on their device and their environment.

Figure 2 (repeated). Dynamic range of a program with some examples
Figure 2 (repeated). Dynamic range of a program with some examples

Figure 2 is repeated above. It has a total dynamic range of 60 dB. In a high-end listening environment, like over-ear headphones, home theater, or cinema, members can be fully immersed into both the subtlety of a quiet scene and a bombastic action scene. But many playback scenarios exist where reproduction of such a large dynamic range is undesirable or even impossible (e.g. low-fidelity earbuds, or mobile device speakers, or playback in the presence of loud background noise). If the dynamic range of a member’s device and environment is less than the dynamic range of the content, then they will not hear all of the details in the soundtrack. Or they might frequently adjust the volume during the show, turning up the soft sections, and then turning it back down when things get loud. In extreme cases, they may have difficulty understanding the dialogue, even with the volume turned all the way up. In all of these situations, DRC can be used to reduce the dynamic range of the content to a more suitable range, shown in Figure 6.

Figure 6. The program from Figure 5, after dynamic range compression (gradient).
Figure 6. The program from Figure 5, after dynamic range compression (gradient). Note that DRC affects loudest and softest parts, but not dialogue.

To reduce dynamic range in a sonically pleasing way requires a sophisticated algorithm, ideally with significant lookahead. Specifically, a good DRC algorithm will not affect dialogue levels, and only apply a gentle adjustment when sounds are too loud or too soft for the listening conditions. As such, it is common to compute DRC parameters at encode-time, when processing power and lookahead is ample. The decoder then simply applies gains that have been specified in metadata. This is exactly how MPEG-D DRC works in xHE-AAC.

Since listening conditions cannot be predicted at encode time, MPEG-D DRC contains multiple DRC profiles that cover a range of situations — for example, Limited Playback Range (for playback over small speakers), Clipping Protection (only for clipping protection as described below), or Noisy Environment (for … noisy environments). On Android decoders, DRC profiles are selected using KEY_AAC_DRC_EFFECT_TYPE.

MPEG-D DRC has an alternate way for decoders to control how much DRC is applied, and that is to scale DRC gains. On Android decoders, this is done using KEY_AAC_DRC_ATTENUATION_FACTOR and KEY_AAC_DRC_BOOST_FACTOR.

Peak Audio Sample Metadata

In MPEG-D DRC, samplePeakLevel signals the maximum level of a program. Another way to think of it is the maximum headroom of the program. For example, in Figure 3, the thriller’s samplePeakLevel is -6 dBFS.

When the combination of a program’s anchorLoudness and a decoder’s target output level results in amplification, as in the action and thriller programs in Figure 3, samplePeakLevel allows DRC gains to be used for peak limiting instead of the decoder’s built-in peak limiter. Again, since DRC is calculated in the encoder using a sophisticated algorithm, this results in higher fidelity audio than running a peak limiter, with limited lookahead, in the decoder. As shown in Figure 7, samplePeakLevel allows the decoder to replace its peak limiter with DRC for the loudest peaks.

Figure 7. Content from Figure 3, normalized to a higher output level, using DRC to prevent clipping as needed.
Figure 7. Content from Figure 3, normalized to a higher output level, using DRC to prevent clipping as needed.

Putting it Together

Working together, loudness management and DRC can provide an optimal listening experience even in a compromised environment. Figure 8 illustrates a case in which the member is in a noisy environment. The background noise is so loud that softer details — everything below -40 dBFS — are completely inaudible, even when using an elevated target output level of -16 dBFS.

Figure 8. Content from Figure 7, in the presence of background noise

This example is not the worst-case. As previously mentioned, in some scenarios, members using small mobile device speakers are unable to hear even the dialogue due to the background noise!

This is where DRC metadata shows its full value. By engaging DRC, the softest details of programs are boosted enough to be heard even in the presence of the background noise, as illustrated in Figure 9. Since loudness management has already been used to normalize dialogue to -16 dBFS, DRC has no effect on the dialogue. This provides the best possible experience for suboptimal listening situations.

Figure 9. Content from Figure 8, with DRC applied to boost previously-inaudible details.

Seamless Switching and Adaptive Bit Rate

For years, adaptive video bitrate switching has been a core functionality for Netflix media playback. Audio bitrates were fixed, partly due to codec limitations. In 2019, we began delivering high-quality, adaptive bitrate audio to TVs. Now, thanks to xHE-AAC’s native support for seamless bitrate switching, we can bring adaptive bitrate audio to Android mobile devices. Using an approach similar to that described in our High Quality Audio Article, our xHE-AAC streams deliver studio-quality audio when network conditions allow, and minimize rebuffers when the network is congested.

Deployment, Testing and Observations

At Netflix we always perform a comprehensive AB test before any major product change, and a new streaming audio codec is no exception. Content was encoded using the xHE-AAC encoder provided by Fraunhofer IIS, packaged using MP4Box, and A/B tested against our existing streaming audio codec, HE-AAC, on Android mobile devices running Android 9 and newer. Default values were used for KEY_AAC_DRC_TARGET_REFERENCE_LEVEL and KEY_AAC_DRC_EFFECT_TYPE in the xHE-AAC decoder.

Members engage with audio using the device’s built-in speakers, wired headphones/earbuds, or Bluetooth connected devices. We refer to these as the audio sinks. At a high level, xHE-AAC with default loudness and DRC settings showed improved consumer engagement on Android mobile.

In particular, our test focused on audio-related metrics and member usage patterns. Let’s look at three of them: Time-weighted device volume level, volume change interactions, and audio sink changes.

Volume Level

Figure 10. Time-weighted volume level distribution for built-in speakers. (Cell 2: xHE-AAC)
Figure 10. Time-weighted volume level distribution for built-in speakers. (Cell 2: xHE-AAC)

Figure 10 illustrates the volume level for the built-in speaker audio sink. The y-axis shows the volume level reported by Android — which is mapped from 0 (mute) to 1,000,000 (max level). The x-axis shows the percentile that had volume set at or below a particular level. One way to read the graph would be to say that for Cell 2, about 30% of members had the volume set below 0.5M; for Cell 1, it was about 15%. Overall, time-weighted volume levels of xHE-AAC are lower; this is expected as the content itself is 11dB louder. We also note that fewer members have the volume at the maximum level. We believe that if a member has volume at maximum level, they may still not be satisfied with the output level. So we see this as a sign that fewer members are dissatisfied with the overall volume level.

Volume Changes

Figure 11. Total volume change interactions (Cell 2: xHE-AAC)
Figure 11. Difference in total volume change interactions (Cell 2: xHE-AAC)

When a show has a high dynamic range, a member may ‘ride the volume’ to turn down the loud segments and turn up the soft segments. Figure 11 shows that volume change interactions are noticeably down for xHE-AAC. This indicates that DRC is doing a good job of managing the volume changes within shows. These differences are far more pronounced for titles with a high dynamic range.

Audio Sink Changes

On mobile devices, most Netflix members use built-in speakers. When members switch to headphones, it can be a sign that the built-in output level is not satisfactory, and they hope for a better experience. For example, perhaps the dialogue level is not audible. In our test, we found that members switched away from built-in speakers 7% less often when listening to xHE-AAC. When the content was high dynamic range, they switched 16% less.

Conclusion

The lessons we have learned while deploying xHE-AAC to Android Mobile devices are not unique — we expect them to apply to other platforms that support the new codec. Netflix always strives to give the best member experience, in every listening environment. So the next time you experience The Crown, get ready to be immersed and not have to reach out to the volume control or grab your earbuds.


Optimizing the Aural Experience on Android Devices with xHE-AAC was originally published in Netflix TechBlog on Medium, where people are continuing the conversation by highlighting and responding to this story.

Finding the Location of Telegram Users

Post Syndicated from Bruce Schneier original https://www.schneier.com/blog/archives/2021/01/finding-the-location-of-telegram-users.html

Security researcher Ahmed Hassan has shown that spoofing the Android’s “People Nearby” feature allows him to pinpoint the physical location of Telegram users:

Using readily available software and a rooted Android device, he’s able to spoof the location his device reports to Telegram servers. By using just three different locations and measuring the corresponding distance reported by People Nearby, he is able to pinpoint a user’s precise location.

[…]

A proof-of-concept video the researcher sent to Telegram showed how he could discern the address of a People Nearby user when he used a free GPS spoofing app to make his phone report just three different locations. He then drew a circle around each of the three locations with a radius of the distance reported by Telegram. The user’s precise location was where all three intersected.

[…]

Fixing the problem — or at least making it much harder to exploit it — wouldn’t be hard from a technical perspective. Rounding locations to the nearest mile and adding some random bits generally suffices. When the Tinder app had a similar disclosure vulnerability, developers used this kind of technique to fix it.

zANTI – Android Wireless Hacking Tool Free Download

Post Syndicated from original https://www.darknet.org.uk/2020/12/zanti-android-wireless-hacking-tool-free-download/?utm_source=rss&utm_medium=social&utm_campaign=darknetfeed

zANTI – Android Wireless Hacking Tool Free Download

zANTI is an Android Wireless Hacking Tool that functions as a mobile penetration testing toolkit that lets you assess the risk level of a network using your mobile device for free download.

This easy to use mobile toolkit enables IT Security Administrators to simulate an advanced attacker to identify the malicious techniques they use in the wild to compromise the corporate network.

Features of zANTI Android Wireless Hacking Tool

This network auditor comes along with a rather simple interface compared to other solutions and running its tasks is pretty straightforward.

Read the rest of zANTI – Android Wireless Hacking Tool Free Download now! Only available at Darknet.

How Grab is Blazing Through the Super App Bazel Migration

Post Syndicated from Grab Tech original https://engineering.grab.com/how-grab-is-blazing-through-the-super-app-bazel-migration

Introduction

At Grab, we build a seamless user experience that addresses more and more of the daily lifestyle needs of people across South East Asia. We’re proud of our Grab rides, payments, and delivery services, and want to provide a unified experience across these offerings.

Here is couple of examples of what Grab does for millions of people across South East Asia every day:

Grab Service Offerings

The Grab Passenger application reached super app status more than a year ago and continues to provide hundreds of life-changing use cases in dozens of areas for millions of users.

With the big product scale, it brings with it even bigger technical challenges. Here are a couple of dimensions that can give you a sense of the scale we’re working with.

Engineering and product structure

Technical and product teams work in close collaboration to outserve our customers. These teams are combined into dedicated groups to form Tech Families and focus on similar use cases and areas.

Grab consists of many Tech Families who work on food, payments, transport, and other services, which are supported by hundreds of engineers. The diverse landscape makes the development process complicated and requires the industry’s best practices and approaches.

Codebase scale overview

The Passenger Applications (Android and iOS) contain more than 2.5 million lines of code each and it keeps growing. We have 1000+ modules in the Android App and 700+ targets in the iOS App. Hundreds of commits are merged by all the mobile engineers on a daily basis.

To maintain the health of the codebase and product stability, we run 40K+ unit tests on Android and 30K+ unit tests on iOS, as well as thousands of UI tests and hundreds of end-to-end tests on both platforms.

Build time challenges

The described complexity and scale do not come without challenges. A huge codebase propels the build process to the ultimate extreme- challenging the efficiency of build systems and hardware used to compile the super app, and creating out of the line challenges to be addressed.

Local build time

Local build time (the build on engineers’ laptop) is one of the most obvious challenges. More code goes in the application binary, hence the build system requires more time to compile it.

ADR local build time

The Android ecosystem provides a great out-of-the-box tool to build your project called Gradle. It’s flexible and user friendly, and  provides huge capabilities for a reasonable cost. But is this always true? It appears to not be the case due to multiple reasons. Let’s unpack these reasons below.

Gradle performs well for medium sized projects with say 1 million line of code. Once the code surpasses that 1 million mark (or so), Gradle starts failing in giving engineers a reasonable build time for the given flexibility. And that’s exactly what we have observed in our Android application.

At some point in time, the Android local build became ridiculously long. We even encountered cases  where engineers’ laptops simply failed to build the project due to hardware resources limits. Clean builds took by the hours, and incremental builds easily hit dozens of minutes.

iOS local build time

Xcode behaved a bit better compared to Gradle. The Xcode build cache was somehow bearable for incremental builds and didn’t exceed a couple of minutes. Clean builds still took dozens of minutes though. When Xcode failed to provide the valid cache, engineers had to rerun everything as a clean build, which killed the experience entirely.

CI pipeline time

Each time an engineer submits a Merge Request (MR), our CI kicks in running a wide variety of jobs to ensure the commit is valid and doesn’t introduce regression to the master branch. The feedback loop time is critical here as well, and the pipeline time tends to skyrocket alongside the code base growth. We found ourselves on the trend where the feedback loop came in by the hours, which again was just breaking the engineering experience, and prevented  us from delivering the world’s best features to our customers.

As mentioned, we have a large number of unit tests (30K-40K+) and UI tests (700+) that we run on a pre-merge pipeline. This brings us to hours of execution time before we could actually allow MRs to land to the master branch.

The number of daily commits, which is by the hundreds, adds another stone to the basket of challenges.

All this clearly indicated the area of improvement. We were missing opportunities in terms of engineering productivity.

The extra mile

The biggest question for us to answer was how to put all this scale into a reasonable experience with minimal engineering idle time and fast feedback loop.

Build time critical path optimization

The most reasonable thing to do was to pay attention to the utilization of the hardware resources and make the build process optimal.

This literally boiled down to the simplest approach:

  1. Decouple building blocks
  2. Make building blocks as small as possible

This approach is valid for any build system and applies  for both iOS and Android. The first thing we focused on was to understand what our build graph looked like, how dependencies were distributed, and which blocks were bottlenecks.

Given the scale of the apps, it’s practically not possible to manage a dependency tree manually, thus we created a tool to help us.

Critical path overview

We introduced the Critical Path concept:

The critical path is the longest (time) chain of sequential dependencies, which must be built one after the other.

Critical Path
Critical Path build

Even with an infinite number of parallel processors/cores, the total build time cannot be less than the critical path time.

We implemented the tool that parsed the dependency trees (for both Android and iOS), aggregated modules/target build time, and calculated the critical path.

The concept of the critical path introduced a number of action items, which we prioritized:

  • The critical path must be as short as possible.
  • Any huge module/target on the critical path must be split into smaller modules/targets.
  • Depend on interfaces/bridges rather than implementations to shorten the critical path.
  • The presence of other teams’ implementation modules/targets in the critical path of the given team is a red flag.
Stack representation of the Critical Path build time

Project’s scale factor

To implement the conceptually easy action items, we ran a Grab-wide program. The program has impacted almost every mobile team at Grab and involved 200+ engineers to some degree. The whole implementation took 6 months to complete.

During this period of time, we assigned engineers who were responsible to review the changes, provide support to the engineers across Grab, and monitor the results.

Results

Even though the overall plan seemed to be good on paper, the results were minimal – it just flattened the build time curve of the upcoming trend introduced by the growth of the codebase. The estimated impact was almost the same for both platforms and gave us about a 7%-10% cut in the CI and local build time.

Open source plan

The critical path tool proved to be effective to illustrate the projects’ bottlenecks in a dependency tree configuration. It is currently widely used by mobile teams at Grab to analyze their dependencies and cut out or limit an unnecessary impact on the respective scope.

The tool is currently considered to be open-sourced as we’d like to hear feedback from other external teams and see what can be built on top of it. We’ll provide more details on this in future posts.

Remote build

Another pillar of the  build process is the hardware where the build runs. The solution is  really straightforward – put more muscles on your build to get it stronger and to run faster.

Clearly, our engineers’ laptops could not be considered fast enough. To have a fast enough build we were looking at something with 20+ cores, ~200Gb of RAM. None of the desktop or laptop computers can reach those numbers within reasonable pricing. We hit a bottleneck in hardware. Further parallelization of the build process didn’t give any significant improvement as all the build tasks were just queueing and waiting for the resources to be released. And that’s where cloud computing came into the picture where a huge variety of available options is ready to be used.

ADR mainframer

We took advantage of the Mainframer tool. When the build must run, the code diff is pushed to the remote executor, gets compiled, and then the generated artifacts are pushed back to the local machine. An engineer might still benefit from indexing, debugging, and other features available in the IDE.

To make the infrastructure mature enough, we’ve introduced Kubernetes-based autoscaling based on the load. Currently, we have a stable infrastructure that accommodates 100+ Android engineers scaling up and down (saving costs).

This strategy gave us a 40-50% improvement in the local build time. Android builds finished, in the extreme case, x2 faster.

iOS

Given the success of the Android remote build infrastructure, we have immediately turned our attention to the iOS builds. It was an obvious move for us – we wanted the same infrastructure for iOS builds. The idea looked good on paper and was proven with Android infrastructure, but the reality was a bit different for our iOS builds.

Our  very first roadblock was that Xcode is not that flexible and the process of delegating build to remote is way more complicated compared to Android. We tackled a series of blockers such as running indexing on a remote machine, sending and consuming build artifacts, and even running the remote build itself.

The reality was that the remote build was absolutely possible for iOS. There were  minor tradeoffs impacting engineering experience alongside obvious gains from utilizing cloud computing resources. But the problem is that legally iOS builds are only allowed to be built on an Apple machine.

Even if we get the most powerful hardware – a macPro –  the specs are still not ideal and are unfortunately not optimized for the build process. A 24 core, 194Gb RAM macPro could have given about x2 improvement on the build time, but when it had to  run 3 builds simultaneously for different users, the build efficiency immediately dropped to the baseline value.

Android remote machines with the above same specs are capable of running up to 8 simultaneous builds. This allowed us to accommodate up to 30-35 engineers per machine, whereas iOS’ infrastructure would require to keep this balance at 5-6 engineers per machine. This solution didn’t seem to be scalable at all, causing us to abandon the idea of the remote builds for iOS at that moment.

Test impact analysis

The other battlefront was the CI pipeline time. Our efforts in dependency tree optimizations complemented with comparably powerful hardware played a good part in achieving a reasonable build time on CI.

CI validations also include the execution of unit and UI tests and may easily take 50%-60% of the pipeline time. The problem was getting worse as the number of tests was constantly growing. We were to face incredibly huge tests’ execution time in the near future. We could mitigate the problem by a muscle approach – throwing more runners and shredding tests – but it won’t make finance executives happy.

So the time for smart solutions came again. It’s a known fact that the simpler solution is more likely to be correct. The simplest solution was to stop running ALL tests. The idea was to run only those tests that were impacted by the codebase change introduced in the given MR.

Behind this simple idea, we’ve found a huge impact. Once the Test Impact Analysis was applied to the pre-merge pipelines, we’ve managed to cut down the total number of executed tests by up to 90% without any impact on the codebase quality or applications’ stability. As a result, we cut the pipeline for both platforms by more than 30%.

Today, the Test Impact Analysis is coupled with our codebase. We are looking to  invest some effort to make it available for open sourcing. We are excited to be  on this path.

The end of the Native Build Systems

One might say that our journey was long and we won the battle for the build time.

Today, we hit a limit to the native build systems’ efficiency and hardware for both Android and iOS. And it’s clear to us that in our current setup, we would not be able to scale up while delivering high engineering experience.

Let’s move to Bazel

To introduce another big improvement to the build time, we needed to make some ground-level changes. And this time, we focused on the  build system itself.

Native build systems are designed to work well for small and medium-sized projects, however they have not been as successful in large scale projects such as the Grab Passenger applications.

With these assumptions, we considered options and found the Bazel build system to be a good contender. The deep comparison of build systems disclosed that Bazel was promising better results almost in all key areas:

  • Bazel enables remote builds out of box
  • Bazel provides sustainable cache capabilities (local and remote). This cache can be reused across all consumers – local builds, CI builds
  • Bazel was designed with the big codebase as a cornerstone requirement
  • The majority of the tooling may be reused across multiple platforms

Ways of adopting

On paper, Bazel was awesome and shining. All our playground investigations showed positive results:

  • Cache worked great
  • Incremental builds were incredibly fast

But the effort to shift to this new build system was huge. We made sure that we foresee all possible pitfalls and impediments. It took us about 5 months to estimate the impact and put together a sustainable proof of concept, which reflected the majority of our use cases.

Migration limitations

After those 5 months of investigation, we got the endless list of incompatible features and major blockers to be addressed. Those blockers touched even such obvious things as indexing and the jump to definition IDE feature, which we used to take for granted.

But the biggest challenge was the need to keep the pace of the product release. There was no compromise of stopping the product development even for a day. The way out appeared to be a hybrid build concept. We figured out how to marry native and Bazel build systems to live together in harmony. This move gave us a chance to start migrating target by target, project by project moving from the bottom to top of the dependency graph.

This approach was a valid enabler, however we were still faced with a challenge of our app’s  scale. The codebase of over 2.5 million of LOC cannot be migrated overnight. The initial estimation was based on the idea of manually migrating the whole codebase, which would have required us to invest dozens of person-months.

Team capacity limitations

This approach was immediately pushed back by multiple teams arguing with the priority and concerns about the impact on their own product roadmap.

We were left with not much  choice. On one hand, we had a pressingly long build time. And on the other hand, we were asking for a huge effort from teams. We clearly needed to get buy-ins from all of our stakeholders to push things forward.

Getting buy-in

To get all needed buy-ins, all stakeholders were grouped and addressed separately. We defined key factors for each group.

Key factors

C-level stakeholders:

  • Impact. The migration impact must be significant – at least a 40% decrease on the build time.
  • Costs. Migration costs must be paid back in a reasonable time and the positive impact is extended to  the future.
  • Engineering experience. The user experience must not be compromised. All tools and features engineers used must be available during migration and even after.

Engineers:

  • Engineering experience. Similar to the criteria established at the C-level factor.
  • Early adopters engagement. A common  core experience must be created across the mobile engineering community to support other engineers in the later stages.
  • Education. Awareness campaigns must be in place. Planned and conducted a series of tech talks and workshops to raise awareness among engineers and cut the learning curve. We wrote hundreds of pages of documentation and guidelines.

Product teams:

  • No roadmap impact. Migration must not affect the product roadmap.
  • Minimize the engineering effort. Migration must not increase the efforts from engineering.

Migration automation (separate talks)

The biggest concern for the majority of the stakeholders appeared to be the estimated migration effort, which impacted the cost, the product roadmap, and the engineering experience. It became evident that we needed to streamline the process and reduce the effort for migration.

Fortunately, the actual migration process was routine in nature, so we had opportunities for automation. We investigated ideas on automating the whole migration process.

The tools we’ve created

We found that it’s relatively easy to create a bunch of tools that read the native project structure and create an equivalent Bazel set up. This was a game changer.

Things moved pretty smoothly for both Android and iOS projects. We managed to roll out tooling to migrate the codebase in a single click/command (well with some exceptions as of now. Stay tuned for another blog post on this). With this tooling combined with the hybrid build concept, we addressed all the key buy-in factors:

  • Migration cost dropped by at least 50%.
  • Less engineers required for the actual migration. There was no need to engage the wide engineering community as a small group of people can manage the whole process.
  • There is no more impact on the product roadmap.

Where do we stand today

When we were in the middle of the actual migration, we decided to take a pragmatic path and migrate our applications in phases to ensure everything was under control and that there were no unforeseen issues.

The hybrid build time is racing alongside our migration progress. It has a linear dependency on the amount of the migrated code. The figures look positive and we are confident in achieving our impact goal of decreasing at least 40% of the build time.

Plans to open source

The automated migration tooling we’ve created is planned to be open sourced. We are doing a bit better on the Android side decoupling it from our applications’ implementation details and plan to open source it in the near future.

The iOS tooling is a bit behind, and we expect it to be available for open-sourcing by the end of Q1’2021.

Is it worth it all?

Bazel is not a silver bullet for the build time and your project. There are a lot of edge cases you’ll never know until it punches you straight in your face.

It’s far from industry standard and you might find yourself having difficulty hiring engineers with such knowledge. It has a steep learning curve as well. It’s absolutely an overhead for small to medium-sized projects, but it’s undeniably essential once you start playing in a high league of super apps.

If you were to ask whether we’d go this path again, the answer would come in a fast and correct way – yes, without any doubts.


Authored by Sergii Grechukha on behalf of the Passenger App team at Grab. Special thanks to Madushan Gamage, Mikhail Zinov, Nguyen Van Minh, Mihai Costiug, Arunkumar Sampathkumar, Maryna Shaposhnikova, Pavlo Stavytskyi, Michael Goletto, Nico Liu, and Omar Gawish for their contributions.


Join us

Grab is more than just the leading ride-hailing and mobile payments platform in Southeast Asia. We use data and technology to improve everything from transportation to payments and financial services across a region of more than 620 million people. We aspire to unlock the true potential of Southeast Asia and look for like-minded individuals to join us on this ride.

If you share our vision of driving South East Asia forward, apply to join our team today.

Keeping 170 libraries up to date on a large scale Android App

Post Syndicated from Grab Tech original https://engineering.grab.com/keeping-170-libraries-up-to-date-on-a-large-scale-android-app

To scale up to the needs of our customers, we’ve adopted ways to efficiently deliver our services through our everyday superapp – whether it’s through continuous process improvements or coding best practices. For one, libraries have made it possible for us to increase our development velocity. In the Passenger App Android team, we’ve a mix of libraries – from libraries that we’ve built in-house to open source ones.

Every week, we release a new version of our Passenger App. Each update contains on average between five to ten library updates. In this article, we will explain how we keep all libraries used by our app up to date, and the different actions we take to avoid defect leaks into production.

How many libraries are we using?

Before we add a new library to a project, it goes through a rigorous assessment process covering many parts, such as security issue detection and usability tests measuring the impact on the app size and app startup time. This process ensures that only libraries up to our standards are added.

In total, there are more than 170 libraries powering the SuperApp, including 55 AndroidX artifacts and 22 libraries used for the sole purpose of writing automation testing (Unit Testing or UI Testing).

Who is responsible for updating

While we do have an internal process on how to update the libraries, it doesn’t mention who and how often it should be done. In fact, it’s everyone’s responsibility to make sure our libraries are up to date. Each team should be aware of the libraries they’re using and whenever a new version is released.

However, this isn’t really the case. We’ve a few developers taking ownership of the libraries as a whole and trying to maintain it. With more than 170 external libraries, we surveyed the Android developer community on how they manage libraries in the company. The result can be summarized as follow:

Survey Results
Survey Results

While most developers are aware of updates, they don’t update a library because the risk of defects leaking into production is too high.

Risk management

The risk is to have a defect leaking into production. It can cause regressions on existing features or introduce new crashes in the app. In a worst case scenario, if this isn’t caught before publishing, it can force us to make a hotfix and a certain number of users will be impacted.

Before updating (bump) a library, we evaluate two metrics:

  • the usage of this library in the codebase.
  • the number of changes introduced in the library between the current version and the targeted version.

The risk needs to be assessed between the number of usages of a certain library and the size of the changes. The following chart illustrate this point.

Risk Assessment Radar

This arbitrary scale helps us in deciding if we will require additional signoff from the QA team. If the estimation places the item on the bottom-left corner, the update will be less risky while if it’s on the top-right corner, it means we should follow extra verification to reduce the risk.

A good practice to reduce the risks of updating a library is to update it frequently, decreasing the diffs hence reducing the scope of impact.

Reducing the risk

The first thing we’re doing to reduce the risk is to update our libraries on a weekly basis. As described above, small changes are always less risky than large changes even if the usage of this partial library is wide. By following incremental updates, we avoid accumulating potential issues over a longer period of time.

For example, the Android Jetpack and Firebase libraries follow a two-week release train. So every two weeks, we check for new updates, read the changelogs, and proceed with the update.

In case of a defect detected, we can easily revert the change until we figure out a proper solution or raise the issue to the library owner.

Automation

To reduce risk on any merge request (not limited to library update), we’ve spent a tremendous amount of effort on automating tests. For each new feature we’ve a set of test cases written in Gherkin syntax.

Automation is implemented as UI tests that run on continuous integration (CI) for every merge request. If those tests fail, we won’t be able to merge any changes.

To further elaborate, let’s take this example: Team A developed a lot of features and now has a total of 1,000 test cases. During regression testing before each release, only a subset of those are executed manually based on the impacted area. With automation in place, team A now has 60% of those tests executed as part of CI. So, when all the tests successfully pass, we’re already 60% confident that no defect is detected. This tremendously increases our confidence level while reducing manual testing.

QA signoff

When the update is in the risk threshold area and the automation tests are insufficient, the developer works with QA engineers on analyzing impacted areas. They would then execute test cases related to the impacted area.

For example, if we’re updating Facebook library, the impacted area would be the “Login with Facebook” functionality. QA engineers would then run test cases related to social login.

A single or multiple team can be involved. In some cases, QA signoff can be required by all the teams if they’re all affected by the update.

This process requires a lot of effort from different teams and can affect the current roadmap. To avoid falling into this category, we refine the impacted area analysis to be as specific as possible.

Update before it becomes mandatory

Google updates the Google Play requirements regularly to ensure that published apps are fully compatible with the latest Android version.

For example, starting 1st November 2020 all apps must target API 29. This change causes behavior changes for some API. New behavior has to be supported and verified for our code, but also for all the libraries we use. Libraries bundled inside our app are also affected if they’re using Android API. However, the support for newer API is done by each library maintainer. By keeping our libraries up to date, we ensure compatibility with the latest Android API.

Key takeaways

  • Keep updating your libraries. If they’re following a release plan, try to match it so it won’t accumulate too many changes. For every new release at Grab, we ship a new version each week, which includes between 5 to 10 libraries bump.

  • For each update, identify the potential risks on your app and find the correct balance between risk and effort required to mitigate this. Don’t overestimate the risk, especially if the changes are minimal and only include some minor bug fixing. Some library updates don’t even change any single line of code and are only documentation updates.

  • Invest in robust automation testing to create a high confidence level when making changes, including potentially large changes like a huge library bump.


Authored by Lucas Nelaupe on behalf of the Grab Android Development team. Special thanks to Tridip Thrizu and Karen Kue for the design and copyediting contributions.


Join us

Grab is more than just the leading ride-hailing and mobile payments platform in Southeast Asia. We use data and technology to improve everything from transportation to payments and financial services across a region of more than 620 million people. We aspire to unlock the true potential of Southeast Asia and look for like-minded individuals to join us on this ride.

If you share our vision of driving South East Asia forward, apply to join our team today.