Post Syndicated from Brad Berwald original https://blog.zabbix.com/data-solution-for-solar-energy-application/13005/
Morningstar, the world’s leading supplier of solar controllers for remote solar power systems, has partnered with Zabbix to provide pre-configured integration of their data-enabled solar power products with the Zabbix network monitoring solution. Now, both power system data and network performance metrics integrate seamlessly to allow remote solar systems to be monitored and managed from a single software platform on the premise or in the cloud, using solutions from Zabbix.
Contents
I. About Morningstar (1:43)
II. Products and technology (6:01)
III. Data solution for solar application (10:28)
IV. Zabbix solution (15:09)
V. Conclusion (21:40)
VI. Questions and Answers (23:09)
In this post, an overview of Morningstar’s diverse product line is presented and the industry applications they support, as well as of how the Zabbix network monitor can be used to manage and log time-series data using SNMP and MODBUS protocols for powerful and scalable system oversight and trend analysis.
Morningstar has been working in partnership with Zabbix to provide integration for the Morningstar products, including easy-to-use templates and pre-formatted data sets in order to speed up getting these products online, so that customers can monitor both their network data and solar power system data at remote sites.
About Morningstar
Morningstar is the leading supplier of charge controllers and inverters generally used in remote power systems around the world.
Morningstar, located in Newtown, Pennsylvania, USA, has sold over 4 million products deployed into the field since the company’s inception in 1993. Morningstar currently works in over 100 countries and provides reliable remote power for mission-critical applications.
We’d like to think of ourselves as the ‘charging experts’ because of our focus on battery life and many years of charging innovation. We have a diverse product line and many models designed for application specific needs, such as solar lighting and telecommunications. Morningstar has one of the lowest hardware failure rates in the industry.
Some of these mission-critical applications include:
— Residential and rural electrification.
— Commercial systems.
— Industrial products, including telecommunications, oil and gas, security applications.
— Mobile and marine application, which generally includes boats, RVs, and caravans, agricultural applications, etc.

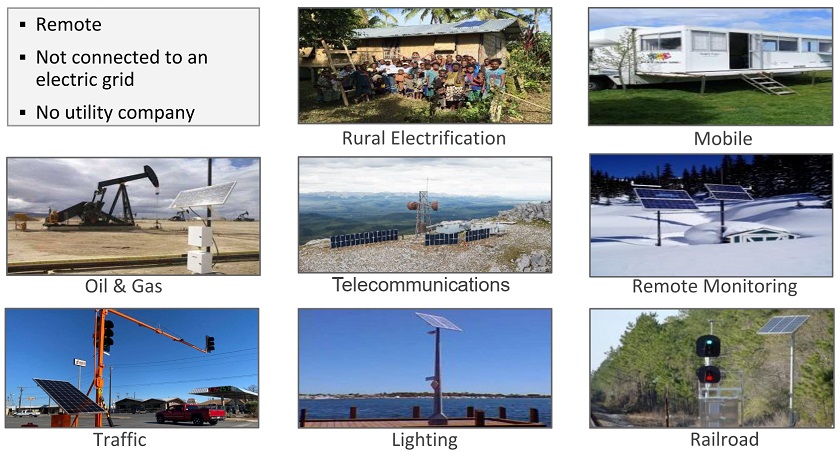
Overview of Morningstar solar applications
— Railroad industry where remote signaling and track management is often remotely powered by solar applications because of its critical nature and absence of a readily available electric grid.
— Traffic applications, early warning systems, signaling messaging systems, traffic, and speed monitoring equipment also can be easily powered for mobile deployment with a battery-based system.
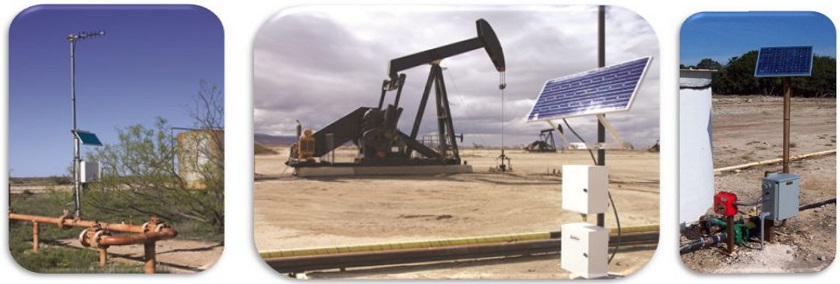
— Oil and gas industry is a specific and notable market for Morningstar, because oil field automation measurement of the gas flow and pressure (RTUs), as well as methane injection points used to keep the gas flowing and avoid well freeze-ups, can be powered by solar power with a very modest amount of power for data monitoring. Since the pipelines often traverse very remote regions, this is highly advantageous to get power where it’s needed.

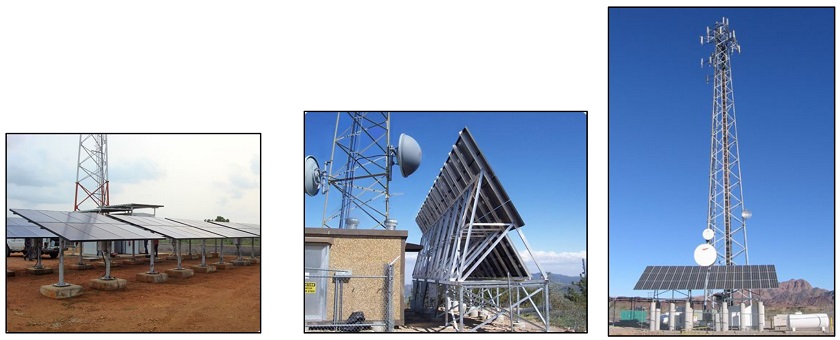
— In telecommunications, cellular base stations and backhaul links to provide the data for the sites, lane mobile radio applications, and satellite-based infrastructure benefit from remote solar power. In these applications, the loads can be modest or they can be quite significant. In that case, several controllers can be combined together to charge a very large battery bank often with a hybrid diesel gen-set in conjunction with other renewable energy sources to provide a hybrid power system. This increases reliability, provides diversity during inclement weather, and maintains the high integrity of the site link.

— In the cases of rural electrification, small amounts of DC power can be provided in remote locations with no grid access in the countries with a large populace and huge needs for lighting and cell phone charging.
Recently, we did a notable project in Peru, where nearly 1 million Peruvians were provided remote power access using 200,000 DC energy boxes. They provided basic 12V DC power, USB charging, and were distributed over the country in some of the most remote locations. These home systems easily met the needs for lighting, device charging and other small equipment power needs. In addition, 3,000 integrated power systems for community centers were also deployed to provide 230V AC power for more critical loads, including more substantial lighting, communication and, in some cases, health equipment for the benefit of the local population.
So, we’re very proud to have deployed probably one of the largest and most ambitious rural electrification projects in the history of the off-grid industry. The project was completed last year with our partner Tozzi Green of Italy.
Products and technology
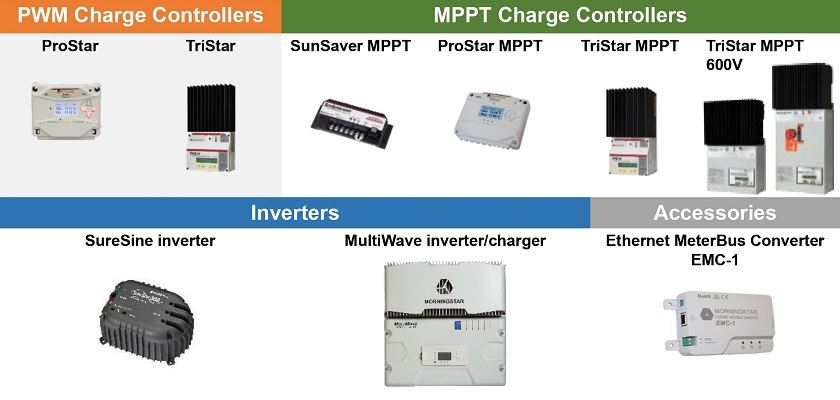
Morningstar has a diverse product set covering all power levels — anywhere from modest 50W needs up to models that handle 3.2kW per device and that can be paralleled for even greater capacity. We also provide inverter systems in both our SureSine and coming MultiWave, which will be coming to market in the near future. These inverters provide AC power and enable hybrid system charging (combining both solar and AC sources together). These meet more demanding load needs and add robust high current charging capabilities from the grid or from diesel generators.

Morningstar products and technologies
So, together all these product lines make up a diverse set of products that really fulfill the variety of needs in an off-grid remote power system. In many cases, each of our products includes open communication protocols, which can be used for remote management.
Charge controllers
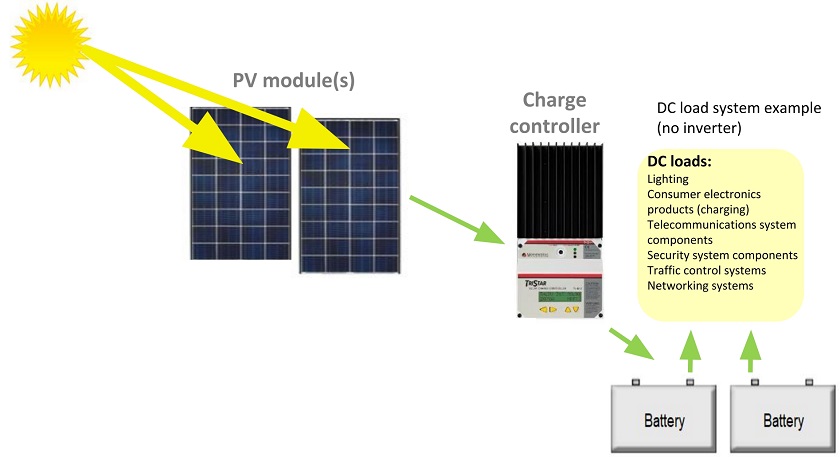
A charge controller is installed between the PV modules and the battery. It monitors various system power and voltage readings and temperatures, The charge controlled is also intended for managing the batteries in order to provide long-life adequate charging, take the batteries through their various charging stages, and to manage the DC loads connected to the device. They can, of course, extend the battery life significantly if the battery’s setpoints are configured correctly and the right choice for the battery model is made. That depends a lot on the battery chemistry, the temperatures it will experience, and how deeply it will be cycled or discharged each day while providing power to the system.
We have products in both the PWM and MPPT in our line of charge controller topologies.

MPPT controllers are able to convert DC power from the PV array to the proper battery voltage. So, it has an integrated DC-to-DC converter and controls the charge of the battery preventing overcharging and extending the life.

It is also used with one of our inverter products in order to provide small AC loads, such as equipment that requires 120 or 230-volt power remotely in the field.
Our product line covers a variety of PWM charge controllers.

PWM charge controllers
- Pulse width modulation products are more cost-effective, simpler in design (from a complexity standpoint), and provide direct charging from an equally sized nominal solar array.
- The MPPT charge controller line ensures the maximum power point is tracked (MPPT), therefore optimizing power harvest. The modules can be of a much wider range of voltages, much higher voltage, and will actually be monitored and tracked by the controller to provide the optimal operating point for the system.
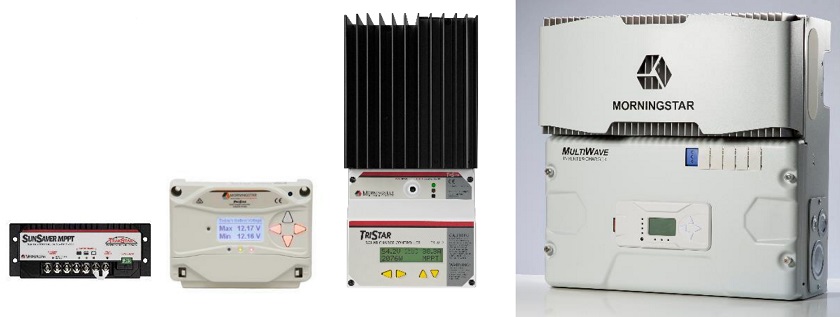
- The SunSaver and ProStar MPPT lines are used extensively in smaller systems under a thousand watts.
- Our TriStar family is used for 3kW or greater and is able to be paralleled. A notable product is our 600V controller, which allows the PV modules to be wired in series for very high voltage input providing advantages in efficiency and PV array distance from the controller. All the MPPT controllers will take the input voltage and conver to the proper output voltage. They will convert it to the expected output to support 12V, 24V, or 48V battery systems.
- Morningstar inverter line includes the SureSine and MultiWave inverter chargers. We also have a very extensive line of accessories used with each of these controllers. These generally provide protocol conversion hardware, interface adapters, and other items that can control relays to support system control or actuate additional components in remote off-grid systems.
EMC-1 Morningstar’s Ethernet MeterBus converter
EMC-1 is a simple serial 2 Ethernet converter that also supports a real-time operating system and a variety of protocols. So, Morningstar products can be connected to industry-specific applications using those standard protocols — Modbus over IP, or SNMP. It can display a simple HTML web GUI to allow direct connection and a one-to-one basis with the product for simple status monitoring using any type of device, including mobile devices, such as phones or tablets.
Data solution for solar application
Challenges to remote monitoring of solar power sources
Power for wireless ISP infrastructure is a common off-grid application requiring network traffic and power to be monitored together. Customers’ access in the field using Wi-Fi or LTE communications should also be enabled.
When these devices are deployed, clearly they have to have their network equipment monitored with the network management system or NMS. These network monitors can now be enabled with EMS and using SNMP, and Zabbix to make this far easier to integrate the power systems into the same monitoring system. So, you have a single point of software and data collection, and both power and network bandwidth and status can be monitored at the same time.
What this monitoring can help achieve:
- Measurement of the true load consumption in the field. The power levels will vary depending on the type, amount of usage, and the technology and frequencies used. So, the load in the field throughout the day, during peak and off-peak hours can be directly monitored in real time.
- Detection and root cause of network outages. We need to minimize network outages and to ensure that the site is reliable and the network is on at all times to avoid customer dissatisfaction and frustration by the operating carrier. The ability to monitor both power and network allows the root cause of network outages to be determined, whether it’s a system configuration, bandwidth restrictions, or something that has caused difficulty with the power system itself, such as a depleted battery, insufficient solar, even electrical faults, or possibly tampering with the system.
- Ensuring sufficient power at the site to prevent deep battery discharge. It also ensures that you have adequate PV to cycle the battery properly. So, when the battery is depleted each day from powering the loads, it can be fully recharged the next day when PV power is available again. This balance is difficult to manage because you have to always ensure power for the battery, protect the loads, but you may or may not have adequate sun each day. So, reserve power is often provided in the system to ensure that the site will remain up during lower than average or uneven periods of PV supply.
— Measurement of the current system status, as well as historical data. Measurement of all this data is ensured by the network monitoring software. Sometimes, with a high level of granularity, so that you can see what is happening in the system on a minute-by-minute or hour-by-hour basis. This helps detect system faults otherwise missed.
— Ensuring system resiliency during low periods of production. In peak times, you usually have more than adequate power. However, off-grid systems may be system-sized in order to handle a worst-case scenario, for instance, for the winter months or the off-peak months with the less amount of sun hours and lower levels of solar insulation that can provide as much power as you expected during the summer. So, during these worst-case periods of the year, monitoring can be really critical because it’s when you’re most likely to experience an outage due to inadequate solar.
- When long-term data is available, you can compare, for instance, month-to-month or season-to-season power output, as well as look at trends and analyze the system lifetime of operation to detect anomalies and negative trends during operation to indicate pending battery failure.
With a lot of lead-acid batteries, a minimum of five years is generally acceptable. With newer lithium technologies, battery life is extended to 10 or more years when adequately sized. So, the batteries can have a robust life as long as they are sized correctly and given adequate power.
But monitoring the end stage of a battery, which most likely will occur at some time in the system, is really critical. Many remote sites that are deployed for an extended period of time can go through one or two battery replacement cycles. So, a downward trend with the power declining over time and the batteries beginning to show signs that their health is no longer adequate to support the system can be detected with this long-term data analysis.
Zabbix solution

Remote monitoring of a Morningstar EMC-1 adapter’s IP connection through Zabbix monitoring platform
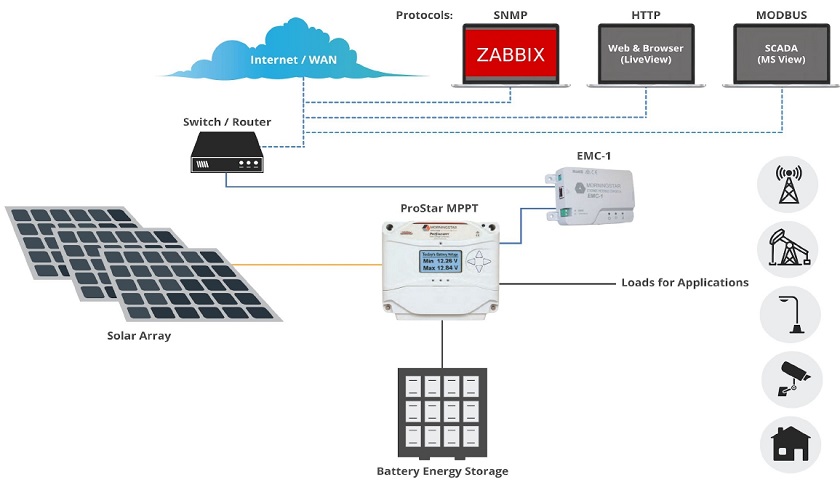
A typical system in this diagram shows one of the ProStar MPPT controllers connected to a solar array and a battery storage system. Loads can be typical among many of the applications. EMC-1 can be connected to the device in order to provide IP connectivity. That’s something that can be connected to a variety of services:
- Modbus protocol to connect to SCADA or other HMI Data viewing solutions, which are common in automation and oil and gas.
- Simple HTTP or HTML web pages to get a simple look at a dashboard to understand what’s going on in the system.
- SNMP can be used alongside the network monitoring software, and the Zabbix network monitoring software can be enabled to monitor the entire site with just one tool.
Being cloud-based or server-based can have great applications for energy storage, data logging, notifications, and alarms. Native or external databases in the cloud can be used to archive the large amounts of data that will be accumulated. The sites can grow to hundreds or even thousands of deployed systems. So, the software tool and the server must be scalable so that they can grow in time and keep up with the needs of the data.
Advantages:
- The benefits of an IP-based solution involve its compatibility with any network transport layer. In addition, there’s a variety of wireless applications in the field, including point-to-point, licensed, unlicensed, Wi-Fi, proprietary, wireless protocols,and cellular.
- Recently, notable gains in the satellite industry have provided lower latency and higher bandwidth. With satellite, you can often reach almost any part of the world, which gives it great benefits for solar power applications.
- SNMP — a very lightweight protocol. On a metered and wireless connection, especially in these hard-to-reach locations, low overhead UDP packets and minimal infrastructure for monitoring can make sure that you have minimal impact on the system itself in terms of overhead.
Zabbix dashboards for Morningstar solar systems 
- Native Morningstar SNMP support is provided by these tools. We work to review use cases, system needs for solar applications, as well as data sets. The MIB files are already being imported and device templates are being pre-configured for a variety of Morningstar product solutions that support the EMC-1.
- Dedicated templates allow you to easily connect the hardware to an existing system and go about monitoring Morningstar’s tools using your existing Zabbix instance.
- Performance visibility of solar-powered systems is available:
— on a very high level to see if there are any systems that have needs or are in a fault state, or
— in greater detail to analyze the time series data and to allow you to correlate that data with other aspects of the system, to determine what is the root cause of the system and how that data is trending. Time series data correlation provides for accelerated troubleshooting.
- At a glance dashboard management tool makes it easy to monitor the status of all Morningstar devices on the network and to scale to hundreds of sites.
- Active advanced and custom alerts sent out by the Zabbix system and triggered by the power system events ensure proactive notification of when there is a pending issue at the site, hopefully, before critical loads drop. If you can be notified, then using the bi-directional nature of some of the other protocols, system changes, corrections, extended runtimes, or even auxiliary charging systems, such as generators, can be activated to prevent an outage. Such proactive monitoring can only take place when you’re working at scale using a tool such as Zabbix.
Advantages of monitoring with Zabbix

- Morningstar provides some simple PC-based utilities that run on Windows software and can provide direct Modbus capability for communication, very simple data logging on a very small number of devices. Morningstar MSView functional utility allows configuration files for the products to be uploaded and deployed to the controllers in the field, as well as basic troubleshooting.
- Morningstar Live View is our built-in web dashboard that also runs on the EMC. It allows a simple web page with everything displayed in HTML so that it can be viewed on any device regardless of the operating system.
These two products are meant for troubleshooting, site deployment, and configuration of small-scale systems. They’re not set to be scaled.
- With Zabbix, an almost unlimited number of devices can be connected depending on your computing resources and power.
- Zabbix supports SNMP and Modbus, which is beneficial for both telecom and industrial automation or smart city applications.
- Zabbix gives you a real-time data display, as well as custom alerts and notifications. You can set up custom log intervals, downloading of extensive amounts of log data, etc. Reports can be generated based on custom filtering, as well as long-term historical data, which becomes more critical to understanding the site’s longevity.
- There are cloud-based systems where APIs are available, cloud-to-cloud integrations can be utilized and advanced data management analysis or intelligence can be added onto existing servers by using additional third-party tools.
So, it’s really the only way to manage data of this scale and size.
Conclusion
Zabbix adds a great deal of value and capabilities to Morningstar products when used in the field. If additional access is provided via satellite, cellular, or fixed wireless technologies, then the charge controllers can perform their duty of providing remote power for these systems but easily integrating using the existing protocols to monitor across the entire system deployment.
As solar equipment is often used to provide power for remote network infrastructure. Integrating data from the network components and power systems into a centralized NMS provides an essential management tool to optimize system health and increase uptime. Zabbix also adds configuration options and valuable data analytics to ensure full system visibility. More information on the Zabbix network monitoring tools or Morningstar data-enabled remote power products is available at https://www.zabbix.com and www.morningstarcorp.com or can be requested from [email protected] and [email protected], respectively.
Questions and Answers
Question. Are Morningstar templates shared somewhere? Are they available to the public?
Answer. A part of the partnership with Zabbix is to get all this integrated. We’re putting the finishing touches on how that will be available and easily downloadable as part of our SNMP support documentation. In addition, we can do some cross-referring, so that we can help our products get online. Hopefully, you can get them plugged into the major network monitoring access. All that will be available probably within the next month.
Question. Zabbix starting from 5.2 natively supports Modbus and MQTT. Do you plan on using that in your environment?
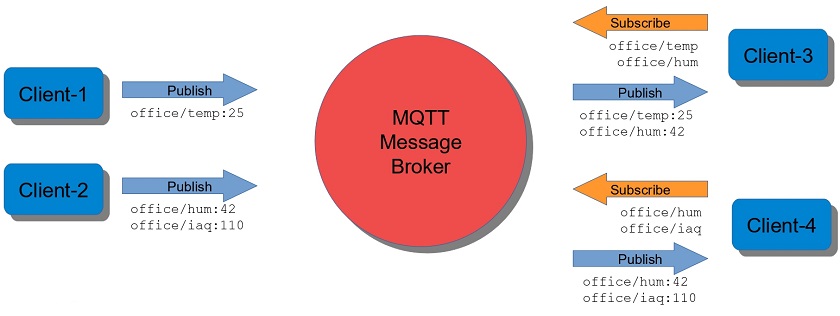
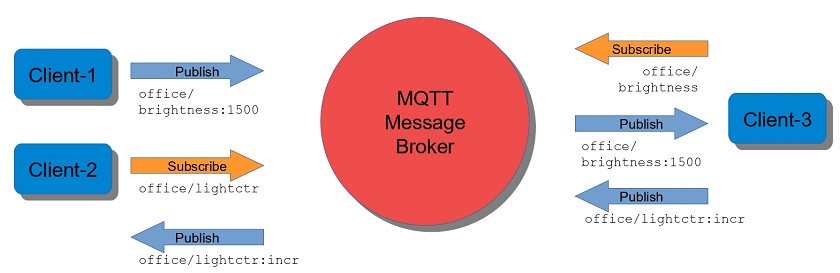
Answer. Yes, MQTT has come up quite recently and is an indeal solution where IP addressing challenges exist and pub/sub style data reporting is preferred from session initiated within the network. Currently, we support Modbus and SNMP, though we are considering other protocols. Modbus has been used within the solar industry for a long time for automation and control. We also have extenive market in the oil gas industry, where they utilize Modbus both for polling of the data, as well as real-time control by actually making configuration changes to the product remotely.
SNMP is a more recent development and it helps to get on the bandwagon with telecommunications and IT-related markets. So, it’s an easy transition using a protocol that customers are already familiar with.
Question. How do you use report generation? How do you enable it and implement it in Zabbix?
Answer. A lot of our customers are looking for trending data over a certain period of time. So, they would set up regular intervals for the data to be collected and reported because the long-term trending data is about looking at the same site during different periods of time or looking at the same site next to its peers to see how the power system may be varying from what is expected. So, regular report intervals can be executed and filtered based on certain conditions.
There are really a few key parameters of a solar site to look at to understand the health of the system. You need to focus on the battery levels, the maximum power of the solar panel, and a quick diagnostic check to find out if the controller shows any faults or alarms. So, if you have a simple report you can quickly be sure that hundreds of sites are in good shape. If one of them isn’t, you could drill down into more detail on just that specific site.



 Dr. Yannick Misteli is leading cloud platform and ML engineering teams in global product strategy (GPS) at Roche. He is passionate about infrastructure and operationalizing data-driven solutions, and he has broad experience in driving business value creation through data analytics.
 João Antunes is a Data Engineer in the Global Product Strategy (GPS) team at Roche. He has a track record of deploying Big Data batch and streaming solutions for the telco, finance, and pharma industries.
 Matt Noyce is a Senior Cloud Application Architect at AWS. He works together primarily with Life Sciences and Healthcare customers to architect and build solutions on AWS for their business needs.
 Debu Panda, a Principal Product Manager at AWS, is an industry leader in analytics, application platform, and database technologies, and has more than 25 years of experience in the IT world. Debu has published numerous articles on analytics, enterprise Java, and databases and has presented at multiple conferences such as re:Invent, Oracle Open World, and Java One. He is lead author of the EJB 3 in Action (Manning Publications 2007, 2014) and Middleware Management (Packt).