Tag Archives: code scanning

Fixing security vulnerabilities with AI

Post Syndicated from Tiferet Gazit original https://github.blog/2024-02-14-fixing-security-vulnerabilities-with-ai/


In November 2023, we announced the launch of code scanning autofix, leveraging AI to suggest fixes for security vulnerabilities in users’ codebases. This post describes how autofix works under the hood, as well as the evaluation framework we use for testing and iteration.

What is code scanning autofix?

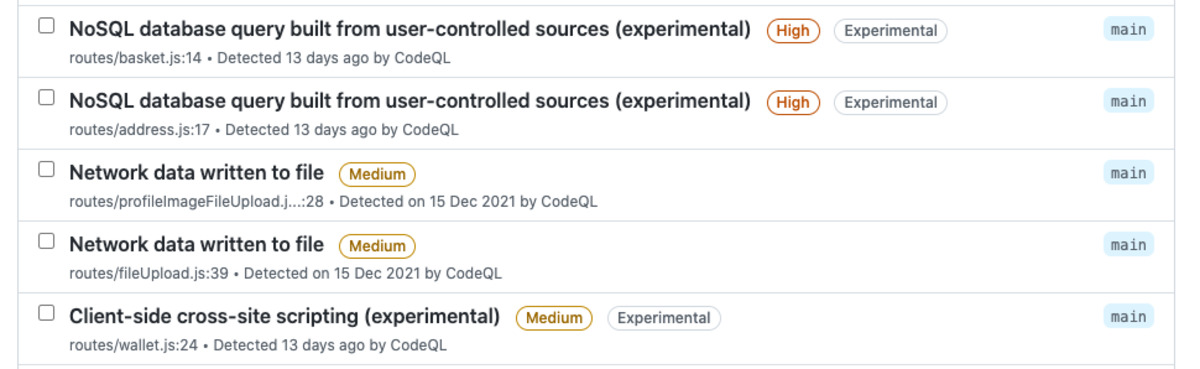
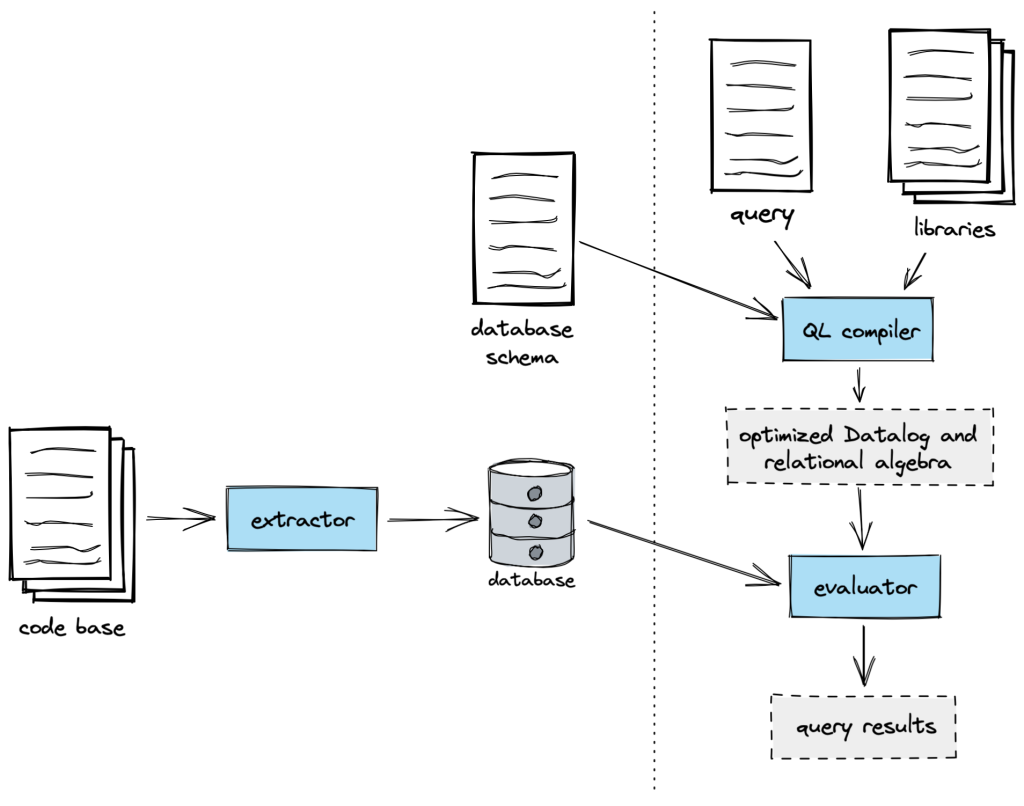
GitHub code scanning analyzes the code in a repository to find security vulnerabilities and other errors. Scans can be triggered on a schedule or upon specified events, such as pushing to a branch or opening a pull request. When a problem is identified, an alert is presented to the user. Code scanning can be used with first- or third-party alerting tools, including open source and private tools. GitHub provides a first party alerting tool powered by CodeQL, our semantic code analysis engine, which allows querying of a codebase as though it were data. Our in-house security experts have developed a rich set of queries to detect security vulnerabilities across a host of popular languages and frameworks. Building on top of this detection capability, code scanning autofix takes security a step further, by suggesting AI-generated fixes for alerts. In its first iteration, autofix is enabled for CodeQL alerts detected in a pull request, beginning with JavaScript and TypeScript alerts. It explains the problem and its fix strategy in natural language, displays the suggested fix directly in the pull request page, and allows the developer to commit, dismiss, or edit the suggestion.

The basic idea behind autofix is simple: when a code analysis tool such as CodeQL detects a problem, we send the affected code and a description of the problem to a large language model (LLM), asking it to suggest code edits that will fix the problem without changing the functionality of the code. The following sections delve into some of the details and subtleties of constructing the LLM prompt, processing the model’s response, evaluating the quality of the feature, and serving it to our users.

The autofix prompt

At the core of our technology lies a request to an LLM, expressed through an LLM prompt. CodeQL static analysis detects a vulnerability, generating an alert that references the problematic code location as well as any other relevant locations. For example, for a SQL-injection vulnerability, the alert flags the location where tainted data is used to build a database query, and also includes one or more flow paths showing how untrusted data may reach this location without sanitization. We extract information from the alert to construct an LLM prompt consisting of:

  • General information about this type of vulnerability, typically including a general example of the vulnerability and how to fix it, extracted from the CodeQL query help.
  • The source-code location and content of the alert message.
  • Relevant code snippets from the locations all along the flow path and any code locations referenced in the alert message.
  • Specification of the response we expect.

We then ask the model to show us how to edit the code to fix the vulnerability.

We describe a strict format for the model output, to allow for automated processing. The model outputs Markdown consisting of the following sections:

  1. Detailed natural language instructions for fixing the vulnerability.
  2. A full specification of the needed code edits, following the format defined in the prompt.
  3. A list of dependencies that should be added to the project, if applicable. This is needed, for example, if the fix makes use of a third-party sanitization library on which the project does not already depend.

We surface the natural language explanation to users together with the code scanning alert, followed by a diff patch constructed from the code edits and added dependencies. Users can review the suggested fix, edit and adjust it if necessary, and apply it as a commit in their pull request.

Pre- and post-processing

If our goal were to produce a nice demo, this simple setup would suffice. Supporting real-world complexity and overcoming LLM limitations, however, requires a combination of careful prompt crafting and post-processing heuristics. A full description of our approach is beyond the scope of this post, but we outline some of the more impactful aspects below.

Selecting code to show the model

CodeQL alerts include location information for the alert and sometimes steps along the data flow path from the source to the sink. Sometimes additional source-code locations are referenced in the alert message. Any of these locations may require edits to fix the vulnerability. Further parts of the codebase, such as the test suite, may also need edits, but we focus on the most likely candidates due to prompt length constraints.

For each of these code locations, we use a set of heuristics to select a surrounding region that provides the needed context while minimizing lines of code, eliding less relevant parts as needed to achieve the target length. The region is designed to include the imports and definitions at the top of the file, as these often need to be augmented in the fix suggestion. When multiple locations from the CodeQL alert reside in the same file, we structure a combined code snippet that gives the needed context for all of them.

The result is a set of one or more code snippets, potentially from multiple source-code files, showing the model the parts of the project where edits are most likely to be needed, with line numbers added so as to allow reference to specific lines both in the model prompt and in the model response. To prevent fabrications, we explicitly constrain the model to make edits only to the code included in the prompt.

Adding dependencies

Some fixes require adding a new project dependency, such as a data sanitation library. To do so, we need to find the configuration file(s) that list project dependencies, determine whether the needed packages are already included, and if not make the needed additions. We could use an LLM for all these steps, but this would require showing the LLM the list of files in the codebase as well as the contents of the relevant ones. This would increase both the number of model calls and the number of prompt tokens. Instead, we simply ask the model to list external dependencies used in its fix. We implement language-specific heuristics to locate the relevant configuration file, parse it to determine whether the needed dependencies already exist, and if not add the needed edits to the diff patch we produce.

Specifying a format for code edits

We need a compact format for the model to specify code edits. The most obvious choice would be asking the model to output a standard diff patch directly. Unfortunately, experimentation shows that this approach exacerbates the model’s known difficulties with arithmetic, often yielding incorrect line number computations without enough code context to make heuristic corrections. We experimented with several alternatives, including defining a fixed set of line edit commands the model can use. The approach that yielded the best results in practice involves allowing the model to provide “before” and “after” code blocks, demonstrating the snippets that require changes (including some surrounding context lines) and the edits to be made.

Overcoming model errors

We employ a variety of post-processing heuristics to detect and correct small errors in the model output. For example, “before” code blocks might not exactly match the original source-code, and line numbers may be slightly off. We implement a fuzzy search to match the original code, overcoming and correcting errors in indentation, semicolons, code comments, and the like. We use a parser to check for syntax errors in the edited code. We also implement semantic checks such as name-resolution checks and type checks. If we detect errors we are unable to fix heuristically, we flag the suggested edit as (partially) incorrect. In cases where the model suggests new dependencies to add to the project, we verify that these packages exist in the ecosystem’s package registry and check for known security vulnerabilities or malicious packages.

Evaluation and iteration

To make iterative improvements to our prompts and heuristics while at the same time minimizing LLM compute costs, we need to evaluate fix suggestions at scale. In taking autofix from demo quality to production quality, we relied on an extensive automated test harness to enable fast evaluation and iteration.

The first component of the test harness is a data collection pipeline that processes open source repositories with code scanning alerts, collecting alerts that have test coverage for the alert location. For JavaScript / TypeScript, the first supported languages, we collected over 1,400 alerts with test coverage from 63 CodeQL queries.

The second component of the test harness is a GitHub Actions workflow that runs autofix on each alert in the evaluation set. After committing the generated fix in a fork, the workflow runs both CodeQL and the repository’s test suite to evaluate the validity of the fix. In particular, a fix is considered successful only if:

  • It removes the CodeQL alert.
  • It introduces no new CodeQL alerts.
  • It produces no syntax errors.
  • It does not change the outcome of any of the repository tests.

As we iterated on the prompt, the code edit format, and various post-processing heuristics, we made use of this test harness to ensure that our changes were improving our success rate. We coupled the automated evaluations with periodic manual triage, to focus our efforts on the most prevalent problems, as well as to validate the accuracy of the automated framework. This rigorous approach to data-driven development allowed us to triple our success rate while at the same time reducing LLM compute requirements by a factor of six.

Architecture, infrastructure, and user experience

Generating useful fixes is a first step, but surfacing them to our users requires further front- and back-end modifications. Designing for simplicity, we’ve built autofix on top of existing functionality wherever possible. The user experience enhances the code scanning pull request experience. Along with a code scanning alert, users can now see a suggested fix, which may include suggested changes in multiple files, optionally outside the scope of the pull request diff. A natural language explanation of the fix is also displayed. Users can commit the suggested fixes directly to the pull request, or edit the suggestions in their local IDE or in a GitHub Codespace.

The backend, too, is built on top of existing code scanning infrastructure, making it seamless for our users. Customers do not need to make any changes to their code scanning workflows to see fix suggestions for supported CodeQL queries.

Diagram outlining the code scanning pull request workflow.

The user opens a pull request or pushes a commit. Code scanning runs as usual, as part of an actions workflow or workflow in a third-party CI system, uploading the results in the SARIF format to the code scanning API. The code scanning backend service checks whether the results are for a supported language. If so, it runs the fix generator as a CLI tool. The fix generator leverages the SARIF alert data, augmented with relevant pieces of source-code from the repository, to craft a prompt for the LLM. It calls the LLM via an authenticated API call to an internally-deployed API running LLMs on Azure. The LLM response is run through a filtering system which helps prevent certain classes of harmful responses. The fix generator then post-processes the LLM response to produce a fix suggestion. The code scanning backend stores the resulting suggestion, making it available for rendering alongside the alert in pull request views. Suggestions are cached for reuse where possible, reducing LLM compute requirements.

As with all GitHub products, we followed standard and internal security procedures, and put our architectural design through a rigorous security and privacy review process to safeguard our users. We also took precautions against AI-specific risks such as prompt injection attacks. While software security can never be fully guaranteed, we conducted red team testing to stress-test our model response filters and other safety mechanisms, assessing risks related to security, harmful content, and model bias.

Telemetry and monitoring

Before launching autofix, we wanted to ensure that we could monitor performance and measure its impact in the wild. We don’t collect the prompt or the model responses because these may contain private user code. Instead, we collect anonymized, aggregated telemetry on user interactions with suggested fixes, such as the percentage of alerts for which a fix suggestion was generated, the percentage of suggestions that were committed as-is to the branch, the percentage of suggestions that were applied through the GitHub CLI or Codespace, the percentage of suggestions that were dismissed, and the fix rate for alerts with suggestions versus alerts without. As we onboard more users onto the beta program, we’ll look at this telemetry to understand the usefulness of our suggestions.

Additionally, we’re monitoring the service for errors, such as overloading of the Azure model API or triggering of the filters that block harmful content. Before expanding autofix to unlimited public beta and eventually general availability, we want to ensure a consistent, stable user experience.

What’s next?

As we roll out the code scanning autofix beta to an increasing number of users, we’re collecting feedback, fixing papercuts, and monitoring metrics to ensure that our suggestions are in fact useful for security vulnerabilities in the wild. In parallel, we’re expanding autofix to more languages and use cases, and improving the user experience. If you want to join the public beta, sign up here. Keep an eye out for more updates soon!

Harness the power of CodeQL. Get started now.

The post Fixing security vulnerabilities with AI appeared first on The GitHub Blog.

3 ways to meet compliance needs without slowing down agility

Post Syndicated from Mark Paulsen original https://github.blog/2023-02-24-3-ways-to-meet-compliance-needs-without-slowing-down-agility/

In the previous blog, Setting the foundations for compliance, we set the groundwork for developer-enabled compliance that will keep your teams happy, in the flow, secure, compliant, and auditable.

Today, we’ll walk through three practical ways that you can start meeting your compliance requirements without having to revolutionize or transform the culture in your company—all while enabling your developers to be more productive and happy.

1. Do the basics well and often

The first way to start meeting your compliance requirements is often overlooked because it’s so simple. No matter what industry you are in, whether it’s finance, automotive, government, or tech, there are some basic quick compliance wins that may be part of your existing developer workflows and culture.

Code review

A key part of writing clean code is code review. But having a repeatable and traceable code review process is also a foundational component of your compliance program. This ensures risks within software delivery are found and mitigated early—and are also auditable for future reviews.

GitHub makes code review easy, since pull requests are part of the existing workflow that millions of developers use every day. GitHub also makes it easy for compliance testers and auditors to review pull requests with access to immutable audit logs in a central location.

Separation of duties

In some enterprises, separation of duties has been defined as a person having too much manual control over transactions or processes. This can lead to apprehension when modern cloud native practices are introduced.

Thankfully, there is guidance from the Industry that supports a more modern approach to separation of duties. The PCI-DSS requirements guide avoids the term person and provides a more cloud native friendly approach by focusing on functions and accounts:

“The purpose of this requirement is to separate the development and test functions from the production functions. For example, a developer can use an administrator-level account with elevated privileges in the development environment and have a separate account with user-level access to the production environment.”

This approach aligns well with the 12 factor application methodology for cloud native. The Build, release, run factor explanation states, “Each release must enforce a strict separation across the build, release, and run stages. Each should be tagged with a unique ID and support the ability to roll back.” Teams can fully automate their delivery to production, without having to worry about a person manually exceeding too much control, as long as there is separation of functions and traceability back to unique IDs. With the added assurance that they are aligned to industry best practices and requirements, such as PCI-DSS.

To enable separation of duties, you have to have a clear identity and access management strategy. Thankfully, we don’t have to reinvent the wheel. GitHub Enterprise has several options to help you manage access to your overall development environment:

  • You can configure SAML single sign-on for your enterprise. This is an additional check, allowing you to confirm the authenticity of your users against your own identity provider (while still using your own GitHub account).
  • You can then synchronize team memberships with groups in your identity provider. As a result, group membership changes in your identity provider update the team membership (and therefore associated access) in GitHub.
  • Alternatively, you could adopt GitHub Enterprise Managed Users (EMUs). This is a flavor of GitHub Enterprise where you can only log in with an account that is centrally managed through your identity provider. The user does not have to log in to GitHub with a personal account and use single sign on to access company resources. (For more information on this, check out this blog post on exploring EMUs and the benefits they can bring.)

AI-powered compliance

In our last blog we briefly covered AI-enabled compliance and some of the existing opportunities for security, manufacturing, and banks. There are also several other opportunities on the horizon that could further optimize the basics of compliance.

It is entirely possible that a generative AI tool could soon be leveraged to help ensure that separation of duties is enforced in a declarative DevOps workflow by creating unit tests on its own. Because of the non-deterministic nature of generative AI, each time it runs it may have a different result and the unit tests may include risk scenarios that nobody has thought of yet. This can add an amazing level of true risk-based compliance.

One of the major benefits of addressing compliance often in your delivery is an increased level of trust. But quantifying trust can be extremely difficult—especially within a regulated industry that wants to leverage deep learning solutions. There is work being driven by AI results to help provide trust quantification for these types of solutions, which will not only enable continuous compliance but will also help enterprises implement new technologies that can increase business value.

Dependency management

Companies are increasing their reliance on open source software in their supply chain. As a result, optimized, repeatable, and audible controls for dependency management are becoming a cornerstone of compliance programs across industries.

From a GitHub perspective, Dependabot can provide confidence that your supply chain is secure. When Dependabot is configured, developers are alerted as soon as a security threat is found and gives them the ability to take action in their normal workflows.

By leveraging Dependabot, you will receive an immutable and auditable alert when a repository uses a software dependency with a known vulnerability. Pull requests can be triggered by either your developers or security teams, which give you another set of auditable artifacts for future review.

Approvals

While most organizations have approval processes, they can be slow and occur too late in the process. Google explains that peer reviews can help to streamline the change approval process, based on results from the DORA 2019 state of DevOps report.

There could be many control points in your delivery pipeline that may require approval, such as sign-off of requirements, testing results, security reviews, or production operational readiness confirmations before a release.

Depending on your internal structure and alignment, you may require teams to provide sign-off at different stages throughout the process. In your build and test stage, you can use manual approvals in a pull request to gather the needed reviews.

Once your builds and tests are complete, it’s time to release your code into your infrastructure. Talking about deployment patterns and strategies is beyond the scope of this post. However, you may require approvals as part of the deployment process.

To obtain these approvals, you should use environments for your deployments. Environments are used to describe a deployment target (such as staging, testing, and production). By using environments, you can require a manual approval to take place before GitHub Actions begins the deployment job.

In both instances, remember that there is a tradeoff when deciding the number of approvals required. Setting the number of required reviews too high means that you may impact your pace of delivery, as manual intervention is required. Where possible, consider automating checks to reduce the manual overhead, thereby optimizing your overall agility.

2. Have a common understanding of concepts and terms

Again, this may be overlooked since it sounds so obvious. But there are probably many concepts and terms that developers, DevOps and cloud native practitioners use on a daily basis that may be totally incomprehensible to compliance testers and auditors.

Back in 2015, the author of The Phoenix Project, Gene Kim, and several other authors, created the DevOps Audit Defense Toolkit. As we mentioned in our first blog, the goal of this document was to “educate IT management and practitioners on the audit process so they can demonstrate to auditors they understand the business risks and are properly mitigating those risks.” But where do you start?

Below is a basic cheat-sheet of terms for GitHub related control objectives and a mapping to the world of compliance, regulations, risk, and audit. This could be a good place to start building a common understanding between developers and your compliance and audit friends.

Objective Control Financial Reporting Industry Frameworks
The Code Review Control ensures that security requirements have been addressed and that the code is understandable, maintainable, and properly formatted. Pull requests let you tell others about changes you’ve pushed to a branch in a repository on GitHub.Once a pull request is opened, you can discuss and review the potential changes with collaborators and add follow-up commits before your changes are merged into the base branch. SOX: Change Management

COSO: Control Activities—Conduct application change management.

NIST Cyber: DE.CM-4 —Malicious code is detected.

PCI-DSS: 6.3.2: Review all custom code for vulnerabilities, manually or via automation.

SLSA: Two-person review is an industry best practice for catching mistakes and deterring bad behavior.

Controls and processes should be in place to scan code repositories for passwords and security tokens. Prevention measures should be enforced to ensure secrets do not reach production. Secret scanning will scan your entire Git history on all branches present in your GitHub repository for secrets. GitHub push protection will check for high-confidence secrets as developers push code and block the push if a secret is identified. SOX: IT Security

COSO: Control Activities—Improve security

NIST Cyber: PR.DS-5: Protections against data leaks are implemented.

PCI-DSS: 6.5.3: Protect against all insufficiently secure cryptographic key storage.

To help bring this together, there is a great example of the benefits of a common understanding between developers and compliance testers and auditors in the latest Forrester report on the economic impact of GitHub Enterprise Cloud and Advanced Security. The report highlights one of the benefits of an automated documentation process that both helps developers and auditors:

“These new, standardized documentation structures made it easier for auditors to find and compile the documentation necessary to be compliant. This helped the interviewees’ organizations save time preparing for industry compliance and security audits.”

3. Helping developers understand where they fit into the three lines of defense

The three lines of defense is a model used for risk management and governance. It helps clarify the roles and responsibilities of teams involved in addressing risk.

Think of the engineering team and engineering leads as the first line of defense, as they continue shipping software to their end-users. Making sure this team has the appropriate level of skills to identify risk within their solution is crucial.

The second line of defense is typically achieved at scale through frameworks, policies, and tools at an organizational level. This acts as oversight for the first line of defense on how well they are implementing risk mitigation techniques and consistently measuring and defining risk across the organization.

Internal audit is the third line of defense. Just like a red team and blue team compliment each other, you can think of internal audit as the final puzzle piece in the three lines of defense. They evaluate the effectiveness of risk management and governance, working with senior management and external regulators to raise awareness of the controls being executed.

Let’s use an analogy. A hockey team is not just structured to score goals but also prevent goals being scored against them.

  • Forwards: they are there to score and assist on goals. But they can be called on to work with the other positions in defense. Think of them as the first line of defense. Their job is to create solutions which provide business value, but are also secure.
  • Defenders: their main role is clearly preventing goals. But they partner with the forwards on the current priority (offense or defense). They are like the second line of defense, providing risk oversight and collaborating with the engineering teams.
  • Goaltender: the last line of defense. They can be thought of as the equivalent of an internal audit. They are independent of the forwards and defenders with different responsibilities, tools, and perspective.

Hockey teams that have very strong forwards but weak defenders and goalkeepers are rarely successful. Teams with a strong defense but weak offense are rarely successful, either. It takes all three aspects working in harmony to be successful.

This applies in business, too. If your solutions meet your customers’ requirements but are insecure, your business will fail. If your solutions are secure but aren’t user friendly or providing value, it will result in failure. Success is achieved by finding the right balance of value and risk management.

Developers can see that they are there to score goals for their team; creating the software that runs our world. But they need to support the defensive capabilities of the team, ensuring their software is secure. Their success is dependent on the success of the wider team, without having to take on additional responsibilities.

Next steps

We’ve taken a whistle-stop tour on how you can bring compliance into your development flow. From branch protection rules and pull requests to CODEOWNERS and environment approvals, there are several GitHub capabilities that can help you naturally focus on compliance.

This is only one step in solving the problem. A common language between compliance and DevOps practitioners is crucial in demonstrating the implemented measures. With that common language, it is clear that everyone must think about compliance; engineering teams are a part of the three lines of defense.

Next up in the series, we’ll be talking about how to ensure compliance in developer workflows.

Ready to increase developer velocity and collaboration while remaining secure and compliant? See how GitHub Enterprise can help.

Sharing security expertise through CodeQL packs (Part I)

Post Syndicated from Andrew Eisenberg original https://github.blog/2022-04-19-sharing-security-expertise-through-codeql-packs-part-i/

Congratulations! You’ve discovered a security bug in your own code before anyone has exploited it. It’s a big relief. You’ve created a CodeQL query to find other places where this happens and ensure this will never happen again, and you’ve deployed your new query to be run on every pull request in your repo to prevent similar mistakes from ever being made again.

What’s the best way to share this knowledge with the community to help protect the open source ecosystem by making sure that the same vulnerability is never introduced into anyone’s codebase, ever?

The short answer: produce a CodeQL pack containing your queries, and publish them to GitHub. CodeQL packaging is a beta feature in the CodeQL ecosystem. With CodeQL packaging, your expertise is documented, concise, executable, and easily shareable.

This is the first post of a two-part series on CodeQL packaging. In this post, we show how to use CodeQL packs to share security expertise. In the next post, we will discuss some of our implementation and design decisions.

Modeling a vulnerability in CodeQL

CodeQL’s customizability makes it great for detecting vulnerabilities in your code. Let’s use the Exec call vulnerable to binary planting query as an example. This query was developed by our team in response to discovering a real vulnerability in one of our open source repositories.

The purpose of this query is to detect executables that are potentially vulnerable to Windows binary planting, an exploit where an attacker could inject a malicious executable into a pull request. This query is meant to be evaluated on JavaScript code that is run inside of a GitHub Action. It matches all arguments to calls to the ToolRunner (a GitHub Action API) where the argument has not been sanitized (that is, ensured to be safe) by having been wrapped in a call to safeWhich. The implementation details of this query are not relevant to this post, but you can explore this query and other domain-specific queries like it in the repository.

This query is currently protecting us on every pull request, but in its current form, it is not easily available for others to use. Even though this vulnerability is relatively difficult to attack, the surface area is large, and it could affect any GitHub Action running on Windows in public repositories that accept pull requests. You could write a stern blog post on the dangers of invoking unqualified Windows executables in untrusted pull requests (maybe you’re even reading such a post right now!), but your impact will be much higher if you could share the query to help anyone find the bug in their code. This is where CodeQL packaging comes in. Using CodeQL packaging, not only can developers easily learn about the binary planting pattern, but they can also automatically apply the pattern to find the bug in their own code.

Sharing queries through CodeQL packs

If you think that your query is general purpose and applicable to all repositories in all situations, then it is best to contribute it to our open source CodeQL query repository (and collect a bounty in the process!). That way, your query will be run on every pull request on every repository that has GitHub code scanning enabled.

However, many (if not most) queries are domain specific and not applicable to all repositories. For example, this particular binary planting query is only applicable to GitHub Actions implemented in JavaScript. The best way to share such queries query is by creating a CodeQL pack and publishing it to the CodeQL package registry to make it available to the world. Once published, CodeQL packs are easily shared with others and executed in their CI/CD pipeline.

There are two kinds of CodeQL packs:

  • Query packs, which contain a set of pre-compiled queries that can be easily evaluated on a CodeQL database.
  • Library packs, which contain CodeQL libraries (*.qll files), but do not contain any runnable queries. Library packs are meant to be used as building blocks to produce other query packs or library packs.

In the rest of this post, we will show you how to create, share, and consume a CodeQL query pack. Library packs will be introduced in a future blog post.

To create a CodeQL pack, you’ll need to make sure that you’ve installed and set up the CodeQL CLI. You can follow the instructions here.

The next step is to create a qlpack.yml file. This file declares the CodeQL pack and information about it. Any *.ql files in the same directory (or sub-directory) as a qlpack.yml file are considered part of the package. In this case, you can place binary-planting.ql next to the qlpack.yml file.

Here is the qlpack.yml from our example:

name: aeisenberg/codeql-actions-queries
version: 1.0.1
dependencies:
 codeql/javascript-all: ~0.0.10

All CodeQL packs must have a name property. If they are going to be published to the CodeQL registry, then they must have a scope as part of the name. The scope is the part of the package name before the slash (in this example: aeisenberg). It should be the username or organization on github.com that will own this package. Anyone publishing a package must have the proper privileges to do so for that scope. The name part of the package name must be unique within the scope. Additionally, a version, following standard semver rules, is required for publishing.

The dependencies block lists all of the dependencies of this package and their compatible version ranges. Each dependency is referenced as the scope/name of a CodeQL library pack, and each library pack may in turn depend on other library packs declared in their qlpack.yml files. Each query pack must (transitively) depend on exactly one of the core language packs (for example, JavaScript, C#, Ruby, etc.), which determines the language your query can analyze.

In this query pack, the standard JavaScript libraries, codeql/javascript-all, is the only dependency and the semver range ~0.0.10 means any version >= 0.0.10 and < 0.1.0 suffices.

With the qlpack.yml defined, you can now install all of your declared dependencies. Run the codeql pack install command in the root directory of the CodeQL pack:

$ codeql pack install
Dependencies resolved. Installing packages...
Install location: /Users/andrew.eisenberg/.codeql/packages
Installed fresh codeql/[email protected]

After making any changes to the query, you can then publish the query to the GitHub registry. You do this by running the codeql pack publish command in the root of the CodeQL pack.

Here is the output of the command:

$ codeql pack publish
Running on packs: aeisenberg/codeql-actions-queries.
Bundling and then publishing qlpack located at '/Users/andrew.eisenberg/git-repos/codeql-actions-queries'.
Bundled qlpack created at '/var/folders/41/kxmfbgxj40dd2l_x63x9fw7c0000gn/T/codeql-docker17755193287422157173/.Docker Package Manager/codeql-actions-queries.1.0.1.tgz'.
Packaging> Package 'aeisenberg/codeql-actions-queries' will be published to registry 'https://ghcr.io/v2/' as 'aeisenberg/codeql-actions-queries'.
Packaging> Package 'aeisenberg/[email protected]' will be published locally to /Users/andrew.eisenberg/.codeql/packages/aeisenberg/codeql-actions-queries/1.0.1
Publish successful.

You have successfully published your first CodeQL pack! It is now available in the registry on GitHub.com for anyone else to run using the CodeQL CLI. You can view your newly-published package on github.com:

CodeQL pack on github.com

At the time of this writing, packages are initially uploaded as private packages. If you want to make it public, you must explicitly change the permissions. To do this, go to the package page, click on package settings, then scroll down to the Danger Zone:

Danger Zone!

And click Change visibility.

Running queries from CodeQL packs using the CodeQL CLI

Running the queries in a CodeQL pack is simple using the CodeQL CLI. If you already have a database created, just call the codeql database analyze command with the --download option, passing a reference to the package you want to use in your analysis:

$ codeql database analyze --format=sarif-latest --output=out.sarif --download my-db aeisenberg/codeql-actions-queries@^1.0.1

The --download option asks CodeQL to download any CodeQL packs that aren’t already available. The ^1.0,0 is optional and specifies that you want to run the latest version of the package that is compatible with ^1.0.1. If no version range is specified, then the latest version is always used. You can also pass a list of packages to evaluate. The CodeQL CLI will download and cache each specified package and then run all queries in their default query suite.

To run a subset of queries in a pack, add a : and a path after it:

aeisenberg/codeql-actions-queries@^1.0.1:binary-planting.ql

Everything after the : is interpreted as a path relative to the root of the pack, and you can specify a single query, a query directory, or a query suite (.qls file).

Evaluating CodeQL packs from code scanning

Run the queries from your CodeQL pack in GitHub code scanning is easy! In your code scanning workflow, in the github/codeql-action/init step, add packs entry to list the packs you want to run:

- uses: github/codeql-action/init@v1
  with:
    packs:
      - aeisenberg/[email protected]
    languages: javascript

Note that specifying a path after a colon is not yet supported in the codeql-action, so using this approach, you can only run the default query suite of a pack in this manner.

Conclusion

We’ve shown how easy it is to share your CodeQL queries with the world using two CLI commands: the first resolves and retrieves your dependencies and the second compiles, bundles, and publishes your package.

To recap:

Publishing a CodeQL query pack consists of:

  1. Create the qlpack.yml file.
  2. Run codeql pack install to download dependencies.
  3. Write and test your queries.
  4. Run codeql pack publish to share your package in GHCR.

Using a CodeQL query pack from GHCR on the command line consists of:

  1. codeql database analyze --download path/to/my-db aeisenberg/[email protected]

Using a CodeQL query pack from GHCR in code-scanning consists of:

  1. Adding a config-file input to the github/codeql-action/init action
  2. Adding a packs block in the config file

The CodeQL Team has already published all of our standard queries as query packs, and all of our core libraries as library packs. Any pack named {*}-queries is a query pack and contains queries that can be used to scan your code. Any pack named {*}-all is a library pack and contains CodeQL libraries (*.qll files) that can be used as the building blocks for your queries. When you are creating your own query packs, you should be adding as a dependency the library pack for the language that your query will scan.

If you are interested in understanding more about how we’ve implemented packaging and some of our design decisions, please check out our second post in this series. Also, if you are interested in learning more or contributing to CodeQL, get involved with the Security Lab.

Sharing your security expertise has never been easier!

Leveraging machine learning to find security vulnerabilities

Post Syndicated from Tiferet Gazit original https://github.blog/2022-02-17-leveraging-machine-learning-find-security-vulnerabilities/

GitHub code scanning now uses machine learning (ML) to alert developers to potential security vulnerabilities in their code.

If you want to set up your repositories to surface more alerts using our new ML technology, get started here. Read on for a behind-the-scenes peek into the ML framework powering this new technology!

Detecting vulnerable code

Code security vulnerabilities can allow malicious actors to manipulate software into behaving in unintended and harmful ways. The best way to prevent such attacks is to detect and fix vulnerable code before it can be exploited. GitHub’s code scanning capabilities leverage the CodeQL analysis engine to find security vulnerabilities in source code and surface alerts in pull requests – before the vulnerable code gets merged and released.

To detect vulnerabilities in a repository, the CodeQL engine first builds a database that encodes a special relational representation of the code. On that database we can then execute a series of CodeQL queries, each of which is designed to find a particular type of security problem.

Many vulnerabilities are caused by a single repeating pattern: untrusted user data is not sanitized and is subsequently accidentally used in an unsafe way. For example, SQL injection is caused by using untrusted user data in a SQL query, and cross-site scripting occurs as a result of untrusted user data being written to a web page. To detect situations in which unsafe user data ends up in a dangerous place, CodeQL queries encapsulate knowledge of a large number of potential sources of user data (for example, web frameworks), as well as potentially risky sinks (such as libraries for executing SQL queries). Members of the security community, alongside security experts at GitHub, continually expand and improve these queries to model additional common libraries and known patterns. Manual modeling, however, can be time-consuming, and there will always be a long tail of less-common libraries and private code that we won’t be able to model manually. This is where machine learning comes in.

We use examples surfaced by the manual models to train deep learning neural networks that can determine whether a code snippet comprises a potentially risky sink.

As a result, we can uncover security vulnerabilities even when they arise from the use of a library we have never seen before. For example, we can detect SQL injection vulnerabilities in the context of lesser-known or closed-source database abstraction libraries.

Screenshot of alerts with "experimental" label
ML-powered queries generate alerts that are marked with the “Experimental” label

Building a training set

We need to train ML models to recognize vulnerable code. While we have experimented some with unsupervised learning, unsurprisingly we found that supervised learning works better. But it comes at a cost! Asking code security experts to manually label millions of code snippets as safe or vulnerable is clearly untenable. So where do we get the data?

The manually written CodeQL queries already embody the expertise of the many security experts who wrote and refined them. We leverage these manual queries as ground-truth oracles, to label examples we then use to train our models. Each sink detected by such a query serves as a positive example in the training set. Since the vast majority of code snippets do not contain vulnerabilities, snippets not detected by the manual models can be regarded as negative examples. We make up for the inherent noise in this inferred labeling with volume. We extract tens of millions of snippets from over a hundred thousand public repositories, run the CodeQL queries on them, and label each as a positive or negative example for each query. This becomes the training set for a machine learning model that can classify code snippets as vulnerable or not.

Of course, we don’t want to train a model that will simply reproduce the manual modeling; we want to train a model that will predict new vulnerabilities that weren’t captured by manual modeling. In effect, we want the ML algorithm to improve on the current version of the manual query in much the same way that the current version improves on older, less-comprehensive versions. To see if we can do this, we actually construct all our training data from an older version of the query that detects fewer vulnerabilities. We then apply the trained model to new repositories it wasn’t trained on. We measure how well we recover the alerts detected by the latest manual query but missed by the older version of the query. This allows us to simulate the ability of a model trained with the current version of the query to recover alerts missed by this current manual model.

Features and modeling

Given a large training set of code snippets labeled as positive or negative examples for each query, we extract features for each snippet and train a deep learning model to classify new examples.

Rather than treating each code snippet simply as a string of words or characters and applying standard natural language processing (NLP) techniques naively to classify these strings, we leverage the power of CodeQL to access a wealth of information about the underlying source code. We use this information to produce a rich set of highly informative features for each code snippet.

One of the main advantages of deep learning models is their ability to combine information from a large set of features to create higher-level features and discover patterns that aren’t obvious to humans. In partnership with security and programming-language experts at GitHub, we use CodeQL to extract the information an expert might examine to inform a decision, such as the entire enclosing function body for a snippet that sits within a function, or the access path and API name. We don’t have to limit ourselves to features a human would find informative, however. We can include features whose usefulness is unknown, or features that can be useful in some instances but not all, such as the argument index for a code snippet that’s an argument to a function. Such features may contain patterns that aren’t apparent to humans, but that the neural network can detect. We therefore let the machine learning model decide whether or how to use all these features, and how to combine them to make the best decision for each snippet.

Slide with text: CodeQL: Deep logical analysis, Deductive reasoning Long chains of reasoning, Encodes knowledge from security experts ML: Pattern detection, Inductive reasoning, Fuses large volume of weak evidence, Encodes knowledge from empirical data.

Once we’ve extracted a rich set of potentially interesting features for each example, we tokenize and sub-tokenize them as is commonly done in NLP applications, with some modifications to capture characteristics specific to code syntax. We generate a vocabulary from the training data and feed lists of indices into the vocabulary into a fairly simple deep learning classifier, with a few layers of feature-by-feature processing followed by concatenation across features and a few layers of combined processing. The output is the probability that the current sample is a vulnerability for each query type.

Due to the scale of our offline data labeling, feature extraction, and training pipelines, we leverage cloud compute, including GPUs for model training. At inference time, however, no GPU is needed.

Inference on a repository

Once we have our trained machine learning model, we use it to classify new code snippets and detect likely vulnerabilities for each query. When ML-generated alerts are enabled by repository owners, CodeQL computes the source code features for the code snippets in that codebase and feeds them into the classifier model. The framework gets back the probability that a given code snippet represents a vulnerability, and uses this probability to surface likely new alerts.

Diagram showing how code snippets feed into CodeQL and the classifier model.

The full process runs on the same standard GitHub Action runners that are used by code scanning more generally, and it’s transparent to the user other than some increased runtime on large repositories. When the code scanning is complete, users can see the ML-generated alerts along with the alerts surfaced by the manual queries, with the “Experimental” label allowing them to filter ML-generated alerts in or out.

Does it work?

When evaluating ML-generated alerts, we consider only new alerts that were not flagged by the manual queries. True positives are the correct alerts that were missed by the manual queries; false positives are the incorrect new alerts generated by the ML model.

To measure metrics at scale, we use the experimental setup described above, in which the labels in the training set are determined using an older version of each manual query. We then test the model on repositories that were not included in the training set, and we measure its ability to recover the alerts detected by the current manual query but missed by the older one. Our metrics vary by query, but on average we measure a recall of approximately 80% with a precision of approximately 60%.

We’re currently extending ML-generated alerts to more JavaScript and Typescript security queries, as well as working to improve both their performance and their runtime. Our future plans include expansion to more programming languages, as well as generalizations that will allow us to capture even more vulnerabilities.

Run the “Experimental” queries if you want to uncover more potential security vulnerabilities in your codebase. The more the community engages with our alerts and provides feedback, the better we can make our algorithms, so please consider giving them a try!

Code scanning and Ruby: turning source code into a queryable database

Post Syndicated from Nick Rolfe original https://github.blog/2022-02-01-code-scanning-and-ruby-turning-source-code-into-a-queryable-database/

We recently added beta support for Ruby to the CodeQL engine that powers GitHub code scanning, as part of our efforts to make it easier for developers to build and ship secure code. Ruby support is particularly exciting for us, since GitHub itself is a Ruby on Rails app. Any improvements we or the community make to CodeQL’s vulnerability detection will help secure our own code, in addition to helping Ruby’s open source ecosystem.

CodeQL’s static analysis works by running queries over a database representation of a program. The following diagram gives a high-level overview of the process:

codeql diagram

While there’s plenty I’d love to tell you about how we write queries, and about our rich set of analysis libraries, I’m going to focus in this post on how we build those databases: how we’ve typically done it for other languages and how we did things a little differently for Ruby.

Introducing the extractor

If you want to be able to create databases for a new language in CodeQL, you need to write an extractor. An extractor is a tool that:

  1. parses the source code to obtain a parse tree,
  2. converts that parse tree into a relational form, and
  3. writes those relations (database tables) to disk.

You also need to define a schema for the database produced by your extractor. The schema specifies the names of tables in the database and the names and types of columns in each table.

Let’s visit parse trees, parsers, and database schemas in more detail.

Parse trees

Source code is just text. If you’re writing a compiler, performing static analysis, or even just doing syntax highlighting, you want to convert that text to a structure that is easier to work with. The structure we use is a parse tree, also known as a concrete syntax tree.

Here’s a friendly little Ruby program that prints a couple of greetings:

puts("Hello", "Ahoy")

The program contains three expressions: the string literals "Hello" and "Ahoy" and a call to a method named puts. I could draw a minimal parse tree for the program like this:

P

Compilers and static analysis tools like CodeQL often convert the parse tree into a simpler format known as an abstract syntax tree (AST), so-called because it abstracts away some of the syntactic details that do not affect the meaning of the program, such as comments, whitespace, and parentheses. If I wanted – and if I assume that puts is a method built into the language – I could write a simple interpreter that executes the program by walking the AST.

For CodeQL, the Ruby extractor stores the parse tree in the database, since those syntactic details can sometimes be useful. We then provide a query library to transform this into an AST, and most of our queries and query libraries build on top of that transformed AST, either directly or after applying further transformations (such as the construction of a data-flow graph).

Choosing a parser

For each language we’ve supported so far, we’ve used a different parser, choosing the one that gives the best performance and compatibility across all the codebases we want to analyze. For example, our C# extractor parses C# source code using Microsoft’s open source Roslyn compiler, while our JavaScript extractor uses a parser that was derived from the Acorn project.

For Ruby, we decided to use tree-sitter and its Ruby parser. Tree-sitter is a parser framework developed by our friends in GitHub’s Semantic Code Team and is the technology underlying the syntax highlighting and code navigation (jump-to-definition) features on GitHub.com.

Tree-sitter is fast, has excellent error recovery, and provides bindings for several languages (we chose to use the Rust bindings, which are particularly pleasant). It has parsers not only for Ruby, but for most other popular languages, and provides machine-readable descriptions of each language’s grammar. These opened up some exciting possiblities for us, which I’ll describe later.

In practice, the parse tree produced by tree-sitter for our example program is a little more complicated than the diagram above (for one thing, string literal nodes have child nodes in order to support string interpolation). If you’re curious, you can go to the tree-sitter playground, select Ruby from the dropdown, and try it for yourself.

Handling ambiguity

Ruby has a flexible syntax that delights (most of) the people who program in it. The word ‘elegant’ gets thrown around a lot, and Ruby programs often read more like English prose than code. However, this elegance comes at a significant cost: the language is ambiguous in several places, and dealing with it in a parser creates a lot of complexity.

Ruby is simple in appearance, but is very complex inside, just like our human body.

– Yukihiro 'Matz' Matsumoto, Ruby's creator

Matz’s Ruby Interpreter (MRI) is the canonical implementation of the Ruby language, and its parser is implemented in the file parse.y (from which Bison generates the actual parser code). That file is currently 14,000 lines long, which should give you a sense of the complexity involved in parsing Ruby.

One interesting example of Ruby’s ambiguity occurs when parsing an unadorned identifier like foo. If it had parentheses – foo() – we could parse it unambiguously as a method call, but parentheses are optional in Ruby. Is foo a method call with zero arguments, or is it a variable reference? Well, that ultimately depends on whether a variable named foo is in scope. If so, it’s a variable reference; otherwise, we can assume it’s a call to a method named foo.

What type of parse-tree node should the parser return in this case? The parser does not track which variables are in scope, so it cannot decide. The way tree-sitter and the extractor handle this is to emit an identifier node rather than a call node. It’s only later, as we evaluate queries, that our AST library builds a control-flow graph of the program and uses that to decide whether the node is a method call or a variable reference.

Representing a parse tree in a relational database

While the parse trees produced by most parser libraries typically represent nodes and edges in the tree as objects and pointers, CodeQL uses a relational database. Going back to the simple diagram above, I can attempt to convert it to relational form. To do that, I should first define a schema (in a simplified version of CodeQL’s schema syntax):

expressions(id: int, kind: int)
calls(expr_id: int, name: string)
call_arguments(call_id: int, arg_id: int, arg_index: int)
string_literals(expr_id: int, val: string)

The expressions table has a row for each expression in the program. Each one is given a unique id, a primary key that I can use to reference the expression from other tables. The kind column defines what kind of expression it is. I can decide that a value of 1 means the expression is a method call, 2 means it’s a string literal, and so on.

The calls table has a row for each method call, and it allows me to specify data that is specific to call expressions. The first column is a foreign key, i.e. the id of the corresponding entry in the expressions table, while the second column specifies the name of the method. You might have expected that I’d add columns for the call’s arguments, but calls can take any number of arguments, so I wouldn’t know how many columns to add. Instead, I put them in a separate call_arguments table.

The call_arguments table, therefore, has one row per argument in the program. It has three columns: one that’s a reference to the call expression, another that’s a reference to an argument, and a third that specifies the index, or number, of that argument.

Finally, the string_literals table lets me associate the literal text value with the corresponding entry in the expressions table.

Populating our small database

Now that I’ve defined my schema, I’m going to manually populate a matching database with rows for my little greeting program:

expressions

id kind
100 1 (call)
101 2 (string literal)
102 2 (string literal)

calls

expr_id name
100 “puts”

call_arguments

call_id arg_id arg_index
100 101 0
100 102 1

string_literals

expr_id val
101 “Hello”
102 “Ahoy”

Suppose this were a SQL database, and I wanted to write a query to find all the expressions that are arguments in calls to the puts method. It might look like this:

SELECT call_arguments.arg_id
FROM call_arguments
INNER JOIN calls ON calls.expr_id = call_arguments.call_id
WHERE calls.name = "puts";

In practice, we don’t use SQL. Instead, CodeQL queries are written in the QL language and evaluated using our custom database engine. QL is an object-oriented, declarative logic-programming language that is superficially similar to SQL but based on Datalog. Here’s what the same query might look like in QL:

from MethodCall call, Expr arg
where
  call.getMethodName() = "puts" and
  arg = call.getAnArgument()
select arg

MethodCall and Expr are classes that wrap the database tables, providing a high-level, object-oriented interface, with helpful predicates like getMethodName() and getAnArgument().

Language-specific schemas

The toy database schema I defined might look as though it could be reused for just about every programming language that has string literals and method calls. However, in practice, I’d need to extend it to support some features that are unique to Ruby, such as the optional blocks that can be passed with every method call.

Every language has these unique quirks, so each one GitHub supports has its own schema, perfectly tuned to match that language’s syntax. Whereas my toy schema had only two kinds of expression, our JavaScript and C/C++ schemas, for example, both define over 100 kinds of expression. Those schemas were written manually, being refined and expanded over the years as we made improvements and added support for new language features.

In contrast, one of the major differences in how we approached Ruby is that we decided to generate the database schema automatically. I mentioned earlier that tree-sitter provides a machine-readable description of its grammar. This is a file called node-types.json, and it provides information about all the nodes tree-sitter can return after parsing a Ruby program. It defines, for example, a type of node named binary, representing binary operation expressions, with fields named left, operator, and right, each with their own type information. It turns out this is exactly the kind of information we want in our database schema, so we built a tool to read node-types.json and spit out a CodeQL database schema.

You can see the schema it produces for Ruby here.

Bridging the gap

I’ve talked about how the parser gives us a parse tree, and how we could represent that same tree in a database. That’s really the main job of an extractor – massaging the parse tree into a relational database format. How easy or difficult that is depends a lot on how similar those two structures look. For some languages, we defined our database schema to closely match the structure (and naming scheme) of the tree produced by the parser. That is, there’s a high level of correspondence between the parser’s node names and the database’s table names. For those languages, an extractor’s job is fairly simple. For other languages, where we perhaps decided that the tree produced by the parser didn’t map nicely to our ideal database schema, we have to do more work to convert from one to the other.

For Ruby, where we wrote a schema-generator to automatically translate tree-sitter’s description of its node types, our extractor’s job is quite simple: when tree-sitter parses the program and gives us those tree nodes, we can perform the same translations and automatically produce a database that conforms to the schema.

Language independence

This extraction process is not only straightforward, it’s also completely language-agnostic. That is, the process is entirely mechanical and works for any tree-sitter grammar. Our schema-generator and extractor know nothing about Ruby or its syntax – they simply know how to translate tree-sitter’s node-types.json. Since tree-sitter has parsers for dozens of languages, and they all have corresponding node-types.json files, we have effectively written a pair of tools that could produce CodeQL databases for any of them.

One early benefit of this approach came when we realized that, to provide comprehensive analysis of Ruby on Rails applications, we’d also need to parse the ERB templates used to render Rails views. ERB is a distinct language that needs to be parsed separately and extracted into our database. Thankfully, tree-sitter has an existing ERB parser, so we simply had to point our tooling at that node-types.json file as well, and suddenly we had a schema-generator and extractor that could handle both Ruby and ERB.

As an aside, the ERB language is quite simple, mostly consisting of tags that differentiate between the parts of the template that are text and the parts that are Ruby code. The ERB parser only cares about those tags and doesn’t parse the Ruby code itself. This is because tree-sitter provides an elegant feature that will return a series of byte offsets delimiting the parts that are Ruby code, which we can then pass on to the Ruby parser. So, when we extract an ERB file, we parse and extract the ERB parse tree first, and then perform a second pass that parses and extracts the Ruby parse tree, ignoring the text parts of the template file.

Of course, this automated approach to extraction does come with some tradeoffs, since it involves deferring some work from the extraction stage to the analysis stage. Our QL AST library, for example, has to do more work to transform the parse tree into a user-friendly AST representation, compared with some languages where the AST classes are thin wrappers over database tables. And if we look at our existing extractor for C#, for example, we see that it gets type information from the Roslyn compiler frontend, and stores it in the database. Our language-independent tooling, meanwhile, does not attempt any kind of type analysis, so if we wanted to use it on a static language, we’d have to implement that type analysis ourselves in QL.

Nonetheless, we are excited about the possibilities this language-independent tooling opens up as we look to expand CodeQL analysis to cover more languages in the future, especially for dynamic languages. There’s a lot more to analyzing a language than producing a database, but getting that part working with little to no effort should be a major time-saver.

github/github: so good, they named it twice

github/github is the Ruby on Rails application that powers GitHub.com, and it’s rather large. I’ve heard it said that it’s one of the largest Rails apps in the world. That means it’s an excellent stress test for our Ruby extractor.

It was actually the second Ruby program we ever extracted (the first was “Hello, World!”).

Of course, extraction wasn’t quite perfect. We observed a number of parser errors that we fixed upstream in the tree-sitter-ruby project, so our work not only resulted in improved Ruby code-viewing on GitHub.com, but also improvements in the other projects that use tree-sitter, such as Neovim’s syntax highlighting.

It was also a useful benchmark in our goal of making extraction as fast as possible. CodeQL can’t start doing the valuable work of analyzing for vulnerabilities until the code has been extracted and a database produced, so we wanted to make this as fast as possible. It certainly helps that tree-sitter itself is fast, and that our automatic translation of tree-sitter’s parse tree is simple.

The biggest speedup – and where our choice to implement the extractor in Rust really helped – was in implementing multi-threaded extraction. With the design we chose for the Ruby extractor, the work it performs on each source file is completely independent of any other source file. That makes extraction an embarrassingly parallel problem, and using the Rayon library meant we barely had to change any code at all to take advantage of that. We simply changed a for loop to use a Rayon parallel-iterator, and it handled the rest. Suddenly extraction got eight times faster on my eight-core laptop.

CodeQL now runs on every pull request against github/github, using a 32-core Actions runner, where Ruby extraction takes just 15 seconds. The core engine still has to perform ‘database finalization’ after the extractor finishes, and this takes a little longer (it parallelizes, but not “embarrassingly”), but we are extremely pleased with the extractor’s performance given the size of the github/github codebase, and given our experiences with extracting other languages.

We should be in a good place to accommodate all our users’ Ruby codebases, large and small.

Try it out

I hope you’ve enjoyed this dive into the technical details of extracting CodeQL databases. If you’d like to try CodeQL on your Ruby projects, please refer to the blog post announcing the Ruby public beta, which contains several handy links to help you get started.

Increasing developer happiness with GitHub code scanning

Post Syndicated from Sam Partington original https://github.blog/2021-09-07-increasing-developer-happiness-github-code-scanning/

You probably already know about using GitHub code scanning to secure your code. But how about using it to make your day-to-day coding easier? We’ve been making internal use of CodeQL, our code analysis engine for code scanning, to keep code quality high by protecting ourselves from those annoying coding mistakes that are easy to make but hard to spot! Read on for some examples of what we’ve done so far and how you can make the most of CodeQL for yourself.

Plugging a memory leak

Go’s defer statement defers the execution of a function until the surrounding function returns. This is useful for cleaning up: For example, closing resources like file handles or completing database transactions.

When changing existing code, you can end up moving a defer statement inside a loop. If you do so, you’ll still have to wait until the end of the function for cleanup; it won’t happen at the end of the iteration. We’ve seen this mistake lead to memory leaks in production.

Wouldn’t it be great if this mistake could be pointed out to you? We wanted to live in that happy world, and all it took was four lines of CodeQL.

A nice postscript to this story is that seeing this query led another team at GitHub to add CodeQL to their repository. They’d been bitten by a defer-in-loop memory leak before and didn’t want it to happen again. Once code scanning was set up for them, CodeQL discovered another problem in their codebase, which was similar to the one we’ll discuss next.

The error you can’t ignore

We use GORM, a Go Object Relational Mapper, in some of our codebases. Error handling in GORM is different than in idiomatic Go code, because it has a chainable API. Here’s an example:

if err := db.Where("name = ?", "jinzhu").First(&user).Error; err !=
nil {
 // error handling...
}

As you can imagine, it’s easy to write code like db.Where("name = ?", "jinzhu").First(&user) and not check that Error field.

At least it used to be easy to do that. We’ve now created a CodeQL query which detects GORM calls that don’t check the associated Error field and flags these calls in pull requests. You’ll also find a similar query for error checking functions which return pointers in the security-and-quality query suite for CodeQL.

Loopy performance problems

In addition to protecting against missing error checking, we also want to keep our database-querying code performant. “N+1 queries” are a common performance issue. This is where some expensive operation is performed once for every member of a set, so the code will get slower as the number of items increases. Database calls in a loop are often the culprit here; typically, you’ll get better performance from a batch query outside of the loop instead.

We created a custom CodeQL query, which looks for calls to any of the GORM methods that actually result in a query being performed. We filter that list of calls down to those that happen within a loop and fail CI if any are encountered. What’s nice about CodeQL is that we’re not limited to database calls directly within the body of a loop―calls within functions called directly or indirectly from the loop are caught too.

Using these queries

These queries are experimental, so we’ve not included them in our standard suites. However, you can use them by referencing a special query suite we’ve created.

First, create a file .github/codeql/go-developer-happiness.qls in the repository you would like to analyze:

- import: codeql-suites/go-developer-happiness.qls
  from: codeql-go

Next, set up a CodeQL workflow (or edit an existing one) and amend the “Initialize CodeQL” section of the template as follows:

- name: Initialize CodeQL
  uses: github/codeql-action/init@v1
  with:
    languages: go
    queries: ./.github/codeql/go-developer-happiness.qls

For more information and configuration examples, please refer to the documentation for running custom CodeQL queries in GitHub code scanning.

Making your own

Are there common “gotchas” in your codebase? Why not ease developer friction with some custom CodeQL queries of your own? You can learn more about writing CodeQL with our documentation and discussions―and also find out more about contributing queries back to the community―in the CodeQL repository at https://github.com/github/codeql. We look forward to seeing what you come up with!