Tag Archives: EC2 Windows

Automating Amazon EC2-Windows EBS Volumes monitoring and creating alarms

Post Syndicated from Sheila Busser original https://aws.amazon.com/blogs/compute/automating-amazon-ec2-windows-ebs-volumes-monitoring-and-creating-alarms/

This blog post is written by, Santhosh Kumar Adapa, Database Consultant,  AWS WWCO ProServe,  Jeevan Shetty, Database Consultant, AWS WWCO ProServe, and Bhanu Ganesh Gudivada, Consultant  Databases, AWS WWCO ProServe.

Customers who are running fleets of Amazon Elastic Compute Cloud (Amazon EC2) instances use advanced monitoring techniques to observe their operational performance. Capabilities like aggregated and custom dimensions help customers categorize and customize their metrics across server fleets for fast and efficient decision making. Customers require visibility into not only infrastructure metrics (such as CPU and memory), but also disk usage metrics.

Monitoring Amazon EC2-Windows Amazon Elastic Block Store (Amazon EBS) Volumes usage is critical, especially when customers have a large fleet of Amazon EC2 Windows servers running to host their databases and applications in AWS. Generally, we see issues with EC2 instances running out of disk space, and free disk space isn’t a metric that is directly available with Amazon CloudWatch. Amazon CloudWatch agent helps solve this problem. After installing and configuring the CloudWatch agent on your EC2 instance, the agent will send metric data with the disk utilization to CloudWatch. The next step is to create a CloudWatch alarm to monitor the disk utilization metric.

In this post, we showcase the steps to automate the monitoring and creating alarms for EBS volumes attached to Amazon EC2 Windows instances. Alarms are created using AWS Lambda that monitors the free disk space and alerts whenever thresholds are crossed using Amazon Simple Notification Service (Amazon SNS).

Solution overview

To demonstrate the solution we first install and configure the CloudWatch agent in your Amazon EC2 Windows instance, and then the agent will send metric data with the disk utilization to CloudWatch. To monitor the disk on each Amazon EC2 Windows instance, we’ll use two custom Metrics, “FreeStorageSpaceInMB” and “FreeStorageSpaceInPercent”, that are collected by CloudWatch agent and pushed to CloudWatch.

The following diagram illustrates the architecture used in this post:

architecture used in this post

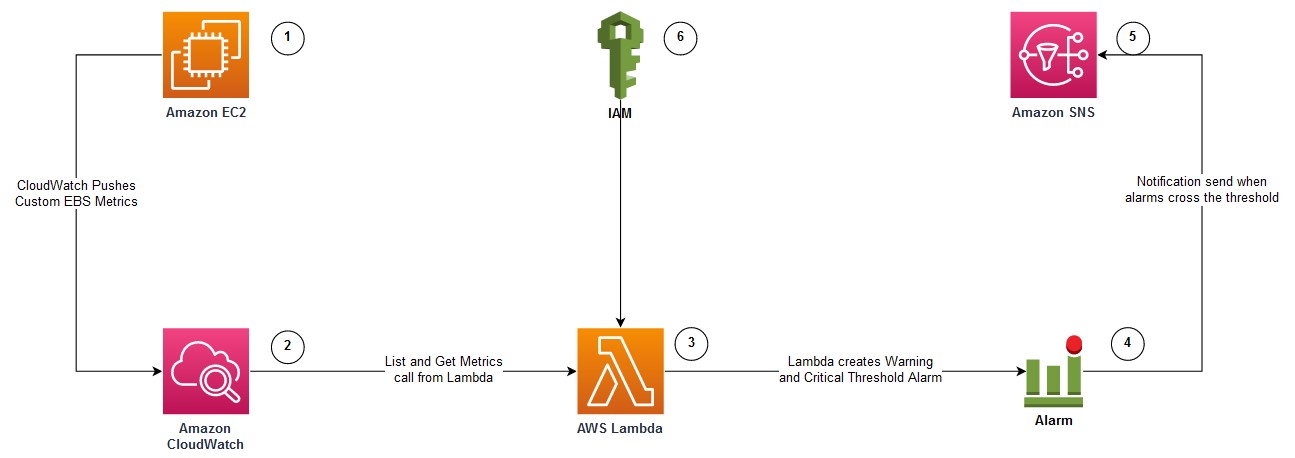
  1. Amazon EC2 Windows instance with attached Amazon EBS Volumes to be monitored for free disk usage. The EC2 instance is configured with Amazon CloudWatch Agent.
  2. CloudWatch agent is configured to monitor the “FreeStorageSpaceInMB” and “FreeStorageSpaceInPercent” metrics, and pushed to AWS CloudWatch.
  3. Lambda function that can be invoked to create CloudWatch alarms for each disk attached to the EC2 instance.
  4. CloudWatch Alarms are created with warnings and critical thresholds based on storage size.
  5. Amazon SNS is used to send alerts when the CloudWatch Alarms crosses the threshold.
  6. AWS Identity and Access Management (IAM) to provide permission to the Lambda function to get Amazon EBS metrics and to create CloudWatch Alarms.

Prerequisites

You will need the following prerequisites:

  • To implement this solution, you must have an Amazon EC2 Windows instance configured with Amazon CloudWatch Agent by following the steps documented in the article – How to monitor Windows and Linux servers and get internal performance metrics.
  • To monitor the “FreeStorageSpaceInMB” and “FreeStorageSpaceInPercent” metrics for Amazon EBS volumes attached to the EC2 instance, the CloudWatch agent configuration JSON should have the following section:
"LogicalDisk": {
	"measurement": [
	{
		"name":"% Free Space",
		"rename":"FreeStorageSpaceInPercent",
		"unit":"Percent"
	},
	{
		"name":"Free Megabytes",
		"rename":"FreeStorageSpaceInMB",
		"unit":"Megabytes"
	}
	],
	"metrics_collection_interval": 10,
	"resources": [
		"*"
	]
},
  1. Amazon EC2 host or bastion host with an IAM role attached that has permissions to create an IAM role, Lambda function, and run Amazon Relational Database Service (Amazon RDS) CLI commands. A Lambda function and an IAM role are created using AWS Serverless Application Model (SAM).

AWS SAM

In this section, we provide the steps to create an IAM role and deploy a Lambda function using AWS SAM.

  1. Log in to the Amazon EC2 host and install the AWS SAM CLI.
  2. Download the source code and deploy it by running the following command:
git clone https://github.com/aws-samples/aws-ec2-windows-ebs-volumes-monitoring

cd aws-ec2-windows-ebs-volumes-monitoring/ebs_volumes_monitoring
sam deploy --guided

3. Provide the following parameters:

    1. Stack Name – Name for the AWS CloudFormation stack.
    2. AWS Region – AWS Region where the stack is being deployed.

The following is the sample output when you run sam deploy –guided with default arguments:

=========================================
Stack Name [ebs-volumes-monitoring]: ebs-volumes-monitoring
AWS Region [us-west-2]:
#Shows you resources changes to be deployed and require a 'Y' to initiate deploy
Confirm changes before deploy [y/N]:
#SAM needs permission to be able to create roles to connect to the resources in your template
Allow SAM CLI IAM role creation [Y/n]:
#Preserves the state of previously provisioned resources when an operation fails
Disable rollback [y/N]:
Save arguments to configuration file [Y/n]:
SAM configuration file [samconfig.toml]:
SAM configuration environment [default]:

In the following sections, we describe the AWS services deployed with AWS SAM.

IAM role

AWS SAM creates an IAM role with policies to describe EC2 instances, as well as List, Get, and Put CloudWatch metrics. Furthermore, it attaches an AWS managed IAM policy called AWSLambdaBasicExecutionRole to the IAM role. This role is attached to the Lambda functions to create Amazon EBS volume alarms for EC2 instances.

Lambda function

AWS SAM also deploys the Lambda function. It uses Python 3.8 and accepts two parameters:

  1. Hostname: Amazon EC2 Windows instance name, or, if we must configure alarms for multiple servers, then you can use a wild card character, such as Instance_name* or Instance_name?
  2. sns_topic_name: ARN of the SNS topic that is used to configure CloudWatch Alarms. Notification is sent to the SNS topic when the Amazon EBS Volume metric crosses the threshold.

Invoking Lambda function

After the SAM deployment is successful, we can invoke the Lambda function with the instance name and the SNS Topic ARN. The Lambda function creates two alarms (Warning and Critical) for every Amazon EBS volume attached to the instance. The Warning and Critical values can be changed in the Lambda code so that there are two different values depending on the size of the disk drive. Furthermore, the alarms are configured to send notifications to the SNS Topic. The following is the sample command to invoke the Lambda function:

aws lambda invoke --function-name ec2-ebs-metric --cli-binary-format raw-in-base64-out \
--payload '{"hostname": "Windows*", "sns_topic_name": "arn:aws:sns:us-west-2:123456789:notify_dba" }' response.json

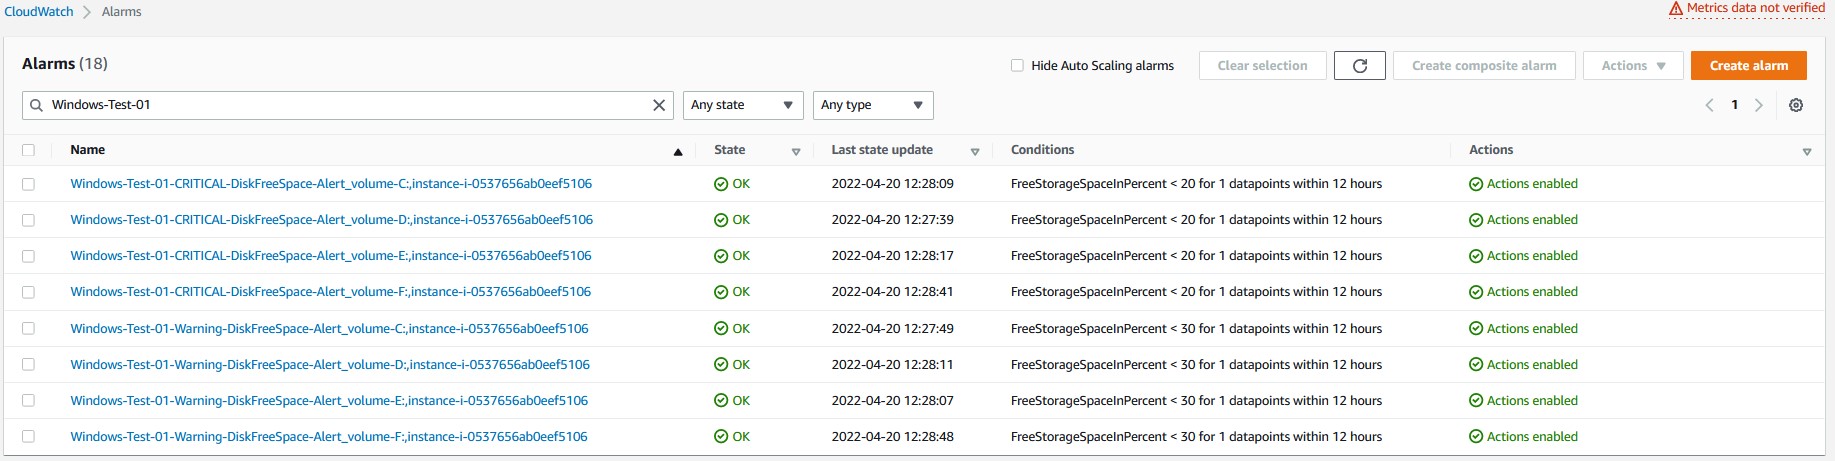
Verifying CloudWatch Alarms:

Verify the CloudWatch Alarms that are created in the CloudWatch console. The following screenshot shows the CloudWatch alarms created for an EC2 instance with four disks. There are two alarms (Warning and Critical) created for every disk (four disks in total). Therefore, we see eight CloudWatch alarms.

CloudWatch console alarms

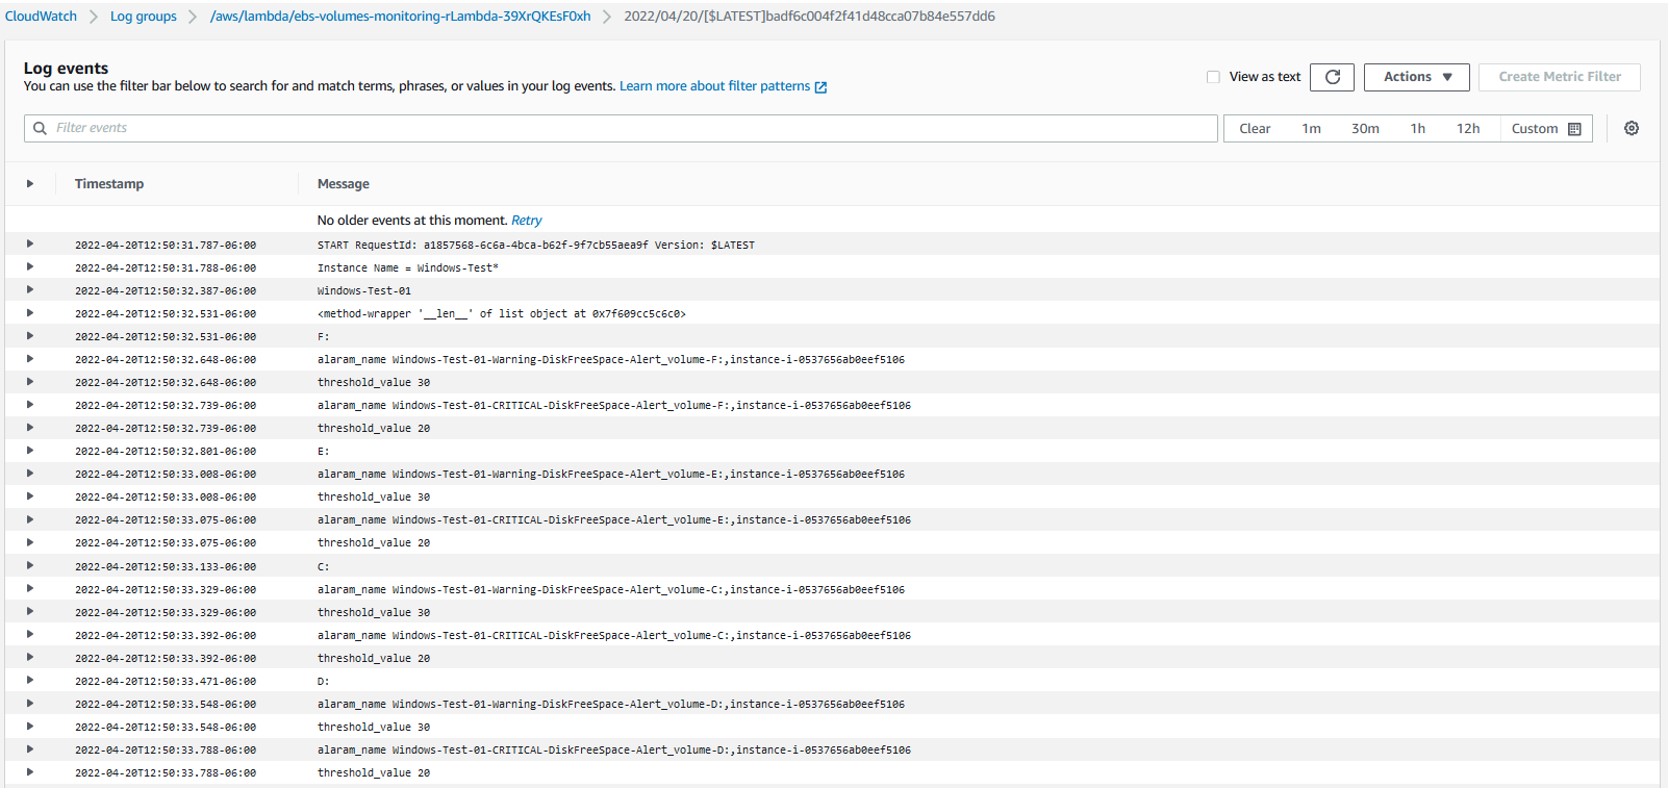
Checking CloudWatch Logs:

After running the Lambda function, to verify the log, go to Lambda Service page, select the Lambda function created, navigate to the Monitor tab, and then select “View logs in CloudWatch”. Then, go to the latest log file to check the CloudWatch log files for any errors.

Checking CloudWatch LogsSelect the latest Log Steam to check the details of the last Lambda function execution.

Log Steam detailsThe log file shows the full details of the Lambda function execution. Furthermore, it shows the CloudWatch alarms configured for each disk, as well as if there are any errors generated during execution.

Log file detailsCleanup

To clean up the resources used in this post, complete the following steps:

  1. Delete the CloudFormation stack by running below command and replacing STACK_NAME with stack name provided in step 3a above, under section “AWS SAM”
sam delete --stack-name STACK_NAME
  1. Confirm the stack has been deleted by running below command. Replace STACK_NAME as mentioned in previous step.
aws cloudformation list-stacks --query "StackSummaries[?contains(StackName,' STACK_NAME ')].StackStatus"
  1. Delete any CloudWatch alarms created by the Lambda function by following the document – Editing or deleting a CloudWatch alarm.

Conclusion

In this post, we demonstrated how the requirement of monitoring Amazon EC2 Windows EBS Volumes usage is critical. In particular, this is essential when customers have a large fleet of Amazon EC2 Windows servers running to host their databases and applications in the cloud. We showcased the process of automating the free disk monitoring using Lambda and notifying through Amazon SNS when disks cross the storage threshold. By implementing such monitoring, customers can prevent issues with EC2 instances running out of disk space thus preventing critical production outages.

Provide any thoughts or questions in the comments section. We also encourage you to explore CloudWatch monitoring and try out additional use cases mentioned in the documentation.

How to monitor Windows and Linux servers and get internal performance metrics

Post Syndicated from Emma White original https://aws.amazon.com/blogs/compute/how-to-monitor-windows-and-linux-servers-and-get-internal-performance-metrics/

This post was written by Dean Suzuki, Senior Solutions Architect.

Customers who run Windows or Linux instances on AWS frequently ask, “How do I know if my disks are almost full?” or “How do I know if my application is using all the available memory and is paging to disk?” This blog helps answer these questions by walking you through how to set up monitoring to capture these internal performance metrics.

Solution overview

If you open the Amazon EC2 console, select a running Amazon EC2 instance, and select the Monitoring tab  you can see Amazon CloudWatch metrics for that instance. Amazon CloudWatch is an AWS monitoring service. The Monitoring tab (shown in the following image) shows the metrics that can be measured external to the instance (for example, CPU utilization, network bytes in/out). However, to understand what percentage of the disk is being used or what percentage of the memory is being used, these metrics require an internal operating system view of the instance. AWS places an extra safeguard on gathering data inside a customer’s instance so this capability is not enabled by default.

EC2 console showing Monitoring tab

To capture the server’s internal performance metrics, a CloudWatch agent must be installed on the instance. For Windows, the CloudWatch agent can capture any of the Windows performance monitor counters. For Linux, the CloudWatch agent can capture system-level metrics. For more details, please see Metrics Collected by the CloudWatch Agent. The agent can also capture logs from the server. The agent then sends this information to Amazon CloudWatch, where rules can be created to alert on certain conditions (for example, low free disk space) and automated responses can be set up (for example, perform backup to clear transaction logs). Also, dashboards can be created to view the health of your Windows servers.

There are four steps to implement internal monitoring:

  1. Install the CloudWatch agent onto your servers. AWS provides a service called AWS Systems Manager Run Command, which enables you to do this agent installation across all your servers.
  2. Run the CloudWatch agent configuration wizard, which captures what you want to monitor. These items could be performance counters and logs on the server. This configuration is then stored in AWS System Manager Parameter Store
  3. Configure CloudWatch agents to use agent configuration stored in Parameter Store using the Run Command.
  4. Validate that the CloudWatch agents are sending their monitoring data to CloudWatch.

The following image shows the flow of these four steps.

Process to install and configure the CloudWatch agent

In this blog, I walk through these steps so that you can follow along. Note that you are responsible for the cost of running the environment outlined in this blog. So, once you are finished with the steps in the blog, I recommend deleting the resources if you no longer need them. For the cost of running these servers, see Amazon EC2 On-Demand Pricing. For CloudWatch pricing, see Amazon CloudWatch pricing.

If you want a video overview of this process, please see this Monitoring Amazon EC2 Windows Instances using Unified CloudWatch Agent video.

Deploy the CloudWatch agent

The first step is to deploy the Amazon CloudWatch agent. There are multiple ways to deploy the CloudWatch agent (see this documentation on Installing the CloudWatch Agent). In this blog, I walk through how to use the AWS Systems Manager Run Command to deploy the agent. AWS Systems Manager uses the Systems Manager agent, which is installed by default on each AWS instance. This AWS Systems Manager agent must be given the appropriate permissions to connect to AWS Systems Manager, and to write the configuration data to the AWS Systems Manager Parameter Store. These access rights are controlled through the use of IAM roles.

Create two IAM roles

IAM roles are identity objects that you attach IAM policies. IAM policies define what access is allowed to AWS services. You can have users, services, or applications assume the IAM roles and get the assigned rights defined in the permissions policies.

To use System Manager, you typically create two IAM roles. The first role has permissions to write the CloudWatch agent configuration information to System Manager Parameter Store. This role is called CloudWatchAgentAdminRole.

The second role only has permissions to read the CloudWatch agent configuration from the System Manager Parameter Store. This role is called CloudWatchAgentServerRole.

For more details on creating these roles, please see the documentation on Create IAM Roles and Users for Use with the CloudWatch Agent.

Attach the IAM roles to the EC2 instances

Once you create the roles, you attach them to your Amazon EC2 instances. By attaching the IAM roles to the EC2 instances, you provide the processes running on the EC2 instance the permissions defined in the IAM role. In this blog, you create two Amazon EC2 instances. Attach the CloudWatchAgentAdminRole to the first instance that is used to create the CloudWatch agent configuration. Attach CloudWatchAgentServerRole to the second instance and any other instances that you want to monitor. For details on how to attach or assign roles to EC2 instances, please see the documentation on How do I assign an existing IAM role to an EC2 instance?.

Install the CloudWatch agent

Now that you have setup the permissions, you can install the CloudWatch agent onto the servers that you want to monitor. For details on installing the CloudWatch agent using Systems Manager, please see the documentation on Download and Configure the CloudWatch Agent.

Create the CloudWatch agent configuration

Now that you installed the CloudWatch agent on your server, run the CloudAgent configuration wizard to create the agent configuration. For instructions on how to run the CloudWatch Agent configuration wizard, please see this documentation on Create the CloudWatch Agent Configuration File with the Wizard. To establish a command shell on the server, you can use AWS Systems Manager Session Manager to establish a session to the server and then run the CloudWatch agent configuration wizard. If you want to monitor both Linux and Windows servers, you must run the CloudWatch agent configuration on a Linux instance and on a Windows instance to create a configuration file per OS type. The configuration is unique to the OS type.

To run the Agent configuration wizard on Linux instances, run the following command:

sudo /opt/aws/amazon-cloudwatch-agent/bin/amazon-cloudwatch-agent-config-wizard

To run the Agent configuration wizard on Windows instances, run the following commands:

cd "C:\Program Files\Amazon\AmazonCloudWatchAgent"

amazon-cloudwatch-agent-config-wizard.exe

Note for Linux instances: do not select to collect the collectd metrics in the agent configuration wizard unless you have collectd installed on your Linux servers. Otherwise, you may encounter an error.

Review the Agent configuration

The CloudWatch agent configuration generated from the wizard is stored in Systems Manager Parameter Store. You can review and modify this configuration if you need to capture extra metrics. To review the agent configuration, perform the following steps:

  1. Go to the console for the System Manager service.
  2. Click Parameter store on the left hand navigation.
  3. You should see the parameter that was created by the CloudWatch agent configuration program. For Linux servers, the configuration is stored in: AmazonCloudWatch-linux and for Windows servers, the configuration is stored in:  AmazonCloudWatch-windows.

System Manager Parameter Store: Parameters created by CloudWatch agent configuration wizard

  1. Click on the parameter’s hyperlink (for example, AmazonCloudWatch-linux) to see all the configuration parameters that you specified in the configuration program.

In the following steps, I walk through an example of modifying the Windows configuration parameter (AmazonCloudWatch-windows) to add an additional metric (“Available Mbytes”) to monitor.

  1. Click the AmazonCloudWatch-windows
  2. In the parameter overview, scroll down to the “metrics” section and under “metrics_collected”, you can see the Windows performance monitor counters that will be gathered by the CloudWatch agent. If you want to add an additional perfmon counter, then you can edit and add the counter here.
  3. Press Edit at the top right of the AmazonCloudWatch-windows Parameter Store page.
  4. Scroll down in the Value section and look for “Memory.”
  5. After the “% Committed Bytes In Use”, put a comma “,” and then press Enter to add a blank line. Then, put on that line “Available Mbytes” The following screenshot demonstrates what this configuration should look like.

AmazonCloudWatch-windows parameter contents and how to add a new metric to monitor

  1. Press Save Changes.

To modify the Linux configuration parameter (AmazonCloudWatch-linux), you perform similar steps except you click on the AmazonCloudWatch-linux parameter. Here is additional documentation on creating the CloudWatch agent configuration and modifying the configuration file.

Start the CloudWatch agent and use the configuration

In this step, start the CloudWatch agent and instruct it to use your agent configuration stored in System Manager Parameter Store.

  1. Open another tab in your web browser and go to System Manager console.
  2. Specify Run Command in the left hand navigation of the System Manager console.
  3. Press Run Command
  4. In the search bar,
    • Select Document name prefix
    • Select Equal
    • Specify AmazonCloudWatch (Note the field is case sensitive)
    • Press enter

System Manager Run Command's command document entry field

  1. Select AmazonCloudWatch-ManageAgent. This is the command that configures the CloudWatch agent.
  2. In the command parameters section,
    • For Action, select Configure
    • For Mode, select ec2
    • For Optional Configuration Source, select ssm
    • For optional configuration location, specify the Parameter Store name. For Windows instances, you would specify AmazonCloudWatch-windows for Windows instances or AmazonCloudWatch-linux for Linux instances. Note the field is case sensitive. This tells the command to read the Parameter Store for the parameter specified here.
    • For optional restart, leave yes
  3. For Targets, choose your target servers that you wish to monitor.
  4. Scroll down and press Run. The Run Command may take a couple minutes to complete. Press the refresh button. The Run Command configures the CloudWatch agent by reading the Parameter Store for the configuration and configure the agent using those settings.

For more details on installing the CloudWatch agent using your agent configuration, please see this Installing the CloudWatch Agent on EC2 Instances Using Your Agent Configuration.

Review the data collected by the CloudWatch agents

In this step, I walk through how to review the data collected by the CloudWatch agents.

  1. In the AWS Management console, go to CloudWatch.
  2. Click Metrics on the left-hand navigation.
  3. You should see a custom namespace for CWAgent. Click on the CWAgent Please note that this might take a couple minutes to appear. Refresh the page periodically until it appears.
  4. Then click the ImageId, Instanceid hyperlinks to see the counters under that section.

CloudWatch Metrics: Showing counters under CWAgent

  1. Review the metrics captured by the CloudWatch agent. Notice the metrics that are only observable from inside the instance (for example, LogicalDisk % Free Space). These types of metrics would not be observable without installing the CloudWatch agent on the instance. From these metrics, you could create a CloudWatch Alarm to alert you if they go beyond a certain threshold. You can also add them to a CloudWatch Dashboard to review. To learn more about the metrics collected by the CloudWatch agent, see the documentation Metrics Collected by the CloudWatch Agent.

Conclusion

In this blog, you learned how to deploy and configure the CloudWatch agent to capture the metrics on either Linux or Windows instances. If you are done with this blog, we recommend deleting the System Manager Parameter Store entry, the CloudWatch data and  then the EC2 instances to avoid further charges. If you would like a video tutorial of this process, please see this Monitoring Amazon EC2 Windows Instances using Unified CloudWatch Agent video.