We brought you a Let’s Architect!blog post about open-source on AWS that covered some technologies with development led by AWS/Amazon, as well as well-known solutions available on managed AWS services. Today, we’re following the same approach to share more insights about the process itself for developing open-source. That’s why the first topic we discuss in this post is a re:Invent talk from Heitor Lessa, Principal Solutions Architect at AWS, explaining some interesting approaches for developing and scaling successful open-source projects.
This edition of Let’s Architect! also touches on observability with Open Telemetry, Apache Kafka on AWS, and Infrastructure as Code with an hands-on workshop on AWS Cloud Development Kit (AWS CDK).
Powertools for AWS Lambda is an open-source library to help engineering teams implement serverless best practices. In two years, Powertools went from an initial prototype to a fast-growing project in the open-source world. Rapid growth along with support from a wide community led to challenges from balancing new features with operational excellence to triaging bug reports and RFCs and scaling and redesigning documentation.
In this session, you can learn about Powertools for AWS Lambda to understand what it is and the problems it solves. Moreover, there are many valuable lessons to learn how to create and scale a successful open-source project. From managing the trade-off between releasing new features and achieving operational stability to measuring the impact of the project, there are many challenges in open-source projects that require careful thought.
Heitor Lessa describing one of the key lessons: development and releasing new features should be as important as the other activities (governance, operational excellence, and more).
The recent blog post Let’s Architect! Monitoring production systems at scale talks about the importance of monitoring. Setting up observability is critical to maintain application and infrastructure health, but instrumenting applications to collect monitoring signals such as metrics and logs can be challenging when using vendor-specific SDKs.
This video introduces you to OpenTelemetry, an open-source observability framework. OpenTelemetry provides a flexible, single vendor-agnostic SDK based on open-source specifications that developers can use to instrument and collect signals from applications. This resource explains how it works in practice and how to monitor microservice-based applications with the OpenTelemetry SDK.
Apache Kafka is an open-source streaming data store that decouples applications producing streaming data (producers) into its data store from applications consuming streaming data (consumers) from its data store. Amazon Managed Streaming for Apache Kafka (Amazon MSK) allows you to use the open-source version of Apache Kafka with the service managing infrastructure and operations for you.
This blog post explains how the underlying infrastructure configuration can affect Apache Kafka performance. You can learn strategies on how to size the clusters to meet the desired throughput, availability, and latency requirements. This resource helps you discover strategies to find the optimal sizing for your resources, and learn the mental models adopted to conduct the investigation and derive the conclusions.
AWS Cloud Development Kit (AWS CDK) is an open-source software development framework that allows you to provision cloud resources programmatically (Infrastructure as Code or IaC) by using familiar programming languages such as Python, Typescript, Javascript, Java, Go, and C#/.Net.
CDK allows you to create reusable template and assets, test your infrastructure, make deployments repeatable, and make your cloud environment stable by removing manual (and error-prone) operations. This workshop introduces you to CDK, where you can learn how to provision an initial simple application as well as become familiar with more advanced concepts like CDK constructs.
This construct can be attached to any Lambda function that is used as an API Gateway backend. It counts how many requests were issued to each URL.
See you next time!
Thanks for joining our conversation! To find all the blogs from this series, you can check out the Let’s Architect! list of content on the AWS Architecture Blog.
Secrets managers are a great tool to securely store your secrets and provide access to secret material to a set of individuals, applications, or systems that you trust. Across your environments, you might have multiple secrets managers hosted on different providers, which can increase the complexity of maintaining a consistent operating model for your secrets. In these situations, centralizing your secrets in a single source of truth, and replicating subsets of secrets across your other secrets managers, can simplify your operating model.
This blog post explains how you can use your third-party secrets manager as the source of truth for your secrets, while replicating a subset of these secrets to AWS Secrets Manager. By doing this, you will be able to use secrets that originate and are managed from your third-party secrets manager in Amazon Web Services (AWS) applications or in AWS services that use Secrets Manager secrets.
I’ll demonstrate this approach in this post by setting up a sample open-source HashiCorp Vault to create and maintain secrets and create a replication mechanism that enables you to use these secrets in AWS by using AWS Secrets Manager. Although this post uses HashiCorp Vault as an example, you can also modify the replication mechanism to use secrets managers from other providers.
Important: This blog post is intended to provide guidance that you can use when planning and implementing a secrets replication mechanism. The examples in this post are not intended to be run directly in production, and you will need to take security hardening requirements into consideration before deploying this solution. As an example, HashiCorp provides tutorials on hardening production vaults.
You can use these links to navigate through this post:
The primary use case for this post is for customers who are running applications on AWS and are currently using a third-party secrets manager to manage their secrets, hosted on-premises, in the AWS Cloud, or with a third-party provider. These customers typically have existing secrets vending processes, deployment pipelines, and procedures and processes around the management of these secrets. Customers with such a setup might want to keep their existing third-party secrets manager and have a set of secrets that are accessible to workloads running outside of AWS, as well as workloads running within AWS, by using AWS Secrets Manager.
Another use case is for customers who are in the process of migrating workloads to the AWS Cloud and want to maintain a (temporary) hybrid form of secrets management. By replicating secrets from an existing third-party secrets manager, customers can migrate their secrets to the AWS Cloud one-by-one, test that they work, integrate the secrets with the intended applications and systems, and once the migration is complete, remove the third-party secrets manager.
Additionally, some AWS services, such as Amazon Relational Database Service (Amazon RDS) Proxy, AWS Direct Connect MACsec, and AD Connector seamless join (Linux), only support secrets from AWS Secrets Manager. Customers can use secret replication if they have a third-party secrets manager and want to be able to use third-party secrets in services that require integration with AWS Secrets Manager. That way, customers don’t have to manage secrets in two places.
Two approaches to secrets replication
In this post, I’ll discuss two main models to replicate secrets from an external third-party secrets manager to AWS Secrets Manager: a pull model and a push model.
Pull model In a pull model, you can use AWS services such as Amazon EventBridge and AWS Lambda to periodically call your external secrets manager to fetch secrets and updates to those secrets. The main benefit of this model is that it doesn’t require any major configuration to your third-party secrets manager. The AWS resources and mechanism used for pulling secrets must have appropriate permissions and network access to those secrets. However, there could be a delay between the time a secret is created and updated and when it’s picked up for replication, depending on the time interval configured between pulls from AWS to the external secrets manager.
Push model In this model, rather than periodically polling for updates, the external secrets manager pushes updates to AWS Secrets Manager as soon as a secret is added or changed. The main benefit of this is that there is minimal delay between secret creation, or secret updating, and when that data is available in AWS Secrets Manager. The push model also minimizes the network traffic required for replication since it’s a unidirectional flow. However, this model adds a layer of complexity to the replication, because it requires additional configuration in the third-party secrets manager. More specifically, the push model is dependent on the third-party secrets manager’s ability to run event-based push integrations with AWS resources. This will require a custom integration to be developed and managed on the third-party secrets manager’s side.
This blog post focuses on the pull model to provide an example integration that requires no additional configuration on the third-party secrets manager.
Replicate secrets to AWS Secrets Manager with the pull model
In this section, I’ll walk through an example of how to use the pull model to replicate your secrets from an external secrets manager to AWS Secrets Manager.
Solution overview
Figure 1: Secret replication architecture diagram
The architecture shown in Figure 1 consists of the following main steps, numbered in the diagram:
A Cron expression in Amazon EventBridge invokes an AWS Lambda function every 30 minutes.
To connect to the third-party secrets manager, the Lambda function, written in NodeJS, fetches a set of user-defined API keys belonging to the secrets manager from AWS Secrets Manager. These API keys have been scoped down to give read-only access to secrets that should be replicated, to adhere to the principle of least privilege. There is more information on this in Step 3: Update the Vault connection secret.
The third step has two variants depending on where your third-party secrets manager is hosted:
The Lambda function is configured to fetch secrets from a third-party secrets manager that is hosted outside AWS. This requires sufficient networking and routing to allow communication from the Lambda function.
Note: Depending on the location of your third-party secrets manager, you might have to consider different networking topologies. For example, you might need to set up hybrid connectivity between your external environment and the AWS Cloud by using AWS Site-to-Site VPN or AWS Direct Connect, or both.
Important: To simplify the deployment of this example integration, I’ll use a secrets manager hosted on a publicly available Amazon EC2 instance within the same VPC as the Lambda function (3b). This minimizes the additional networking components required to interact with the secrets manager. More specifically, the EC2 instance runs an open-source HashiCorp Vault. In the rest of this post, I’ll refer to the HashiCorp Vault’s API keys as Vault tokens.
The Lambda function compares the version of the secret that it just fetched from the third-party secrets manager against the version of the secret that it has in AWS Secrets Manager (by tag). The function will create a new secret in AWS Secrets Manager if the secret does not exist yet, and will update it if there is a new version. The Lambda function will only consider secrets from the third-party secrets manager for replication if they match a specified prefix. For example, hybrid-aws-secrets/.
In case there is an error synchronizing the secret, an email notification is sent to the email addresses which are subscribed to the Amazon Simple Notification Service (Amazon SNS) Topic deployed. This sample application uses email notifications with Amazon SNS as an example, but you could also integrate with services like ServiceNow, Jira, Slack, or PagerDuty. Learn more about how to use webhooks to publish Amazon SNS messages to external services.
Step 1: Deploy the solution by using the AWS CDK toolkit
For this blog post, I’ve created an AWS Cloud Development Kit (AWS CDK) script, which can be found in this AWS GitHub repository. Using the AWS CDK, I’ve defined the infrastructure depicted in Figure 1 as Infrastructure as Code (IaC), written in TypeScript, ready for you to deploy and try out. The AWS CDK is an open-source software development framework that allows you to write your cloud application infrastructure as code using common programming languages such as TypeScript, Python, Java, Go, and so on.
Prerequisites:
To deploy the solution, the following should be in place on your system:
AWS CDK Toolkit. Install using npm (included in Node setup) by running npm install -g aws-cdk in a local terminal.
An AWS access key ID and secret access key configured as this setup will interact with your AWS account. See Configuration basics in the AWS Command Line Interface User Guide for more details.
Clone the CDK script for secret replication. git clone https://github.com/aws-samples/aws-secrets-manager-hybrid-secret-replication-from-hashicorp-vault.git SecretReplication
Use the cloned project as the working directory. cd SecretReplication
Install the required dependencies to deploy the application. npm install
Adjust any configuration values for your setup in the cdk.json file. For example, you can adjust the secretsPrefix value to change which prefix is used by the Lambda function to determine the subset of secrets that should be replicated from the third-party secrets manager.
Bootstrap your AWS environments with some resources that are required to deploy the solution. With correctly configured AWS credentials, run the following command. cdk bootstrap
This command deploys the infrastructure shown in Figure 1 for you by using AWS CloudFormation. For a full list of resources, you can view the SecretsManagerReplicationStack in AWS CloudFormation after the deployment has completed.
Note: If your local environment does not have a terminal that allows you to run these commands, consider using AWS Cloud9 or AWS CloudShell.
After the deployment has finished, you should see an output in your terminal that looks like the one shown in Figure 2. If successful, the output provides the IP address of the sample HashiCorp Vault and its web interface.
Figure 2: AWS CDK deployment output
Step 2: Initialize the HashiCorp Vault
As part of the output of the deployment script, you will be given a URL to access the user interface of the open-source HashiCorp Vault. To simplify accessibility, the URL points to a publicly available Amazon EC2 instance running the HashiCorp Vault user interface as shown in step 3b in Figure 1.
Let’s look at the HashiCorp Vault that was just created. Go to the URL in your browser, and you should see the Raft Storage initialize page, as shown in Figure 3.
The vault requires an initial configuration to set up storage and get the initial set of root keys. You can go through the steps manually in the HashiCorp Vault’s user interface, but I recommend that you use the initialise_vault.sh script that is included as part of the SecretsManagerReplication project instead.
Using the HashiCorp Vault API, the initialization script will automatically do the following:
Initialize the Raft storage to allow the Vault to store secrets locally on the instance.
Create an initial set of unseal keys for the Vault. Importantly, for demo purposes, the script uses a single key share. For production environments, it’s recommended to use multiple key shares so that multiple shares are needed to reconstruct the root key, in case of an emergency.
Store the unseal keys in init/vault_init_output.json in your project.
Unseals the HashiCorp Vault by using the unseal keys generated earlier.
Enables two key-value secrets engines:
An engine named after the prefix that you’re using for replication, defined in the cdk.json file. In this example, this is hybrid-aws-secrets. We’re going to use the secrets in this engine for replication to AWS Secrets Manager.
An engine called super-secret-engine, which you’re going to use to show that your replication mechanism does not have access to secrets outside the engine used for replication.
Creates three example secrets, two in hybrid-aws-secrets, and one in super-secret-engine.
Creates a read-only policy, which you can see in the init/replication-policy-payload.json file after the script has finished running, that allows read-only access to only the secrets that should be replicated.
Creates a new vault token that has the read-only policy attached so that it can be used by the AWS Lambda function later on to fetch secrets for replication.
To run the initialization script, go back to your terminal, and run the following command. ./initialise_vault.sh
The script will then ask you for the IP address of your HashiCorp Vault. Provide the IP address (excluding the port) and choose Enter. Input y so that the script creates a couple of sample secrets.
If everything is successful, you should see an output that includes tokens to access your HashiCorp Vault, similar to that shown in Figure 4.
The setup script has outputted two tokens: one root token that you will use for administrator tasks, and a read-only token that will be used to read secret information for replication. Make sure that you can access these tokens while you’re following the rest of the steps in this post.
Note: The root token is only used for demonstration purposes in this post. In your production environments, you should not use root tokens for regular administrator actions. Instead, you should use scoped down roles depending on your organizational needs. In this case, the root token is used to highlight that there are secrets under super-secret-engine/ which are not meant for replication. These secrets cannot be seen, or accessed, by the read-only token.
Go back to your browser and refresh your HashiCorp Vault UI. You should now see the Sign in to Vault page. Sign in using the Token method, and use the root token. If you don’t have the root token in your terminal anymore, you can find it in the init/vault_init_output.json file.
After you sign in, you should see the overview page with three secrets engines enabled for you, as shown in Figure 5.
If you explore hybrid-aws-secrets and super-secret-engine, you can see the secrets that were automatically created by the initialization script. For example, first-secret-for-replication, which contains a sample key-value secret with the key secrets and value manager.
If you navigate to Policies in the top navigation bar, you can also see the aws-replication-read-only policy, as shown in Figure 6. This policy provides read-only access to only the hybrid-aws-secrets path.
Figure 6: Read-only HashiCorp Vault token policy
The read-only policy is attached to the read-only token that we’re going to use in the secret replication Lambda function. This policy is important because it scopes down the access that the Lambda function obtains by using the token to a specific prefix meant for replication. For secret replication we only need to perform read operations. This policy ensures that we can read, but cannot add, alter, or delete any secrets in HashiCorp Vault using the token.
You can verify the read-only token permissions by signing into the HashiCorp Vault user interface using the read-only token rather than the root token. Now, you should only see hybrid-aws-secrets. You no longer have access to super-secret-engine, which you saw in Figure 5. If you try to create or update a secret, you will get a permission denied error.
Great! Your HashiCorp Vault is now ready to have its secrets replicated from hybrid-aws-secrets to AWS Secrets Manager. The next section describes a final configuration that you need to do to allow access to the secrets in HashiCorp Vault by the replication mechanism in AWS.
Step 3: Update the Vault connection secret
To allow secret replication, you must give the AWS Lambda function access to the HashiCorp Vault read-only token that was created by the initialization script. To do that, you need to update the vault-connection-secret that was initialized in AWS Secrets Manager as part of your AWS CDK deployment.
For demonstration purposes, I’ll show you how to do that by using the AWS Management Console, but you can also do it programmatically by using the AWS Command Line Interface (AWS CLI) or AWS SDK with the update-secret command.
To update the Vault connection secret (console)
In the AWS Management Console, go to AWS Secrets Manager > Secrets > hybrid-aws-secrets/vault-connection-secret.
Under Secret Value, choose Retrieve Secret Value, and then choose Edit.
Update the vaultToken value to contain the read-only token that was generated by the initialization script.
Step 4: (Optional) Set up email notifications for replication failures
As highlighted in Figure 1, the Lambda function will send an email by using Amazon SNS to a designated email address whenever one or more secrets fails to be replicated. You will need to configure the solution to use the correct email address. To do this, go to the cdk.json file at the root of the SecretReplication folder and adjust the notificationEmail parameter to an email address that you own. Once done, deploy the changes using the cdk deploy command. Within a few minutes, you’ll get an email requesting you to confirm the subscription. Going forward, you will receive an email notification if one or more secrets fails to replicate.
Test your secret replication
You can either wait up to 30 minutes for the Lambda function to be invoked automatically to replicate the secrets, or you can manually invoke the function.
To test your secret replication
Open the AWS Lambda console and find the Secret Replication function (the name starts with SecretsManagerReplication-SecretReplication).
Navigate to the Test tab.
For the text event action, select Create new event, create an event using the default parameters, and then choose the Test button on the right-hand side, as shown in Figure 8.
Figure 8: AWS Lambda – Test page to manually invoke the function
This will run the function. You should see a success message, as shown in Figure 9. If this is the first time the Lambda function has been invoked, you will see in the results that two secrets have been created.
Figure 9: AWS Lambda function output
You can find the corresponding logs for the Lambda function invocation in a Log group in AWS CloudWatch matching the name /aws/lambda/SecretsManagerReplication-SecretReplicationLambdaF-XXXX.
To verify that the secrets were added, navigate to AWS Secrets Manager in the console, and in addition to the vault-connection-secret that you edited before, you should now also see the two new secrets with the same hybrid-aws-secrets prefix, as shown in Figure 10.
Figure 10: AWS Secrets Manager overview – New replicated secrets
For example, if you look at first-secret-for-replication, you can see the first version of the secret, with the secret key secrets and secret value manager, as shown in Figure 11.
Figure 11: AWS Secrets Manager – New secret overview showing values and version number
Success! You now have access to the secret values that originate from HashiCorp Vault in AWS Secrets Manager. Also, notice how there is a version tag attached to the secret. This is something that is necessary to update the secret, which you will learn more about in the next two sections.
Update a secret
It’s a recommended security practice to rotate secrets frequently. The Lambda function in this solution not only replicates secrets when they are created — it also periodically checks if existing secrets in AWS Secrets Manager should be updated when the third-party secrets manager (HashiCorp Vault in this case) has a new version of the secret. To validate that this works, you can manually update a secret in your HashiCorp Vault and observe its replication in AWS Secrets Manager in the same way as described in the previous section. You will notice that the version tag of your secret gets updated automatically when there is a new secret replication from the third-party secrets manager to AWS Secrets Manager.
Secret replication logic
This section will explain in more detail the logic behind the secret replication. Consider the following sequence diagram, which explains the overall logic implemented in the Lambda function.
Figure 12: State diagram for secret replication logic
This diagram highlights that the Lambda function will first fetch a list of secret names from the HashiCorp Vault. Then, the function will get a list of secrets from AWS Secrets Manager, matching the prefix that was configured for replication. AWS Secrets Manager will return a list of the secrets that match this prefix and will also return their metadata and tags. Note that the function has not fetched any secret material yet.
Next, the function will loop through each secret name that HashiCorp Vault gave and will check if the secret exists in AWS Secrets Manager:
If there is no secret that matches that name, the function will fetch the secret material from HashiCorp Vault, including the version number, and create a new secret in AWS Secrets Manager. It will also add a version tag to the secret to match the version.
If there is a secret matching that name in AWS Secrets Manager already, the Lambda function will first fetch the metadata from that secret in HashiCorp Vault. This is required to get the version number of the secret, because the version number was not exposed when the function got the list of secrets from HashiCorp Vault initially. If the secret version from HashiCorp Vault does not match the version value of the secret in AWS Secrets Manager (for example, the version in HashiCorp vault is 2, and the version in AWS Secrets manager is 1), an update is required to get the values synchronized again. Only now will the Lambda function fetch the actual secret material from HashiCorp Vault and update the secret in AWS Secrets Manager, including the version number in the tag.
The Lambda function fetches metadata about the secrets, rather than just fetching the secret material from HashiCorp Vault straight away. Typically, secrets don’t update very often. If this Lambda function is called every 30 minutes, then it should not have to add or update any secrets in the majority of invocations. By using metadata to determine whether you need the secret material to create or update secrets, you minimize the number of times secret material is fetched both from HashiCorp Vault and AWS Secrets Manager.
Note: The AWS Lambda function has permissions to pull certain secrets from HashiCorp Vault. It is important to thoroughly review the Lambda code and any subsequent changes to it to prevent leakage of secrets. For example, you should ensure that the Lambda function does not get updated with code that unintentionally logs secret material outside the Lambda function.
Use your secret
Now that you have created and replicated your secrets, you can use them in your AWS applications or AWS services that are integrated with Secrets Manager. For example, you can use the secrets when you set up connectivity for a proxy in Amazon RDS, as follows.
To use a secret when creating a proxy in Amazon RDS
Go to the Amazon RDS service in the console.
In the left navigation pane, choose Proxies, and then choose Create Proxy.
On the Connectivity tab, you can now select first-secret-for-replicationorsecond-secret-for-replication, which were created by the Lambda function after replicating them from the HashiCorp Vault.
Figure 13: Amazon RDS Proxy – Example of using replicated AWS Secrets Manager secrets
Due to the sensitive nature of the secrets, it is important that you scope down the permissions to the least amount required to prevent inadvertent access to your secrets. The setup adopts a least-privilege permission strategy, where only the necessary actions are explicitly allowed on the resources that are required for replication. However, the permissions should be reviewed in accordance to your security standards.
In the architecture of this solution, there are two main places where you control access to the management of your secrets in Secrets Manager.
Lambda execution IAM role: The IAM role assumed by the Lambda function during execution contains the appropriate permissions for secret replication. There is an additional safety measure, which explicitly denies any action to a resource that is not required for the replication. For example, the Lambda function only has permission to publish to the Amazon SNS topic that is created for the failed replications, and will explicitly deny a publish action to any other topic. Even if someone accidentally adds an allow to the policy for a different topic, the explicit deny will still block this action.
AWS KMS key policy: When other services need to access the replicated secret in AWS Secrets Manager, they need permission to use the hybrid-aws-secrets-encryption-key AWS KMS key. You need to allow the principal these permissions through the AWS KMS key policy. Additionally, you can manage permissions to the AWS KMS key for the principal through an identity policy. For example, this is required when accessing AWS KMS keys across AWS accounts. See Permissions for AWS services in key policies and Specifying KMS keys in IAM policy statements in the AWS KMS Developer Guide.
Options for customizing the sample solution
The solution that was covered in this post provides an example for replication of secrets from HashiCorp Vault to AWS Secrets Manager using the pull model. This section contains additional customization options that you can consider when setting up the solution, or your own variation of it.
Depending on the solution that you’re using, you might have access to different metadata attached to the secrets, which you can use to determine if a secret should be updated. For example, if you have access to data that represents a last_updated_datetime property, you could use this to infer whether or not a secret ought to be updated.
It is a recommended practice to not use long-lived tokens wherever possible. In this sample, I used a static vault token to give the Lambda function access to the HashiCorp Vault. Depending on the solution that you’re using, you might be able to implement better authentication and authorization mechanisms. For example, HashiCorp Vault allows you to use IAM auth by using AWS IAM, rather than a static token.
This post addressed the creation of secrets and updating of secrets, but for your production setup, you should also consider deletion of secrets. Depending on your requirements, you can choose to implement a strategy that works best for you to handle secrets in AWS Secrets Manager once the original secret in HashiCorp Vault has been deleted. In the pull model, you could consider removing a secret in AWS Secrets Manager if the corresponding secret in your external secrets manager is no longer present.
In the sample setup, the same AWS KMS key is used to encrypt both the environment variables of the Lambda function, and the secrets in AWS Secrets Manager. You could choose to add an additional AWS KMS key (which would incur additional cost), to have two separate keys for these tasks. This would allow you to apply more granular permissions for the two keys in the corresponding KMS key policies or IAM identity policies that use the keys.
Conclusion
In this blog post, you’ve seen how you can approach replicating your secrets from an external secrets manager to AWS Secrets Manager. This post focused on a pull model, where the solution periodically fetched secrets from an external HashiCorp Vault and automatically created or updated the corresponding secret in AWS Secrets Manager. By using this model, you can now use your external secrets in your AWS Cloud applications or services that have an integration with AWS Secrets Manager.
If you have feedback about this post, submit comments in the Comments section below. If you have questions about this post, start a new thread on the AWS Secrets Manager re:Post or contact AWS Support.
Want more AWS Security news? Follow us on Twitter.
It is crucial to examine every functional area when firms reorient their operations toward sustainable practices. Making informed decisions is necessary to reduce the environmental effect of an IT stack when creating, deploying, and maintaining it. To build a sustainable business for our customers and for the world we all share, we have deployed data centers that provide the efficient, resilient service our customers expect while minimizing our environmental footprint—and theirs. While we work to improve the energy efficiency of our datacenters, we also work to help our customers improve their operations on the AWS cloud. This two-pronged approach is based on the concept of the shared responsibility between AWS and AWS’ customers. As shown in the diagram below, AWS focuses on optimizing the sustainability of the cloud, while customers are responsible for sustainability in the cloud, meaning that AWS customers must optimize the workloads they have on the AWS cloud.
Figure 1. Shared responsibility model for sustainability
Just by migrating to the cloud, AWS customers become significantly more sustainable in their technology operations. On average, AWS customers use 77% fewer servers, 84% less power, and a 28% cleaner power mix, ultimately reducing their carbon emissions by 88% compared to when they ran workloads in their own data centers. These improvements are attributable to the technological advancements and economies of scale that AWS datacenters bring. However, there are still significant opportunities for AWS customers to make their cloud operations more sustainable. To uncover this, we must first understand how emissions are categorized.
The Greenhouse Gas Protocol organizes carbon emissions into the following scopes, along with relevant emission examples within each scope for a cloud provider such as AWS:
Scope 1: All direct emissions from the activities of an organization or under its control. For example, fuel combustion by data center backup generators.
Scope 2: Indirect emissions from electricity purchased and used to power data centers and other facilities. For example, emissions from commercial power generation.
Scope 3: All other indirect emissions from activities of an organization from sources it doesn’t control. AWS examples include emissions related to data center construction, and the manufacture and transportation of IT hardware deployed in data centers.
From an AWS customer perspective, emissions from customer workloads running on AWS are accounted for as indirect emissions, and part of the customer’s Scope 3 emissions. Each workload deployed generates a fraction of the total AWS emissions from each of the previous scopes. The actual amount varies per workload and depends on several factors including the AWS services used, the energy consumed by those services, the carbon intensity of the electric grids serving the AWS data centers where they run, and the AWS procurement of renewable energy.
At a high level, AWS customers approach optimization initiatives at three levels:
Application (Architecture and Design): Using efficient software designs and architectures to minimize the average resources required per unit of work.
Resource (Provisioning and Utilization): Monitoring workload activity and modifying the capacity of individual resources to prevent idling due to over-provisioning or under-utilization.
Code (Code Optimization): Using code profilers and other tools to identify the areas of code that use up the most time or resources as targets for optimization.
In this blogpost, we will concentrate on code-level sustainability improvements and how they can be realized using Amazon CodeGuru Profiler.
How CodeGuru Profiler improves code sustainability
Amazon CodeGuru Profiler collects runtime performance data from your live applications and provides recommendations that can help you fine-tune your application performance. Using machine learning algorithms, CodeGuru Profiler can help you find your most CPU-intensive lines of code, which contribute the most to your scope 3 emissions. CodeGuru Profiler then suggests ways to improve the code to make it less CPU demanding. CodeGuru Profiler provides different visualizations of profiling data to help you identify what code is running on the CPU, see how much time is consumed, and suggest ways to reduce CPU utilization. Optimizing your code with CodeGuru profiler leads to the following:
Improvements in application performance
Reduction in cloud cost, and
Reduction in the carbon emissions attributable to your cloud workload.
When your code performs the same task with less CPU, your applications run faster, customer experience improves, and your cost reduces alongside your cloud emission. CodeGuru Profiler generates the recommendations that help you make your code faster by using an agent that continuously samples stack traces from your application. The stack traces indicate how much time the CPU spends on each function or method in your code—information that is then transformed into CPU and latency data that is used to detect anomalies. When anomalies are detected, CodeGuru Profiler generates recommendations that clearly outline you should do to remediate the situation. Although CodeGuru Profiler has several visualizations that help you visualize your code, in many cases, customers can implement these recommendations without reviewing the visualizations. Let’s demonstrate this with a simple example.
Demonstration: Using CodeGuru Profiler to optimize a Lambda function
In this demonstration, the inefficiencies in a AWS Lambda function will be identified by CodeGuru Profiler.
Building our Lambda Function (10mins)
To keep this demonstration quick and simple, let’s create a simple lambda function that display’s ‘Hello World’. Before writing the code for this function, let’s review two important concepts. First, when writing Python code that runs on AWS and calls AWS services, two critical steps are required:
The Python code lines (that will be part of our function) that execute these steps listed above are shown below:
import boto3 #this will import AWS SDK library for Python
 VariableName = boto3.client('dynamodb’) #this will create the AWS SDK service client
Secondly, functionally, AWS Lambda functions comprise of two sections:
Initialization code
Handler code
The first time a function is invoked (i.e., a cold start), Lambda downloads the function code, creates the required runtime environment, runs the initialization code, and then runs the handler code. During subsequent invocations (warm starts), to keep execution time low, Lambda bypasses the initialization code and goes straight to the handler code. AWS Lambda is designed such that the SDK service client created during initialization persists into the handler code execution. For this reason, AWS SDK service clients should be created in the initialization code. If the code lines for creating the AWS SDK service client are placed in the handler code, the AWS SDK service client will be recreated every time the Lambda function is invoked, needlessly increasing the duration of the Lambda function during cold and warm starts. This inadvertently increases CPU demand (and cost), which in turn increases the carbon emissions attributable to the customer’s code. Below, you can see the green and brown versions of the same Lambda function.
Now that we understand the importance of structuring our Lambda function code for efficient execution, let’s create a Lambda function that recreates the SDK service client. We will then watch CodeGuru Profiler flag this issue and generate a recommendation.
Open AWS Lambda from the AWS Console and click on Create function.
Select Author from scratch, name the function ‘demo-function’, select Python 3.9 under runtime, select x86_64 under Architecture.
Expand Permissions, then choose whether to create a new execution role or use an existing one.
Expand Advanced settings, and then select Function URL.
For Auth type, choose AWS_IAM or NONE.
Select Configure cross-origin resource sharing (CORS). By selecting this option during function creation, your function URL allows requests from all origins by default. You can edit the CORS settings for your function URL after creating the function.
Choose Create function.
In the code editor tab of the code source window, copy and paste the code below:
Ensure that the handler code is properly indented.
Save the code, Deploy, and then Test.
For the first execution of this Lambda function, a test event configuration dialog will appear. On the Configure test event dialog window, leave the selection as the default (Create new event), enter ‘demo-event’ as the Event name, and leave the hello-world template as the Event template.
When you run the code by clicking on Test, the console should return ‘Hello World’.
To simulate actual traffic, let’s run a curl script that will invoke the Lambda function every 0.2 seconds. On a bash terminal, run the following command:
while true; do curl {Lambda Function URL]; sleep 0.06; done
If you do not have git bash installed, you can use AWS Cloud 9 which supports curl commands.
Enabling CodeGuru Profiler for our Lambda function
We will now set up CodeGuru Profiler to monitor our Lambda function. For Lambda functions running on Java 8 (Amazon Corretto), Java 11, and Python 3.8 or 3.9 runtimes, CodeGuru Profiler can be enabled through a single click in the configuration tab in the AWS Lambda console. Other runtimes can be enabled following a series of steps that can be found in the CodeGuru Profiler documentation for Java and the Python.
Our demo code is written in Python 3.9, so we will enable Profiler from the configuration tab in the AWS Lambda console.
On the AWS Lambda console, select the demo-function that we created.
Navigate to Configuration > Monitoring and operations tools, and click Edit on the right side of the page.
Scroll down to Amazon CodeGuru Profiler and click the button next to Code profiling to turn it on. After enabling Code profiling, click Save.
Note: CodeGuru Profiler requires 5 minutes of Lambda runtime data to generate results. After your Lambda function provides this runtime data, which may need multiple runs if your lambda has a short runtime, it will display within the Profiling group page in the CodeGuru Profiler console. The profiling group will be given a default name (i.e., aws-lambda-<lambda-function-name>), and it will take approximately 15 minutes after CodeGuru Profiler receives the runtime data for this profiling group to appear. Be patient. Although our function duration is ~33ms, our curl script invokes the application once every 0.06 seconds. This should give profiler sufficient information to profile our function in a couple of hours. After 5 minutes, our profiling group should appear in the list of active profiling groups as shown below.
Depending on how frequently your Lambda function is invoked, it can take up to 15 minutes to aggregate profiles, after which you can see your first visualization in the CodeGuru Profiler console. The granularity of the first visualization depends on how active your function was during those first 5 minutes of profiling—an application that is idle most of the time doesn’t have many data points to plot in the default visualization. However, you can remedy this by looking at a wider time period of profiled data, for example, a day or even up to a week, if your application has very low CPU utilization. For our demo function, a recommendation should appear after about an hour. By this time, the profiling groups list should show that our profiling group now has one recommendation.
Profiler has now flagged the repeated creation of the SDK service client with every invocation.
From the information provided, we can see that our CPU is spending 5x more computing time than expected on the recreation of the SDK service client. The estimated cost impact of this inefficiency is also provided. In production environments, the cost impact of seemingly minor inefficiencies can scale very quickly to several kilograms of CO2 and hundreds of dollars as invocation frequency, and the number of Lambda functions increase.
CodeGuru Profiler integrates with Amazon DevOps Guru, a fully managed service that makes it easy for developers and operators to improve the performance and availability of their applications. Amazon DevOps Guru analyzes operational data and application metrics to identify behaviors that deviate from normal operating patterns. Once these operational anomalies are detected, DevOps Guru presents intelligent recommendations that address current and predicted future operational issues. By integrating with CodeGuru Profiler, customers can now view operational anomalies and code optimization recommendations on the DevOps Guru console. The integration, which is enabled by default, is only applicable to Lambda resources that are supported by CodeGuru Profiler and monitored by both DevOps Guru and CodeGuru.
We can now stop the curl loop (Control+C) so that the Lambda function stops running. Next, we delete the profiling group that was created when we enabled profiling in Lambda, and then delete the Lambda function or repurpose as needed.
Conclusion
Cloud sustainability is a shared responsibility between AWS and our customers. While we work to make our datacenter more sustainable, customers also have to work to make their code, resources, and applications more sustainable, and CodeGuru Profiler can help you improve code sustainability, as demonstrated above. To start Profiling your code today, visit the CodeGuru Profiler documentation page. To start monitoring your applications, head over to the Amazon DevOps Guru documentation page.
AWS Security Hub is a cloud security posture management service that you can use to perform security best practice checks, aggregate alerts, and automate remediation. Security Hub has out-of-the-box integrations with many AWS services and over 60 partner products. Security Hub centralizes findings across your AWS accounts and supported AWS Regions into a single delegated administrator account in your aggregation Region of choice, creating a single pane of glass to consolidate and view individual security findings.
Because there are a large number of possible integrations across accounts and Regions, your delegated administrator account in the aggregation Region might have hundreds of thousands of Security Hub findings. To perform complex analytics or machine learning across the existing (historical) findings that are maintained in Security Hub, you can export findings to an Amazon Simple Storage Service (Amazon S3) bucket. To export new findings that have recently been created, you can implement the solution in the aws-security-hub-findings-export GitHub repository. However, Security Hub has data export API rate quotas, which can make exporting a large number of findings challenging.
In this blog post, we provide an example solution to export your historical Security Hub findings to an S3 bucket in your account, even if you have a large number of findings. We walk you through the components of the solution and show you how to use the solution after deployment.
Prerequisites
To deploy the solution, complete the following prerequisites:
If you want to export Security Hub findings across multiple Regions, enable cross-Region aggregation.
Solution overview and architecture
In this solution, you use the following AWS services and features:
Security Hub export orchestration
AWS Step Functions helps you orchestrate automation and long-running jobs, which are integral to this solution. You need the ability to run a workflow for hours due to the Security Hub API rate limits and number of findings and objects.
AWS Lambda functions handle the logic for exporting and storing findings in an efficient and cost-effective manner. You can customize Lambda functions to most use cases.
Amazon EventBridge tracks changes in the status of the Step Functions workflow. The solution can run for over 100 hours; by using EventBridge, you don’t have to manually check the status.
AWS Systems ManagerParameter Store provides a quick way to track overall status by maintaining a numeric count of successfully exported findings that you can compare with the number of findings shown in the Security Hub dashboard.
Figure 1 shows the architecture for the solution, deployed in the Security Hub delegated administrator account in the aggregation Region. The figure shows multiple Security Hub member accounts to illustrate how you can export findings for an entire AWS Organizations organization from a single delegated administrator account.
Figure 1: High-level overview of process and resources deployed in the Security Hub account
As shown in Figure 1, the workflow after deployment is as follows:
The Step Functions workflow for the Security Hub export is invoked.
The Step Functions workflow invokes a single Lambda function that does the following:
Retrieves Security Hub findings that have an Active status and puts them in a temporary file.
Pushes the file as an object to Amazon S3.
Adds the global count of exported findings from the Step Functions workflow to a Systems Manager parameter for validation and tracking purposes.
Repeats steps b–c for about 10 minutes to get the most findings while preventing the Lambda function from timing out.
If a nextToken is present, pushes the nextToken to the output of the Step Functions.
Note: If the number of items in the output is smaller than the number of items returned by the API call, then the return output includes a nextToken, which can be passed to a subsequent command to retrieve the next set of items.
The Step Functions workflow goes through a Choice state as follows:
If a Security Hub nextToken is present, Step Functions invokes the Lambda function again.
If a Security Hub nextToken isn’t present, Step Functions ends the workflow successfully.
An EventBridge rule tracks changes in the status of the Step Functions workflow and sends events to an SNS topic. Subscribers to the SNS topic receive a notification when the status of the Step Functions workflow changes.
In your delegated administrator Security Hub account, launch the AWS CloudFormation template by choosing the following Launch Stack button. It will take about 10 minutes for the CloudFormation stack to complete.
Note: The stack will launch in the US East (N. Virginia) Region (us-east-1). If you are using cross-Region aggregation, deploy the solution into the Region where Security Hub findings are consolidated. You can download the CloudFormation template for the solution, modify it, and deploy it to your selected Region.
To deploy the solution (AWS CDK)
Download the code from our aws-security-hub-findings-historical-export GitHub repository, where you can also contribute to the sample code. The CDK initializes your environment and uploads the Lambda assets to Amazon S3. Then, you deploy the solution to your account.
While you are authenticated in the security tooling account, run the following commands in your terminal. Make sure to replace <AWS_ACCOUNT> with the account number, and replace <REGION> with the AWS Region where you want to deploy the solution. cdk bootstrap aws://<AWS_ACCOUNT>/<REGION> cdk deploy SechubHistoricalPullStack
Solution walkthrough and validation
Now that you’ve successfully deployed the solution, you can see each aspect of the automation workflow in action.
Before you start the workflow, you need to subscribe to the SNS topic so that you’re notified of status changes within the Step Functions workflow. For this example, you will use email notification.
Go to Topics and choose the Security_Hub_Export_Status topic.
Choose Create subscription.
For Protocol, choose Email.
For Endpoint, enter the email address where you want to receive notifications.
Choose Create subscription.
After you create the subscription, go to your email and confirm the subscription.
You’re now subscribed to the SNS topic, so any time that the Step Functions status changes, you will receive a notification. Let’s walk through how to run the export solution.
In the left navigation pane, choose State machines.
Choose the new state machine named sec_hub_finding_export.
Choose Start execution.
On the Start execution page, for Name – optional and Input – optional, leave the default values and then choose Start execution.
Figure 2: Example input values for execution of the Step Functions workflow
This will start the Step Functions workflow and redirect you to the Graph view. If successful, you will see that the overall Execution status and each step have a status of Successful.
For long-running jobs, you can view the CloudWatch log group associated with the Lambda function to view the logs.
To track the number of Security Hub findings that have been exported, open the Systems Manager console, choose Parameter Store, and then select the /sechubexport/findingcount parameter. Under Value, you will see the total number of Security Hub findings that have been exported, as shown in Figure 3.
Figure 3: Systems Manager Parameter Store value for the number of Security Hub findings exported
Depending on the number of Security Hub findings, this process can take some time. This is primarily due to the GetFindings quota of 3 requests per second. Each GetFindings request can return a maximum of 100 findings, so this means that you can get up to 300 findings per second. On average, the solution can export about 1 million findings per hour. If you have a large number of findings, you can start the finding export process and wait for the SNS topic to notify you when the process is complete.
How to customize the solution
The solution provides a general framework to help you export your historical Security Hub findings. There are many ways that you can customize this solution based on your needs. The following are some enhancements that you can consider.
Change the Security Hub finding filter
The solution currently pulls all findings with RecordState: ACTIVE, which pulls the active Security Hub findings in the AWS account. You can update the Lambda function code, specifically the finding_filter JSON value within the create_filter function, to pull findings for your use case. For example, to get all active Security Hub findings from the AWS Foundational Security Best Practices standard, update the Lambda function code as follows.
Export more than 100 million Security Hub findings
The example solution can export about 100 million Security Hub findings. This number is primarily determined by the speed at which findings can be exported, due to the following factors:
Implement a pattern by using a Lambda function to start a new execution of your state machine to split ongoing work across multiple workflow executions. For more information, see the tutorial Continuing Ongoing Work as a New Execution.
Note: If you implement either of these solutions, make sure that the nextToken also gets passed to the new Step Functions execution by updating the Lambda function code to parse and pass the nextToken received in the last request.
Speed up the export
One way to increase the export bandwidth, and reduce the overall execution time, is to run the export job in parallel across the individual Security Hub member accounts rather than from the single delegated administrator account.
You could use CloudFormation StackSets to deploy this solution in each Security Hub member account and send the findings to a centralized S3 bucket. You would need to modify the solution to allow an S3 bucket to be provided as an input, and all the Lambda function Identity and Access Management (IAM) roles would need cross-account access to the S3 bucket and corresponding AWS Key Management Service (AWS KMS) key. You would also need to make updates in each member account to iterate through the various Regions in which the Security Hub findings exist.
Next steps
The solution in this post is designed to assist in the retrieval and export of all existing findings currently in Security Hub. After you successfully run this solution to export historical findings, you can continuously export new Security Hub findings by using the sample solution in the aws-security-hub-findings-export GitHub repository.
In this post, you deployed a solution to export the existing Security Hub findings in your account to a central S3 bucket, so that you can apply complex analytics and machine learning to those findings. We walked you through how to use the solution and apply it to some example use cases after you successfully exported existing findings across your AWS environment. Now your security team can use the data in the S3 bucket for predictive analytics and determine if there are Security Hub findings and specific resources that might need to be prioritized for review due to a deviation from normal behavior. Additionally, you can use this solution to enable more complex analytics on multiple fields by querying large and complex datasets with AWS Athena.
If you have feedback about this post, submit comments in the Comments section below. If you have questions about this post, start a thread on AWS Security Hub re:Post.
Want more AWS Security news? Follow us on Twitter.
The step-up authentication solution discussed in Part 1 uses a reference implementation that you can use for demonstration and learning purposes. You can also review the implementation code in the step-up-auth GitHub repository. The reference implementation includes a web application that you can use in the following sections to test the step-up implementation. Additionally, the implementation contains a sample privileged API action /transfer and a non-privileged API action /info, and two step-up authentication solution API operations /initiate-auth, and /respond-to-challenge. The web application invokes these API operations to demonstrate how to perform step-up authentication.
You must have AWS credentials files that contain a profile with your account secret key and access key to perform the deployment. Make sure that your account has enough privileges to create, update, or delete the following resources:
A two-factor authentication (2FA) mobile application, such as Google Authenticator, is installed on your mobile device.
Deploy the step-up solution
You can deploy the solution by using the AWS CDK, which will create a working reference implementation of the step-up authentication solution.
To deploy the solution
Build the necessary resources by using the build.sh script in the deployment folder. Run the build script from a terminal window, using the following command: cd deployment && ./build.sh
Deploy the solution by using the deploy.sh script that is present in the deployment folder, using the following command. Be sure to replace the required environment variables with your own values. export AWS_REGION=<your AWS Region of choice, for example us-east-2> export AWS_ACCOUNT=<your account number> export AWS_PROFILE=<a valid profile in .aws/credentials that contains the secret/access key to your account> export NODE_ENV=development export ENV_PREFIX=dev
The account you specify in the AWS_ACCOUNT environment variable is used to bootstrap the AWS CDK deployment. Set AWS_PROFILE to point to your profile. Make sure that your account has sufficient privileges, as described in the prerequisites.
The NODE_ENV environment variable can be set to development or production. This variable controls the log output that the Lambda functions generate. The ENV_PREFIX environment variable allows you to prefix all resources with a tag, which enables a multi-tenant deployment of this solution.
Still in the deployment folder, deploy the stack by using the following command: ./deploy.sh
Make note of the CloudFront distribution URL that follows Sample Web App URL, as shown in Figure 1. In the next section, you will use this CloudFront distribution URL to load the sample web app in a web browser and test the step-up solution
Figure 1: The output of the deployment process
After the deployment script deploy.sh completes successfully, the AWS CDK creates the following resources in your account:
An Amazon Cognito user pool that is used as a user registry.
An Amazon API Gateway API that contains three resources:
A protected resource that requires step-up authentication.
An initiate-auth resource to start the step-up challenge response.
A respond-to-challenge resource to complete the step-up challenge.
An API Gateway Lambda authorizer that is used to protect API actions.
The following Amazon DynamoDB tables:
A setting table that holds the configuration mapping of the API operations that require elevated privileges.
A session table that holds temporary, user-initiated step-up sessions and their current status.
A React web UI that demonstrates how to invoke a privileged API action and go through step-up authentication.
Test the step-up solution
In order to test the step-up solution, you’ll use the sample web application that you deployed in the previous section. Here’s an overview of the actions you’ll perform to test the flow:
In the AWS Management Console, create items in the setting DynamoDB table that point to privileged API actions. After the solution deployment, the setting DynamoDB table is called step-up-auth-setting-<ENV_PREFIX>. For more information about ENV_PREFIX variable usage in a multi-tenant environment, see Deploy the step-up solution earlier in this post.
As discussed, in the Data design section in Part 1 of this series, the Lambda authorizer treats all API invocations as non-privileged (that is, they don’t require step-up authentication) unless there is a matching entry for the API action in the setting table. Additionally, you can switch a privileged API action to a non-privileged API action by simply changing the stepUpState attribute in the setting table. Create an item in the DynamoDB table for the sample /transfer API action and for the sample /info API action. The /transfer API action will require step-up authentication, whereas the /info API action will be a non-privileged invocation that does not require step-up authentication. Note that there is no need to define a non-privileged API action in the table; it is there for illustration purposes only.
If you haven’t already, install Google Authenticator or a similar two-factor authentication (2FA) application on your mobile device.
Using the sample web application, register a new user in Amazon Cognito.
Log in to the sample web application by using the registered new user.
Configure the preferred multi-factor authentication (MFA) settings for the logged in user in the application. This step is necessary so that Amazon Cognito can challenge the user with a one-time password (OTP).
Using the sample web application, invoke the sample /transfer privileged API action that requires step-up authentication.
The Lambda authorizer will intercept the API request and return a 401 Unauthorized response status code that the sample web application will handle. The application will perform step-up authentication by prompting you to provide additional security credentials, specifically the OTP. To complete the step-up authentication, enter the OTP, which is sent through short service message (SMS) or by using an authenticator mobile app.
Invoke the sample /transfer privileged API action again in the sample web application, and verify that the API invocation is successful.
The following instructions assume that you’ve installed a 2FA mobile application, such as Google Authenticator, on your mobile device. You will configure the 2FA application in the following steps and use the OTP from this mobile application when prompted to enter the step-up challenge. You can configure Amazon Cognito to send you an SMS with the OTP. However, you must be aware of the Amazon Cognito throttling limits. See the Additional considerations section in Part 1 of this series. Read these limits carefully, especially if you set the user’s preferred MFA setting to SMS.
On the left nav pane, under Tables, choose Explore items. In the right pane, choose the table named step-up-auth-setting* and choose Create item, as shown in Figure 2.
Figure 2: Choose the step-up-auth-setting* table and choose Create item button
In the Edit item screen as shown in Figure 3, ensure that JSON is selected, and the Attributes button for View DynamoDB JSON is off.
Figure 3: Edit an item in the table – select JSON and turn off View DynamoDB JSON button
To create an entry for the /info API action, copy the following JSON text:
Paste the copied JSON text for the /transfer API action in the Attributes text area, as shown in Figure 4, and choose Create item.
Figure 5: Create an entry for the /transfer API action
Open your web browser and load the CloudFront URL that you made note of in step 4 of the Deploy the step-up solution procedure.
On the login screen of the sample web application, enter the information for a new user. Make sure that the email address and phone numbers are valid. Choose Register. You will be prompted to enter a verification code. Check your email for the verification code, and enter it at the sample web application prompt.
You will be sent back to the login screen. Log in as the user that you just registered. You will see the welcome screen, as shown in Figure 6.
Figure 6: Welcome screen of the sample web application
In the left nav pane choose Setting, choose the Configure button to the right of Software Token, as shown in Figure 7. Use your mobile device camera to capture the QR code on the screen in your 2FA application, for example Google Authenticator.
Figure 7: Configure Software Token screen with QR code
Enter the temporary code from the 2FA application into the web application and choose Submit. You will see the message Software Token successfully configured!
Still in the Setting menu, next to Select Preferred MFA, choose Software Token. You will see the message User preferred MFA set to Software Token, as shown in Figure 8.
Figure 8: Completed Software Token setup
In the left nav pane choose StepUp Auth. In the right pane, choose Invoke Transfer API. You should see Response: 401 authorization challenge, as shown in Figure 9.
Figure 9: The step-up API invocation returns an authorization challenge
On your mobile device, open the 2FA application, copy the OTP code from the 2FA application, and enter the code into the Enter OTP field, as shown in Figure 9. Choose Submit.
This sends the OTP to the respond-to-challenge endpoint. After the OTP is verified, the endpoint will return a success or failure message. Figure 10 shows a successful OTP verification. You are prompted to invoke the /transfer privileged API action again.
Figure 10: The OTP prompt during step-up API invocation
Invoke the transfer API action again by choosing Invoke Transfer API. You should see a success message as shown in Figure 11.
Figure 11: A successful step-up API invocation
Congratulations! You’ve successfully performed step-up authentication.
Conclusion
In the previous post in this series, Implement step-up authentication with Amazon Cognito, Part 1: Solution overview, you learned about the architecture and implementation details for the step-up authentication solution. In this blog post, you learned how to deploy and test the step-up authentication solution in your AWS account. You deployed the solution by using scripts from the step-up-auth GitHub repository that use the AWS CDK to create resources in your account for Amazon Cognito, Amazon API Gateway, a Lambda authorizer, and Amazon DynamoDB. Finally, you tested the end-to-end solution on a sample web application by invoking a privileged API action that required step-up authentication. Using the 2FA application, you were able to pass in an OTP to complete the step-up authentication and subsequently successfully invoke the privileged API action.
If you have feedback about this post, submit comments in the Comments section below. If you have any questions about this post, start a thread on the Amazon Cognito forum.
Want more AWS Security news? Follow us on Twitter.
In this blog post, you’ll learn how to protect privileged business transactions that are exposed as APIs by using multi-factor authentication (MFA) or security challenges. These challenges have two components: what you know (such as passwords), and what you have (such as a one-time password token). By using these multi-factor security controls, you can implement step-up authentication to obtain a higher level of security when you perform critical transactions. In this post, we show you how you can use AWS services such as Amazon API Gateway, Amazon Cognito, Amazon DynamoDB, and AWS Lambda functions to implement step-up authentication by using a simple rule-based security model for your API resources.
Previously, identity and access management solutions have attempted to deliver step-up authentication by retrofitting their runtimes with stateful server-side management, which doesn’t scale in the modern-day stateless cloud-centered application architecture. We’ll show you how to use a pluggable, stateless authentication implementation that integrates into your existing infrastructure without compromising your security or performance. The Amazon API Gateway Lambda authorizer is a pluggable serverless function that acts as an intermediary step before an API action is invoked. This Lambda authorizer, coupled with a small SDK library that runs in the authorizer, will provide step-up authentication.
The reference architecture in this post uses a purpose-built step-up authorization workflow engine, which uses a custom SDK. The custom SDK uses the DynamoDB service as a persistent layer. This workflow engine is generic and can be used across any API serving layers, such as API Gateway or Elastic Load Balancing (ELB) Application Load Balancer, as long as the API serving layers can intercept API requests to perform additional actions. The step-up workflow engine also relies on an identity provider that is capable of issuing an OAuth 2.0 access token.
There are three parts to the step-up authentication solution:
An API serving layer with the capability to apply custom logic before applying business logic.
An OAuth 2.0–capable identity provider system.
A purpose-built step-up workflow engine.
The solution in this post uses Amazon Cognito as the identity provider, with an API Gateway Lambda authorizer to invoke the step-up workflow engine, and DynamoDB as a persistent layer used by the step-up workflow engine. You can see a reference implementation of the API Gateway Lambda authorizer in the step-up-auth GitHub repository. Additionally, the purpose-built step-up workflow engine provides two API endpoints (or API actions), /initiate-auth and /respond-to-challenge, which are realized using the API Gateway Lambda authorizer, to drive the API invocation step-up state.
Note: If you decide to use an API serving layer other than API Gateway, or use an OAuth 2.0 identity provider besides Amazon Cognito, you will have to make changes to the accompanying sample code in the step-up-auth GitHub repository.
Solution architecture
Figure 1 shows the high-level reference architecture.
First, let’s talk about the core components in the step-up authentication reference architecture in Figure 1.
Identity provider
In order for a client application or user to invoke a protected backend API action, they must first obtain a valid OAuth token or JSON web token (JWT) from an identity provider. The step-up authentication solution uses Amazon Cognito as the identity provider. The step-up authentication solution and the accompanying step-up API operations use the access token to make the step-up authorization decision.
Protected backend
The step-up authentication solution uses API Gateway to protect backend resources. API Gateway supports several different API integration types, and you can use any one of the supported API Gateway integration types. For this solution, the accompanying sample code in the step-up-auth GitHub repository uses Lambda proxy integration to simulate a protected backend resource.
Data design
The step-up authentication solution relies on two DynamoDB tables, a session table and a setting table. The session table contains the user’s step-up session information, and the setting table contains an API step-up configuration. The API Gateway Lambda authorizer (described in the next section) checks the setting table to determine whether the API request requires a step-up session. For more information about table structure and sample values, see the Step-up authentication data design section in the accompanying GitHub repository.
The session table has the DynamoDB Time to Live (TTL) feature enabled. An item stays in the session table until the TTL time expires, when DynamoDB automatically deletes the item. The TTL value can be controlled by using the environment variable SESSION_TABLE_ITEM_TTL. Later in this post, we’ll cover where to define this environment variable in the Step-up solution design details section; and we’ll cover how to set the optimal value for this environment variable in the Additional considerations section.
Authorizer
The step-up authentication solution uses a purpose-built request parameter-based Lambda authorizer (also called a REQUEST authorizer). This REQUEST authorizer helps protect privileged API operations that require a step-up session.
The authorizer verifies that the API request contains a valid access token in the HTTP Authorization header. Using the access token’s JSON web token ID (JTI) claim as a key, the authorizer then attempts to retrieve a step-up session from the session table. If a session exists and its state is set to either STEP_UP_COMPLETED or STEP_UP_NOT_REQUIRED, then the authorizer lets the API call through by generating an allow API Gateway Lambda authorizer policy. If the set-up state is set to STEP_UP_REQUIRED, then the authorizer returns a 401 Unauthorized response status code to the caller.
If a step-up session does not exist in the session table for the incoming API request, then the authorizer attempts to create a session. It first looks up the setting table for the API configuration. If an API configuration is found and the configuration status is set to STEP_UP_REQUIRED, it indicates that the user must provide additional authentication in order to call this API action. In this case, the authorizer will create a new session in the session table by using the access token’s JTI claim as a session key, and it will return a 401 Unauthorized response status code to the caller. If the API configuration in the setting table is set to STEP_UP_DENY, then the authorizer will return a deny API Gateway Lambda authorizer policy, therefore blocking the API invocation. The caller will receive a 403 Forbidden response status code.
The authorizer uses the purpose-built auth-sdk library to interface with both the session and setting DynamoDB tables. The auth-sdk library provides convenient methods to create, update, or delete items in tables. Internally, auth-sdk uses the DynamoDB v3 Client SDK.
Initiate auth endpoint
When you deploy the step-up authentication solution, you will get the following two API endpoints:
The initiate step-up authentication endpoint (described in this section).
The respond to step-up authentication challenge endpoint (described in the next section).
When a client receives a 401 Unauthorized response status code from API Gateway after invoking a privileged API operation, the client can start the step-up authentication flow by invoking the initiate step-up authentication endpoint (/initiate-auth).
The /initiate-auth endpoint does not require any extra parameters, it only requires the Amazon Cognito access_token to be passed in the Authorization header of the request. The /initiate-auth endpoint uses the access token to call the Amazon Cognito API actions GetUser and GetUserAttributeVerificationCode on behalf of the user.
After the /initiate-auth endpoint has determined the proper multi-factor authentication (MFA) method to use, it returns the MFA method to the client. There are three possible values for the MFA methods:
MAYBE_SOFTWARE_TOKEN_STEP_UP, which is used when the MFA method cannot be determined.
SOFTWARE_TOKEN_STEP_UP, which is used when the user prefers software token MFA.
SMS_STEP_UP, which is used when the user prefers short message service (SMS) MFA.
Let’s take a closer look at how /initiate-auth endpoint determines the type of MFA methods to return to the client. The endpoint calls Amazon Cognito GetUser API action to check for user preferences, and it takes the following actions:
Determines what method of MFA the user prefers, either software token or SMS.
If the user’s preferred method is set to software token, the endpoint returns SOFTWARE_TOKEN_STEP_UP code to the client.
If the user’s preferred method is set to SMS, the endpoint sends an SMS message with a code to the user’s mobile device. It uses the Amazon Cognito GetUserAttributeVerificationCode API action to send the SMS message. After the Amazon Cognito API action returns success, the endpoint returns SMS_STEP_UP code to the client.
When the user preferences don’t include either a software token or SMS, the endpoint checks if the response from Amazon Cognito GetUser API action contains UserMFASetting response attribute list with either SOFTWARE_TOKEN_MFA or SMS_MFA keywords. If the UserMFASetting response attribute list contains SOFTWARE_TOKEN_MFA, then the endpoint returns SOFTWARE_TOKEN_STEP_UP code to the client. If it contains SMS_MFA keyword, then the endpoint invokes the Amazon Cognito GetUserAttributeVerificationCode API action to send the SMS message (as in step 3). Upon successful response from the Amazon Cognito API action, the endpoint returns SMS_STEP_UP code to the client.
If the UserMFASetting response attribute list from Amazon Cognito GetUser API action does not contain SOFTWARE_TOKEN_MFA or SMS_MFA keywords, then the endpoint looks for phone_number_verified attribute. If found, then the endpoint sends an SMS message with a code to the user’s mobile device with verified phone number. The endpoint uses the Amazon Cognito GetUserAttributeVerificationCode API action to send the SMS message (as in step 3). Otherwise, when no verified phone is found, the endpoint returns MAYBE_SOFTWARE_TOKEN_STEP_UP code to the client.
The flowchart shown in Figure 2 illustrates the full decision logic.
Figure 2: MFA decision flow chart
Respond to challenge endpoint
The respond to challenge endpoint (/respond-to-challenge) is called by the client after it receives an appropriate MFA method from the /initiate-auth endpoint. The user must respond to the challenge appropriately by invoking /respond-to-challenge with a code and an MFA method.
The /respond-to-challenge endpoint receives two parameters in the POST body, one indicating the MFA method and the other containing the challenge response. Additionally, this endpoint requires the Amazon Cognito access token to be passed in the Authorization header of the request.
If the MFA method is SMS_STEP_UP, the /respond-to-challenge endpoint invokes the Amazon Cognito API action VerifyUserAttribute to verify the user-provided challenge response, which is the code that was sent by using SMS.
If the MFA method is SOFTWARE_TOKEN_STEP_UP or MAYBE_SOFTWARE_TOKEN_STEP_UP, the /respond-to-challenge endpoint invokes the Amazon Cognito API action VerifySoftwareToken to verify the challenge response that was sent in the endpoint payload.
After the user-provided challenge response is verified, the /respond-to-challenge endpoint updates the session table with the step-up session state STEP_UP_COMPLETED by using the access_token JTI. If the challenge response verification step fails, no changes are made to the session table. As explained earlier in the Data design section, the step-up session stays in the session table until the TTL time expires, when DynamoDB will automatically delete the item.
Deploy and test the step-up authentication solution
Otherwise, you can continue reading the rest of this post to review the details and code behind the step-up authentication solution.
Step-up solution design details
Now let’s dig deeper into the step-up authentication solution. Figure 3 expands on the high-level solution design in the previous section and highlights the sequence of events that must take place to perform step-up authentication. In this section, we’ll break down these sequences into smaller parts and discuss each by going over a detailed sequence diagram.
Let’s group the step-up authentication flow in Figure 3 into three parts:
Create a step-up session (steps 1-6 in Figure 3)
Initiate step-up authentication (steps 7-8 in Figure 3)
Respond to the step-up challenge (steps 9-12 in Figure 3)
In the next sections, you’ll learn how the user’s API requests are handled by the step-up authentication solution, and how the user state is elevated by going through an additional challenge.
Create a step-up session
After the user successfully logs in, they create a step-up session when invoking a privileged API action that is protected with the step-up Lambda authorizer. This authorizer determines whether to start a step-up challenge based on the configuration within the DynamoDB setting table, which might create a step-up session in the DynamoDB session table. Let’s go over steps 1–6, shown in the architecture diagram in Figure 3, in more detail:
Step 1 – It’s important to note that the user must authenticate with Amazon Cognito initially. As a result, they must have a valid access token generated by the Amazon Cognito user pool.
Step 2 – The user then invokes a privileged API action and passes the access token in the Authorization header.
Step 3 – The API action is protected by using a Lambda authorizer. The authorizer first validates the token by invoking the Amazon Cognito user pool public key. If the token is invalid, a 401 Unauthorized response status code can be sent immediately, prompting the client to present a valid token.
Step 4 – The authorizer performs a lookup in the DynamoDB setting table to check whether the current request needs elevated privilege (also known as step-up privilege). In the setting table, you can define which API actions require elevated privilege. You can additionally bundle API operations into a group by defining the group attribute. This allows you to further isolate privileged API operations, especially in a large-scale deployment.
Step 5 – If an API action requires elevated privilege, the authorizer will check for an existing step-up session for this specific user in the session table. If a step-up session does not exist, the authorizer will create a new entry in the session table. The key for this table will be the JTI claim of the access_token (which can be obtained after token verification).
Step 6 – If a valid session exists, then authorization will be given. Otherwise an unauthorized access response (401 HTTP code) will be sent back from the Lambda authorizer, indicating that the user requires elevated privilege.
Figure 4 highlights these steps in a sequence diagram.
Figure 4: Sequence diagram for creating a step-up session
Initiate step-up authentication
After the user receives a 401 Unauthorized response status code from invoking the privileged API action in the previous step, the user must call the /initiate-auth endpoint to start step-up authentication. The endpoint will return the response to the user or the client application to supply the temporary code. Let’s go over steps 7 and 8, shown in the architecture diagram in Figure 3, in more detail:
Step 7 – The client application initiates a step-up action by calling the /initiate-auth endpoint. This action is protected by the API Gateway built-in Amazon Cognito authorizer, and the client needs to pass a valid access_token in the Authorization header.
Step 8 – The call is forwarded to a Lambda function that will initiate the step-up action with the end user. The function first calls the Amazon Cognito API action GetUser to find out the user’s MFA settings. Depending on which MFA type is enabled for the user, the function uses different Amazon Cognito API operations to start the MFA challenge. For more details, see the Initiate auth endpoint section earlier in this post.
Figure 5 shows these steps in a sequence diagram.
Figure 5: Sequence diagram for invoking /initiate-auth to start step-up authentication
Respond to the step-up challenge
In the previous step, the user receives a challenge code from the /initiate-auth endpoint. Depending on the type of challenge code, user must respond by sending a one-time password (OTP) to the /respond-to-challenge endpoint. The /respond-to-challenge endpoint invokes an Amazon Cognito API action to verify the OTP. Upon successful verification, the /respond-to-challenge endpoint marks the step-up session in the session table to STEP_UP_COMPLETED, indicating that the user now has elevated privilege. At this point, the user can invoke the privileged API action again to perform the elevated business operation. Let’s go over steps 9–12, shown in the architecture diagram in Figure 3, in more detail:
Step 9 – The client application presents an appropriate screen to the user to collect a response to the step-up challenge. The client application calls the /respond-to-challenge endpoint that contains the following:
An access_token in the Authorization header.
A step-up challenge type.
A response provided by the user to the step-up challenge.
This endpoint is protected by the API Gateway built-in Amazon Cognito authorizer.
Step 10 – The call is forwarded to the Lambda function, which verifies the response by calling the Amazon Cognito API action VerifyUserAttribute (in the case of SMS_STEP_UP) or VerifySoftwareToken (in the case of SOFTWARE_TOKEN_STEP_UP), depending on the type of step-up action that was returned from the /initiate-auth API action. The Amazon Cognito response will indicate whether verification was successful.
Step 11 – If the Amazon Cognito response in the previous step was successful, the Lambda function associated with the /respond-to-challenge endpoint inserts a record in the session table by using the access_token JTI as key. This record indicates that the user has completed step-up authentication. The record is inserted with a time to live (TTL) equal to the lesser of these values: the remaining period in the access_token timeout, or the default TTL value that is set in the Lambda function as a configurable environment variable, SESSION_TABLE_ITEM_TTL. The /respond-to-challenge endpoint returns a 200 status code after successfully updating the session table. It returns a 401 Unauthorized response status code if the operation failed or if the Amazon Cognito API calls in the previous step failed. For more information about the optimal value for the SESSION_TABLE_ITEM_TTL variable, see the Additional considerations section later in this post.
Step 12 – The client application can re-try the original call (using the same access token) to the privileged API operations, and this call should now succeed because an active step-up session exists for the user. Calls to other privileged API operations that require step-up should also succeed, as long as the step-up session hasn’t expired.
Figure 6 shows these steps in a sequence diagram.
Figure 6: Invoke the /respond-to-challenge endpoint to complete step-up authentication
Additional considerations
This solution uses several Amazon Cognito API operations to provide step-up authentication functionality. Amazon Cognito applies rate limiting on all API operations categories, and rapid calls that exceed the assigned quota will be throttled.
The step-up flow for a single user can include multiple Amazon Cognito API operations such as GetUser, GetUserAttributeVerificationCode, VerifyUserAttribute, and VerifySoftwareToken. These Amazon Cognito API operations have different rate limits. The effective rate, in requests per second (RPS), that your privileged and protected API action can achieve will be equivalent to the lowest category rate limit among these API operations. When you use the default quota, your application can achieve 25 SMS_STEP_UP RPS or up to 50 SOFTWARE_TOKEN_STEP_UP RPS.
Certain Amazon Cognito API operations have additional security rate limits per user per hour. For example, the GetUserAttributeVerificationCode API action has a limit of five calls per user per hour. For that reason, we recommend 15 minutes as the minimum value for SESSION_TABLE_ITEM_TTL, as this will allow a single user to have up to four step-up sessions per hour if needed.
Conclusion
In this blog post, you learned about the architecture of our step-up authentication solution and how to implement this architecture to protect privileged API operations by using AWS services. You learned how to use Amazon Cognito as the identity provider to authenticate users with multi-factor security and API Gateway with an authorizer Lambda function to enforce access to API actions by using a step-up authentication workflow engine. This solution uses DynamoDB as a persistent layer to manage the security rules for the step-up authentication workflow engine, which helps you to efficiently manage your rules.
If you have feedback about this post, submit comments in the Comments section below. If you have any questions about this post, start a thread on the Amazon Cognito forum.
Want more AWS Security news? Follow us on Twitter.
Deploy a RESTful API stage to Amazon API Gateway from an OpenAPI specification.
Build and deploy an AWS Lambda function that contains the API functionality.
Auto-generate API documentation and publish it to an Amazon Simple Storage Service (Amazon S3)-hosted website served by the Amazon CloudFront content delivery network (CDN) service. This provides technical and non-technical stakeholders with versioned, current, and accessible API documentation.
Auto-generate client libraries for invoking the API and deploy them to AWS CodeArtifact, which is a fully-managed artifact repository service. This allows API client development teams to integrate with different versions of the API in different environments.
The diagram shown in the following figure depicts the architecture of the AWS services and resources described in this post.
Figure 1 – Architecture
The code that accompanies this post, written in Java, is available here.
Background
APIs must be understood by all stakeholders and parties within an enterprise including business areas, management, enterprise architecture, and other teams wishing to consume the API. Unfortunately, API definitions are often hidden in code and lack up-to-date documentation. Therefore, they remain inaccessible for the majority of the API’s stakeholders. Furthermore, it’s often challenging to determine what version of an API is present in different environments at any one time.
This post describes some solutions to these issues by demonstrating how to continuously deliver up-to-date and accessible API documentation, API client libraries, and API deployments.
AWS CDK
The AWS CDK is a software development framework for defining cloud IaC and is available in multiple languages including TypeScript, JavaScript, Python, Java, C#/.Net, and Go. The AWS CDK Developer Guide provides best practices for using the CDK.
This post uses the CDK to define IaC in Java which is synthesized to a cloud assembly. The cloud assembly includes one to many templates and assets that are deployed via an AWS CodePipeline pipeline. A unit of deployment in the CDK is called a Stack.
OpenAPI specifications describe the capabilities of an API and are both human and machine-readable. They consist of definitions of API components which include resources, endpoints, operation parameters, authentication methods, and contact information.
Project composition
The API project that accompanies this post consists of three directories:
app
api
cdk
app directory
This directory contains the code for the Lambda function which is invoked when the Widget API is invoked via API Gateway. The code has been developed in Java as an Apache Maven project.
The Quarkus framework has been used to define a WidgetResource class (see src/main/java/aws/sample/blog/cdkopenapi/app/WidgetResources.java ) that contains the methods that align with HTTP Methods of the Widget API. api directory
The api directory contains the OpenAPI specification file ( openapi.yaml ). This file is used as the source for:
The api directory also contains the following files:
openapi-generator-config.yaml : This file contains configuration settings for the OpenAPI Generator framework, which is described in the section CI/CD Pipeline.
maven-settings.xml: This file is used support the deployment of the generated SDKs or libraries (Apache Maven artifacts) for the API and is described in the CI/CD Pipeline section of this post.
This directory contains a sub directory called docker . The docker directory contains a Dockerfile which defines the commands for building a Docker image:
FROM ruby:2.6.5-alpine

RUN apk update \
 && apk upgrade --no-cache \
 && apk add --no-cache --repository http://dl-cdn.alpinelinux.org/alpine/v3.14/main/ nodejs=14.20.0-r0 npm \
 && apk add git \
 && apk add --no-cache build-base

# Install Widdershins node packages and ruby gem bundler
RUN npm install -g widdershins \
 && gem install bundler

# working directory
WORKDIR /openapi

# Clone and install the Slate framework
RUN git clone https://github.com/slatedocs/slate
RUN cd slate \
 && bundle install
The Docker image incorporates two open source projects, the NodeJS Widdershins library and the Ruby Slate-framework. These are used together to auto-generate the documentation for the API from the OpenAPI specification. This Dockerfile is referenced and built by the ApiStack class, which is described in the CDK Stacks section of this post.
cdk directory
This directory contains an Apache Maven Project developed in Java for provisioning the CDK stacks for the Widget API.
Under the src/main/java folder, the package aws.sample.blog.cdkopenapi.cdk contains the files and classes that define the application’s CDK stacks and also the entry point (main method) for invoking the stacks from the CDK Toolkit CLI:
CdkApp.java: This file contains the CdkApp class which provides the main method that is invoked from the AWS CDK Toolkit to build and deploy the application stacks.
ApiStack.java: This file contains the ApiStack class which defines the OpenApiBlogAPI stack and is described in the CDK Stacks section of this post.
PipelineStack.java: This file contains the PipelineStack class which defines the OpenAPIBlogPipeline stack and is described in the CDK Stacks section of this post.
ApiStackStage.java: This file contains the ApiStackStage class which defines a CDK stage. As detailed in the CI/CD Pipeline section of this post, a DEV stage, containing the OpenApiBlogAPI stack resources for a DEV environment, is deployed from the OpenApiBlogPipeline pipeline.
The ApiStack class defines multiple resources including:
Widget API Lambda function: This is bundled by the CDK in a Docker container using the Java 11 runtime image.
Widget REST API on API Gateway: The REST API is created from an Inline API Definition which is passed as an S3 CDK Asset. This asset includes a reference to the Widget API OpenAPI specification located under the api folder (see api/openapi.yaml ) and builds upon the SpecRestApi construct and API Gateway’s support for OpenApi.
API documentation Docker Image Asset: This is the Docker image that contains the open source frameworks (Widdershins and Slate) that are leveraged to generate the API documentation.
CDK Asset bundling functionality that leverages the API documentation Docker image to auto-generate documentation for the API.
An S3 Bucket for holding the API documentation website.
An origin access identity (OAI) which allows CloudFront to securely serve the S3 Bucket API documentation content.
The CDK, by default, auto-assigns an ID for each defined resource but in this case the generated ID is being overridden with “APILambda”. The reason for this is that inside of the Widget API OpenAPI specification (see api/openapi.yaml ), there is a reference to the Lambda function by name (“APILambda”) so that the function can be integrated as a proxy for each listed API path and method combination. The OpenAPI specification includes this name as a variable to derive the Amazon Resource Name (ARN) for the Lambda function:
The PipelineStack class defines a CDK CodePipline construct which is a higher level construct and pattern. Therefore, the construct doesn’t just map directly to a single CloudFormation resource, but provisions multiple resources to fulfil the requirements of the pattern. The post, CDK Pipelines: Continuous delivery for AWS CDK applications, provides more detail on creating pipelines with the CDK.
The diagram in the following figure shows the multiple CodePipeline stages and actions created by the CDK CodePipeline construct that is defined in the PipelineStack class.
Figure 2 – CI/CD Pipeline
The stages defined include the following:
Source stage: The pipeline is passed the source code contents from this stage.
Synth stage: This stage consists of a Synth Action that synthesizes the CloudFormation templates for the application’s CDK stacks and compiles and builds the project Lambda API function.
Update Pipeline stage: This stage checks the OpenAPIBlogPipeline stack and reinitiates the pipeline when changes to its definition have been deployed.
Assets stage: The application’s CDK stacks produce multiple file assets (for example, zipped Lambda code) which are published to Amazon S3. Docker image assets are published to a managed CDK framework Amazon Elastic Container Registry (Amazon ECR) repository.
DEV stage: The API’s CDK stack ( OpenApiBlogAPI ) is deployed to a hypothetical development environment in this stage. A post stage deployment action is also defined in this stage. Through the use of a CDK ShellStep construct, a Bash script is executed that deploys a generated client Java Archive (JAR) for the Widget API to CodeArtifact. The script employs the OpenAPI Generator project for this purpose:
To run this project, you must install the AWS CLI v2, the AWS CDK Toolkit CLI, a Java/JDK 11 runtime, Apache Maven, Docker, and a Git client. Furthermore, the AWS CLI must be configured for a user who has administrator access to an AWS Account. This is required to bootstrap the CDK in your AWS account (if not already completed) and provision the required AWS resources.
To build and run the project, perform the following steps:
Commit and push your changes back to your GitHub repository:
git push origin main
Change into the cdk directory and bootstrap the CDK in your AWS account if you haven’t already done so (enter “Y” when prompted):
cd cdk
cdk bootstrap
Deploy the CDK pipeline stack (enter “Y” when prompted):
cdk deploy OpenAPIBlogPipeline
Once the stack deployment completes successfully, the pipeline OpenAPIBlogPipeline will start running. This will build and deploy the API and its associated resources. If you open the Console and navigate to AWS CodePipeline, then you’ll see a pipeline in progress for the API.
Once the pipeline has completed executing, navigate to AWS CloudFormation to get the output values for the DEV-OpenAPIBlog stack deployment:
Select the DEV-OpenAPIBlog stack entry and then select the Outputs column. Record the REST_URL value for the key that begins with OpenAPIBlogRestAPIEndpoint .
Record the CLOUDFRONT_URL value for the key OpenAPIBlogCloudFrontURL .
The API ping method at https://<REST_URL>/ping can now be invoked using your browser or an API development tool like Postman. Other API other methods, as defined by the OpenApi specification, are also available for invocation (For example, GET https://<REST_URL>/widgets).
To view the generated API documentation, open a browser at https://< CLOUDFRONT_URL>.
The following figure shows the API documentation website that has been auto-generated from the API’s OpenAPI specification. The documentation includes code snippets for using the API from multiple programming languages.
Figure 3 – Auto-generated API documentation
To view the generated API client code artifact, open the Console and navigate to AWS CodeArtifact. The following figure shows the generated API client artifact that has been published to CodeArtifact.
Figure 4 – API client artifact in CodeArtifact
Cleaning up
From the command change to the cdk directory and remove the API stack in the DEV stage (enter “Y” when prompted):
cd cdk
cdk destroy OpenAPIBlogPipeline/DEV/OpenAPIBlogAPI
Once this has completed, delete the pipeline stack:
cdk destroy OpenAPIBlogPipeline
Delete the S3 bucket created to support pipeline operations. Open the Console and navigate to Amazon S3. Delete buckets with the prefix openapiblogpipeline .
Conclusion
This post demonstrates the use of the AWS CDK to deploy a RESTful API defined by the OpenAPI/Swagger specification. Furthermore, this post describes how to use the AWS CDK to auto-generate API documentation, publish this documentation to a web site hosted on Amazon S3, auto-generate API client libraries or SDKs, and publish these artifacts to an Apache Maven repository hosted on CodeArtifact.
The solution described in this post can be improved by:
Building and pushing the API documentation Docker image to Amazon ECR, and then using this image in CodePipeline API pipelines.
Creating stages for different environments such as TEST, PREPROD, and PROD.
Adding integration testing actions to make sure that the API Deployment is working correctly.
The amount of data available to be collected, stored and processed within an organization’s AWS environment can grow rapidly and exponentially. This increases the operational complexity and the need to identify and protect sensitive data. If your security teams need to review and remediate security risks manually, it would either take a large team or the actions might not be timely. There is also a chance that with manual operation, a step could be missed or the incorrect action could be taken. As a result, your security teams will need an automated and scalable way to support these operations efficiently.
Amazon Macie is a fully managed data security and data privacy service that uses machine learning and pattern matching to discover and protect your sensitive data in AWS. Macie generates findings for sensitive data in an S3 object or a potential issue with the security or privacy of an S3 bucket. AWS Security Hub allows you to gain a centralized view into the security posture across your AWS environment by aggregating security findings from various AWS services and partner products, including Amazon Macie. Security Hub also includes the custom actions feature, which you can use to create actions for response and remediation to selected findings within the Security Hub console in an efficient and consistent manner.
It is important for your security teams to create effective and standardized mechanisms for taking action against Macie findings to ensure that data remains secure. By using Security Hub custom actions, you can have predefined actions for the security team to take against Macie findings without having to manually find and remediate the resources.
This blog post provides you with an example solution for responding to Macie sensitive data findings and policy findings in Security Hub by using custom actions. I will walk through the components of the solution, as well as opportunities where resources can be customized for your specific use case.
Prerequisites
You must have AWS Security Hub and Amazon Macie enabled in the AWS account where you are deploying this solution.
Solution overview
In this solution, you’ll use a combination of Security Hub custom actions, Amazon EventBridge, and AWS Lambda to take action on Macie findings in Security Hub. You will be working with the findings within the same AWS account where you deployed the solution.
Macie generates two categories of findings relating to different resources, which will require different remediation actions.
Sensitive data finding is a detailed report of sensitive data in an S3 object.
A full list of Macie finding types can be found in the Macie User guide.
For the two Macie finding categories, there is an associated Security Hub custom action:
Custom action for sensitive data finding (S3 object) – When the security team selects this custom action, the action invokes a Lambda function that will take the following steps on the S3 object in the Macie finding:
Tag the object with the Security Hub finding ID
Encrypt the S3 object with a different customer-managed KMS key
Update the Security Hub finding workflow status to RESOLVED
Custom action for policy finding (S3 bucket). When you select this this custom action, it invokes a Lambda function that will take the following steps on the S3 bucket in the Macie finding:
Tag the object with the Security Hub finding ID
Update the S3 bucket configuration to:
Enable default encryption
Enable public access block
Update the Security Hub finding workflow status to RESOLVED
The solution is configured to take action within the AWS account where the finding and corresponding resource is generated. In order to enable cross-account remediation, you will need to deploy an additional IAM role for the automation to assume and provision a KMS key to use for encryption.
Note: The custom actions in this solution are meant to be examples of actions to take against Macie policy and sensitive data findings. These actions will be different depending on your use-case and environment. You will also need to review and update the associated Lambda function execution role IAM policies accordingly.
Solution architecture
Figure 1: Resources deployed in the Security AWS account taking action on resources identified in the Workload AWS account
Figure 1 shows the architecture for the solution. The workflow is as follows:
A Macie job runs and creates findings, which are sent to Security Hub in the same AWS account as the Macie finding.
The delegated administrator Security Hub account combines findings across all member Security Hub accounts, including Macie findings.
The security team reviews the Macie findings in the Security Hub delegated administrator account and determines to take remediation actions for a finding by selecting the finding and then selecting the appropriate Security Hub custom action.
The Security Hub custom action sends the finding to the EventBridge rule, which is linked to the Lambda function.
The EventBridge rule invokes the Lambda function to take action against the resources from the Macie finding.
The Lambda function will:
Take action for the S3 resource
Mark the Macie finding as resolved in the delegated administrator Security Hub account
The solution is currently intended to work in a single Region. In order to enable this solution across Regions, you will need to change the Remediation Lambda function code for any regional resources used for remediation actions (i.e. AWS Key Management Service).
To deploy the solution by using the AWS Management Console
In your security tooling account, launch the AWS CloudFormation template by choosing the following Launch Stack button. It will take approximately 10 minutes for the CloudFormation stack to complete.
Note: The stack will launch in the N. Virginia (us-east-1) Region. To deploy this solution into other AWS Regions, download the solution’s CloudFormation template, modify it, and deploy it to the selected Region.
(OPTIONAL) If you want to enable cross-account remediation, launch the following AWS CloudFormation template in the AWS account where you want to be able to take remediation actions. You can also use AWS CloudFormation StackSets if deploying to multiple AWS accounts.
To deploy the solution by using AWS CDK
You can find the latest code in our GitHub repository, where you can also contribute to the sample code. The following commands show how to deploy the solution by using the AWS CDK. First, the CDK initializes your environment and uploads the AWS Lambda assets to Amazon S3. Then, you can deploy the solution to your account. Make sure to replace <AWS_ACCOUNT> with the account number, and replace <REGION> with the AWS Region that you want the solution deployed to.
Run the following commands in your terminal while authenticated in the security tooling AWS account:
Now that you’ve successfully deployed the solution, you can see things in action. You have two options for testing the workflow on your own:
Use a sample event, generated by a Macie finding in Security Hub, and invoke the Lambda function that is tied to the Security Hub custom action.
Note: If using sample events, you can replace the values for the resources with real resources. Otherwise, you will not be able to see the Lambda function successfully take action because the resource in your sample event may not exist.
I have existing findings for Macie generated in my AWS account, and in the procedures in this section, I’ll walk through taking action against these.
Note: If you set up Macie and Security Hub in a delegated administrator and member model that ingests findings from other AWS accounts, the IAM remediation roles for the S3 bucket and S3 objects must be deployed in the member accounts.
Review deployed resources in the AWS console
Before taking action on your sample findings, review the deployed resources that you’ll use.
To review deployed resources
In the AWS account console where the automation was deployed, go to Security Hub, choose Settings, and then choose Custom actions. You should see two custom actions:
Navigate to the EventBridge console and then choose Rules. You should see four rules:
Disabled – These are disabled by default during deployment
Autoremediate_Macie_Policy_Finding
Autoremediate_Macie_Sensitive_Data_Finding
Figure 3: Disabled EventBridge rules for autoremediation of Macie findings in Security Hub
Enabled – These are enabled by default during deployment:
Custom_Action_Macie_Policy_Finding
Custom_Action_Macie_Sensitive_Data_Finding
Figure 4: Enabled EventBridge rules tied to the Security Hub custom actions
In the enabled EventBridge rules, you should see the corresponding Security Hub custom action Amazon Resource Names (ARNs) in the rule event pattern.
Figure 5: Enabled EventBridge rule event pattern for the Security Hub custom action
Take action on an Amazon Macie object or policy finding
Each Security Hub custom action invokes a corresponding Lambda function that is configured as a target in the EventBridge rule. The Lambda function parses the information in the Macie finding from Security Hub to take action.
Each Security Hub custom action is specific to either an S3 object or an S3 bucket. If you attempt a custom action meant for an S3 object against a Macie policy finding, this will successfully initiate the custom action, but the Lambda function that is invoked will be unsuccessful.
If the Macie finding is specific to an S3 object, the title will display “The S3 object …,” whereas if the Macie finding is for a policy finding, the title will display information for an S3 bucket.
To take action on findings
In the AWS account console where the automation was deployed, navigate to AWS Security Hub, and then choose Findings.
Filter the findings by setting Product Name to Macie.
Figure 6: Filter for Macie findings in Security Hub
Select the checkbox for either a Macie policy finding or a sensitive data finding; this will select a custom action. After you select the action, there is no confirmation step, and the action will invoke the Lambda function.
Figure 7: Validate Custom Action has sent the finding to Amazon CloudWatch Events (EventBridge rule)
Review and validate the Security Hub custom action on target resources
In order to validate or troubleshoot the solution, you need to review whether the Lambda function was able to take action against the resources in the Security Hub finding for Macie.
To validate or troubleshoot the custom action
For validation of sensitive data finding remediation, review S3 object configuration:
Navigate to the Amazon S3 console.
Choose the S3 object in the Macie finding.
Choose the Properties tab and review the following fields:
Tags should be set to SH_Finding_ID.
AWS KMS key ARN should be set to the KMS key with the alias `macie_key`
Click on the KMS key ARN and validate the key’s alias is the key deployed in the solution
For validation of policy finding remediation, review the S3 bucket configuration:
Navigate to the Amazon S3 console.
Choose the S3 bucket in the Macie finding.
Choose the Properties tab and review the following fields:
Tags should be set to SH_Finding_ID.
Default Encryption should be set to Enabled.
Choose the Permissions tab and review the following fields:
Block public access should be set to On.
For troubleshooting, you can review the CloudWatch logs for the Lambda function:
Navigate to the CloudWatch console.
Choose /aws/lambda/Remediate_Macie_S3_Bucket.
Choose the most recent log stream and review the logs to see what actions were taken on the resources.
Next steps and customization
The solution in this post has a custom action for an S3 object and an S3 bucket, and is meant to serve as a template. You could modify the Lambda functions associated with the custom actions to take different or additional actions that are specific to your environment and data classification.
Additionally, I walked through specific Security Hub custom actions for Macie policy (bucket) or sensitive data (objects) findings. If you have defined actions to take for both, you could consolidate the custom actions and invoke a Lambda function that parses information from the Security Hub Macie finding to determine if it is a policy or sensitive data finding.
The two disabled EventBridge rules deployed as part of the solution are examples that can be leveraged for auto-remediation. After you use Security Hub’s custom actions to remediate findings, your security team could start to see a trend where you always want to take specific actions and enable the EventBridge rules to take action without requiring your security team to select a custom action in Security Hub in the AWS console.
Autoremediate_Macie_Policy_Finding
Autoremediate_Macie_Sensitive_Data_Finding
Conclusion
In this post, you deployed a solution to allow your security team to take automated actions against a Macie sensitive data and policy finding from Security Hub by using custom actions in the AWS console. We walked through what the solution does and how the solution can be customized to your use case.
If you have feedback about this post, submit comments in the Comments section below. If you have any questions about this post, start a thread on the AWS Security Hub forum or Amazon Macie forum.
Want more AWS Security news? Follow us on Twitter.
This blog post is written by, Santhosh Kumar Adapa, Database Consultant, AWS WWCO ProServe, Jeevan Shetty, Database Consultant, AWS WWCO ProServe, and Bhanu Ganesh Gudivada, Consultant Databases, AWS WWCO ProServe.
Customers who are running fleets of Amazon Elastic Compute Cloud (Amazon EC2) instances use advanced monitoring techniques to observe their operational performance. Capabilities like aggregated and custom dimensions help customers categorize and customize their metrics across server fleets for fast and efficient decision making. Customers require visibility into not only infrastructure metrics (such as CPU and memory), but also disk usage metrics.
Monitoring Amazon EC2-Windows Amazon Elastic Block Store (Amazon EBS) Volumes usage is critical, especially when customers have a large fleet of Amazon EC2 Windows servers running to host their databases and applications in AWS. Generally, we see issues with EC2 instances running out of disk space, and free disk space isn’t a metric that is directly available with Amazon CloudWatch. Amazon CloudWatch agent helps solve this problem. After installing and configuring the CloudWatch agent on your EC2 instance, the agent will send metric data with the disk utilization to CloudWatch. The next step is to create a CloudWatch alarm to monitor the disk utilization metric.
In this post, we showcase the steps to automate the monitoring and creating alarms for EBS volumes attached to Amazon EC2 Windows instances. Alarms are created using AWS Lambda that monitors the free disk space and alerts whenever thresholds are crossed using Amazon Simple Notification Service (Amazon SNS).
Solution overview
To demonstrate the solution we first install and configure the CloudWatch agent in your Amazon EC2 Windows instance, and then the agent will send metric data with the disk utilization to CloudWatch. To monitor the disk on each Amazon EC2 Windows instance, we’ll use two custom Metrics, “FreeStorageSpaceInMB” and “FreeStorageSpaceInPercent”, that are collected by CloudWatch agent and pushed to CloudWatch.
The following diagram illustrates the architecture used in this post:
Amazon EC2 Windows instance with attached Amazon EBS Volumes to be monitored for free disk usage. The EC2 instance is configured with Amazon CloudWatch Agent.
CloudWatch agent is configured to monitor the “FreeStorageSpaceInMB” and “FreeStorageSpaceInPercent” metrics, and pushed to AWS CloudWatch.
Lambda function that can be invoked to create CloudWatch alarms for each disk attached to the EC2 instance.
CloudWatch Alarms are created with warnings and critical thresholds based on storage size.
Amazon SNS is used to send alerts when the CloudWatch Alarms crosses the threshold.
AWS Identity and Access Management (IAM) to provide permission to the Lambda function to get Amazon EBS metrics and to create CloudWatch Alarms.
To monitor the “FreeStorageSpaceInMB” and “FreeStorageSpaceInPercent” metrics for Amazon EBS volumes attached to the EC2 instance, the CloudWatch agent configuration JSON should have the following section:
In this section, we provide the steps to create an IAM role and deploy a Lambda function using AWS SAM.
Log in to the Amazon EC2 host and install the AWS SAM CLI.
Download the source code and deploy it by running the following command:
git clone https://github.com/aws-samples/aws-ec2-windows-ebs-volumes-monitoring

cd aws-ec2-windows-ebs-volumes-monitoring/ebs_volumes_monitoring
sam deploy --guided
AWS Region – AWS Region where the stack is being deployed.
The following is the sample output when you run sam deploy –guided with default arguments:
=========================================
Stack Name [ebs-volumes-monitoring]: ebs-volumes-monitoring
AWS Region [us-west-2]:
#Shows you resources changes to be deployed and require a 'Y' to initiate deploy
Confirm changes before deploy [y/N]:
#SAM needs permission to be able to create roles to connect to the resources in your template
Allow SAM CLI IAM role creation [Y/n]:
#Preserves the state of previously provisioned resources when an operation fails
Disable rollback [y/N]:
Save arguments to configuration file [Y/n]:
SAM configuration file [samconfig.toml]:
SAM configuration environment [default]:
In the following sections, we describe the AWS services deployed with AWS SAM.
IAM role
AWS SAM creates an IAM role with policies to describe EC2 instances, as well as List, Get, and Put CloudWatch metrics. Furthermore, it attaches an AWS managed IAM policy called AWSLambdaBasicExecutionRole to the IAM role. This role is attached to the Lambda functions to create Amazon EBS volume alarms for EC2 instances.
Lambda function
AWS SAM also deploys the Lambda function. It uses Python 3.8 and accepts two parameters:
Hostname: Amazon EC2 Windows instance name, or, if we must configure alarms for multiple servers, then you can use a wild card character, such as Instance_name* or Instance_name?
sns_topic_name: ARN of the SNS topic that is used to configure CloudWatch Alarms. Notification is sent to the SNS topic when the Amazon EBS Volume metric crosses the threshold.
Invoking Lambda function
After the SAM deployment is successful, we can invoke the Lambda function with the instance name and the SNS Topic ARN. The Lambda function creates two alarms (Warning and Critical) for every Amazon EBS volume attached to the instance. The Warning and Critical values can be changed in the Lambda code so that there are two different values depending on the size of the disk drive. Furthermore, the alarms are configured to send notifications to the SNS Topic. The following is the sample command to invoke the Lambda function:
Verify the CloudWatch Alarms that are created in the CloudWatch console. The following screenshot shows the CloudWatch alarms created for an EC2 instance with four disks. There are two alarms (Warning and Critical) created for every disk (four disks in total). Therefore, we see eight CloudWatch alarms.
Checking CloudWatch Logs:
After running the Lambda function, to verify the log, go to Lambda Service page, select the Lambda function created, navigate to the Monitor tab, and then select “View logs in CloudWatch”. Then, go to the latest log file to check the CloudWatch log files for any errors.
Select the latest Log Steam to check the details of the last Lambda function execution.
The log file shows the full details of the Lambda function execution. Furthermore, it shows the CloudWatch alarms configured for each disk, as well as if there are any errors generated during execution.
Cleanup
To clean up the resources used in this post, complete the following steps:
Delete the CloudFormation stack by running below command and replacing STACK_NAME with stack name provided in step 3a above, under section “AWS SAM”
sam delete --stack-name STACK_NAME
Confirm the stack has been deleted by running below command. Replace STACK_NAME as mentioned in previous step.
In this post, we demonstrated how the requirement of monitoring Amazon EC2 Windows EBS Volumes usage is critical. In particular, this is essential when customers have a large fleet of Amazon EC2 Windows servers running to host their databases and applications in the cloud. We showcased the process of automating the free disk monitoring using Lambda and notifying through Amazon SNS when disks cross the storage threshold. By implementing such monitoring, customers can prevent issues with EC2 instances running out of disk space thus preventing critical production outages.
Provide any thoughts or questions in the comments section. We also encourage you to explore CloudWatch monitoring and try out additional use cases mentioned in the documentation.
In this post, we will show you how to deploy a solution into your Amazon Web Services (AWS) account that enables you to simply attach manual evidence to controls using AWS Audit Manager. Making evidence-collection as seamless as possible minimizes audit fatigue and helps you maintain a strong compliance posture.
As an AWS customer, you can use APIs to deliver high quality software at a rapid pace. If you have compliance-focused teams that rely on manual, ticket-based processes, you might find it difficult to document audit changes as those changes increase in velocity and volume.
As your organization works to meet audit and regulatory obligations, you can save time by incorporating audit compliance processes into a DevOps model. You can use modern services like Audit Manager to make this easier. Audit Manager automates evidence collection and generates reports, which helps reduce manual auditing efforts and enables you to scale your cloud auditing capabilities along with your business.
AWS Audit Manager uses services such as AWS Security Hub, AWS Config, and AWS CloudTrail to automatically collect and organize evidence, such as resource configuration snapshots, user activity, and compliance check results. However, for controls represented in your software or processes without an AWS service-specific metric to gather, you need to manually create and provide documentation as evidence to demonstrate that you have established organizational processes to maintain compliance. The solution in this blog post streamlines these types of activities.
Solution architecture
This solution creates an HTTPS API endpoint, which allows integration with other software development lifecycle (SDLC) solutions, IT service management (ITSM) products, and clinical trial management systems (CTMS) solutions that capture trial process change amendment documentation (in the case of pharmaceutical companies who use AWS to build robust pharmacovigilance solutions). The endpoint can also be a backend microservice to an application that allows contract research organizations (CRO) investigators to add their compliance supporting documentation.
In this solution’s current form, you can submit an evidence file payload along with the assessment and control details to the API and this solution will tie all the information together for the audit report. This post and solution is directed towards engineering teams who are looking for a way to accelerate evidence collection. To maximize the effectiveness of this solution, your engineering team will also need to collaborate with cross-functional groups, such as audit and business stakeholders, to design a process and service that constructs and sends the message(s) to the API and to scale out usage across the organization.
To download the code for this solution, and the configuration that enables you to set up auto-ingestion of manual evidence, see the aws-audit-manager-manual-evidence-automation GitHub repository.
Architecture overview
In this solution, you use AWS Serverless Application Model (AWS SAM) templates to build the solution and deploy to your AWS account. See Figure 1 for an illustration of the high-level architecture.
Figure 1. The architecture of the AWS Audit Manager automation solution
The SAM template creates resources that support the following workflow:
A client can call an Amazon API Gateway endpoint by sending a payload that includes assessment details and the evidence payload.
An AWS Lambda function implements the API to handle the request.
Within the Step Functions workflow, a Standard Workflow calls two Lambda functions. The first looks for a matching control within an assessment, and the second updates the control within the assessment with the evidence.
Code for the application’s Lambda implementation of the Step Functions workflow. It also includes a Step Functions definition file.
template.yml
A template that defines the application’s AWS resources.
Resources for this project are defined in the template.yml file. You can update the template to add AWS resources through the same deployment process that updates your application code.
The AWS SAM CLI is an extension of the AWS CLI that adds functionality for building and testing Lambda applications. The AWS SAM CLI uses Docker to run your functions in an Amazon Linux environment that matches Lambda. It can also emulate your application’s build environment and API.
To use the AWS SAM CLI, you need the following tools:
Open your terminal and use the following command to create a folder to clone the project into, then navigate to that folder. Be sure to replace <FolderName> with your own value.
mkdir Desktop/<FolderName>&& cd $_
Clone the project into the folder you just created by using the following command.
Navigate into the newly created project folder by using the following command.
cd aws-audit-manager-manual-evidence-automation
In the AWS SAM shell, use the following command to build the source of your application.
sam build
In the AWS SAM shell, use the following command to package and deploy your application to AWS. Be sure to replace <DOC-EXAMPLE-BUCKET> with your own unique S3 bucket name.
sam deploy –guided –parameter-overrides paramBucketName=<DOC-EXAMPLE-BUCKET>
When prompted, enter the AWS Region where AWS Audit Manager was configured. For the rest of the prompts, leave the default values.
To activate the IAM authentication feature for API gateway, override the default value by using the following command.
paramUseIAMwithGateway=AWS_IAM
To test the deployed solution
After you deploy the solution, run an invocation like the one below for an assessment (using curl). Be sure to replace <YOURAPIENDPOINT> and <AWS REGION> with your own values.
Check to see that your file is correctly attached to the control for your assessment.
Form-data interface parameters
The API implements a form-data interface that expects four parameters:
AssessmentName: The name for the assessment in Audit Manager. In this example, the AssessmentName is GxP21cfr11.
ControlSetName: The display name for a control set within an assessment. In this example, the ControlSetName is General requirements.
ControlIdName: this is a particular control within a control set. In this example, the ControlIdName is 11.100(a).
Payload: this is the file representing evidence to be uploaded.
As a refresher of Audit Manager concepts, evidence is collected for a particular control. Controls are grouped into control sets. Control sets can be grouped into a particular framework. The assessment is considered an implementation, or an instance, of the framework. For more information, see AWS Audit Manager concepts and terminology.
To clean up the deployed solution
To clean up the solution, use the following commands to delete the AWS CloudFormation stack and your S3 bucket. Be sure to replace <YourStackId> and <DOC-EXAMPLE-BUCKET> with your own values.
This solution provides a way to allow for better coordination between your software delivery organization and compliance professionals. This allows your organization to continuously deliver new updates without overwhelming your security professionals with manual audit review tasks.
Next steps
There are various ways to extend this solution.
Update the API Lambda implementation to be a webhook for your favorite software development lifecycle (SDLC) or IT service management (ITSM) solution.
Modify the steps within the Step Functions state machine to more closely match your unique compliance processes.
Use AWS CodePipeline to start Step Functions state machines natively, or integrate a variation of this solution with any continuous compliance workflow that you have.
Email is one of the most popular channels consumers use to interact with support organizations. In its most basic form, consumers will send their email to a catch-all email address where it is further dispatched to the correct support group. Often, this requires a person to inspect content manually. Some IT organizations even have a dedicated support group that handles triaging the incoming emails before assigning them to specialized support teams. Triaging each email can be challenging, and delays in email routing and support processes can reduce customer satisfaction. By utilizing Amazon Simple Email Service’s deep integration with Amazon S3, AWS Lambda, and other AWS services, the task of categorizing and routing emails is automated. This automation results in increased operational efficiencies and reduced costs.
This blog post shows you how a serverless application will receive emails with Amazon SES and deliver them to an Amazon S3 bucket. The application uses Amazon Comprehend to identify the dominant language from the message body. It then looks it up in an Amazon DynamoDB table to find the support group’s email address specializing in the email subject. As the last step, it forwards the email via Amazon SES to its destination. Archiving incoming emails to Amazon S3 also enables further processing or auditing.
Architecture
By completing the steps in this post, you will create a system that uses the architecture illustrated in the following image:
The flow of events starts when a customer sends an email to the generic support email address like [email protected]. This email is listened to by Amazon SES via a recipient rule. As per the rule, incoming messages are written to a specified Amazon S3 bucket with a given prefix.
This bucket and prefix are configured with S3 Events to trigger a Lambda function on object creation events. The Lambda function reads the email object, parses the contents, and sends them to Amazon Comprehend for language detection.
Amazon DynamoDB looks up the detected language code from an Amazon DynamoDB table, which includes the mappings between language codes and support group email addresses for these languages. One support group could answer English emails, while another support group answers French emails. The Lambda function determines the destination address and re-sends the same email address by performing an email forward operation. Suppose the lookup does not return any destination address, or the language was not be detected. In that case, the email is forwarded to a catch-all email address specified during the application deployment.
In this example, Amazon SES hosts the destination email addresses used for forwarding, but this is not a requirement. External email servers will also receive the forwarded emails.
Prerequisites
To use Amazon SES for receiving email messages, you need to verify a domain that you own. Refer to the documentation to verify your domain with Amazon SES console. If you do not have a domain name, you will register one from Amazon Route 53.
You will use AWS SAM to deploy the remaining parts of this serverless architecture.
The AWS SAM template creates the following resources:
An Amazon DynamoDB mapping table (language-lookup) contains information about language codes and associates them with destination email addresses.
An AWS Lambda function (BlogEmailForwarder) that reads the email content parses it, detects the language, looks up the forwarding destination email address, and sends it.
An Amazon S3 bucket, which will store the incoming emails.
IAM roles and policies.
To start the AWS SAM deployment, navigate to the root directory of the repository you downloaded and where the template.yaml AWS SAM template resides. AWS SAM also requires you to specify an Amazon Simple Storage Service (Amazon S3) bucket to hold the deployment artifacts. If you haven’t already created a bucket for this purpose, create one now. You will refer to the documentation to learn how to create an Amazon S3 bucket. The bucket should have read and write access by an AWS Identity and Access Management (IAM) user.
At the command line, enter the following command to package the application:
sam package --template template.yaml --output-template-file output_template.yaml --s3-bucket BUCKET_NAME_HERE
In the preceding command, replace BUCKET_NAME_HERE with the name of the Amazon S3 bucket that should hold the deployment artifacts.
AWS SAM packages the application and copies it into this Amazon S3 bucket.
When the AWS SAM package command finishes running, enter the following command to deploy the package:
In the preceding command, change the YOUR_DOMAIN_NAME_HERE with the domain name you validated with Amazon SES. This domain also applies to other commands and configurations that will be introduced later.
This example uses “blogstack” as the stack name, you will change this to any other name you want. When you run this command, AWS SAM shows the progress of the deployment.
Configure the Sample Application
Now that you have deployed the application, you will configure it.
Configuring Receipt Rules
To deliver incoming messages to Amazon S3 bucket, you need to create a Rule Set and a Receipt rule under it.
Navigate to the Amazon SES console. From the left navigation choose Rule Sets.
Choose Create a Receipt Rule button at the right pane.
Add info@YOUR_DOMAIN_NAME_HERE as the first recipient addresses by entering it into the text box and choosing Add Recipient.
Choose the Next Step button to move on to the next step.
On the Actions page, select S3 from the Add action drop-down to reveal S3 action’s details. Select the S3 bucket that was created by the AWS SAM template. It is in the format of your_stack_name-inboxbucket-randomstring. You will find the exact name in the outputs section of the AWS SAM deployment under the key name InboxBucket or by visiting the AWS CloudFormation console. Set the Object key prefix to info/. This tells Amazon SES to add this prefix to all messages destined to this recipient address. This way, you will re-use the same bucket for different recipients.
Choose the Next Step button to move on to the next step.
In the Rule Details page, give this rule a name at the Rule name field. This example uses the name info-recipient-rule. Leave the rest of the fields with their default values.
Choose the Next Step button to move on to the next step.
Review your settings on the Review page and finalize rule creation by choosing Create Rule
In this example, you will be hosting the destination email addresses in Amazon SES rather than forwarding the messages to an external email server. This way, you will be able to see the forwarded messages in your Amazon S3 bucket under different prefixes. To host the destination email addresses, you need to create different rules under the default rule set. Create three additional rules for catchall@YOUR_DOMAIN_NAME_HERE , english@ YOUR_DOMAIN_NAME_HERE and french@YOUR_DOMAIN_NAME_HERE email addresses by repeating the steps 2 to 5. For Amazon S3 prefixes, use catchall/, english/, and french/ respectively.
Configuring Amazon DynamoDB Table
To configure the Amazon DynamoDB table that is used by the sample application
Navigate to Amazon DynamoDB console and reach the tables view. Inspect the table created by the AWS SAM application.
language-lookup table is the table where languages and their support group mappings are kept. You need to create an item for each language, and an item that will hold the default destination email address that will be used in case no language match is found. Amazon Comprehend supports more than 60 different languages. You will visit the documentation for the supported languages and add their language codes to this lookup table to enhance this application.
To start inserting items, choose the language-lookup table to open table overview page.
Select the Items tab and choose the Create item From the dropdown, select Text. Add the following JSON content and choose Save to create your first mapping object. While adding the following object, replace Destination attribute’s value with an email address you own. The email messages will be forwarded to that address.
{
“language”: “en”,
“destination”: “english@YOUR_DOMAIN_NAME_HERE”
}
Lastly, create an item for French language support.
{
“language”: “fr”,
“destination”: “french@YOUR_DOMAIN_NAME_HERE”
}
Testing
Now that the application is deployed and configured, you will test it.
Use your favorite email client to send the following email to the domain name info@ email address.
Subject: I need help
Body:
Hello, I’d like to return the shoes I bought from your online store. How can I do this?
After the email is sent, navigate to the Amazon S3 console to inspect the contents of the Amazon S3 bucket that is backing the Amazon SES Rule Sets. You will also see the AWS Lambda logs from the Amazon CloudWatch console to confirm that the Lambda function is triggered and run successfully. You should receive an email with the same content at the address you defined for the English language.
Next, send another email with the same content, this time in French language.
Subject: j’ai besoin d’aide
Body:
Bonjour, je souhaite retourner les chaussures que j’ai achetées dans votre boutique en ligne. Comment puis-je faire ceci?
Suppose a message is not matched to a language in the lookup table. In that case, the Lambda function will forward it to the catchall email address that you provided during the AWS SAM deployment.
You will inspect the new email objects under english/, french/ and catchall/ prefixes to observe the forwarding behavior.
Continue experimenting with the sample application by sending different email contents to info@ YOUR_DOMAIN_NAME_HERE address or adding other language codes and email address combinations into the mapping table. You will find the available languages and their codes in the documentation. When adding a new language support, don’t forget to associate a new email address and Amazon S3 bucket prefix by defining a new rule.
Cleanup
To clean up the resources you used in your account,
Navigate to the Amazon S3 console and delete the inbox bucket’s contents. You will find the name of this bucket in the outputs section of the AWS SAM deployment under the key name InboxBucket or by visiting the AWS CloudFormation console.
After the stack is deleted, remove the domain from Amazon SES. To do this, navigate to the Amazon SES Console and choose Domains from the left navigation. Select the domain you want to remove and choose Remove button to remove it from Amazon SES.
From the Amazon SES Console, navigate to the Rule Sets from the left navigation. On the Active Rule Set section, choose View Active Rule Set button and delete all the rules you have created, by selecting the rule and choosing Action, Delete.
On the Rule Sets page choose Disable Active Rule Set button to disable listening for incoming email messages.
On the Rule Sets page, Inactive Rule Sets section, delete the only rule set, by selecting the rule set and choosing Action, Delete.
Navigate to CloudWatch console and from the left navigation choose Logs, Log groups. Find the log group that belongs to the BlogEmailForwarderFunction resource and delete it by selecting it and choosing Actions, Delete log group(s).
You will also delete the Amazon S3 bucket you used for packaging and deploying the AWS SAM application.
Conclusion
This solution shows how to use Amazon SES to classify email messages by the dominant content language and forward them to respective support groups. You will use the same techniques to implement similar scenarios. You will forward emails based on custom key entities, like product codes, or you will remove PII information from emails before forwarding with Amazon Comprehend.
With its native integrations with AWS services, Amazon SES allows you to enhance your email applications with different AWS Cloud capabilities easily.
To learn more about email forwarding with Amazon SES, you will visit documentation and AWS blogs.
This post is written by Hari Ohm Prasath Rajagopal, Senior Modernization Architect and Vamsi Vikash Ankam, Technical Account Manager
In this post, I show how to build a flexible in-memory AWS Lambda caching layer using Lambda extensions. Lambda functions use REST API calls to access the data and configuration from the cache. This can reduce latency and cost when consuming data from AWS services such as Amazon DynamoDB, AWS Systems Manager Parameter Store, and AWS Secrets Manager.
Applications making frequent API calls to retrieve static data can benefit from a caching layer. This can reduce the function’s latency, particularly for synchronous requests, as the data is retrieved from the cache instead of an external service. The cache can also reduce costs by reducing the number of calls to downstream services.
There are two types of cache to consider in this situation:
Configuration cache for caching data from a configuration management system such as Parameter Store, AWS AppConfig, or AWS Secrets Manager.
Lambda extensions are a new way for tools to integrate more easily into the Lambda execution environment and control and participate in Lambda’s lifecycle. They use the Extensions API, a new HTTP interface, to register for lifecycle events during function initialization, invocation, and shutdown.
They can also use environment variables to add options and tools to the runtime, or use wrapper scripts to customize the runtime startup behavior. The Lambda cache uses Lambda extensions to run as a separate process.
git clone https://github.com/aws-samples/aws-lambda-extensions
cd aws-lambda-extensions/cache-extension-demo/
If you are not running in a Linux environment, ensure that your build architecture matches the Lambda execution environment by compiling with GOOS=linux and GOARCH=amd64.
GOOS=linux GOARCH=amd64
Build the Go binary extension with the following command:
go build -o bin/extensions/cache-extension-demo main.go
Ensure that the extensions files are executable:
chmod +x bin/extensions/cache-extension-demo
Update the parameters region value in ../example-function/config.yaml with the Region where you are deploying the function.
parameters:
  - region: us-west-2
Build the function dependencies.
cd SAM
sam build
AWS SAM build
Deploy the AWS resources specified in the template.yml file:
sam deploy --guided
During the prompts:
Enter a stack name cache-extension-demo.
Enter the same AWS Region specified previously.
Accept the default DatabaseName. You can specify a custom database name, and also update the ../example-function/config.yaml and index.js files with the new database name.
Enter MySecret as the Secrets Manager secret.
Accept the defaults for the remaining questions.
AWS SAM Deploy
AWS SAM deploys:
A DynamoDB table.
The Lambda function ExtensionsCache-DatabaseEntry, which puts a sample item into the DynamoDB table.
An AWS Systems Manager Parameter Store parameter called CacheExtensions_Parameter1 with a value of MyParameter.
An AWS Secrets Manager secret called secret_info with a value of MySecret.
A Lambda layer called Cache_Extension_Layer.
A Lambda function using Nodejs.12 called ExtensionsCache-SampleFunction. This reads the cached values via the extension from either the DynamoDB table, Parameter Store, or Secrets Manager.
IAM permissions
The cache extension is delivered as a Lambda layer and added to ExtensionsCache-SampleFunction.
It is written as a self-contained binary in Golang, which makes the extension compatible with all of the supported runtimes. The extension caches the data from DynamoDB, Parameter Store, and Secrets Manager, and then runs a local HTTP endpoint to service the data. The Lambda function retrieves the configuration data from the cache using a local HTTP REST API call.
Here is the architecture diagram.
Extensions cache architecture diagram
Once deployed, the extension performs the following steps:
On start-up, the extension reads the config.yaml file, which determines which resources to cache. The file is deployed as part of the Lambda function.
The boolean CACHE_EXTENSION_INIT_STARTUP Lambda environment variable specifies whether to load into cache the items specified in config.yaml. If false, the extension initializes an empty map with the names.
The extension retrieves the required data based on the resources in the config.yaml file. This includes the data from DynamoDB, the configuration from Parameter Store, and the secret from Secrets Manager. The data is stored in memory.
The extension starts a local HTTP server using TCP port 4000, which serves the cache items to the function. The Lambda function accesses the local in-memory cache by invoking the following endpoint: http://localhost:4000/<cachetype>?name=<name>.
If the data is not available in the cache, or has expired, the extension accesses the corresponding AWS service to retrieve the data. It is cached first and then returned to the Lambda function. The CACHE_EXTENSION_TTL Lambda environment variable defines the refresh interval (defined based on Go time format, for example: 30s, 3m, etc.)
This sequence diagram explains the data flow:
Extensions cache sequence diagram
Testing the example application
Once the AWS SAM template is deployed, navigate to the AWS Lambda console.
Select the function starting with the name ExtensionsCache-SampleFunction. Within the function code, the options array specifies which data to return from the cache. This is initially set to path: '/dynamodb?name=DynamoDbTable-pKey1-sKey1'
Choose Configure test events to configure a test event.
Enter a name for the Event name, accept the default payload, and select Create.
Select Test to invoke the function. This returns the cached data from DynamoDB and logs the output.
Successfully retrieve DynamoDB data from cache
In the index.js file, amend the path statement to retrieve the Parameter Store configuration:
Select Deploy to save the function configuration and select Test. The function returns the secret:
Successfully retrieve Secrets Manager data from cache
The benefits of using Lambda extensions
There are a number of benefits to using a Lambda extension for this solution:
Improved Lambda function performance as data is cached in memory by the extension during initialization.
Fewer AWS API calls to external services, this can reduce costs and helps avoid throttling limits if services are accessed frequently.
Cache data is stored in memory and not in a file within the Lambda execution environment. This means that no additional process is required to manage the lifecycle of the file. In-memory is also more secure, as data is not persisted to disk for subsequent function invocations.
The function requires less code, as it only needs to communicate with the extension via HTTP to retrieve the data. The function does not have to have additional libraries installed to communicate with DynamoDB, Parameter Store, Secrets Manager, or the local file system.
The cache extension is a Golang compiled binary and the executable can be shared with functions running other runtimes like Node.js, Python, Java, etc.
Using a YAML template to store the details of what to cache makes it easier to configure and add additional services.
Comparing the performance benefit
To test the performance of the cache extension, I compare two tests:
A Golang Lambda function that accesses a secret from AWS Secrets Manager for every invocation.
The ExtensionsCache-SampleFunction, previously deployed using AWS SAM. This uses the cache extension to access the secrets from Secrets Manager, the function reads the value from the cache.
Both functions are configured with 512 MB of memory and the function timeout is set to 30 seconds.
I use Artillery to load test both Lambda functions. The load runs for 100 invocations over 2 minutes. I use Amazon CloudWatch metrics to view the function average durations.
Test 1 shows a duration of 43 ms for the first invocation as a cold start. Subsequent invocations average 22 ms.
Test 1 performance results
Test 2 shows a duration of 16 ms for the first invocation as a cold start. Subsequent invocations average 3 ms.
Test 2 performance results
Using the Lambda extensions caching layer shows a significant performance improvement. Cold start invocation duration is reduced by 62% and subsequent invocations by 80%.
In this example, the CACHE_EXTENSION_INIT_STARTUP environment variable flag is not configured. With the flag enabled for the extension, data is pre-fetched during extension initialization and the cold start time is further reduced.
Conclusion
Using Lambda extensions is an effective way to cache static data from external services in Lambda functions. This reduces function latency and costs. This post shows how to build both a data and configuration cache using DynamoDB, Parameter Store, and Secrets Manager.
To set up the walkthrough demo in this post, visit the GitHub repo, and follow the instructions in the README.md file.
The extension uses a local configuration file to determine which values to cache, and retrieves the items from the external services. A Lambda function retrieves the values from the local cache using an HTTP request, without having to communicate with the external services directly. In this example, this results in an 80% reduction in function invocation time.
HHMI’s Janelia Research Campus in Ashburn, Virginia has an integrated team of lab scientists and tool-builders who pursue a small number of scientific questions with potential for transformative impact. To drive science forward, we share our methods, results, and tools with the scientific community.
Introduction
Our neuroscience research application involves image searches that are computationally intensive but have unpredictable and sporadic usage patterns. The conventional on-premises approach is to purchase a powerful and expensive workstation, install and configure specialized software, and download the entire dataset to local storage. With 16 cores, a typical search of 50,000 images takes 30 seconds. A serverless architecture using AWS Lambda allows us to do this job in seconds for a few cents per search, and is capable of scaling to larger datasets.
Parallel Computation in Neuroscience Research
Basic research in neuroscience is often conducted on fruit flies. This is because their brains are small enough to study in a meaningful way with current tools, but complex enough to produce sophisticated behaviors. Conducting such research nonetheless requires an immense amount of data and computational power. Janelia Research Campus developed the NeuronBridge tool on AWS to accelerate scientific discovery by scaling computation in the cloud.
Figure 1: A “mask image” (on the left) is compared to many different fly brains (on the right) to find matching neurons. (Janella Research Campus)
The fruit fly (Drosophila melanogaster) has about 100,000 neurons and its brain is highly stereotyped. This means that the brain of one fruit fly is similar to the next one. Using electron microscopy (EM), the FlyEM project has reconstructed a wiring diagram of a fruit fly brain. This connectome includes the structure of the neurons and the connectivity between them. But EM is only half of the picture. Once scientists know the structure and connectivity, they must perform experiments to find what purpose the neurons serve.
Flies can be genetically modified to reproducibly express a fluorescent protein in certain neurons, causing those neurons to glow under a light microscope (LM). By iterating through many modifications, the FlyLight project has created a vast genetic driver library. This allows scientists to target individual neurons for experiments. For example, blocking a particular neuron of a fly from functioning, and then observing its behavior, allows a scientist to understand the function of that neuron. Through the course of many such experiments, scientists are currently uncovering the function of entire neuronal circuits.
We developed NeuronBridge, a tool available for use by neuroscience researchers around the world, to bridge the gap between the EM and LM data. Scientists can start with EM structure and find matching fly lines in LM. Or they may start with a fly line and find the corresponding neuronal circuits in the EM connectome.
Both EM and LM produce petabytes of 3D images. Image processing and machine learning algorithms are then applied to discern neuron structure. We also developed a computational shortcut called color depth MIP to represent depth as color. This technique compresses large 3D image stacks into smaller 2D images that can be searched efficiently.
Image search is an embarrassingly parallel problem ideally suited to parallelization with simple functions. In a typical search, the scientist will create a “mask image,” which is a color depth image featuring only the neuron they want to find. The search algorithm must then compare this image to hundreds of thousands of other images. The paradigm of launching many short-lived cloud workers, termed burst-parallel compute, was originally suggested by a group at UCSD. To scale NeuronBridge, we decided to build a serverless AWS-native implementation of burst-parallel image search.
The Architecture
Our main reason for using a serverless approach was that our usage patterns are unpredictable and sporadic. The total number of researchers who are likely to use our tool is not large, and only a small fraction of them will need the tool at any given time. Furthermore, our tool could go unused for weeks at a time, only to get a flood of requests after a new dataset is published. A serverless architecture allows us to cope with this unpredictable load. We can keep costs low by only paying for the compute time we actually use.
One challenge of implementing a burst-parallel architecture is that each Lambda invocation requires a network call, with the ensuing network latency. Spawning several thousands of functions from a single manager function can take many seconds. The trick to minimizing this latency is to parallelize these calls by recursively spawning concurrent managers in a tree structure. Each leaf in this tree spawns a set of worker functions to do the work of searching the imagery. Each worker reads a small batch of images from Amazon Simple Storage Service (S3). They are then compared to the mask image, and the intermediate results are written to Amazon DynamoDB, a serverless NoSQL database.
Figure 2: Serverless architecture for burst-parallel search
Search state is monitored by an AWS Step Functions state machine, which checks DynamoDB once per second. When all the results are ready, the Step Functions state machine runs another Lambda function to combine and sort the results. The state machine addresses error conditions and timeouts, and updates the browser when the asynchronous search is complete. We opted to use AWS AppSync to notify a React web client, providing an interactive user experience while remaining entirely serverless.
As we scaled to 3,000 concurrent Lambda functions reading from our data bucket, we reached Amazon S3’s limit of 5,500 GETs per second per prefix. The fix was to create numbered prefix folders and then randomize our key list. Each worker could then search a random list of images across many prefixes. This change distributed the load from our highly parallel functions across a number of S3 shards, and allowed us to run with much higher parallelism.
We also addressed cold-start latency. Infrequently used Lambda functions take longer to start than recently used ones, and our unpredictable usage patterns meant that we were experiencing many cold starts. In our Java functions, we found that most of the cold-start time was attributed to JVM initialization and class loading. Although many mitigations for this exist, our worker logic was small enough that rewriting the code to use Node.js was the obvious choice. This immediately yielded a huge improvement, reducing cold starts from 8-10 seconds down to 200 ms.
With all of these insights, we developed a general-purpose parallel computation framework called burst-compute. This AWS-native framework runs as a serverless application to implement this architecture. It allows you to massively scale your own custom worker functions and combiner functions. We used this new framework to implement our image search.
Conclusion
The burst-parallel architecture is a powerful new computation paradigm for scientific computing. It takes advantage of the enormous scale and technical innovation of the AWS Cloud to provide near-interactive on-demand compute without expensive hardware maintenance costs. As scientific computing capability matures for the cloud, we expect this kind of large-scale parallel computation to continue becoming more accessible. In the future, the cloud could open doors to entirely new types of scientific applications, visualizations, and analysis tools.
We would like to express our thanks to AWS Solutions Architects Scott Glasser and Ray Chang, for their assistance with design and prototyping, and to Geoffrey Meissner for reviewing drafts of this write-up.
Source Code
All of the application code described in this article is open source and licensed for reuse:
Today, AWS is introducing Synchronous Express Workflows for AWS Step Functions. This is a new way to run Express Workflows to orchestrate AWS services at high-throughput.
Developers have been using asynchronous Express Workflows since December 2019 for workloads that require higher event rates and shorter durations. Customers were looking for ways to receive an immediate response from their Express Workflows without having to write additional code or introduce additional services.
What’s new?
Synchronous Express Workflows allow developers to quickly receive the workflow response without needing to poll additional services or build a custom solution. This is useful for high-volume microservice orchestration and fast compute tasks that communicate via HTTPS.
Choose Start execution. Here you have an option to run the Express Workflow as a synchronous or asynchronous type.
Choose Synchronous and choose Start execution.
Expand Details in the results message to view the output.
Monitoring, logging and tracing
Enable logging to inspect and debug Synchronous Express Workflows. All execution history is sent to CloudWatch Logs. Use the Monitoring and Logging tabs in the Step Functions console to gain visibility into Express Workflow executions.
The Monitoring tab shows six graphs with CloudWatch metrics for Execution Errors, Execution Succeeded, Execution Duration, Billed Duration, Billed Memory, and Executions Started. The Logging tab shows recent logs and the logging configuration, with a link to CloudWatch Logs.
Enable X-Ray tracing to view trace maps and timelines of the underlying components that make up a workflow. This helps to discover performance issues, detect permission problems, and track requests made to and from other AWS services.
Creating an example workflow
The following example uses Amazon API Gateway HTTP APIs to start an Express Workflow synchronously. The workflow analyses web form submissions for negative sentiment. It generates a case reference number and saves the data in an Amazon DynamoDB table. The workflow returns the case reference number and message sentiment score.
The API endpoint is generated by an API Gateway HTTP APIs. A POST request is made to the API which invokes the workflow. It contains the contact form’s message body.
$ git clone https://github.com/aws-samples/contact-form-processing-with-synchronous-express-workflows.git
$ cd contact-form-processing-with-synchronous-express-workflows
$ sam build
$ sam deploy -g
This deploys 12 resources, including a Synchronous Express Workflow, three Lambda functions, an API Gateway HTTP API endpoint, and all the AWS Identity & Access Management (IAM) roles and permissions required for the application to run.
Note the HTTP APIs endpoint and workflow ARN outputs.
aws stepfunctions start-sync-execution \
--state-machine-arn <your-workflow-arn> \
--input "{\"message\" : \"This is bad service\"}"
The response is received once the workflow completes. It contains the workflow output (sentiment and ticketid), the executionARN, and some execution metadata.
Starting the workflow from HTTP API Gateway:
The application deploys an API Gateway HTTP API, with a Step Functions integration. This is configured in the api.yaml file. It starts the state machine with the POST body provided as the input payload.
Trigger the workflow with a POST request, using the API HTTP API endpoint generated from the deploy step. Enter the following CURL command into the terminal:
curl --location --request POST '<YOUR-HTTP-API-ENDPOINT>' \
--header 'Content-Type: application/json' \
--data-raw '{"message":" This is bad service"}'
The POST request returns a 200 status response. The output field of the response contains the sentiment results (negative) and the generated ticketId (jc4t8i).
Putting it all together
You can use this application to power a web form backend to help expedite customer complaints. In the following example, a frontend application submits form data via an AJAX POST request. The application waits for the response, and presents the user with a message appropriate to the detected sentiment, and a case reference number.
If a negative sentiment is returned in the API response, the user is informed of their case number:
Setting IAM permissions
Before a user or service can start a Synchronous Express Workflow, it must be granted permission to perform the states:StartSyncExecution API operation. This is a new state-machine level permission. Existing Express Workflows can be run synchronously once the correct IAM permissions for StartSyncExecution are granted.
Step Functions Synchronous Express Workflows allow developers to receive a workflow response without having to poll additional services. This helps developers orchestrate microservices without needing to write additional code to handle errors, retries, and run parallel tasks. They can be invoked in response to events such as HTTP requests via API Gateway, from a parent state machine, or by calling the StartSyncExecution API action.
This feature is available in all Regions where AWS Step Functions is available. View the AWS Regions table to learn more.
For more serverless learning resources, visit Serverless Land.
The collective thoughts of the interwebz
Manage Consent
To provide the best experiences, we use technologies like cookies to store and/or access device information. Consenting to these technologies will allow us to process data such as browsing behavior or unique IDs on this site. Not consenting or withdrawing consent, may adversely affect certain features and functions.
Functional
Always active
The technical storage or access is strictly necessary for the legitimate purpose of enabling the use of a specific service explicitly requested by the subscriber or user, or for the sole purpose of carrying out the transmission of a communication over an electronic communications network.
Preferences
The technical storage or access is necessary for the legitimate purpose of storing preferences that are not requested by the subscriber or user.
Statistics
The technical storage or access that is used exclusively for statistical purposes.The technical storage or access that is used exclusively for anonymous statistical purposes. Without a subpoena, voluntary compliance on the part of your Internet Service Provider, or additional records from a third party, information stored or retrieved for this purpose alone cannot usually be used to identify you.
Marketing
The technical storage or access is required to create user profiles to send advertising, or to track the user on a website or across several websites for similar marketing purposes.


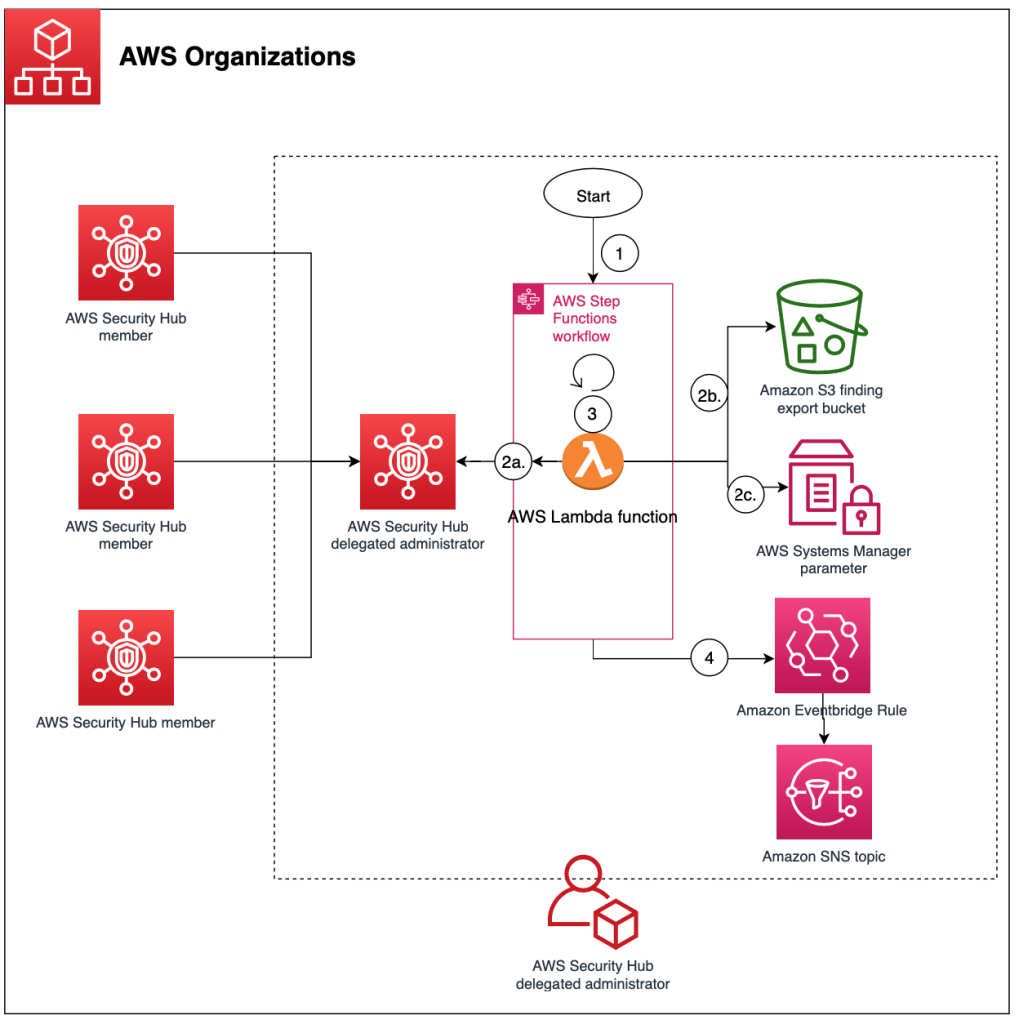


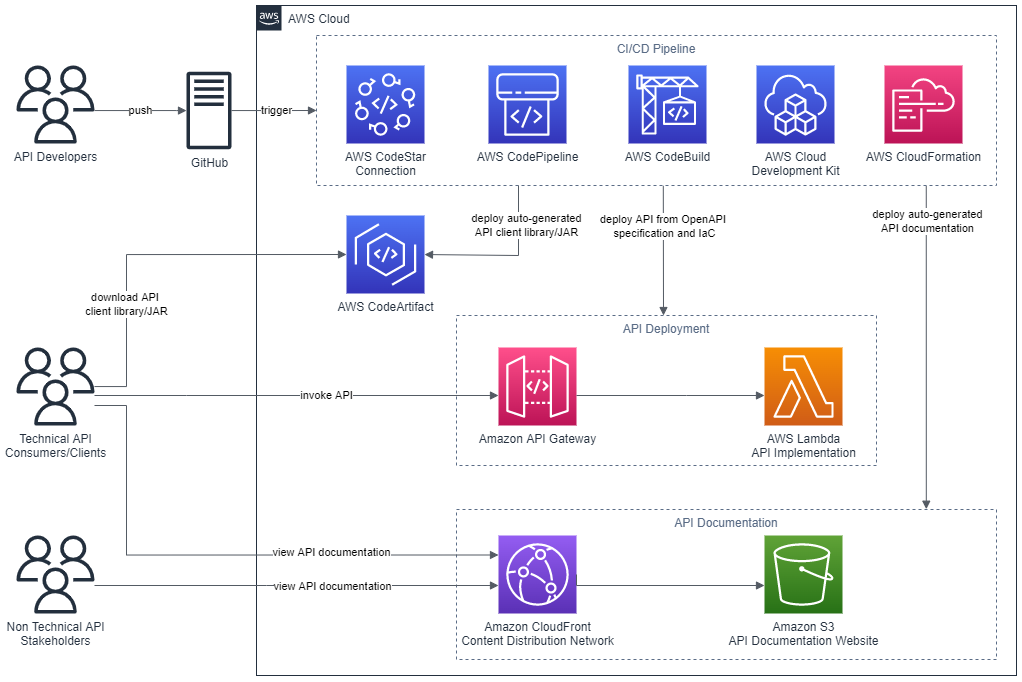
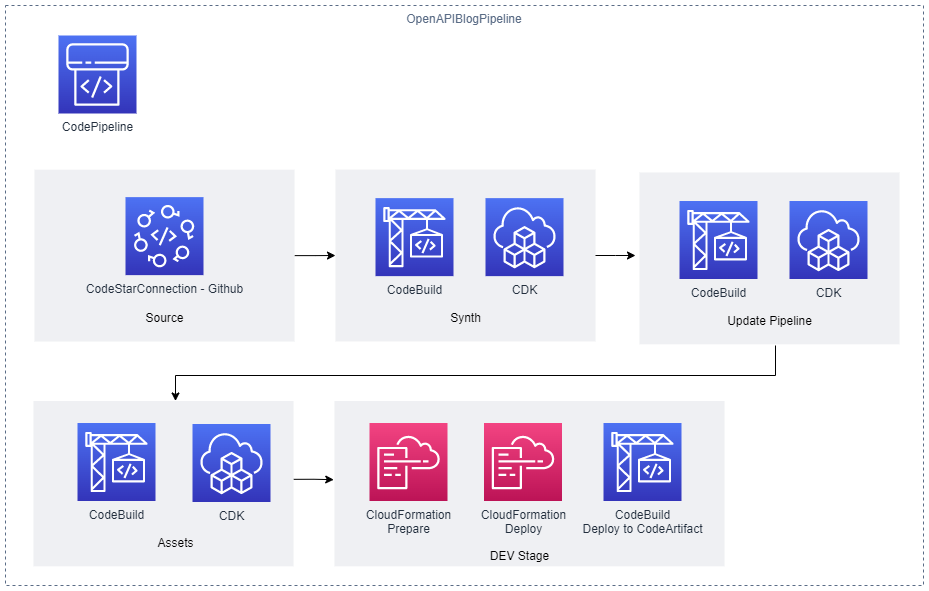
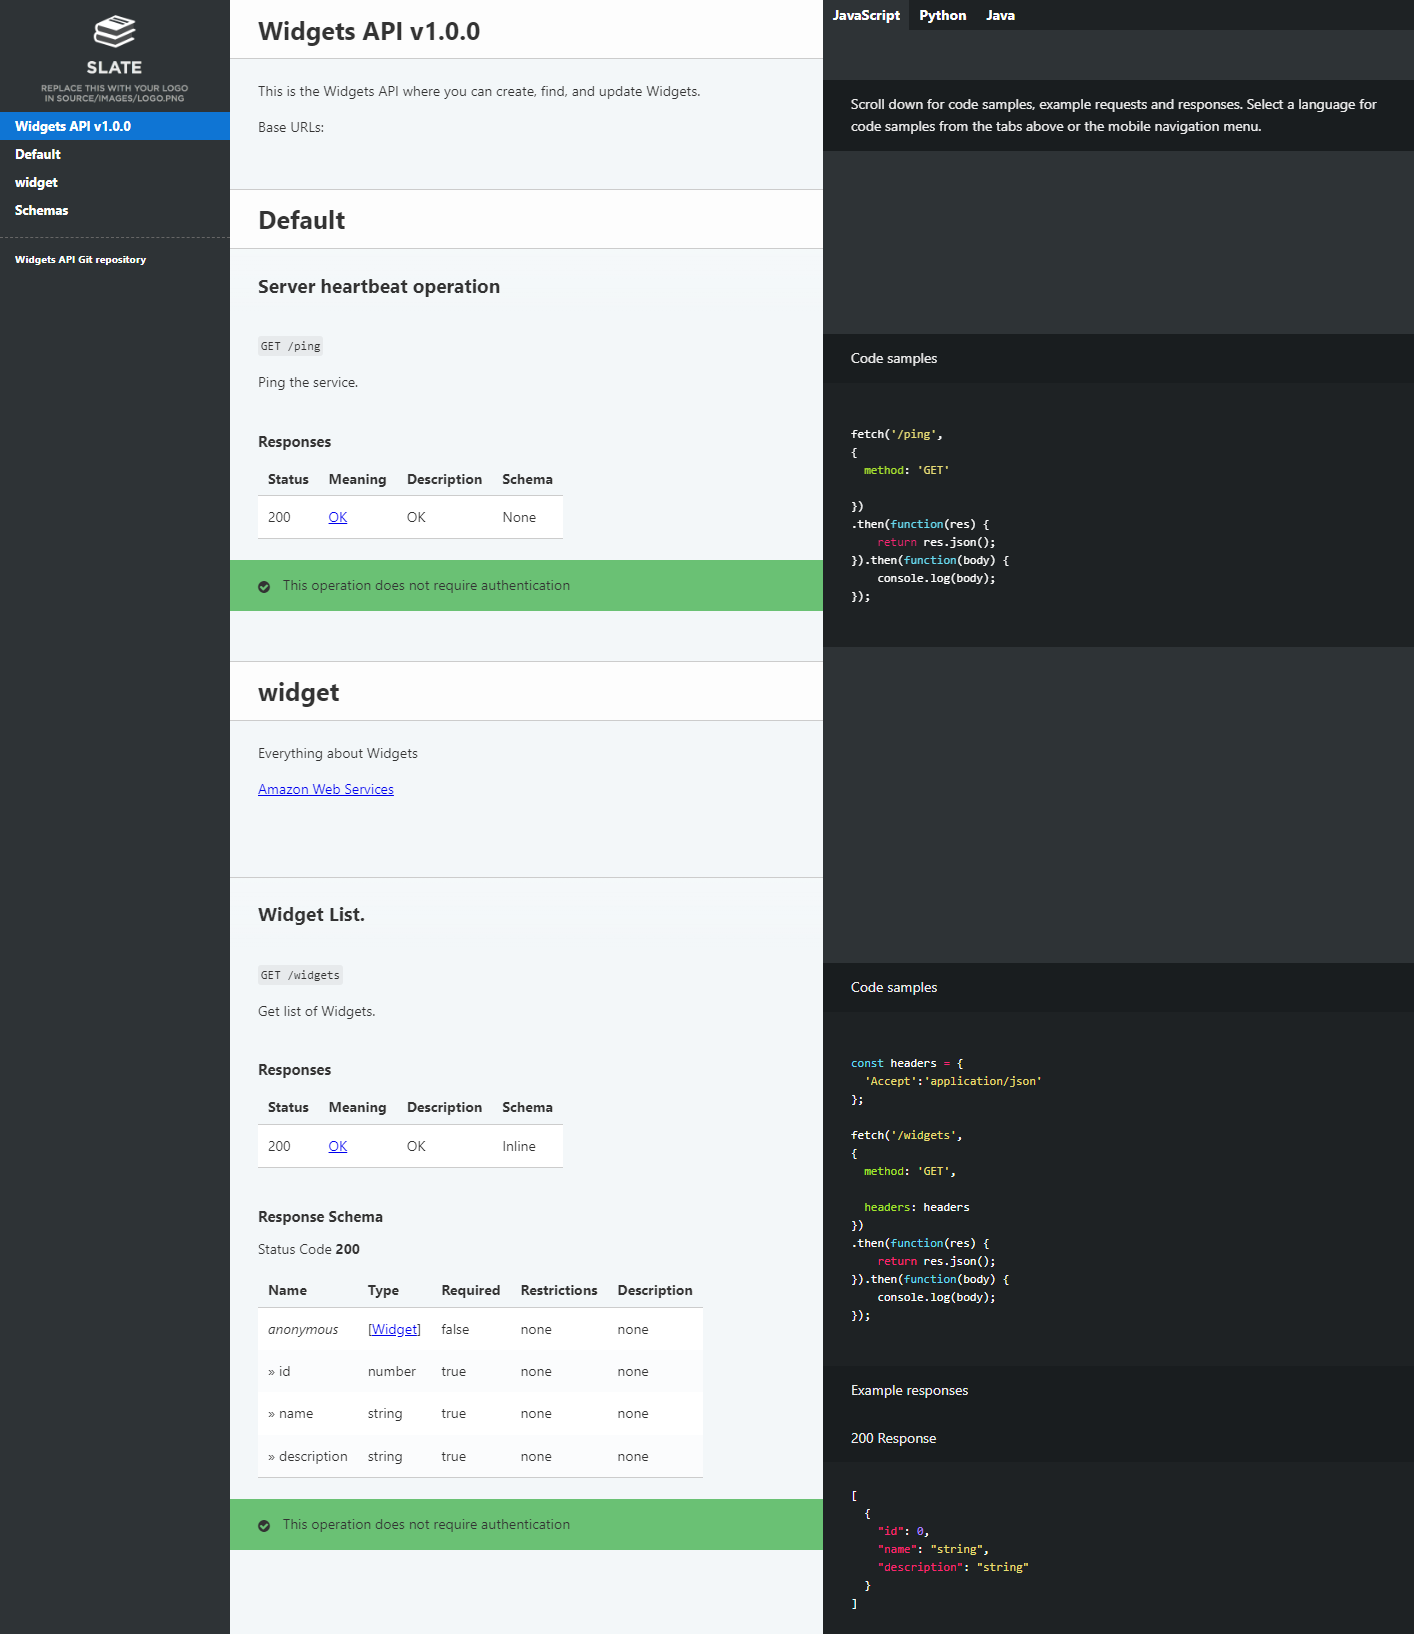
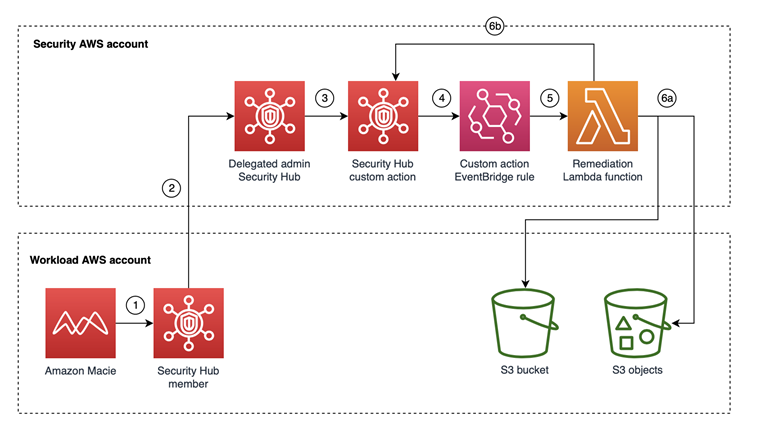


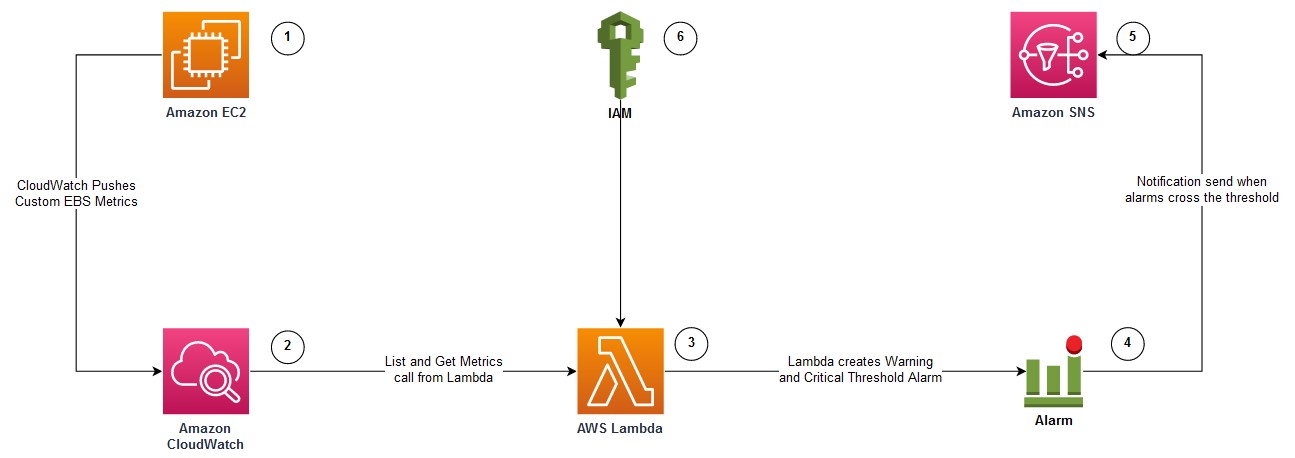
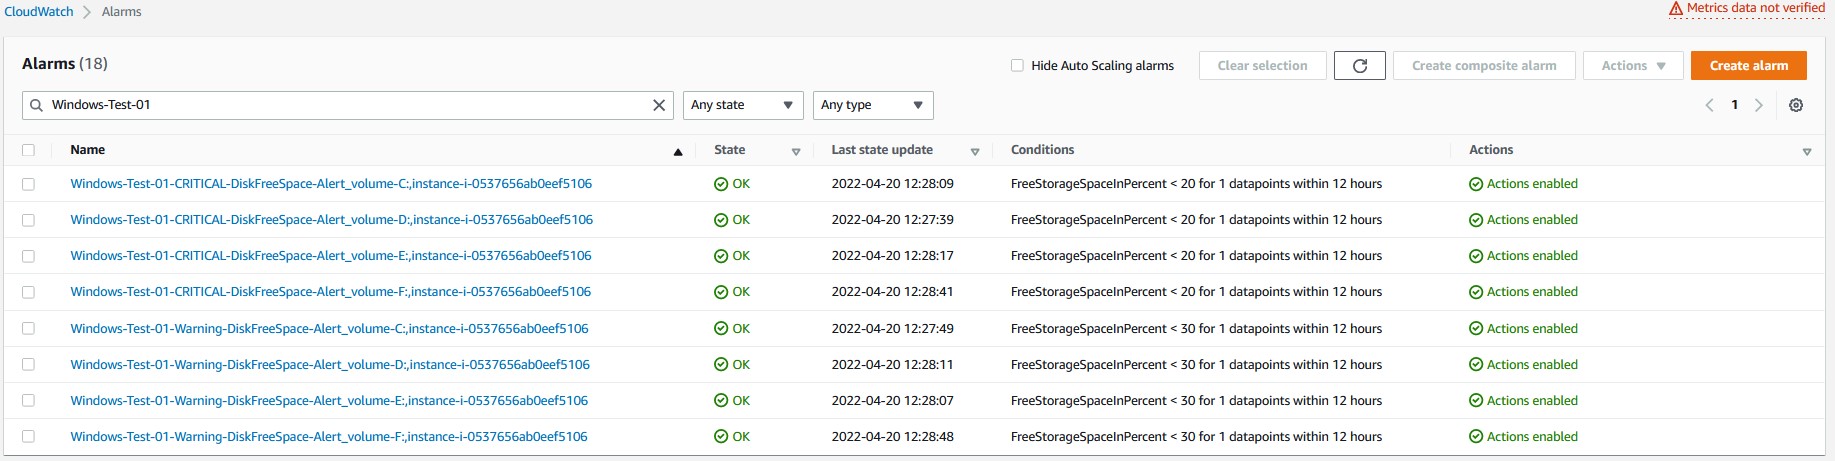


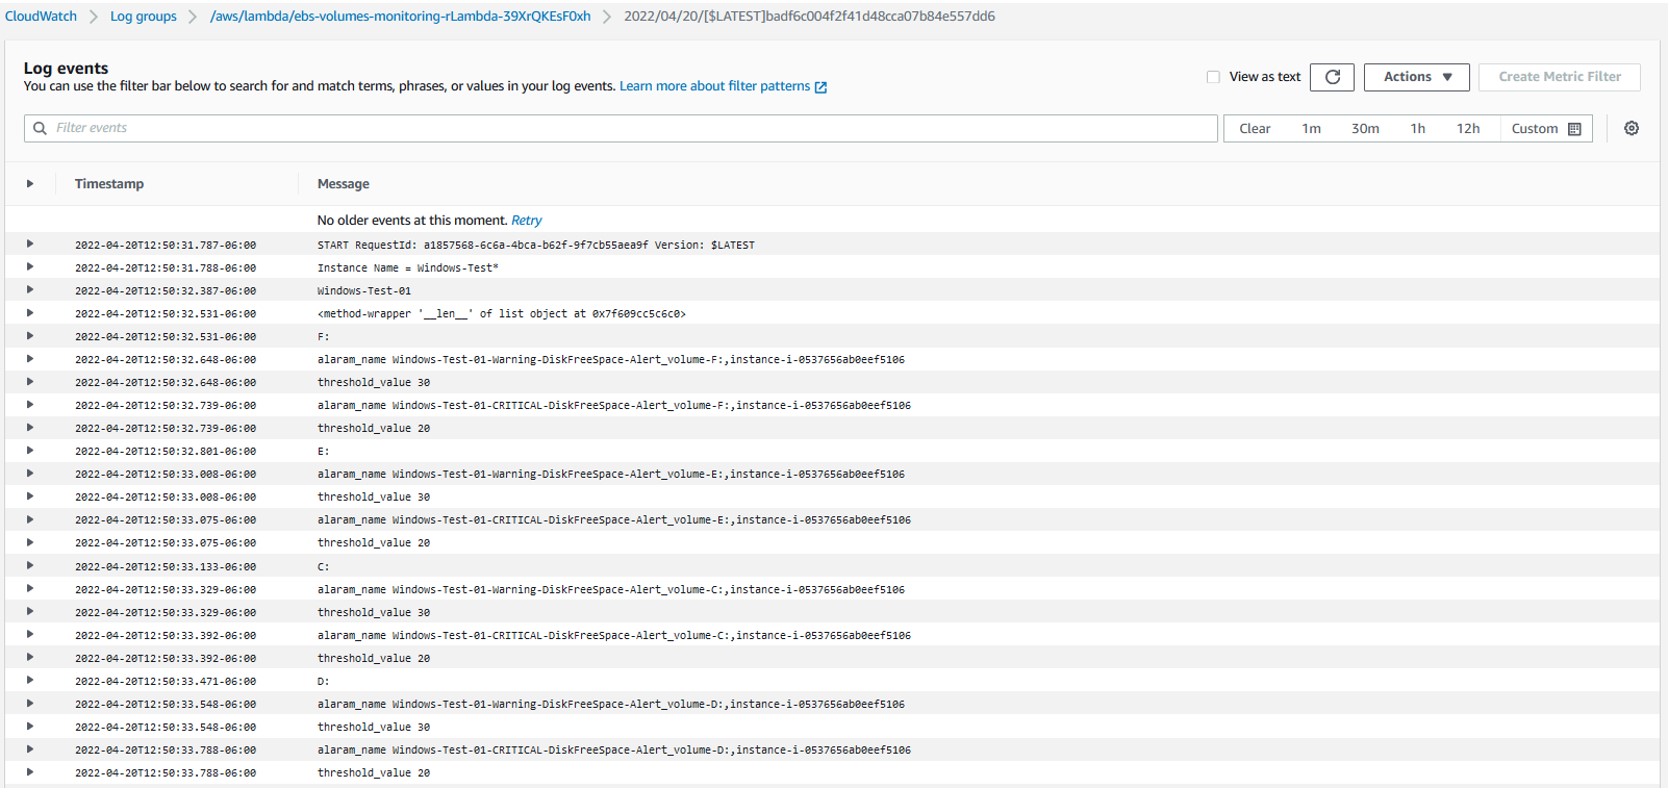


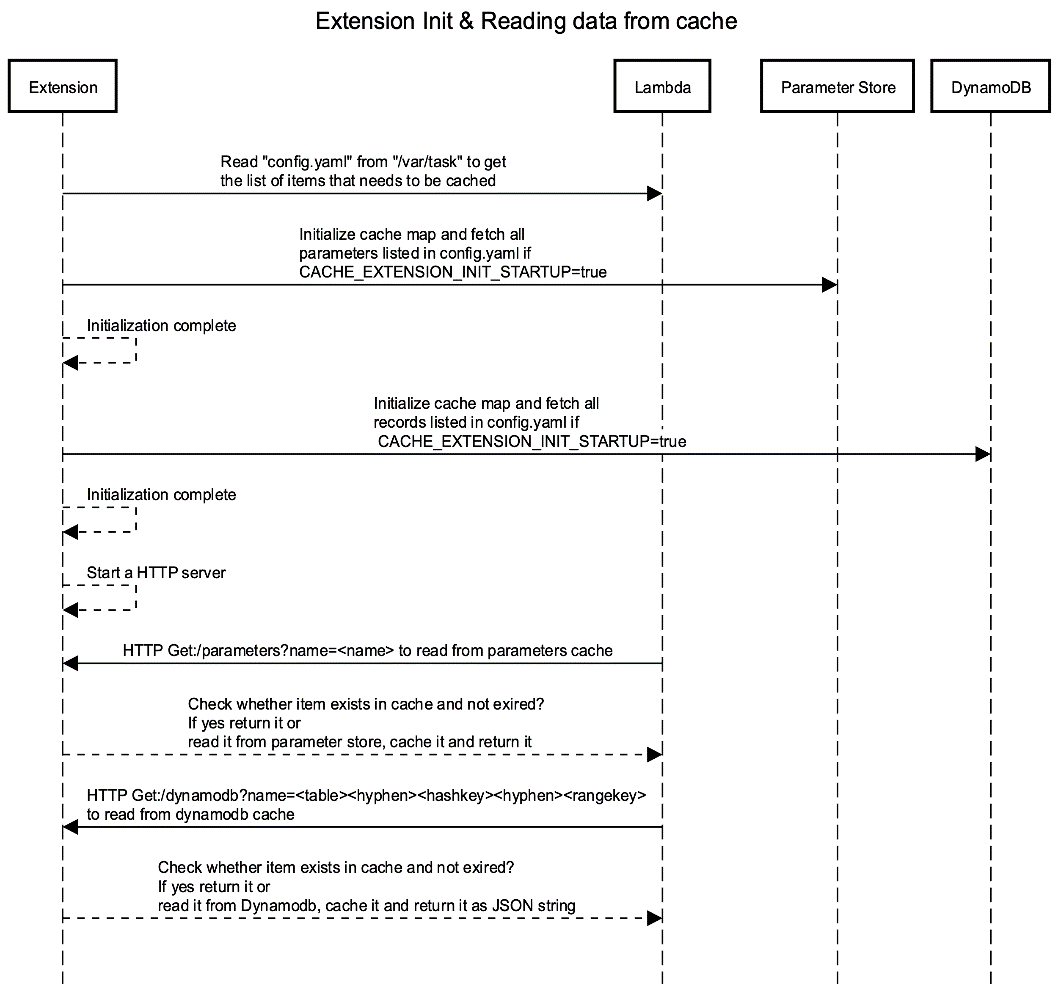

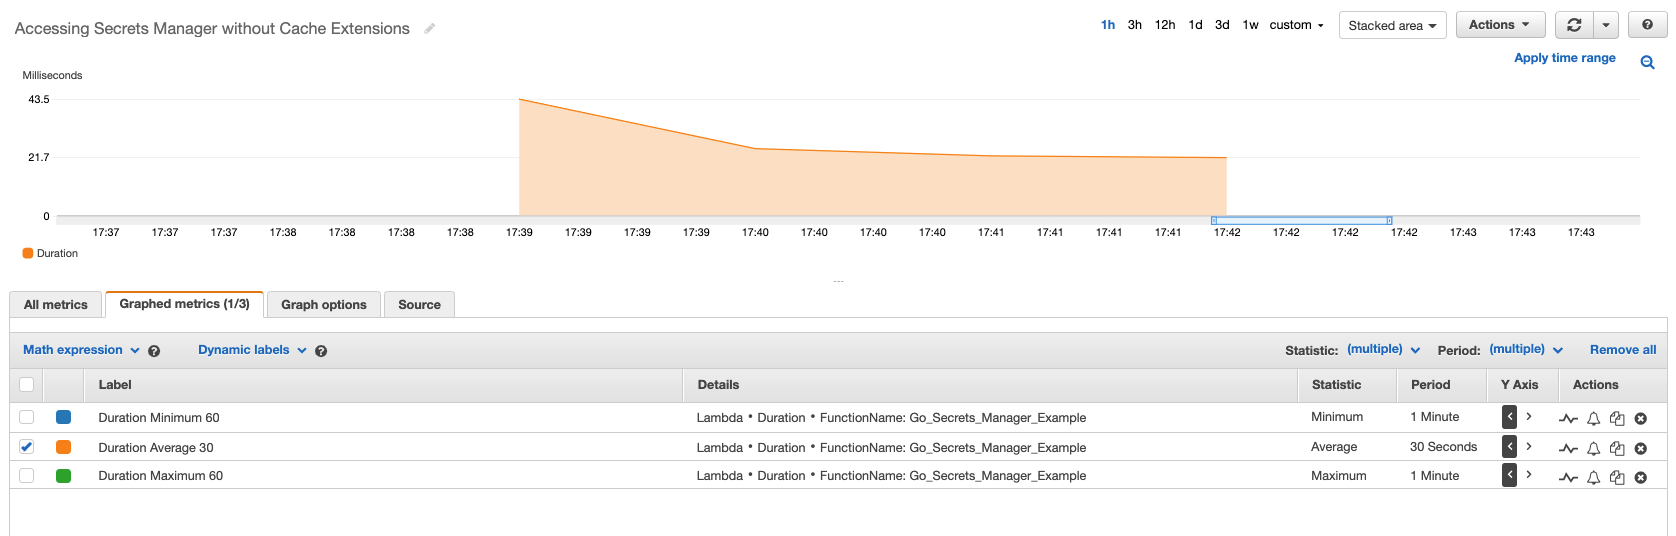


 This generates a sample workflow definition that you can change once the workflow is created.


