All posts by Nathan Liefting

Running Zabbix with MariaDB and Galera Active/Active Clustering

Post Syndicated from Nathan Liefting original https://blog.zabbix.com/running-zabbix-with-mariadb-and-galera-active-active-clustering/31104/

High availability on a platform like Zabbix is a hard requirement for many users. With native high availability on the Zabbix servers, proxies, and at the frontend through various solutions for web servers, all that’s left is at the database layer. Any downtime in your MariaDB database would disrupt your monitoring availability, at the least on the frontend side of things in case of proxy buffering. Let’s have a look at the easiest way to create a high availability (HA) architecture for Zabbix using MariaDB with built-in Galera clustering – by removing single points of failure from your database and finalizing the HA puzzle for Zabbix.

Architecture overview

Let’s start of with the MariaDB + Galera number one design requirement. For a proper quorum to be made, 3 nodes should be used in the cluster. With only two nodes in a Galera cluster, quorum rules become a bit of a headache, as Galera uses a majority vote (more than half the nodes) to decide if the cluster can still accept writes. In a two-node setup, all is good when the database is online. But when we lose one node, quorum is lost and that node needs to rejoin.

This makes a two-node setup fragile but not impossible, and it does work with Zabbix since we do only have one Zabbix server active at the time. In a split-brain scenario where both nodes either think they are the last to leave, you might have to decide which node you think has your up-to-date data. We will detail both scenario’s, but the principle remains the same. We will use MariaDB as our database and Galera will be used to create a primary/primary cluster. In such a cluster, all nodes in the cluster are writeable, which is great for the Zabbix native HA.

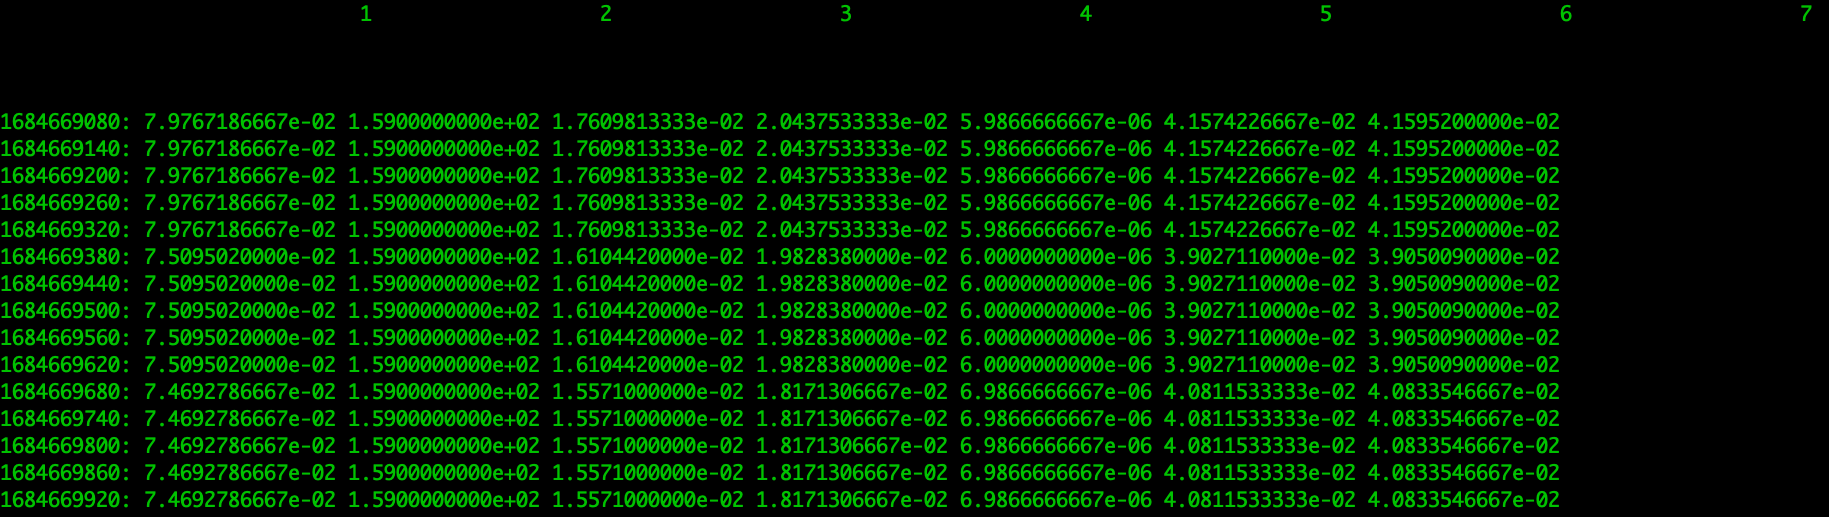
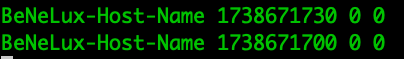
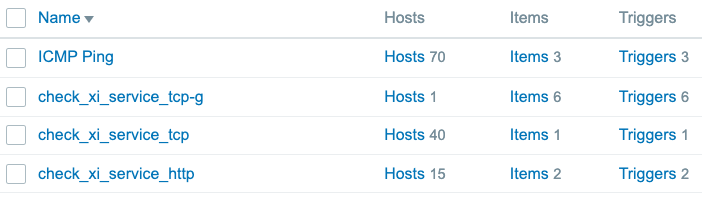
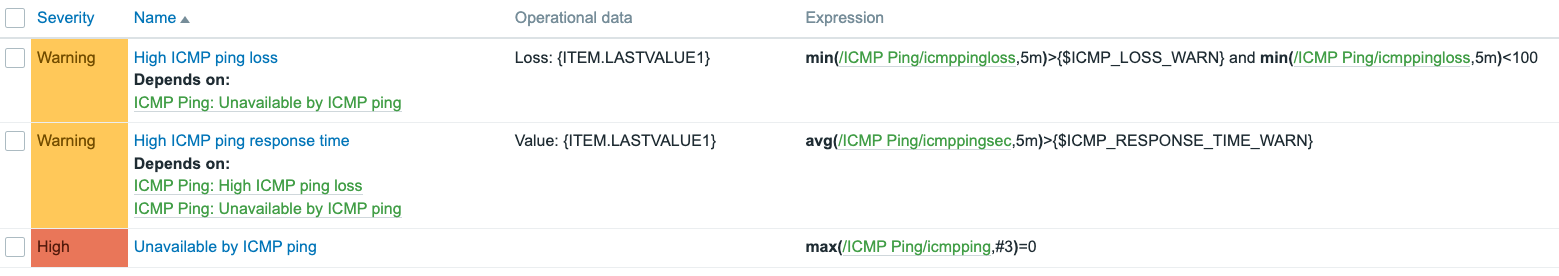
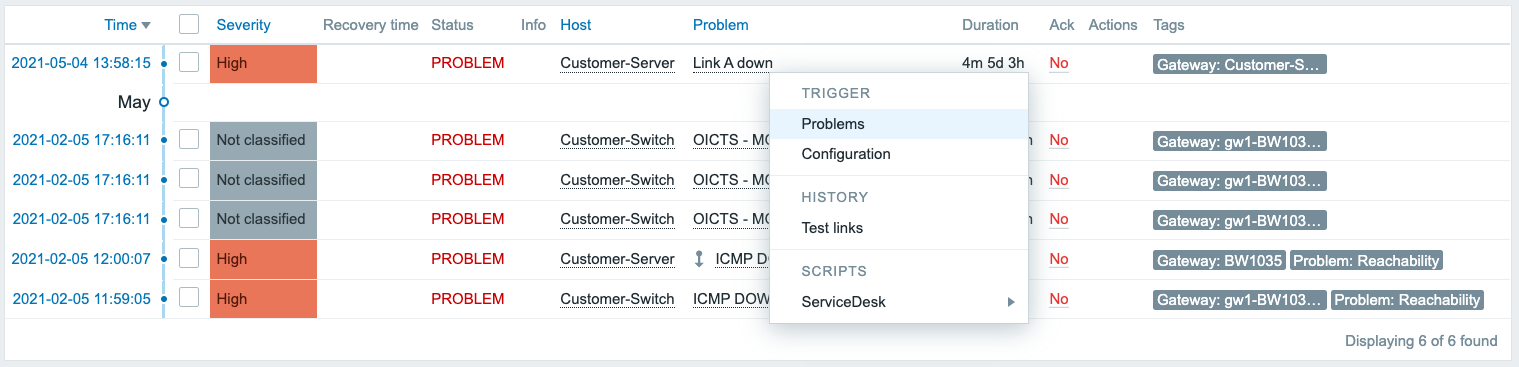
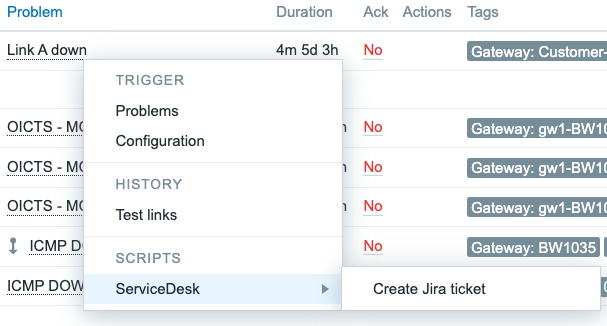
When we look in the Zabbix database, we can see that Zabbix keeps all of it’s Zabbix server HA information and states in the database.

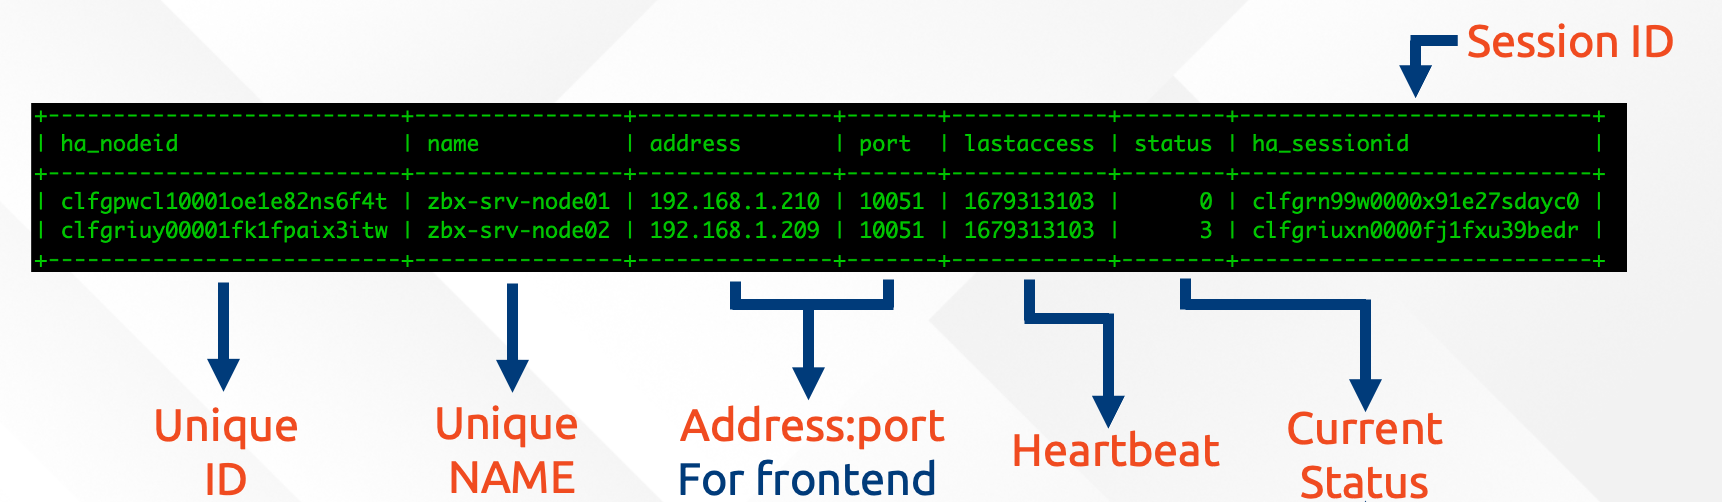
This means that whatever one Zabbix server node writes into the database will also be replicated to all other nodes in the MariaDB Galera cluster.

The design

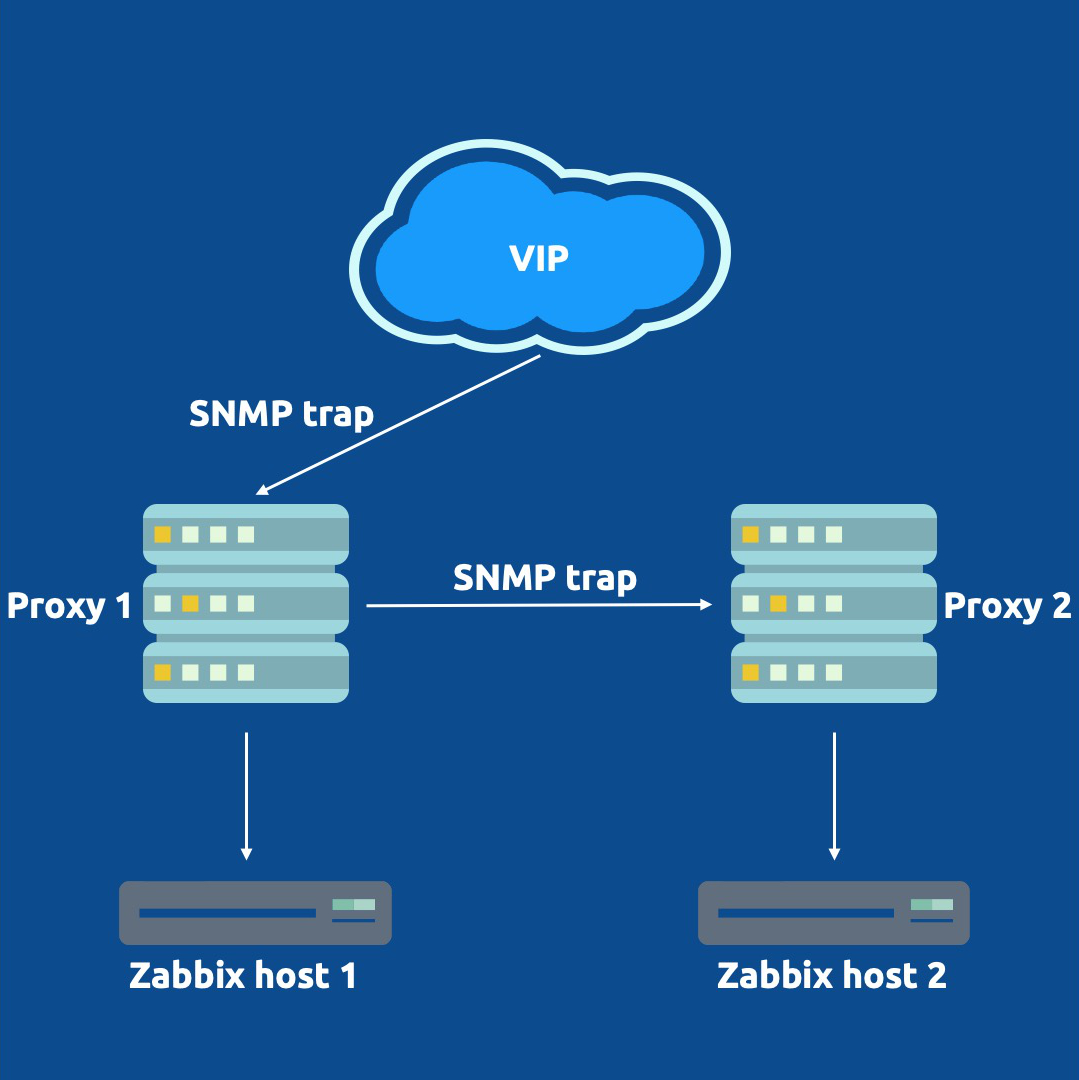
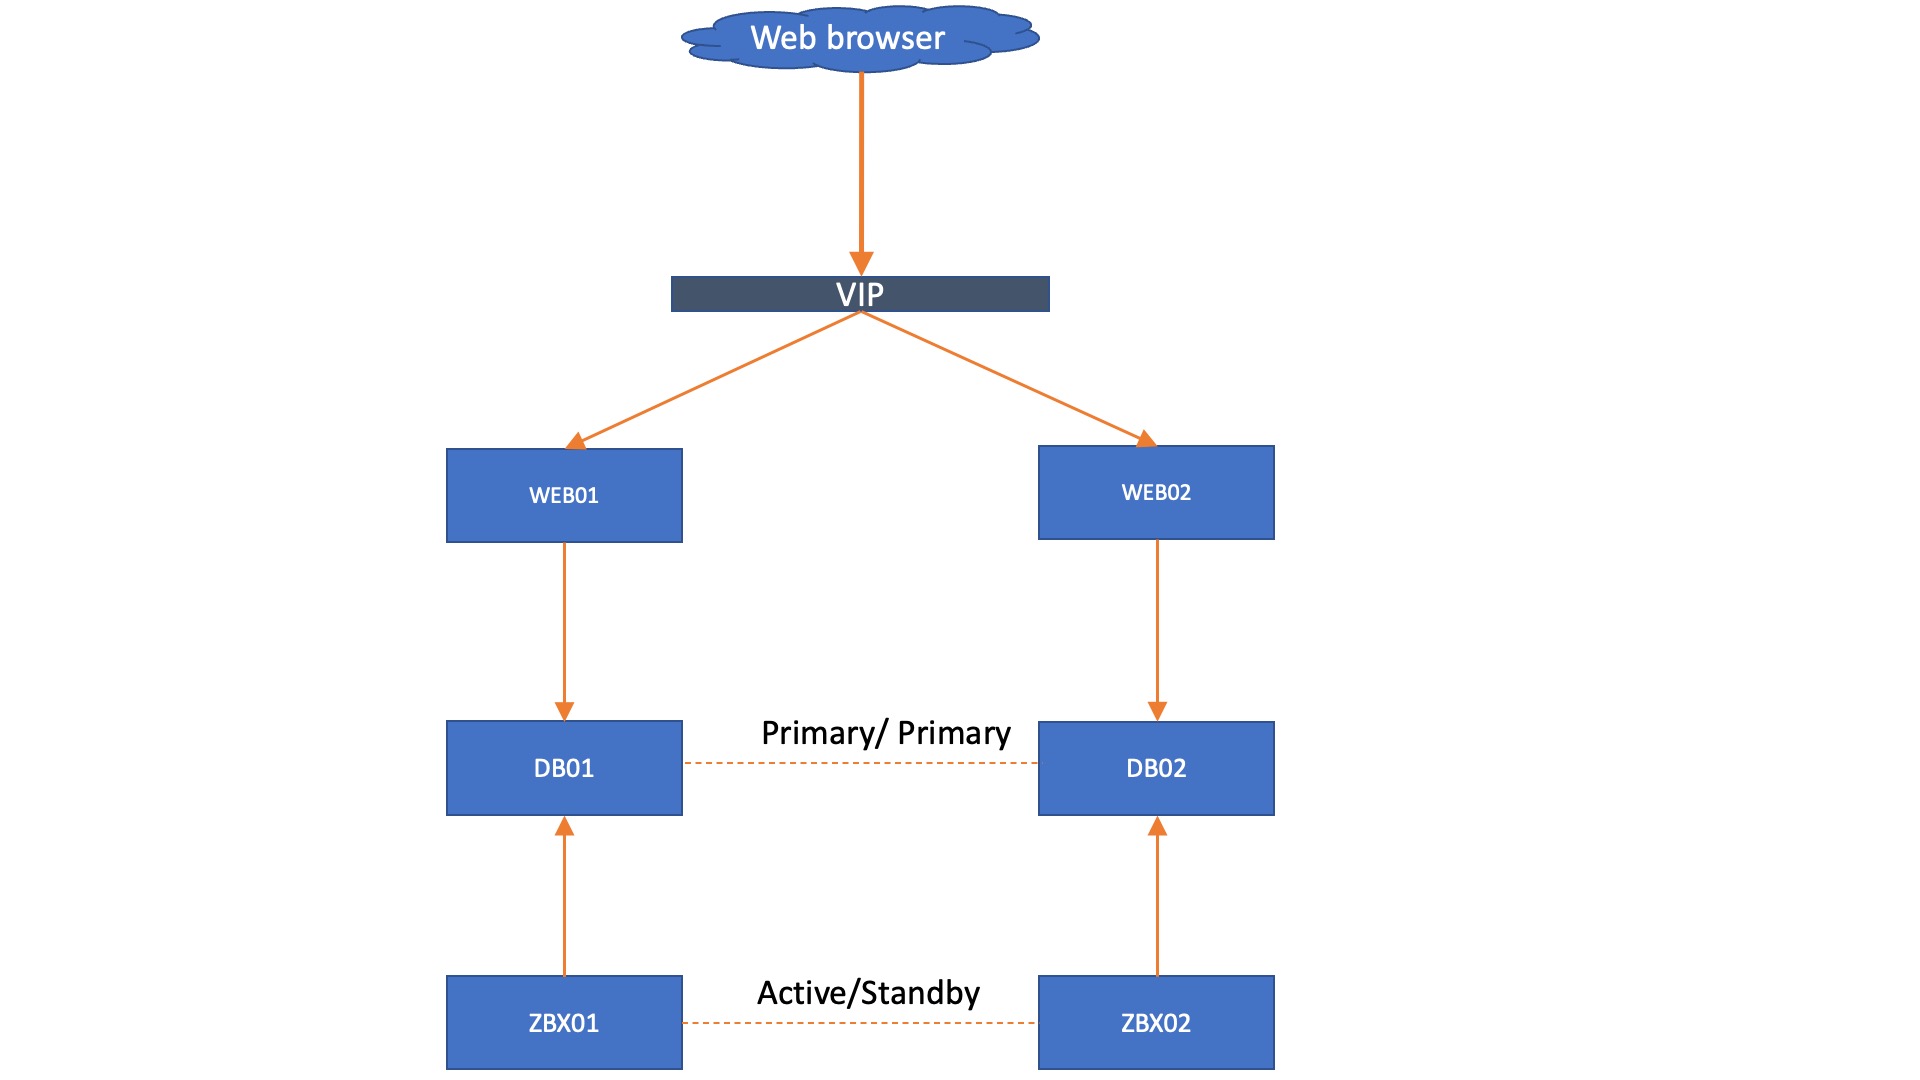
Knowing what we know now, we can create a very simple design for a solid Zabbix HA setup with Mariadb + Galera. When we have a single Zabbix frontend and we keep to the MariaDB + Galera requirement of having 3 database nodes, we get a fairly simple setup, as seen below.

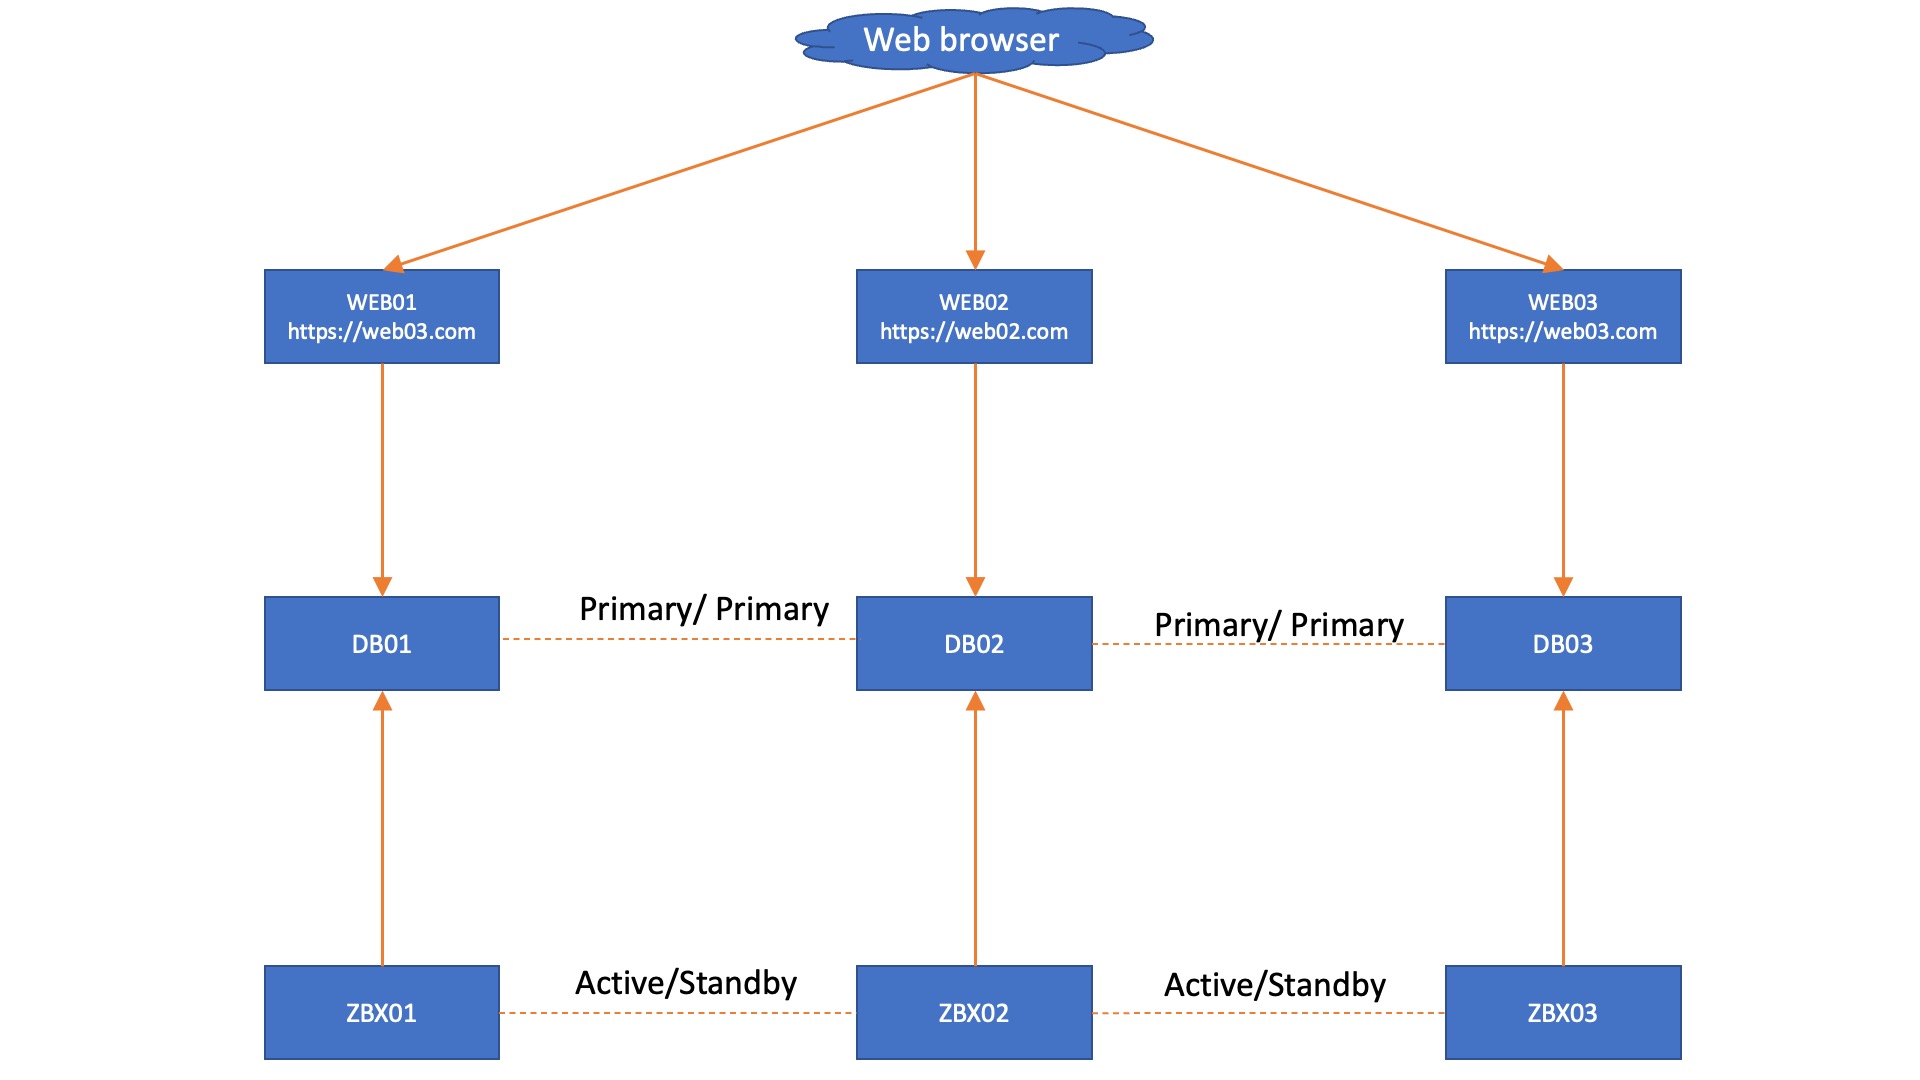
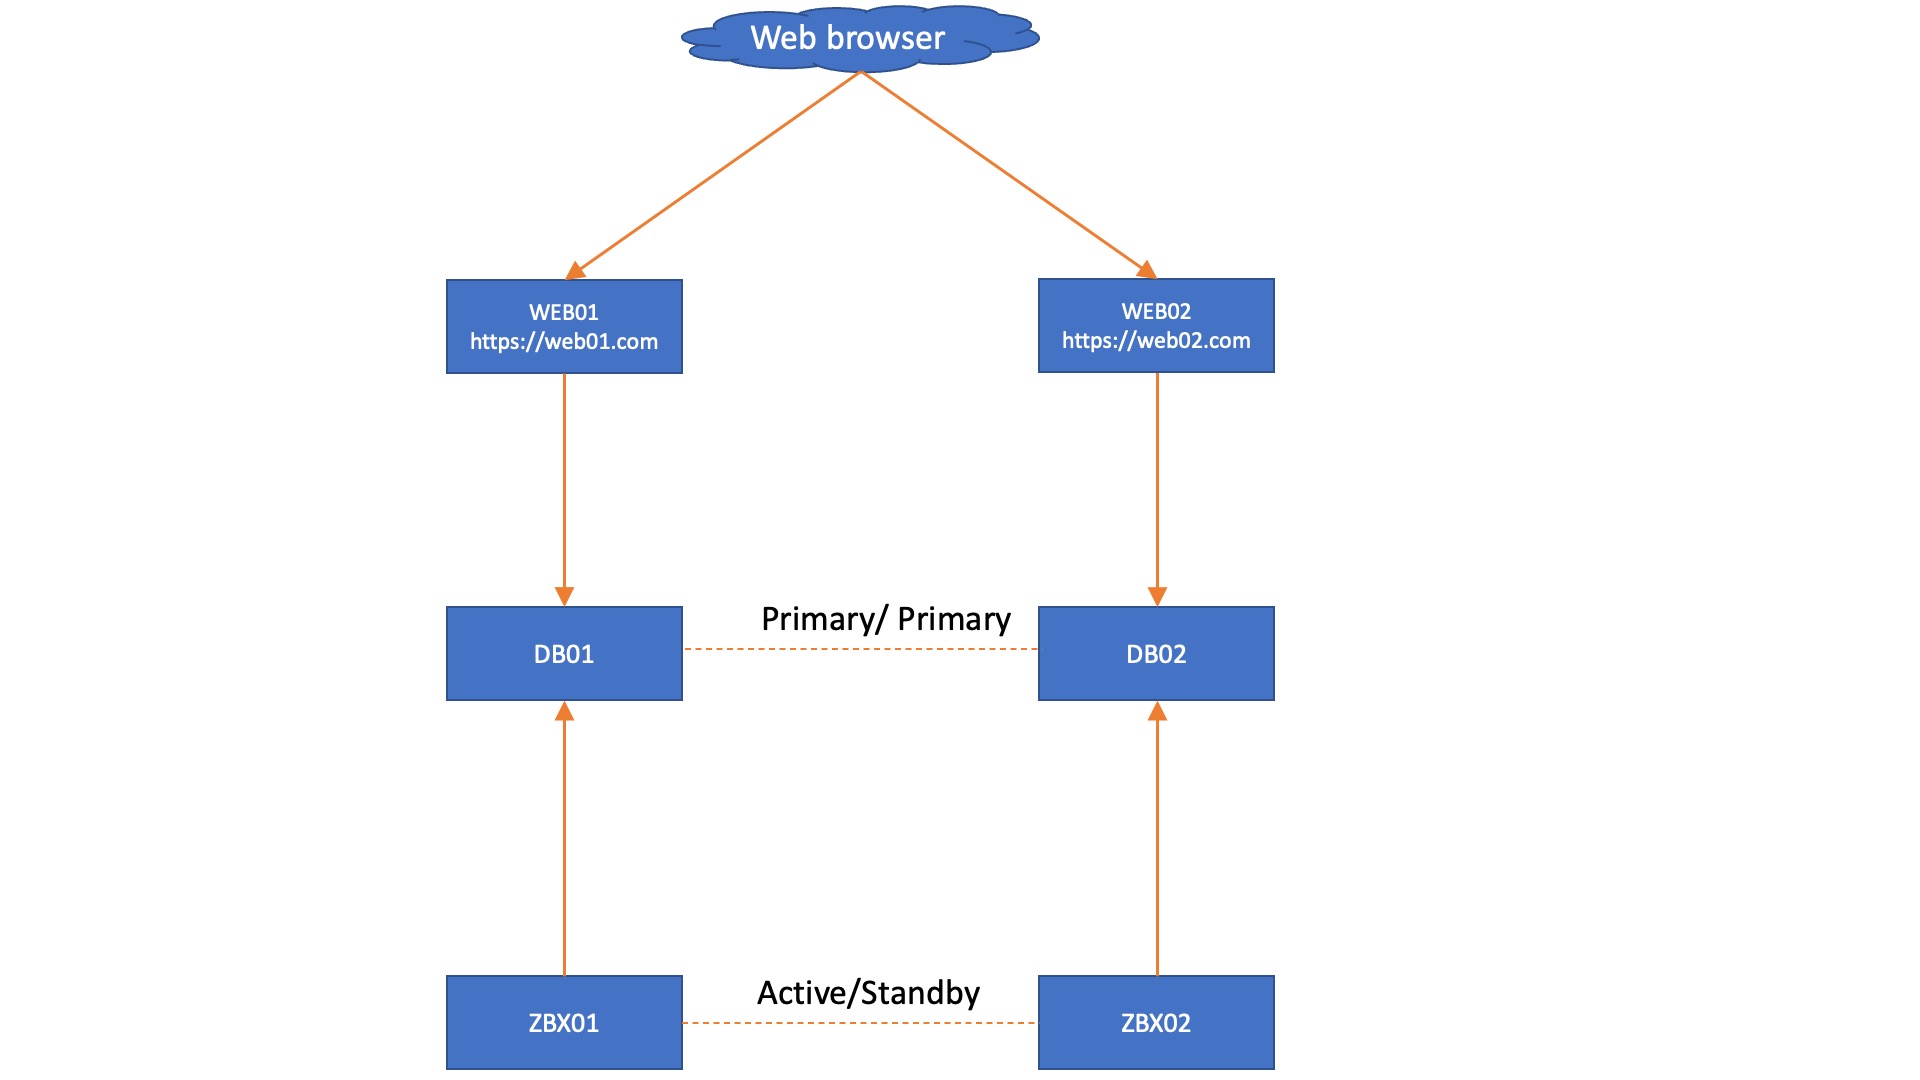
In this setup, each Zabbix server connects to its own Database node and we don’t need added complexity by using load balancers. However,  we do get an automatic failover from the Zabbix servers, as they know exactly which node is active through the database. However, in this situation we are still left with 3 frontends that do not have automatic failover, simply because we do not have database aware Apache or NGINX. This also works in a two database setup, with the side note that you might have quorum issues to manually resolve after an outage:

Adding onto this setup, we could install a VIP, load balancer, or something like HA proxy in front of the frontend to make a failover happen there as well. Keep in mind though, the failover needs to happen based on whether or not the webfrontend can reach a writeable database.

Optional Arbitrator

If you are set on running only 2 database nodes (your wallet is thankful), but still worried about quorums, we can bring in the ARBITRATOR.

If there are only 2 Database nodes in your Galera cluster, not to worry! It’s definitely possible even while maintaining a good quorum resolution in case of outages.

All we have to do is add a third machine (VM) running the Galera arbitrator software. Preferably this machine would be in a third location, so it can act independently. But you can also add it into your main site if required.

What about load balancing?

Lastly, it is also possible to add load balancing to the mix. Let’s say, for example, you cannot add a VIP to your environment but still need your WEB servers to failover. A load balancer can provide the solution here.

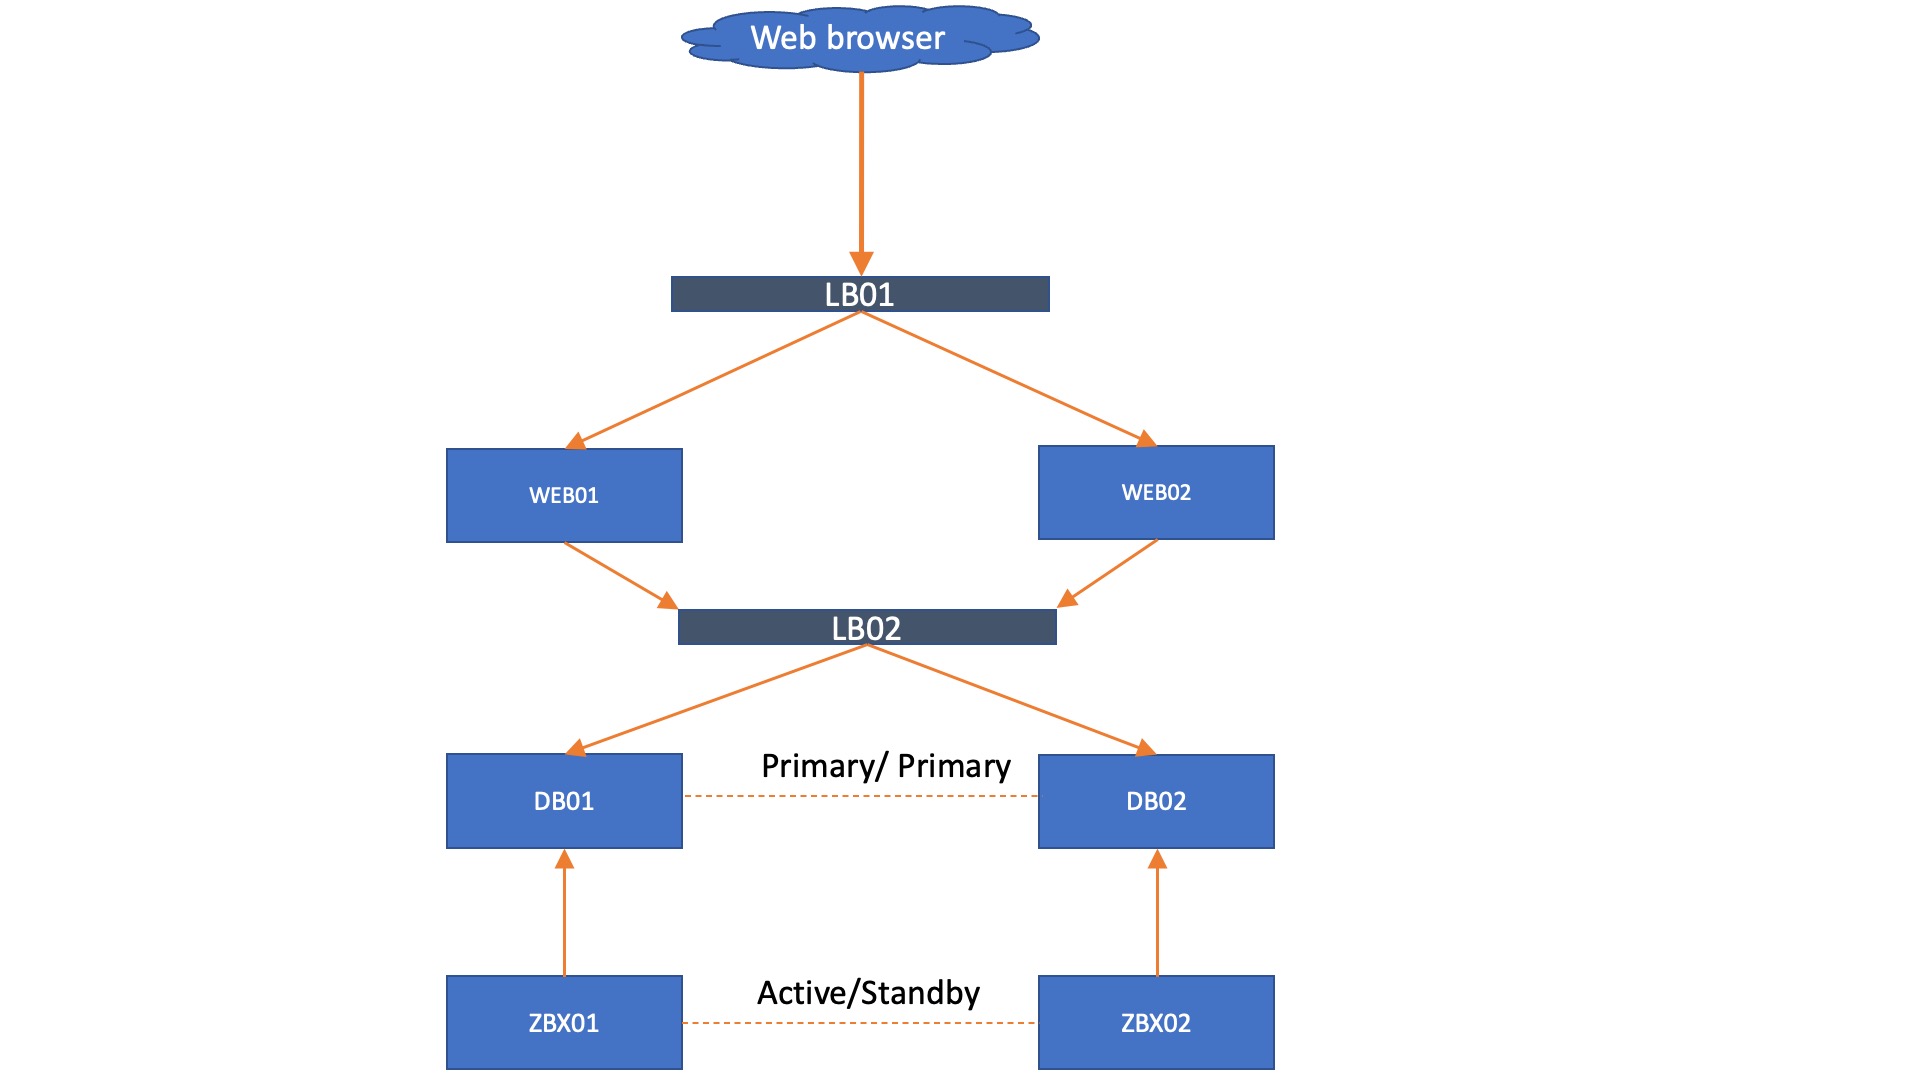
We still prefer to run the Zabbix servers with a direct database connection, but even there a load balancer could be added if you wish. However, please keep in mind that the more load balancers you add, the more complex troubleshooting might become. The whole idea about the setup without load balancers is to have a solid Zabbix setup that is easy to maintain, while providing high availability.

Conclusion

In the end, even with a minimal setup of 2 DB nodes, 2 Zabbix servers, and 2 WEB frontends, we can make a high availability setup. As we’ve shown with Galera, this setup becomes highly flexible, allowing us to run without automatic WEB failover all the way up to including complicated load balancers.

High availability doesn’t have to be overly complicated in a setup like this – it really is all about how far you want to push things. Besides that, in this setup everything is horizontally scalable on the database side. Do keep in mind, however, that Zabbix does still run in an Active/Passive setup.

I hope you enjoyed reading this blog post. If you have any questions or need help configuring anything in your Zabbix setup feel free to contact me and the team at Opensource ICT Solutions. We build a ton of cool stuff like this and more!

Nathan Liefting

https://oicts.com

A close up of a logo Description automatically generated

The post Running Zabbix with MariaDB and Galera Active/Active Clustering appeared first on Zabbix Blog.

Proxy Group Load Balancing with SNMP Traps

Post Syndicated from Nathan Liefting original https://blog.zabbix.com/proxy-group-load-balancing-with-snmp-traps/31042/

The new Zabbix proxy groups provide us with a method to provide both redundancy and load balancing in our Zabbix proxy setups. However, one major limitation arises when we want to use SNMP traps with these new proxy groups – it isn’t natively supported at the moment. One of our customers asked me to find a solution to that problem, so here’s how I went about it.

Getting to grips with the problem

As mentioned, many of us are now facing a problem. Either we use proxy groups and we don’t use SNMP traps, or we use proxy groups and move SNMP traps to a single proxy. Unfortunately, this is unacceptable for many environments where SNMP traps might be an essential part of monitoring. The problem, however, stems from how snmptrapd works in combination with Zabbix reading the trapper file. Improvements have already been made to provide for more room when creating our own solutions like this.

Other Zabbix users have also been proposing solutions and I’m sure Zabbix is looking into improvements. Here’s an example case to vote on.

However, that doesn’t solve many of our issues now. The problem starts when we are sending SNMP traps to a single proxy (Proxy 1 for example) and a Zabbix host (let’s say Zabbix host 2) is assigned to another proxy in the proxy group (Proxy 2 for example). In this situation, the trap is coming in on an incorrect monitoring proxy and Zabbix won’t be able to read the trap. It will simply not add it to the Zabbix database and ignore it.

The solution here is simple – we can configure our monitoring target like a switch or a router to send the SNMP trap to multiple sources. However, this will cause our trap to be sent over the network multiple times, increasing the load on our network. This is acceptable for smaller setups, but we were dealing with a setup that is sending hundreds of traps every second.

Finding a solution

With the problem laid out for us, we came up with a simple duplication setup that included these requirements:

  1. Simple and easy to maintain/troubleshoot
  2. Traps could only be sent over the network once
  3. Works fast between failovers
  4. Works with both redundancy and load balancing
  5. Minimal extra packages
  6. No easily corruptible shared file systems

What we came up with in the end is visible in the image below:


It’s a simple setup that requires us to install 2 extra packages and a container.

First, we added a VIP to our proxy setup using keepalived, to provide our monitoring targets with a single SNMP trap destination. The VIP will be available on one proxy at the time, regardless of whether there are 2, 10 or more proxies in the proxy group. Our switches, routers, or any other SNMP trap host can now be configured to send traps to this VIP.

Second, we needed a way to duplicate our traps. Since only one proxy is going to be receiving traps, the other proxies still need to be able to receive the traps. Without the duplication and the VIP being present on Proxy 1, Zabbix host 2 still would not receive its trap. We installed Docker and created a tiny, lightweight container on our hosts to duplicate the SNMP trap from one proxy to all other proxies in the group. Admittedly this does slightly go against requirement number 2, as we are now sending the trap over the network between proxies. This is, however, all within our own more localized infrastructure instead of over a longer network.

That’s it! Whenever Proxy 1 receives a trap, it will now duplicate it to Proxy 2. The proxy with the host being monitoring will parse the trap correctly to Zabbix and the other proxies will ignore the trap. Even if the proxy restarts, fails over, or suddenly goes down, it will not read the trap twice.

The only thing to keep in mind is that it can take some time for keepalived to fail over the VIP. With SNMP traps being UDP-based, this means that any traps sent to the VIP while snmptrapd is down won’t be parsed. However, it’s definitely better to lose some in case of failover, than to lose all upon outage!

The post Proxy Group Load Balancing with SNMP Traps appeared first on Zabbix Blog.

Migrating Nagios to Zabbix: Lessons Learned

Post Syndicated from Nathan Liefting original https://blog.zabbix.com/migrating-nagios-to-zabbix-lessons-learned/30917/

Recently, a new customer of ours at Opensource ICT Solutions asked whether we could migrate their Nagios instance to Zabbix. Because Nagios and Zabbix are very different in their storage methods, we told them that we would have to investigate and see if we could come up with a viable solution. It wasn’t long until we found a way to do it and started building some script to get it done.

The customer’s wishes

  • No loss of any Nagios configuration data
  • Historic performance data migrated to Zabbix
  • Existing problems migrated from Nagios
  • Nagios XI to be disabled entirely, as the license is expiring

The customer was clear in their wishes – we needed to turn off Nagios, but without losing historic data. As such, they wanted all their old data visible in Zabbix instead of having Nagios running somewhere as a backup. This meant that a script had to be built to get that Nagios data out and into Zabbix.

The configuration data

The good part here is that it starts simple. When we dive into the Nagios configuration data, we clearly see that Nagios has hosts just like Zabbix. They just have a slightly different build than our usual Zabbix hosts. For example, we can see three different names for a host in Nagios:

  • Host Name
  • Alias = Host name
  • Display Name = Visible name

That immediately gives us a good way to hook up Nagios names to Zabbix host and visible names.

When we then take a look at the checks and how they are executed in Nagios, we also see similarities with Zabbix. In the end, both of them are monitoring solutions, of course. However, Nagios works more in a command execution kind of way, which is good for our migration. We can take this command and find an equivalent item in Zabbix. For example the check_icmp command can easily be translated into a simple check in Zabbix icmpping, icmppingloss, and icmppingsec.

For the check_tcp command we can do a similar translation. Making sure we use the simple check net.tcp.service whenever this command is executed on a Nagios host.

Because of the big differences between Nagios and Zabbix, this does mean we need to make some manual translations between the Nagios commands and Zabbix items. Depending on your Nagios instance, this could be a big task. Luckily for us, this was a smaller instance with only ICMP and TCP port checks.

The history (i.e. performance) data

Now that we know how to start creating our hosts and items, we need to understand how Nagios is storing its data. Zabbix has a big centralized MariaDB or PostgreSQL database, which makes it easy to parse through and work with our data. Unfortunately, Nagios instances use a different technique. Nagios stores data in .rrd (Round Robin Database) files and with it a .xml file to interpret the RRD file. The RRD files are not centralized like a Zabbix database, but they are more manageable in terms of storage size. We can see an RRD file per type of check in Nagios, which means we will have to grab the data from that file while understanding what it is going to belong to in Zabbix.

To see the data in the RRD file, we can use a special command line tool.

rrdtool /usr/local/nagios/share/perfdata/BeNeLux-Host-Name/Availability.rrd LAST --start -30d --end now | grep -v "nan"

Now we can clearly see that this specific RRD file above contains 8 columns, 7 with a performance value. The first column contains the timestamp in Unixtime, which is great because it will be perfect for storing in the Zabbix database. The other 7 columns in this file are different though, because we do not know what the value in the column belongs to. This is where the .xml file comes into play. The XML file belongs with the RRD file and contains details on what is included in the RRD file.

In this XML file we will find all of the required host information, which is great for creating the host in Zabbix. It also contains the check information, so we can also use this file to create the items in Zabbix. The biggest thing we will have to keep in mind is to make sure that the XML and RRD file match up in terms of number of RRD entries and columns. Column 1 in the RRD file will match with the first entry in our XML.

Let’s create a script

With the host, item and history data identified, we can start to create a script. In our case we decided to create a Python import tool. As Zabbix comes with some limitations in terms of which hostnames we can use (which are different from the limitations in Nagios), we need to sanitize our hostnames slightly.

Then all we need to do is parse through all the XML files and create new hosts in Zabbix through the Zabbix API.

It will be a very similar process for our items, as we parse through our XML file and create all of the required items in Zabbix through the API.

We can even create the triggers straight from the XML file by parsing through the different severities already set up in Nagios.

Once everything is created in Zabbix, the Python script can now start using RRDTool to parse through the RRD file, making sure to keep the XML file structure in mind when parsing through the columns.

This script can now create the hosts, the items, the triggers, and then import all of the data. We can see the hosts being created and data being imported.

The beauty of importing history data into Zabbix while the triggers are already created is then also seen below.

All of the triggers will trigger and be resolved based on the data imported, meaning that we can create problems with historic data. This means that not only do we have our historic data, but also all the problems with the correct duration as they are now discovered from the actual imported data.

To make this possible we can use the Zabbix sender tool. It has an option to include the timestamp upon every historic value imported.

Our Python script grabs the values from the RRD file and then converts them into a new _HOST_.sender file. This file will be sent to the Zabbix server using the Zabbix sender tool.

Looking at the file, we can see it contains only the name of the host, the unixtime stamp, and the actual value to send.

All we need to do is make our script send this file to the correct item in Zabbix.

Manual template and item creation

The last step will be our cleanup. We decided that we would start dirty with a one-on-one data import from Nagios. This means hostnames, item names, and trigger names are imported straight from Nagios. No templates will be created in Zabbix by the tool either, skipping the Zabbix best practice to use templates for all hosts.

We did this to make the initial import easier and not go overboard with scripting. It’s easier to have a messy Zabbix to clean up than to script everything perfectly in Python. Time is valuable.

What we did afterwards is create all the templates manually to take over the items as is from the hosts. For example, we can translate the ICMP ping and TCP stuff easily into a template.

After doing so, we do end up with some bad looking templates, but we can now start cleaning up.

We can also start creating normal trigger names and clean up…

…while changing our dynamic port names for something more expected as well.

And that’s it!

The post Migrating Nagios to Zabbix: Lessons Learned appeared first on Zabbix Blog.

Monitoring your cat’s health with Zabbix and the Litter Robot 3

Post Syndicated from Nathan Liefting original https://blog.zabbix.com/monitoring-your-cats-health-with-zabbix-and-the-litter-robot-3/22413/

In this blog post, you will learn how to set up monitoring for your Litter Robot 3. There’s some amazing community scripts already available to connect to the Litter Robot through a selfmade API, which we’ll be using in combination with some Python scripts and Zabbix.


Introduction

Technology is everywhere. On the streets, in our offices and even in our houses. This also means that many people have ‘smart’ lighting, fridges, cameras and a lot more. Personally, I have avoided these home automations for a long time, deeming them time-consuming. But, I think any IT Engineer sometimes feels there is a need to build and automate more and more. Thus, my house has also had a bit of smart home make-over and I’ve started setting up Zabbix at home to monitor everything ‘smart’.

One of the things I cannot live without in our house is our smart litterbox. It keeps the litterbox clean and the smell in the house nice, as well as it provides some very useful insights into my cats ‘potty’ behaviour. One of my cats “Jerry” has some issues with Feline Urinary Tract Disease (FLUTD). This has led Jerry to have some odd litterbox usage, which in his case can be fatal if not treated early on.

So, let’s bring Zabbix into the mix! Even though the Litter Robot has an app where I can see the usage, I want to be able to receive alerts from Zabbix if the Litter Robot usage goes over a certain threshold. Alerting me early on if issues might be arising again. Let’s set things up.

How to

Setting up the script

To make this all possible, we will need to get some information from our Litter Robot or Litter Robots if we have more than one in our account. There’s no official documented API available for the Litter Robot, but there is a way to get information from the device by connecting to the Whisker services. To make things easy for us, we’ll be using a community-made Python library to set up the connection and execute some functions:

https://github.com/natekspencer/pylitterbot

This library contains a number of functions that we can utilize to get information from the Litterbox, but also to make changes to it:

  • refresh()
  • start_cleaning()
  • reset_settings()
  • set_panel_lockout()
  • set_night_light()
  • set_power_status()
  • set_sleep_mode()
  • set_wait_time()
  • set_name()
  • reset_waste_drawer()
  • get_activity_history()
  • get_insight()

Utilizing this library we’ve made some scripts available at the Github page below.

https://github.com/OpensourceICTSolutions/zabbix-litterrobot

Login to your Zabbix environment and install the Python library to your Zabbix server or proxy first with:

pip install pylitterbot

Next, execute the following command to download the scripts and put them in the right location.

mkdir /usr/lib/zabbix/
mkdir /usr/lib/zabbix/litterrobot/
cd /usr/lib/zabbix/litterrobot/

wget https://raw.githubusercontent.com/OpensourceICTSolutions/zabbix-litterrobot/main/litterrobot_get_robots.py
wget https://raw.githubusercontent.com/OpensourceICTSolutions/zabbix-litterrobot/main/litterrobot_get_insights.py
wget https://raw.githubusercontent.com/OpensourceICTSolutions/zabbix-litterrobot/main/litterrobot_get_activity.py

These scripts will have to be executed by Zabbix server’s (or proxy’s) local Zabbix agent, and thus we’ll also have to download the correct UserParameter files.

cd /etc/zabbix/zabbix_agent2.d/
or
cd /etc/zabbix/zabbix_agentd.d/

wget https://raw.githubusercontent.com/OpensourceICTSolutions/zabbix-litterrobot/main/litterrobot_userparams.conf

Then, we have to make sure that the Zabbix agent will be able to use these new parameters by enabling unsafe user parameter option (since there is an @ in the username). Edit /etc/zabbix/zabbix_agent2.conf or /etc/zabbix/zabbix_agentd.conf and add the following:

UnsafeUserParameters=1

Then we restart the agent with the following command:

systemctl restart zabbix-agent
or
systemctl restart zabbix-agent2

Setting up Zabbix

With the scripts in place and the Zabbix agent ready to execute them, we can set up our monitoring in the Zabbix frontend. To do this, we will have to download and import the template. You can find the 6.2 version template here: https://github.com/OpensourceICTSolutions/zabbix-litterrobot/blob/main/zabbix_litterrobot_python_template.yaml

After downloading the template, import it into Zabbix.

Create a new host for your Litter Robot:

Then make sure to add your username and password as macros:

The result

The result is that we can now find all of our important information about the Litter Robot 3 in Zabbix:

Not only that, after we have an idea of how many times per day our cat(s) usually go to the toilet we can start to use the triggers:

There’s a message for when the drawer is full, but also a Warning and High trigger for when there are more than 12 or 15 cycles respectively. This is a default set for my two cats, your cats might have different potty behavior – update your macros accordingly.

As well as create some useful graphs:

Conclusion

Our pets are a big part of our life and sometimes it can be hard to communicate with them. Cats are very likely to hide their feelings, but one of the telling signs something is wrong with them is the number of times they visit the litterbox. Jerry has had a hard time, but our Litter Robot has helped us and our veterinary keep an eye on him to get ahead of his FLUTD. Using Zabbix we can keep Jerry out of surgery as much as possible.

And keep both (Midna on the left, Jerry on the right) of them racing through the house and enjoying all of their 9 lives.

I hope you enjoyed reading this blog post and if you have any questions or need help configuring anything in your Zabbix setup feel free to contact me and the team at Opensource ICT Solutions. We build a ton of cool integrations like this and much more!

Nathan Liefting

https://oicts.com

A close up of a logo Description automatically generated

Backups to the rescue!

Post Syndicated from Nathan Liefting original https://blog.zabbix.com/backups-to-the-rescue/23442/

In this blog post, you will learn how to set up backups for your Zabbix environment. There’s a wide variety of different options when it comes to taking backups of our Zabbix environment, for us, it will just be a matter of choosing the right fit.


Introduction

Monitoring is an important part of our IT infrastructure and often times when our monitoring isn’t working for a certain period, we feel like we are blind as to what is going on with our different IT components. As such, taking backups of our Zabbix environment is an important part of running a production Zabbix environment, as we do want to be prepared for a possible issue that might corrupt or even lose our data. It’s always a possibility and as such we should be prepared.

For Zabbix, there are a few different methods on how to take backups and it all starts at the database level. Both the Zabbix frontend as well as the Zabbix server write their data into the Zabbix database as we can see in the illustration below:

This means that both our configuration as well as all of our collected values are present in the same Zabbix database and if we take a database backup, we back up (almost) everything we need. So, let’s start there and have a look at how we can make a database backup.

How to

MySQL backups

Let’s start with the most used variant of Zabbix databases: MySQL and it’s forks like MariaDB and Percona. All of them can easily be backed up using built-in functionality like the MySQL Dump command and we can then use other industry standards to get things going. First, we have to understand the tables in our database though. Most of the tables in your Zabbix environment contain configuration data and as such, they are all important to backup. There are a few tables that we need to consider, however, as they can contain Giga or even Terabytes of data. These are the History, Trends and Events tables:

It is possible to omit these tables from your backup and make smaller, more manageable backups. To make the backup we can then start using tools like MySQL Dump:

Once we have taken a backup, we can easily import that back into our environment using the MySQL Import command or simply using the cat command:

Do not forget, taking and importing large backups can take a long time. This completely depends on your MySQL database performance tuning settings as well as the underlying resources like CPU, Memory and Disk I/O. Also, make sure to check out the MySQL documentation:

MySQL Dump:  https://dev.mysql.com/doc/refman/8.0/en/mysqldump.html / https://mariadb.com/kb/en/making-backups-with-mysqldump/

MySQL Import: https://dev.mysql.com/doc/refman/8.0/en/mysqlimport.html / https://mariadb.com/kb/en/mysqlimport/


Alternatively, it’s also possible to create backups using tools like xtrabackup and mariadbbackup.

PostgreSQL backups

We can actually use the same kinds of methods for the PostgreSQL backups. Keep the required tables in mind and fire away with the built-in tools:


Then we can restore it by loading the file into postgres:

What about the configuration files?

Once we have a database backup, everything is backed up, right? Well, almost everything. With just a database backup we are quite safe, but (and this is oftentimes overlooked) there are a lot of configuration files and perhaps even custom scripts we need to take into account! There are three parts to this story – the Zabbix server, the Zabbix frontend, and also the Zabbix additional components. All of them have their own set of configuration files and locations that are used for storing custom scripts.

The Zabbix frontend location and configuration files can be different, depending on the environment, as we have a few choices to make. Are we running Apache or Nginx? On what Linux distribution? All of these have to be considered when making configuration backups. In general, the locations for the configuration would be:

/etc/nginx/
/etc/httpd/
/etc/apache2

There’s also a symlink to the Zabbix frontend configuration file located in /etc/zabbix/ but we will get to that one in a bit.

Then we have the Zabbix server itself, which keeps its configuration in /etc/zabbix/ and if we’re following best practices any script should be placed in /usr/lib/zabbix. So we need:

/etc/zabbix/
/usr/lib/zabbix

Let’s add them to the list and find a method to back up these files. Crontab is a built-in tool that we can use, but there are definitely other (perhaps better) solutions out there. Let’s add the following to cron:

I also added a find command here, which will serve as our roll-over or rotation toll. It will find files older than 180 days and delete them from /mnt/backup/config_files/. Make sure to pick a good (network) folder to store these files as it’s important to keep these safe. Feel free to change the number of days you’d like to store the files for.

What about the additional components like Zabbix proxy, Zabbix Java gateway and Zabbix web service (used for PDF reporting)?. Well, these have configuration files as well. Make sure to run a backup on the devices running these additional components. As for Zabbix proxies – they have the same file locations as Zabbix server:

For Zabbix Java gateway and Zabbix web service, we can omit the /usr/lib/zabbix/ folder.

Don’t forget the import/export files!

In general, database backups are slow to make, but also slow to import back unless we do not include the history/trends in the backup. But even then, restoring an entire database simply because someone made an error on a single template is a hassle. Zabbix ships with the built-in frontend export functionality, allowing us to export (and then import) entire parts of the configuration instantly! We can use these for a number of different parts of the configuration:

  • Hosts
  • Templates
  • Media types
  • Maps
  • images
  • Host groups (API ONLY)
  • Template groups (API ONLY)

All of these are available through the Zabbix API allowing us to choose whether we do a manual configuration backup from the frontend, as well as providing us with automation options using that API. You could even manage and update your Zabbix configuration from GIT entirely if you write the right scripts for this.

Frontend backups

To run an export from the frontend simply go to one of the supported sections like Configuration | Templates and select the export data format. When selecting multiple entities, keep in mind that they will all be exported to a single file.

We can then make our edits and import files from the frontend as well:

For Templates this will even result in a nice diff pop-up window, detailing all the changes, deletes and additions to the templates:


API backups

For the API things get a little more complicated as we need to select a mode of execution. Of course, it’s possible to do a curl command from the CLI or even use something like Postman:

Request body

The response will then look something like this:

But this feature really starts to shine once we combine it with our own automation scripts. Use it wisely!

High availability

So, what about high availability? Isn’t that some form of a backup?

Well yes and no. High availability is not an “IT backup” in the form of making sure we can recover something that is broken. But it is a backup in the way that if a Zabbix server instance fails, another one takes over for it. HA is somewhat out of scope for this blog post, but it’s still worth mentioning. There are several solutions to set up Zabbix as a full high availability cluster. For MySQL we can use a Primary/Primary setup, for the frontend we can use load balancing techniques like HAProxy and for the Zabbix server, we can use the built-in high availability method. Combine all of these together and you’ll definitely be able to serve your every (production ready!) need.

Conclusion

To conclude, there are many options to start taking backups of our Zabbix environment. It all starts at the database and these backups are definitely vital to keep things safe in case of disaster. When making the backups, do not forget about the configuration files and custom scripts as well as the frontend backup option. Combining all of these solutions will safeguard our environment, but if that isn’t enough – do not forget about industry standards like snapshots. Even further safeguarding our environment on multiple levels.

I hope you enjoyed reading this blog post. If you have any questions or need help configuring anything on your Zabbix setup feel free to contact me and the team at Opensource ICT Solutions. We build a ton of cool integrations like this and much more!

Nathan Liefting

https://oicts.com

A close up of a logo Description automatically generated

The post Backups to the rescue! appeared first on Zabbix Blog.

Setting up manual ticket creation using Zabbix frontend scripts

Post Syndicated from Nathan Liefting original https://blog.zabbix.com/setting-up-manual-ticket-creation-using-zabbix-frontend-scripts/15550/

In this blog post, you will learn how to set up manual ticket creation through the use of Zabbix frontend scripts. We will use Jira Service Desk as an example, but this guide should work for any type of service desk or help desk system, as we can apply this technique for other systems in a similar fashion.


Introduction

Zabbix already has the ability to automatically create tickets through the use of Media Types and Actions. This way we can filter out certain issues based on host groups, severity, tags and a lot more. But what if your action misses a problem because of your filters? Or what if you simply want to limit the number of tickets that are created by actions? That’s when we can use Zabbix Frontend Scripts to manually create a ticket from the Zabbix Frontend, while automatically filling in the ticket info with a click of a button.

Let’s check take a look at how we can achieve this.

How to

Setting up Jira

As mentioned, in this example we’ll use Jira. Why? Simply because personally I am a big fan of the Atlassian product suite and it’s what I had available on hand. Feel free to apply this technique to any service desk system out there though, as we are definitely not limited to Jira Service Desk.

To make the frontend script work we are going to need a working integration (Media Type in Zabbix terminology). You can check out https://zabbix.com/integrations to see if the service desk system of your choosing is already available out of the box. If not, you can always use a community solution or build your own integration. Jira Service Desk is already available though, meaning we can use the settings pre-defined in Zabbix. For Jira Service Desk we’ll need:

  • jira_url – The actual URL of your Jira instance. For example: https://company.atlassian.net/
  • jira_user– Jira user login, in our instance this is my email.
  • jira_project_key– Numeric key of the Jira project. We can find this in the URL once we go to our Jira Service Desk project settings. For example: pid=10054
  • jira_issue_type– Number of the issue type to be used when creating new issues from Zabbix. Check out the Project Settings -> Request types and use the number in the URL for the request type you’d like to use.
  • jira_password– Password or API token. We can create this at: https://id.atlassian.com/manage/api-tokens

Make sure to save the API token somewhere, as you can only copy it over once.

Setting up the frontend script

Now once you have set up everything on the Jira (or which ever other service desk you use) side, we can continue with the next step which is setting up the Frontend script. If we look at the particular Zabbix Media Type, we can see something interesting.

The Jira ServiceDesk default Media Type is of course already set up, but that’s not the most interesting part – although super useful nevertheless. Looking at the Media Type we have our Parameters and the Javascript script. If we take a look at the Frontend Script configuration and compare it with our Media Type, that’s when it gets interesting:

With release of Zabbix 5.4 it is now possible possible for us to execute webhooks directly with a Frontend script, as we can see we have the same Parameter and Script options available in this section. Meaning that most of what we have to do is navigate to Administration -> Scripts and copy over the Media Type Parameters and script. So, let’s do that and fill in the parameters with default values:

Do not forget to do the same thing for the script part:

Once you’ve set this up, we aren’t completely done yet. We have copied the default parameter values as defined by Zabbix in the default Jira ServiceDesk Media Type. Now that we’ve copied those from the Media Type to the Frontend script, we still need to edit them to reflect our Jira ServiceDesk parameters. We need to edit the following fields:

alert_message: We can add our own alert message here, which will be filling out the body of our Jira Service Desk ticket. Use the Zabbix built-in macro’s wisely here. Something like:

There is a problem on {HOST.HOST} - {EVENT.NAME} with severity: {EVENT.SEVERITY} since {EVENT.DATE}

alert_subject: This will be the subject of our Jira ticket, again heavily reliant on Built-in Macro’s. It can be something like:

Severity:{EVENT.SEVERITY} Problem on:{HOST.HOST} - {EVENT.NAME}

event_source: We set this to 0, meaning it is a problem. Normally this is dynamic, but we can make it static for the script.

0


Then, as discussed in the earlier part of this post we need to edit the following parameters:

jira_password 

jira_request_type_id 

jira_servicedesk_id

jira_url 

jira_user 


Once you have set up all of those parameters, it should now look like this:

The result

Now, if all of the information from the previous steps is filled in, we can test the integration. Navigate to Monitoring -> Problems and click on any of the problem names:

Which will open a dropdown menu. Go to ServiceDesk and click the Create Jira ticket button.

This will then kick of our new Zabbix frontend script. The webhook script will be using the Jira API to create a ticket and voila:

A ticket is created, right from the frontend. It’s just that easy.

Conclusion

Using Media Types is great and I would definitely recommend using them. If you have set up the correct filtering using host groups, severities, tags and perhaps more than that, you can already keep the ticket count to a minimum. But there’s always a downside to using a lot of filters, you might miss something. That’s where our Frontend Script implementation kicks in. Maybe your filter missed a ticket, maybe you don’t want automated tickets at all. We can use the script to manually create tickets, quickly from the frontend and solve that issue.

You’ve now got a powerful way to do so, fully compatible with Zabbix most of the times out of the box! As Zabbix adds more and more of this functionality it becomes easier and easier to do so, if you just know where to look.

I hope you enjoyed reading this blog post and if you have any questions or need help configuring anything on your Zabbix setup feel free to contact me and the team at Opensource ICT Solutions. We build a ton of cool integrations like this and much more!

Nathan Liefting

https://oicts.com

A close up of a logo Description automatically generated