Tag Archives: Largest Contentful Paint (LCP)

Are you measuring what matters? A fresh look at Time To First Byte

Post Syndicated from Sam Marsh original http://blog.cloudflare.com/ttfb-is-not-what-it-used-to-be/

Are you measuring what matters? A fresh look at Time To First Byte

Are you measuring what matters? A fresh look at Time To First Byte

Today, we’re making the case for why Time To First Byte (TTFB) is not a good metric for evaluating how fast web pages load. There are better metrics out there that give a more accurate representation of how well a server or content delivery network performs for end users. In this blog, we’ll go over the ambiguity of measuring TTFB, touch on more meaningful metrics such as Core Web Vitals that should be used instead, and finish on scenarios where TTFB still makes sense to measure.

Many of our customers ask what the best way would be to evaluate how well a network like ours works. This is a good question! Measuring performance is difficult. It’s easy to simplify the question to “How close is Cloudflare to end users?” The predominant metric that’s been used to measure that is round trip time (RTT). This is the time it takes for one network packet to travel from an end user to Cloudflare and back. We measure this metric and mention it from time to time: Cloudflare has an average RTT of 50 milliseconds for 95% of the Internet-connected population.

Whilst RTT is a relatively good indicator of the quality of a network, it doesn’t necessarily tell you that much about how good it is at actually delivering actual websites to end users. For instance, what if the web server is really slow? A user might be very close to the data center that serves the traffic, but if it takes a long time to actually grab the asset from disk and serve it the result will still be a poor experience.

This is where TTFB comes in. It measures the time it takes between a request being sent from an end user until the very first byte of the response being received. This sounds great on paper! However it doesn’t capture how a webpage or web application loads, and what happens after the first byte is received.

In this blog we’ll cover what TTFB is a good indicator of, what it's not great for, and what you should be using instead.

What is TTFB?

TTFB is a metric which reports the duration between sending the request from the client to a server for a given file, and the receipt of the first byte of said file. For example, if you were to download the Cloudflare logo from our website the TTFB would be how long it took to receive the first byte of that image. Similarly, if you were to measure the TTFB of a request to cloudflare.com the metric would return the TTFB of how long it took from request to receiving the first byte of the first HTTP response. Not how long it took for the image to be fully visible or for the web page to be loaded in a state that allowed a user to begin using it.

The simplest answer therefore is to look at the diametrically opposite measurement, Time to Last Byte (TTLB). TTLB, as you’d expect, measures how long it takes until the last byte of data is received from the server. For the Cloudflare logo file this would make sense, as until the image is fully downloaded it's not exactly useful. But what about for a webpage? Do you really need to wait until every single file is fully downloaded, even those images at the bottom of the page you can't immediately see? TTLB is fine for measuring how long it took to download a single file from a CDN / server. However for multi-faceted traffic, like web pages, it is too conservative, as it doesn’t tell you how long it took for the web page to be usable.

As an analogy we can look at measuring how long it takes to process an incoming airplane full of passengers. What's important is to understand how long it takes for those passengers to disembark, pass through passport control, collect their baggage and leave the terminal, if no onward journeys. TTFB would measure success as how long it took to get the first passenger off of the airplane. TTLB would measure how long it took the last passenger to leave the terminal, even if this passenger remained in the terminal for hours afterwards due to passport issues or getting lost. Neither are a good measure of success for the airline.

Why TTFB doesn't make sense

TTFB is a widely-used metric because it is easy-to-understand and it is a great signal for connection setup time, server time and network latency. It can help website owners identify when performance issues originate from their server. But is TTFB a good signal for how real users experience the loading speed of a web page in a browser?

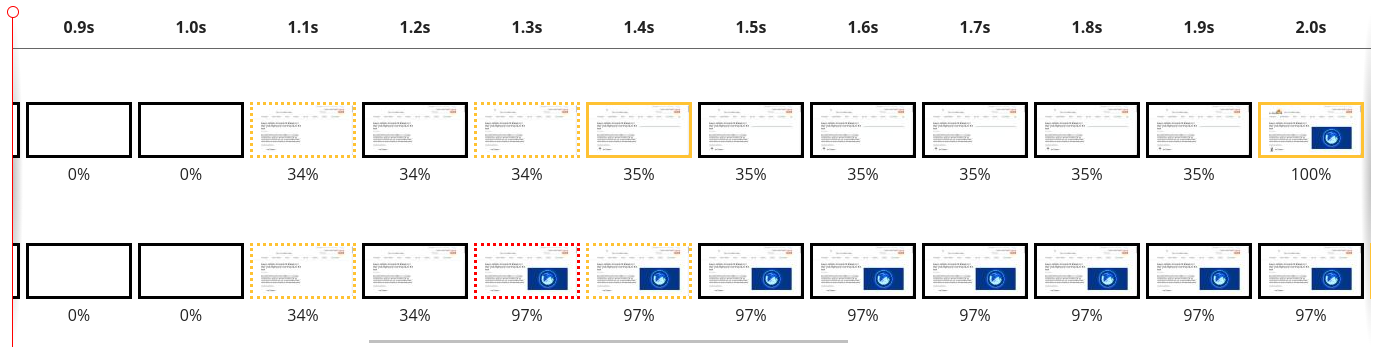
When a web page loads in a browser, the user’s perception of speed isn’t related to the moment the browser first receives bytes of data. It is related to when the user starts to see the page rendering on the screen.

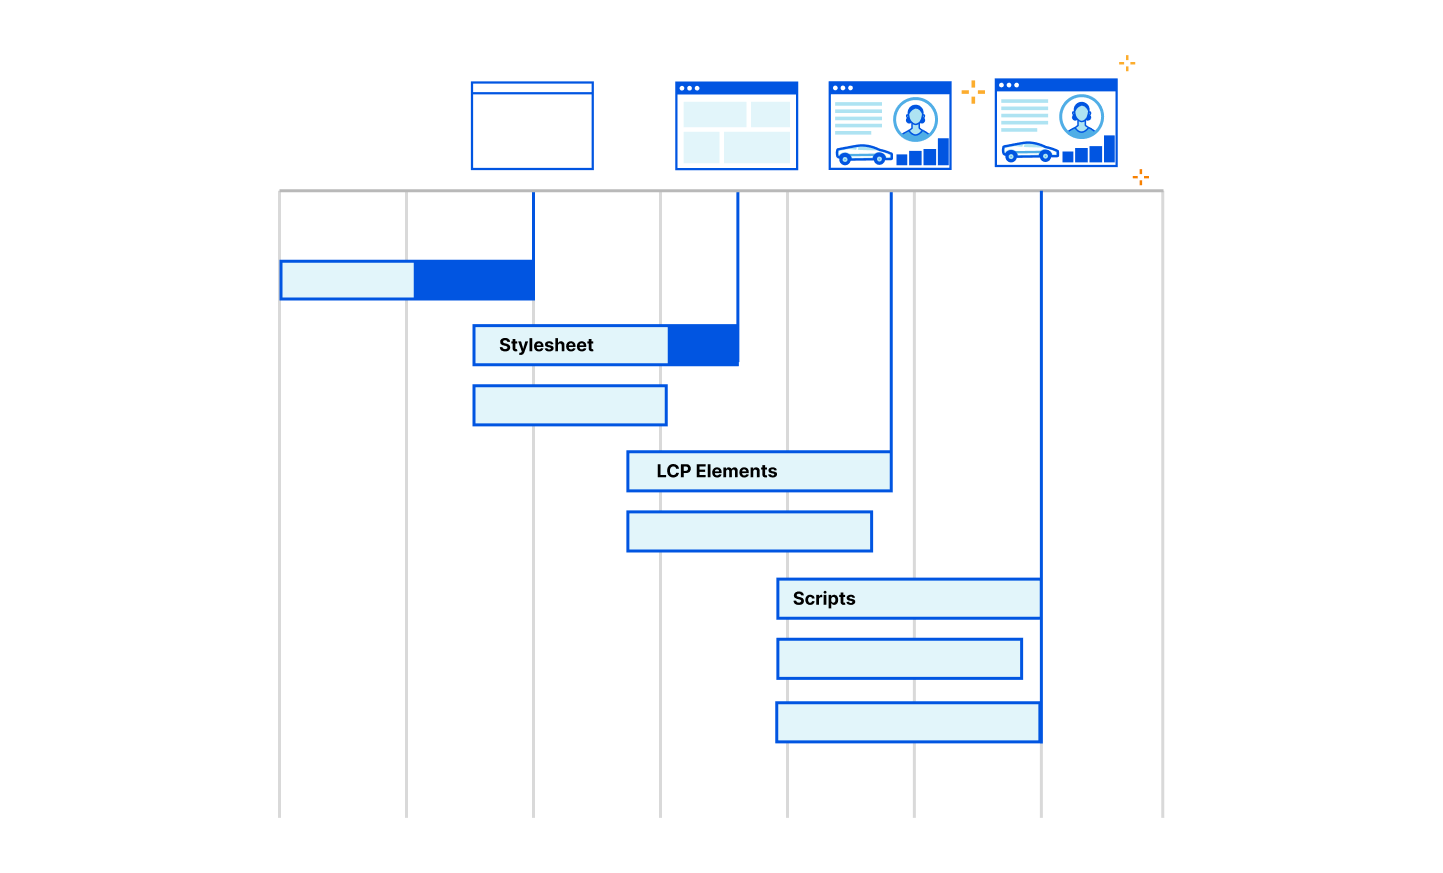
The loading of a web page in a browser is a very complex process. Almost all of this process happens after TTFB is reported. After the first byte has been received, the browser still has to load the main HTML file. It also has to load fonts, stylesheets, javascript, images and other resources. Often these resources link to other resources that also must be downloaded. Often these resources entirely block the rendering of the page. Alongside all these downloads, the browser is also parsing the HTML, CSS and JavaScript. It is building data structures that represent the content of the web page as well as how it is styled. All of this is in preparation to start rendering the final page onto the screen for the user.

Are you measuring what matters? A fresh look at Time To First Byte

When the user starts seeing the web page actually rendered on the screen, TTFB has become a distant memory for the browser. For a metric that signals the loading speed as perceived by the user, TTFB falls dramatically short.

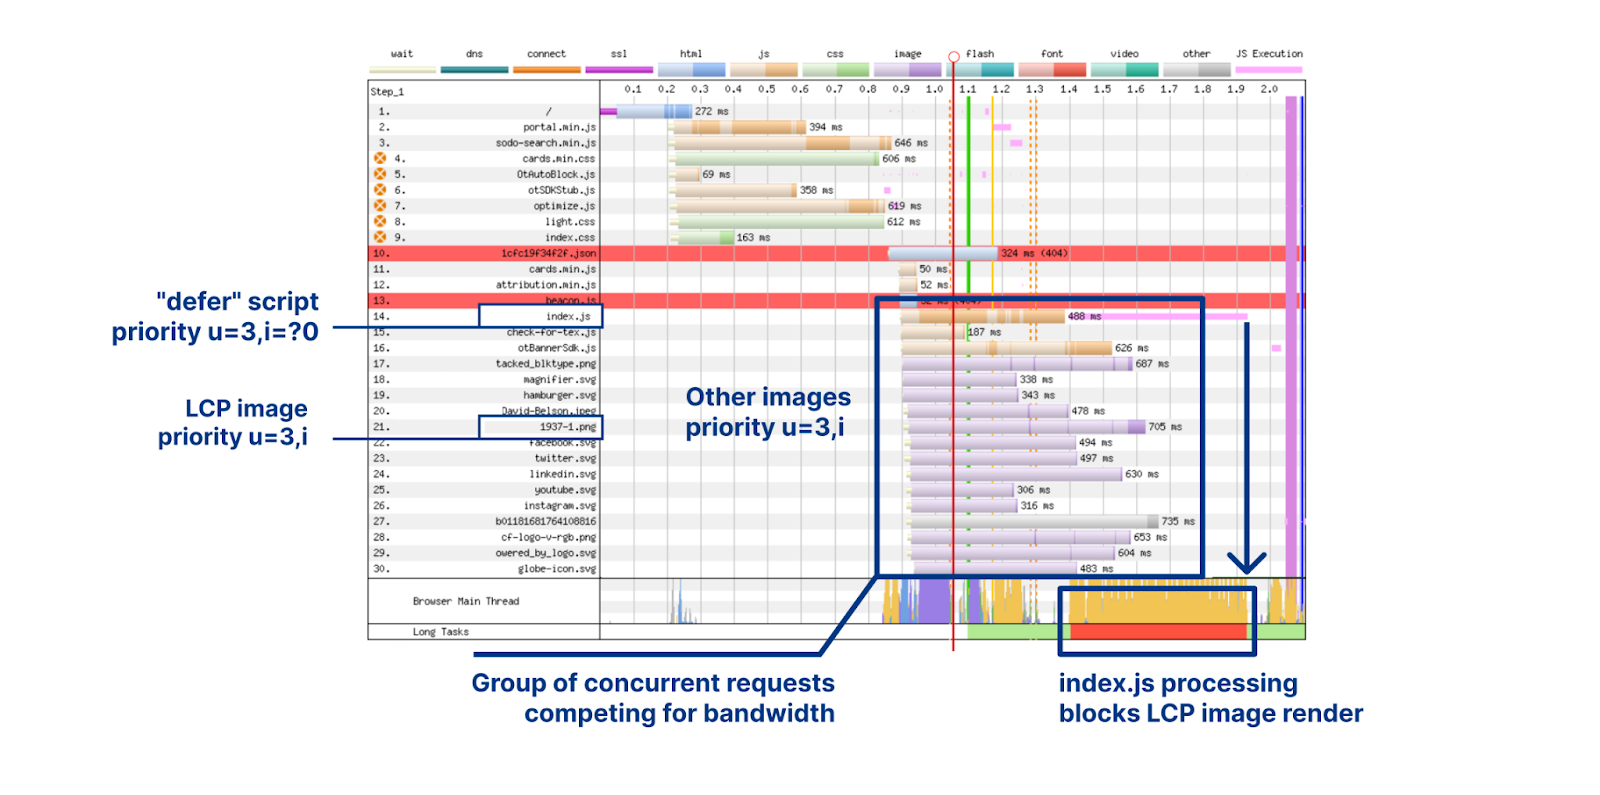
Receiving the first byte isn't sufficient to determine a good end user experience as most pages have additional render blocking resources that get loaded after the initial document request. Render-blocking resources are scripts, stylesheets, and HTML imports that prevent a web page from loading quickly. From a TTFB perspective it means the client could stop the ‘TTFB clock’ on receipt of the first byte of one of these files, but the web browser is blocked from showing anything to the user until the remaining critical assets are downloaded.

This is because browsers need instructions for what to render and what resources need to be fetched to complete “painting” a given web page. These instructions come from a server response. But the servers sending these responses often need time to compile these resources — this is known as “server think time.” While the servers are busy during this time… browsers sit idle and wait. And the TTFB counter goes up.

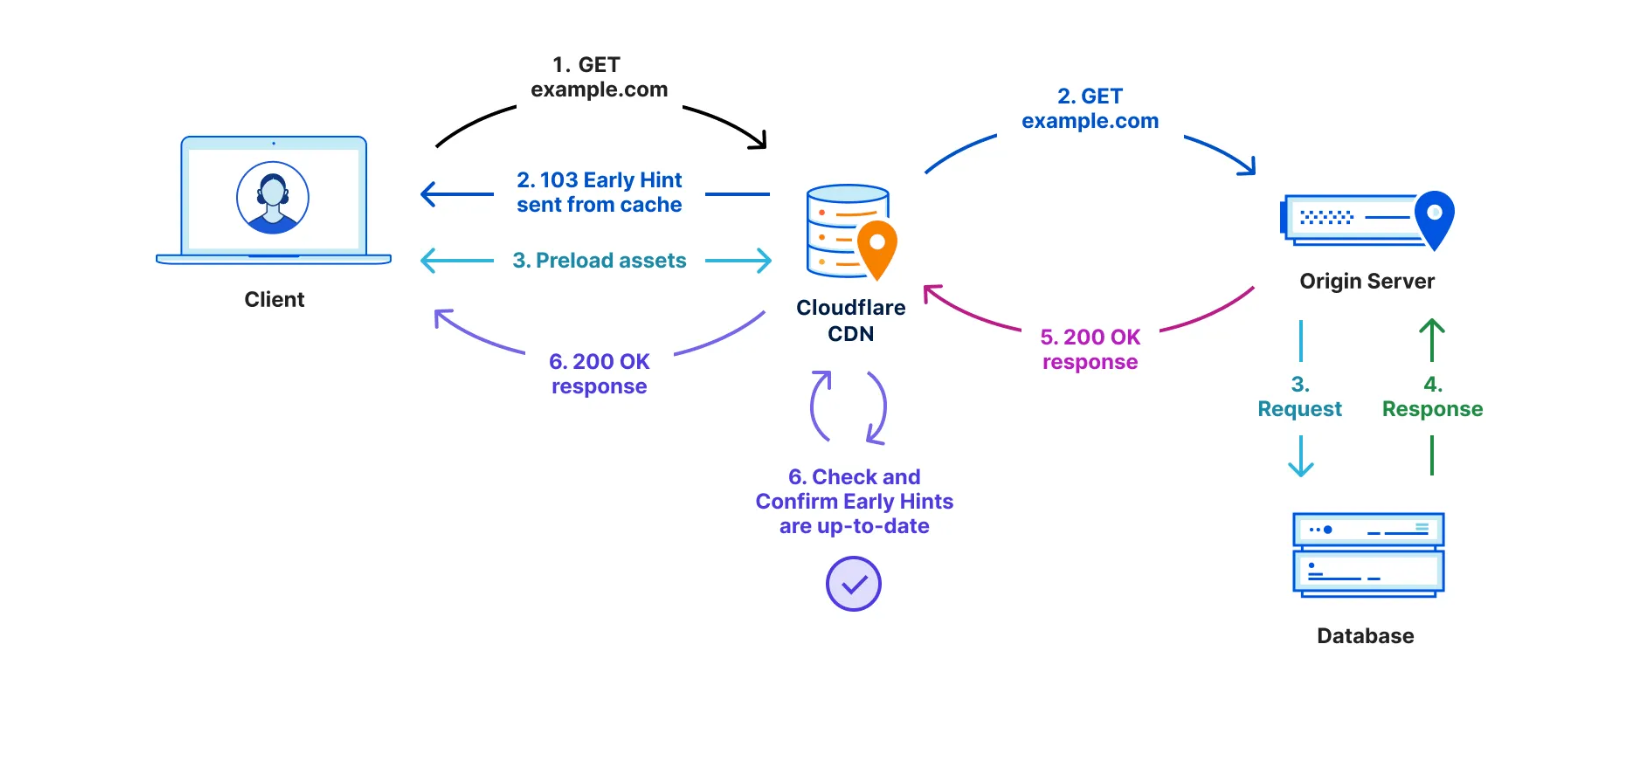
There have been a number of attempts over the years to benefit from this “think time”. First came Server Push, which was superseded last year by Early Hints. Early Hints take advantage of “server think time” to asynchronously send instructions to the browser to begin loading resources while the origin server is compiling the full response. By sending these hints to a browser before the full response is prepared, the browser can figure out what it needs to do to load the webpage faster for the end user. It also stops the TTFB clock, meaning a lower TTFB. This helps ensure the browser gets the critical files sooner to begin loading the webpage, and it also means the first byte is delivered sooner as there is no waiting on the server for the whole dataset to be prepared and ready to send. Even with Early Hints, though, TTFB doesn’t accurately define how long it took the web page to be in a usable state.

Are you measuring what matters? A fresh look at Time To First Byte

TTFB also does not take into account multiplexing benefits of HTTP/2 and HTTP/3 which allow browsers to load files in parallel. It also doesn't take into account compression on the origin, which would result in a higher TTFB but a quicker page load overall due to the time the server took to compress the assets and send them in a small format over the network.

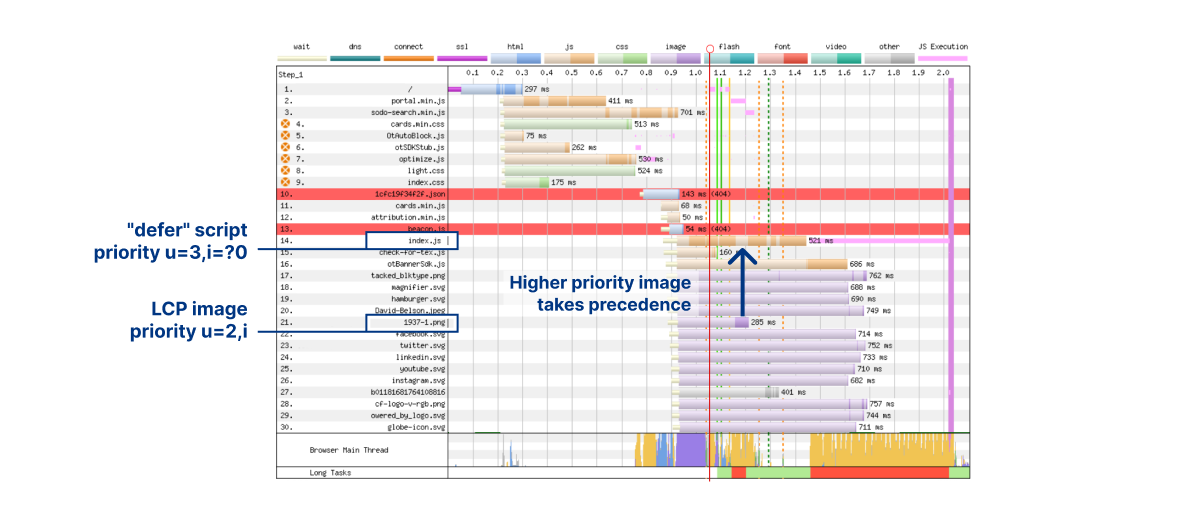
Cloudflare offers many features that can improve the loading speed of a website, but don’t necessarily impact the TTFB score. These features include Zaraz, Rocket Loader, HTTP/2 and HTTP/3 Prioritization, Mirage, Polish, Image Resizing, Auto Minify and Cache. These features improve the loading time of a webpage, ensuring they load optimally through a series of enhancements from image optimization and compression to render blocking elimination by optimizing the sending of assets from the server to the browser in the best possible order.

More comprehensive metrics are required to illustrate the full loading process of a web page, and the benefit provided by these features. This is where Real User Monitoring helps.  At Cloudflare we are all-in on Real User Monitoring (RUM) as the future of website performance. We’re investing heavily in it: both from an observation point of view and from an optimization one also.

For those unfamiliar with RUM, we typically optimize websites for three main metrics – known as the “Core Web Vitals”. This is a set of key metrics which are believed to be the best and most accurate representation of a poorly performing website vs a well performing one. These key metrics are Largest Contentful Paint, First Input Delay and Cumulative Layout Shift.

Are you measuring what matters? A fresh look at Time To First Byte
Source: https://addyosmani.com/blog/web-vitals-extension/ 

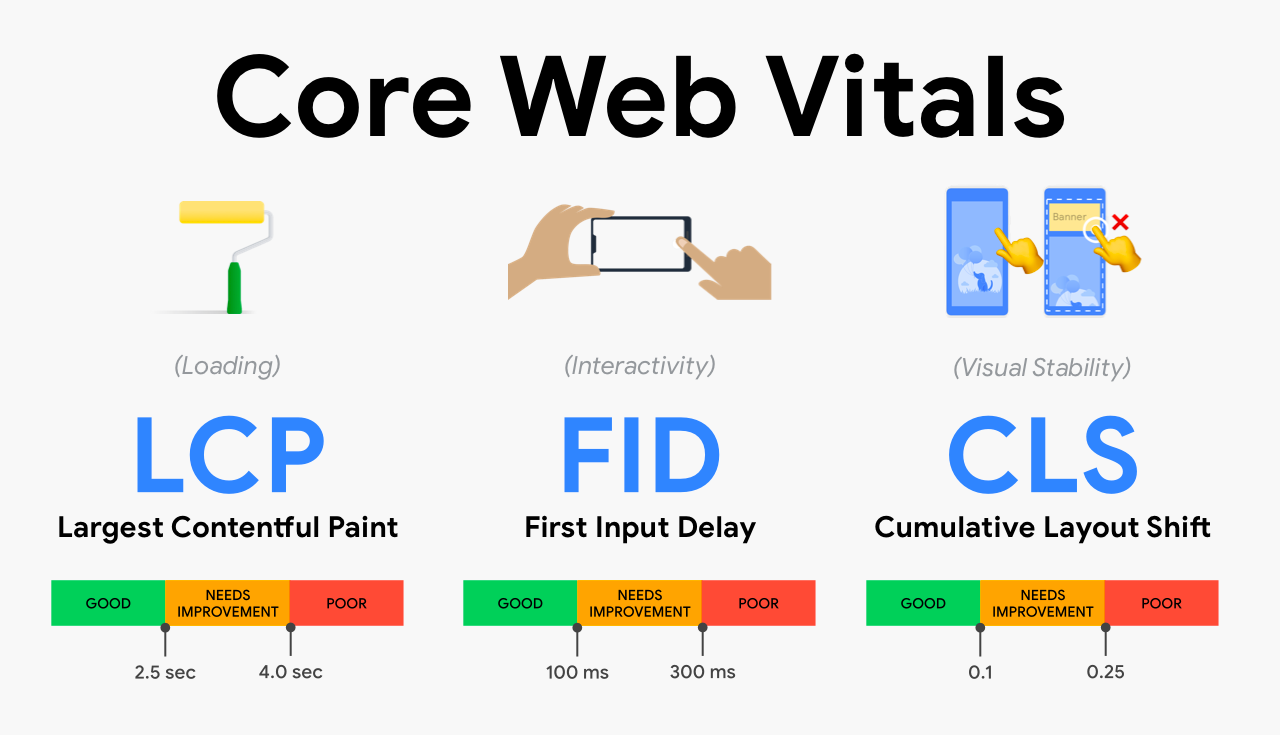
LCP measures loading performance; typically how long it takes to load the largest image or text block visible in the browser. FID measures interactivity. For example, the time between when a user clicks or taps on a button to when the browser responds and starts doing something. Finally, CLS measures visual stability. A good, or bad example of CLS is when you go to a website on your mobile phone, tap on a link and the page moves at the last second meaning you tap something you didn't want to. That would be a lower CLS score as its poor user experience.

Looking at these metrics gives us a good idea of how the end user is truly experiencing your website (RUM) vs. how quickly the first byte of the file was retrieved from the nearest Cloudflare data center (TTFB).

Good TTFB, bad user experience

One of the “sub parts” that comprise LCP is TTFB. That means a poor TTFB is very likely to result in a poor LCP. If it takes you 20 seconds to retrieve the first byte of the first image, your user isn't going to have a good experience – regardless of your outlook on TTFB vs RUM.

Conversely, we found that a good TTFB does not always mean a good LCP score, or FID or CLS. We ran a query to collect RUM metrics of web pages we served which had a good TTFB score. Good is defined as a TTFB as less than 800ms. This allowed us to ask the question: TTFB says these websites are good. Does the RUM data support that?

We took four distinct samples from our RUM data in June. Each sample had a different date-range and sample-rate combination. In each sample we queried for 200,000 page views. From these 200,000 page views we filtered for only the page views that reported a 'Good' TTFB. Across the samples, of all page views that have a good TTFB, about 21% of them did not have a “good” LCP score. 46% of them did not have a “good” FID score. And 57% of them did not have a good CLS score.

This clearly shows the disparity between measuring the time it takes to receive the first byte of traffic, vs the time it takes for a webpage to become stable and interactive. In summary, LCP includes TTFB but also includes other parts of the loading experience. LCP is a more comprehensive, user-centric metric.

TTFB is not all bad

Reading this post and others from Speed Week 2023 you may conclude we really don't like TTFB and you should stop using it. That isn't the case.

There are a few situations where TTFB does matter. For starters, there are many applications that aren’t websites. File servers, APIs and all sorts of streaming protocols don’t have the same semantics as web pages and the best way to objectively measure performance is to in fact look at exactly when the first byte is returned from a server.

To help optimize TTFB for these scenarios we are announcing Timing Insights, a new analytics tool to help you understand what is contributing to "Time to First Byte" (TTFB) of Cloudflare and your origin. Timing Insights breaks down TTFB from the perspective of our servers to help you understand what is slow, so that you can begin addressing it.

Get started with RUM today

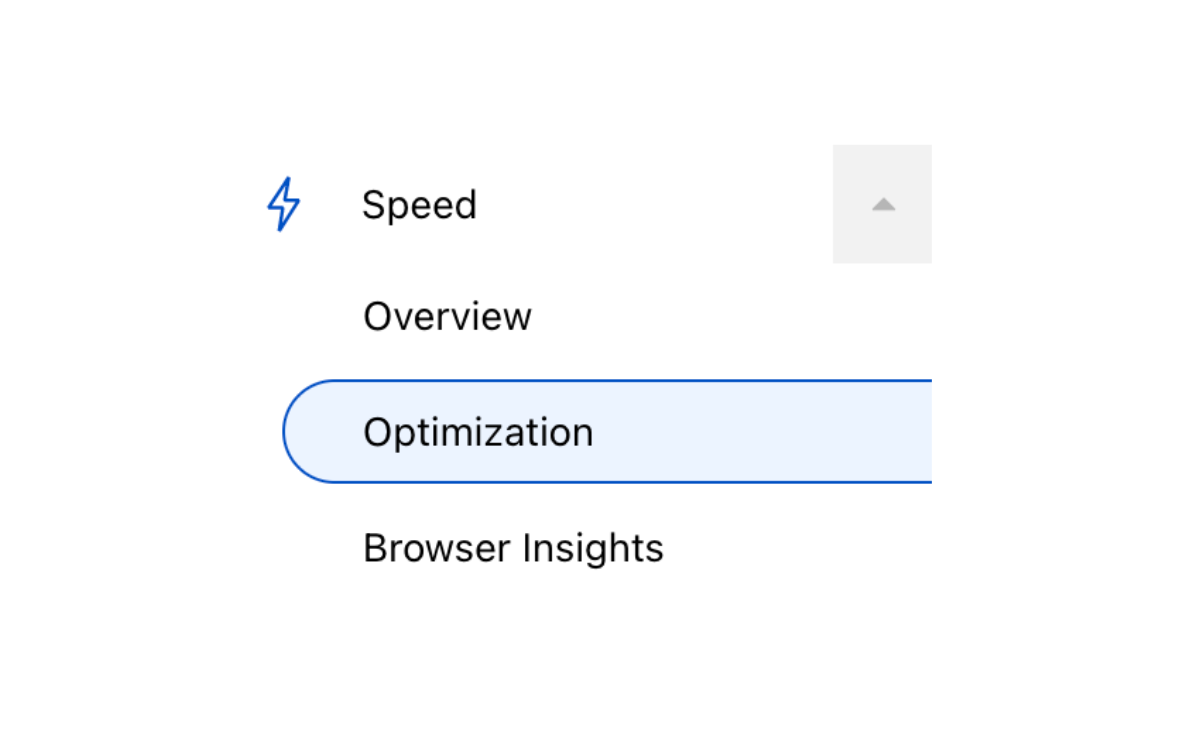
To help you understand the real user experience of your website we have today launched Cloudflare Observatory the new home of performance at Cloudflare.

Are you measuring what matters? A fresh look at Time To First Byte

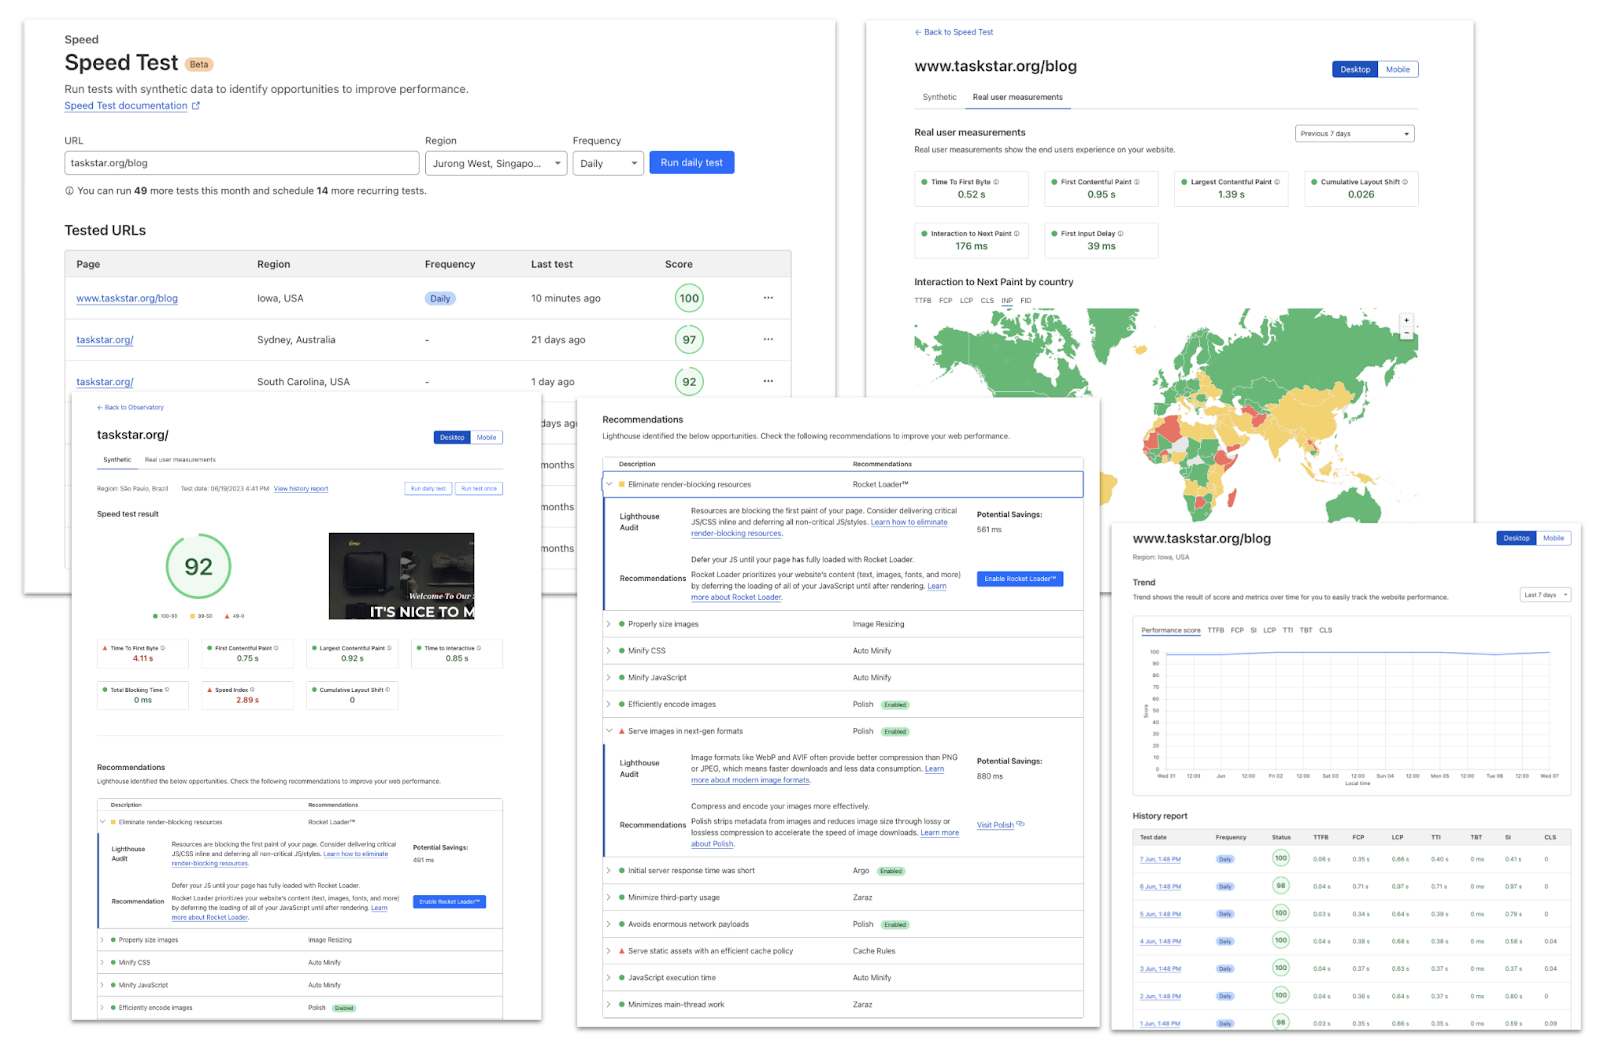
Cloudflare users can now easily monitor website performance using Real User Monitoring (RUM) data along with scheduled synthetic tests from different regions in a single dashboard. This will identify any performance issues your website may have. The best bit? Once we’ve identified any issues, Observatory will highlight customized recommendations to resolve these issues, all with a single click.

Start making your website faster today with Observatory.

Introducing HTTP/3 Prioritization

Post Syndicated from Lucas Pardue original http://blog.cloudflare.com/better-http-3-prioritization-for-a-faster-web/

Introducing HTTP/3 Prioritization

Introducing HTTP/3 Prioritization

Today, Cloudflare is very excited to announce full support for HTTP/3 Extensible Priorities, a new standard that speeds the loading of webpages by up to 37%. Cloudflare worked closely with standards builders to help form the specification for HTTP/3 priorities and is excited to help push the web forward. HTTP/3 Extensible Priorities is available on all plans on Cloudflare. For paid users, there is an enhanced version available that improves performance even more.

Web pages are made up of many objects that must be downloaded before they can be processed and presented to the user. Not all objects have equal importance for web performance. The role of HTTP prioritization is to load the right bytes at the most opportune time, to achieve the best results. Prioritization is most important when there are multiple objects all competing for the same constrained resource. In HTTP/3, this resource is the QUIC connection. In most cases, bandwidth is the bottleneck from server to client. Picking what objects to dedicate bandwidth to, or share bandwidth amongst, is a critical foundation to web performance. When it goes askew, the other optimizations we build on top can suffer.

Today, we're announcing support for prioritization in HTTP/3, using the full capabilities of the HTTP Extensible Priorities (RFC 9218) standard, augmented with Cloudflare's knowledge and experience of enhanced HTTP/2 prioritization. This change is compatible with all mainstream web browsers and can improve key metrics such as Largest Contentful Paint (LCP) by up to 37% in our test. Furthermore, site owners can apply server-side overrides, using Cloudflare Workers or directly from an origin, to customize behavior for their specific needs.

Looking at a real example

The ultimate question when it comes to features like HTTP/3 Priorities is: how well does this work and should I turn it on? The details are interesting and we'll explain all of those shortly but first lets see some demonstrations.

In order to evaluate prioritization for HTTP/3, we have been running many simulations and tests. Each web page is unique. Loading a web page can require many TCP or QUIC connections, each of them idiosyncratic. These all affect how prioritization works and how effective it is.

To evaluate the effectiveness of priorities, we ran a set of tests measuring Largest Contentful Paint (LCP). As an example, we benchmarked blog.cloudflare.com to see how much we could improve performance:

As a film strip, this is what it looks like:

Introducing HTTP/3 Prioritization

In terms of actual numbers, we see Largest Contentful Paint drop from 2.06 seconds down to 1.29 seconds. Let’s look at why that is. To analyze exactly what’s going on we have to look at a waterfall diagram of how this web page is loading. A waterfall diagram is a way of visualizing how assets are loading. Some may be loaded in parallel whilst some might be loaded sequentially. Without smart prioritization, the waterfall for loading assets for this web page looks as follows:

Introducing HTTP/3 Prioritization

There are several interesting things going on here so let's break it down. The LCP image at request 21 is for 1937-1.png, weighing 30.4 KB. Although it is the LCP image, the browser requests it as priority u=3,i, which informs the server to put it in the same round-robin bandwidth-sharing bucket with all of the other images. Ahead of the LCP image is index.js, a JavaScript file that is loaded with a "defer" attribute. This JavaScript is non-blocking and shouldn't affect key aspects of page layout.

What appears to be happening is that the browser gives index.js the priority u=3,i=?0, which places it ahead of the images group on the server-side. Therefore, the 217 KB of index.js is sent in preference to the LCP image. Far from ideal. Not only that, once the script is delivered, it needs to be processed and executed. This saturates the CPU and prevents the LCP image from being painted, for about 300 milliseconds, even though it was delivered already.

The waterfall with prioritization looks much better:

Introducing HTTP/3 Prioritization

We used a server-side override to promote the priority of the LCP image 1937-1.png from u=3,i to u=2,i. This has the effect of making it leapfrog the "defer" JavaScript. We can see at around 1.2 seconds, transmission of index.js is halted while the image is delivered in full. And because it takes another couple of hundred milliseconds to receive the remaining JavaScript, there is no CPU competition for the LCP image paint. These factors combine together to drastically improve LCP times.

How Extensible Priorities actually works

First of all, you don't need to do anything yourselves to make it work. Out of the box, browsers will send Extensible Priorities signals alongside HTTP/3 requests, which we'll feed into our priority scheduling decision making algorithms. We'll then decide the best way to send HTTP/3 response data to ensure speedy page loads.

Extensible Priorities has a similar interaction model to HTTP/2 priorities, client send priorities and servers act on them to schedule response data, we'll explain exactly how that works in a bit.

HTTP/2 priorities used a dependency tree model. While this was very powerful it turned out hard to implement and use. When the IETF came to try and port it to HTTP/3 during the standardization process, we hit major issues. If you are interested in all that background, go and read my blog post describing why we adopted a new approach to HTTP/3 prioritization.

Extensible Priorities is a far simpler scheme. HTTP/2's dependency tree with 255 weights and dependencies (that can be mutual or exclusive) is complex, hard to use as a web developer and could not work for HTTP/3. Extensible Priorities has just two parameters: urgency and incremental, and these are capable of achieving exactly the same web performance goals.

Urgency is an integer value in the range 0-7. It indicates the importance of the requested object, with 0 being most important and 7 being the least. The default is 3. Urgency is comparable to HTTP/2 weights. However, it's simpler to reason about 8 possible urgencies rather than 255 weights. This makes developer's lives easier when trying to pick a value and predicting how it will work in practice.

Incremental is a boolean value. The default is false. A true value indicates the requested object can be processed as parts of it are received and read – commonly referred to as streaming processing. A false value indicates the object must be received in whole before it can be processed.

Let's consider some example web objects to put these parameters into perspective:

  • An HTML document is the most important piece of a webpage. It can be processed as parts of it arrive. Therefore, urgency=0 and incremental=true is a good choice.
  • A CSS style is important for page rendering and could block visual completeness. It needs to be processed in whole. Therefore, urgency=1 and incremental=false is suitable, this would mean it doesn't interfere with the HTML.
  • An image file that is outside the browser viewport is not very important and it can be processed and painted as parts arrive. Therefore, urgency=3 and incremental=true is appropriate to stop it interfering with sending other objects.
  • An image file that is the "hero image" of the page, making it the Largest Contentful Pain element. An urgency of 1 or 2 will help it avoid being mixed in with other images. The choice of incremental value is a little subjective and either might be appropriate.

When making an HTTP request, clients decide the Extensible Priority value composed of the urgency and incremental parameters. These are sent either as an HTTP header field in the request (meaning inside the HTTP/3 HEADERS frame on a request stream), or separately in an HTTP/3 PRIORITY_UPDATE frame on the control stream. HTTP headers are sent once at the start of a request; a client might change its mind so the PRIORITY_UPDATE frame allows it to reprioritize at any point in time.

For both the header field and PRIORITY_UPDATE, the parameters are exchanged using the Structured Fields Dictionary format (RFC 8941) and serialization rules. In order to save bytes on the wire, the parameters are shortened – urgency to 'u', and incremental to 'i'.

Here's how the HTTP header looks alongside a GET request for important HTML, using HTTP/3 style notation:

HEADERS:
    :method = GET
    :scheme = https
    :authority = example.com
    :path = /index.html
     priority = u=0,i

The PRIORITY_UPDATE frame only carries the serialized Extensible Priority value:

PRIORITY_UPDATE:
    u=0,i

Structured Fields has some other neat tricks. If you want to indicate the use of a default value, then that can be done via omission. Recall that the urgency default is 3, and incremental default is false. A client could send "u=1" alongside our important CSS request (urgency=1, incremental=false). For our lower priority image it could send just "i=?1" (urgency=3, incremental=true). There's even another trick, where boolean true dictionary parameters are sent as just "i". You should expect all of these formats to be used in practice, so it pays to be mindful about their meaning.

Extensible Priority servers need to decide how best to use the available connection bandwidth to schedule the response data bytes. When servers receive priority client signals, they get one form of input into a decision making process. RFC 9218 provides a set of scheduling recommendations that are pretty good at meeting a board set of needs. These can be distilled down to some golden rules.

For starters, the order of requests is crucial. Clients are very careful about asking for things at the moment they want it. Serving things in request order is good. In HTTP/3, because there is no strict ordering of stream arrival, servers can use stream IDs to determine this. Assuming the order of the requests is correct, the next most important thing is urgency ordering. Serving according to urgency values is good.

Be wary of non-incremental requests, as they mean the client needs the object in full before it can be used at all. An incremental request means the client can process things as and when they arrive.

With these rules in mind, the scheduling then becomes broadly: for each urgency level, serve non-incremental requests in whole serially, then serve incremental requests in round robin fashion in parallel. What this achieves is dedicated bandwidth for very important things, and shared bandwidth for less important things that can be processed or rendered progressively.

Let's look at some examples to visualize the different ways the scheduler can work. These are generated by using quiche's qlog support and running it via the qvis analysis tool. These diagrams are similar to a waterfall chart; the y-dimension represents stream IDs (0 at the top, increasing as we move down) and the x-dimension shows reception of stream data.

Example 1: all streams have the same urgency and are non-incremental so get served in serial order of stream ID.

Introducing HTTP/3 Prioritization

Example 2: the streams have the same urgency and are incremental so get served in round-robin fashion.

Introducing HTTP/3 Prioritization

Example 3: the streams have all different urgency, with later streams being more important than earlier streams. The data is received serially but in a reverse order compared to example 1.

Introducing HTTP/3 Prioritization

Beyond the Extensible Priority signals, a server might consider other things when scheduling, such as file size, content encoding, how the application vs content origins are configured etc.. This was true for HTTP/2 priorities but Extensible Priorities introduces a new neat trick, a priority signal can also be sent as a response header to override the client signal.

This works especially well in a proxying scenario where your HTTP/3 terminating proxy is sat in front of some backend such as Workers. The proxy can pass through the request headers to the backend, it can inspect these and if it wants something different, return response headers to the proxy. This allows powerful tuning possibilities and because we operate on a semantic request basis (rather than HTTP/2 priorities dependency basis) we don't have all the complications and dangers. Proxying isn't the only use case. Often, one form of "API" to your local server is via setting response headers e.g., via configuration. Leveraging that approach means we don't have to invent new APIs.

Let's consider an example where server overrides are useful. Imagine we have a webpage with multiple images that are referenced via <img> tags near the top of the HTML. The browser will process these quite early in the page load and want to issue requests. At this point, it might not know enough about the page structure to determine if an image is in the viewport or outside the viewport. It can guess, but that might turn out to be wrong if the page is laid out a certain way. Guessing wrong means that something is misprioritized and might be taking bandwidth away from something that is more important. While it is possible to reprioritize things mid-flight using the PRIORITY_UPDATE frame, this action is "laggy" and by the time the server realizes things, it might be too late to make much difference.

Fear not, the web developer who built the page knows exactly how it is supposed to be laid out and rendered. They can overcome client uncertainty by overriding the Extensible Priority when they serve the response. For instance, if a client guesses wrong and requests the LCP image at a low priority in a shared bandwidth bucket, the image will load slower and web performance metrics will be adversely affected. Here's how it might look and how we can fix it:

Request HEADERS:
    :method = GET
    :scheme = https
    :authority = example.com
    :path = /lcp-image.jpg
     priority = u=3,i

Response HEADERS:
:status = 200
content-length: 10000
content-type: image/jpeg
priority = u=2

Priority response headers are one tool to tweak client behavior and they are complementary to other web performance techniques. Methods like efficiently ordering elements in HTML, using attributes like "async" or "defer", augmenting HTML links with Link headers, or using more descriptive link relationships like “preload” all help to improve a browser's understanding of the resources comprising a page. A website that optimizes these things provides a better chance for the browser to make the best choices for prioritizing requests.

More recently, a new attribute called “fetchpriority” has emerged that allows developers to tune some of the browser behavior, by boosting or dropping the priority of an element relative to other elements of the same type. The attribute can help the browser do two important things for Extensible priorities: first, the browser might send the request earlier or later, helping to satisfy our golden rule #1 – ordering. Second, the browser might pick a different urgency value, helping to satisfy rule #2. However, "fetchpriority" is a nudge mechanism and it doesn't allow for directly setting a desired priority value. The nudge can be a bit opaque. Sometimes the circumstances benefit greatly from just knowing plainly what the values are and what the server will do, and that's where the response header can help.

Conclusions

We’re excited about bringing this new standard into the world. Working with standards bodies has always been an amazing partnership and we’re very pleased with the results. We’ve seen great results with HTTP/3 priorities, reducing Largest Contentful Paint by up to 37% in our test. If you’re interested in turning on HTTP/3 priorities for your domain, just head on over to the Cloudflare dashboard and hit the toggle.

Automatic Signed Exchanges may dramatically boost your site visitor numbers

Post Syndicated from Joao Sousa Botto original https://blog.cloudflare.com/automatic-signed-exchanges-desktop-android/

Automatic Signed Exchanges may dramatically boost your site visitor numbers

Automatic Signed Exchanges may dramatically boost your site visitor numbers

It’s been about nine months since Cloudflare announced support for Signed Exchanges (SXG), a web platform specification to deterministically verify the cached version of a website and enable third parties such as search engines and news aggregators to serve it much faster than the origin ever could.

Giving Internet users fast load times, even on slow connections in remote parts of the globe, is to help build a better Internet (our mission!) and we couldn’t be more excited about the potential of SXG.
Signed Exchanges drive quite impressive benefits in terms of performance improvements. Google’s experiments have shown an average 300ms to 400ms reduction in Largest Contentful Paint (LCP) from SXG-enabled prefetches.  And speeding up your website usually results in a significant bounce rate reduction and improved SEO.

faster websites= better SEO and lower bounce rates

And if setting up and maintaining SXGs through the open source toolkit is a complex yet very valuable endeavor, with Cloudflare’s Automatic Signed Exchanges it becomes a no-brainer. Just enable it with one click and see for yourself.

Automatic Signed Exchanges may dramatically boost your site visitor numbers

Our own measurements

Now that Signed Exchanges have been available on Chromium for Android for several months we dove into the change in performance our customers have experienced in the real world.

We picked the 500 most visited sites that have Automatic Signed Exchanges enabled and saw that 425 of them (85%) saw an improvement in LCP, which is widely considered as the Core Web Vital with the most impact on SEO and where SXG should make the biggest difference.

Out of those same 500 Cloudflare sites 389 (78%) saw an improvement in First Contentful Paint (FCP) and a whopping 489 (98%) saw an improvement in Time to First Byte (TTFB). The TTFB improvement measured here is an interesting case since if the exchange has already been prefetched, when the user clicks on the link the resource is already in the client browser cache and the TTFB measurement becomes close to zero.

Overall, the median customer saw an improvement of over 20% across these metrics. Some customers saw improvements of up to 80%.

There were also a few customers that did not see an improvement, or saw a slight degradation of their metrics.

One of the main reasons for this is that SXG wasn’t compatible with server-side personalization (e.g., serving different HTML for logged-in users) until today. To solve that, today Google added ‘Dynamic SXG’, that selectively enables SXG for visits from cookieless users only (more details on the Google blog post here). Dynamic SXG are supported today – all you need to do is add a `Vary: Cookie’ annotation to the HTTP header of pages that contain server-side personalization.

Note: Signed Exchanges are compatible with client-side personalization (lazy-loading).

To see what the Core Web Vitals look like for your own users across the world we recommend a RUM solution such as our free and privacy-first Web Analytics.

Now available for Desktop and Android

Starting today, Signed Exchanges is also supported by Chromium-based desktop browsers, including Chrome, Edge and Opera.

If you enabled Automatic Signed Exchanges on your Cloudflare dashboard, no further action is needed – the supported desktop browsers will automatically start being served the SXG version of your site’s content. Google estimates that this release will, on average, double SXG’s coverage of your site’s visits, enabling improved loading and performance for more users.

And if you haven’t yet enabled it but are curious about the impact SXG will have on your site, Automatic Signed Exchanges is available through the Speed > Optimization link on your Cloudflare dashboard (more details here).

Automatic Signed Exchanges may dramatically boost your site visitor numbers