In September 2025, a thread popped up in our internal engineering chat room asking, “Which part of our stack would be responsible for sending ErrCode=ENHANCE_YOUR_CALM to an HTTP/2 client?” Two internal microservices were experiencing a critical error preventing their communication and the team needed a timely answer.
In this blog post, we describe the background to well-known HTTP/2 attacks that trigger Cloudflare defences, which close connections. We then document an easy-to-make mistake using Go’s standard library that can cause clients to send PING flood attacks and how you can avoid it.
HTTP/2 is powerful – but it can be easy to misuse
HTTP/2 defines a binary wire format for encoding HTTP semantics. Request and response messages are encoded as a series of HEADERS and DATA frames, each associated with a logical stream, sent over a TCP connection using TLS. There are also control frames that relate to the management of streams or the connection as a whole. For example, SETTINGS frames advertise properties of an endpoint, WINDOW_UPDATE frames provide flow control credit to a peer so that it can send data, RST_STREAM can be used to cancel or reject a request or response, while GOAWAY can be used to signal graceful or immediate connection closure.
HTTP/2 provides many powerful features that have legitimate uses. However, with great power comes responsibility and opportunity for accidental or intentional misuse. The specification details a number of denial-of-service considerations. Implementations are advised to harden themselves: “An endpoint that doesn’t monitor use of these features exposes itself to a risk of denial of service. Implementations SHOULD track the use of these features and set limits on their use.”
Cloudflare implements many different HTTP/2 defenses, developed over years in order to protect our systems and our customers. Some notable examples include mitigations added in 2019 to address “Netflix vulnerabilities” and in 2023 to mitigate Rapid Reset and similar style attacks.
When Cloudflare detects that HTTP/2 client behaviour is likely malicious, we close the connection using the GOAWAY frame and include the error code ENHANCE_YOUR_CALM.
One of the well-known and common attacks is CVE-2019-9512, aka PING flood: “The attacker sends continual pings to an HTTP/2 peer, causing the peer to build an internal queue of responses. Depending on how efficiently this data is queued, this can consume excess CPU, memory, or both.” Sending a PING frame causes the peer to respond with a PING acknowledgement (indicated by an ACK flag). This allows for checking the liveness of the HTTP connection, along with measuring the layer 7 round-trip time – both useful things. The requirement to acknowledge a PING, however, provides the potential attack vector since it generates work for the peer.
A client that PINGs the Cloudflare edge too frequently will trigger our CVE-2019-9512 mitigations, causing us to close the connection. Shortly after we launched support for gRPC in 2020, we encountered interoperability issues with some gRPC clients that sent many PINGs as part of a performance optimization for window tuning. We also discovered that the Rust Hyper crate had a feature called Adaptive Window that emulated the design and triggered a similar problem until Hyper made a fix.
Solving a microservice miscommunication mystery
When that thread popped up asking which part of our stack was responsible for sending the ENHANCE_YOUR_CALM error code, it was regarding a client communicating over HTTP/2 between two internal microservices.
We suspected that this was an HTTP/2 mitigation issue and confirmed it was a PING flood mitigation in our logs. But taking a step back, you may wonder why two internal microservices are communicating over the Cloudflare edge at all, and therefore hitting our mitigations. In this case, communicating over the edge provides us with several advantages:
We get to dogfood our edge infrastructure and discover issues like this!
We can use Cloudflare Access for authentication. This allows our microservices to be accessed securely by both other services (using service tokens) and engineers (which is invaluable for debugging).
Internal services that are written with Cloudflare Workers can easily communicate with services that are accessible at the edge.
The question remained: Why was this client behaving this way? We traded some ideas as we attempted to get to the bottom of the issue.
The client had a configuration that would indicate that it didn’t need to PING very frequently:
However, in situations like this it is generally a good idea to establish ground truth about what is really happening “on the wire.” For instance, grabbing a packet capture that can be dissected and explored in Wireshark can provide unequivocal evidence of precisely what was sent over the network. The next best option is detailed/trace logging at the sender or receiver, although sometimes logging can be misleading, so caveat emptor.
In our particular case, it was simpler to use logging with GODEBUG=http2debug=2. We built a simplified minimal reproduction of the client that triggered the error, helping to eliminate other potential variables. We did some group log analysis, combined with diving into some of the Go standard library code to understand what it was really doing. Issac Asimov is commonly credited with the quote “The most exciting phrase to hear in science, the one that heralds new discoveries, is not ‘Eureka!’ but ‘That’s funny…'” and sure enough, within the hour someone declared–
the funny part I see is this:
2025/09/02 17:33:18 http2: Framer 0x14000624540: wrote RST_STREAM stream=9 len=4 ErrCode=CANCEL
2025/09/02 17:33:18 http2: Framer 0x14000624540: wrote PING len=8 ping="j\xe7\xd6R\xdaw\xf8+"
every ping seems to be preceded by a RST_STREAM
Observant readers will recall the earlier mention of Rapid Reset. However, our logs clearly indicated ENHANCE_YOUR_CALM being triggered due to the PING flood. A bit of searching landed us on this mailing list thread and the comment “Sending a PING frame along with an RST_STREAM allows a client to distinguish between an unresponsive server and a slow response.” That seemed quite relevant. We also found a change that was committed related to this topic. This partly answered why there were so many PINGs, but it also raised a new question: Why so many stream resets?
So we went back to the logs and built up a little more context about the interaction:
2025/09/02 17:33:18 http2: Transport received DATA flags=END_STREAM stream=47 len=0 data=""
2025/09/02 17:33:18 http2: Framer 0x14000624540: wrote RST_STREAM stream=47 len=4 ErrCode=CANCEL
2025/09/02 17:33:18 http2: Framer 0x14000624540: wrote PING len=8 ping="\x97W\x02\xfa>\xa8\xabi"
The interesting thing here is that the server had sent a DATA frame with the END_STREAM flag set. Per the HTTP/2 stream state machine, the stream should have transitioned to closed when a frame with END_STREAM was processed. The client doesn’t need to do anything in this state – sending a RST_STREAM is entirely unnecessary.
A little more digging and noodling and an engineer proclaimed:
I noticed that the reset+ping only happens when you call resp.Body.Close()
I believe Go’s HTTP library doesn’t actually read the response body automatically, but keeps the stream open for you to use until you call resp.Body.Close(), which you can do at any point you like.
The hilarious thing in our example was that there wasn’t actually any HTTP body to read. From the earlier example: received DATA flags=END_STREAM stream=47 len=0 data="".
Science and engineering are at times weird and counterintuitive. We decided to tweak our client to read the (absent) body via io.Copy(io.Discard, resp.Body) before closing it.
Sure enough, this immediately stopped the client sending both a useless RST_STREAM and, by association, a PING frame.
Mystery solved?
To prove we had fixed the root cause, the production client was updated with a similar fix. A few hours later, all the ENHANCE_YOUR_CALM closures were eliminated.
Reading bodies in Go can be unintuitive
It’s worth noting that in some situations, ensuring the response body is always read can sometimes be unintuitive in Go. For example, at first glance it appears that the response body will always be read in the following example:
However, json.Decoder stops reading as soon as it finds a complete JSON document or errors. If the response body contains multiple JSON documents or invalid JSON, then the entire response body may still not be read.
Therefore, in our clients, we’ve started replacing defer response.Body.Close() with the following pattern to ensure that response bodies are always fully read:
Actions to take if you encounter ENHANCE_YOUR_CALM
HTTP/2 is a protocol with several features. Many implementations have implemented hardening to protect themselves from misuse of features, which can trigger a connection to be closed. The recommended error code for closing connections in such conditions is ENHANCE_YOUR_CALM. There are numerous HTTP/2 implementations and APIs, which may drive the use of HTTP/2 features in unexpected ways that could appear like attacks.
If you have an HTTP/2 client that encounters closures with ENHANCE_YOUR_CALM, we recommend that you try to establish ground truth with packet captures (including TLS decryption keys via mechanisms like SSLKEYLOGFILE) and/or detailed trace logging. Look for patterns of frequent or repeated frames that might be similar to malicious traffic. Adjusting your client may help avoid it getting misclassified as an attacker.
If you use Go, we recommend always reading HTTP/2 response bodies (even if empty) in order to avoid sending unnecessary RST_STREAM and PING frames. This is especially important if you use a single connection for multiple requests, which can cause a high frequency of these frames.
This was also a great reminder of the advantages of dogfooding our own products within our internal services. When we run into issues like this one, our learnings can benefit our customers with similar setups.
Have you ever built a piece of IKEA furniture, or put together a LEGO set, by following the instructions closely and only at the end realized at some point you didn’t quite follow them correctly? The final result might be close to what was intended, but there’s a nagging thought that maybe, just maybe, it’s not as rock steady or functional as it could have been.
Internet protocol specifications are instructions designed for engineers to build things. Protocol designers take great care to ensure the documents they produce are clear. The standardization process gathers consensus and review from experts in the field, to further ensure document quality. Any reasonably skilled engineer should be able to take a specification and produce a performant, reliable, and secure implementation. The Internet is central to everyone’s lives, and we depend on these implementations. Any deviations from the specification can put us at risk. For example, mishandling of malformed requests can allow attacks such as request smuggling.
h3i is a binary command line tool and Rust library designed for low-level testing and debugging of HTTP/3, which runs over QUIC. h3i is free and open source as part of Cloudflare’s quiche project. In this post we’ll explain the motivation behind developing h3i, how we use it to help develop robust and safe standards-compliant software and production systems, and how you can similarly use it to test your own software or services. If you just want to jump into how to use h3i, go to the h3i command line tool section.
A recap of QUIC and HTTP/3
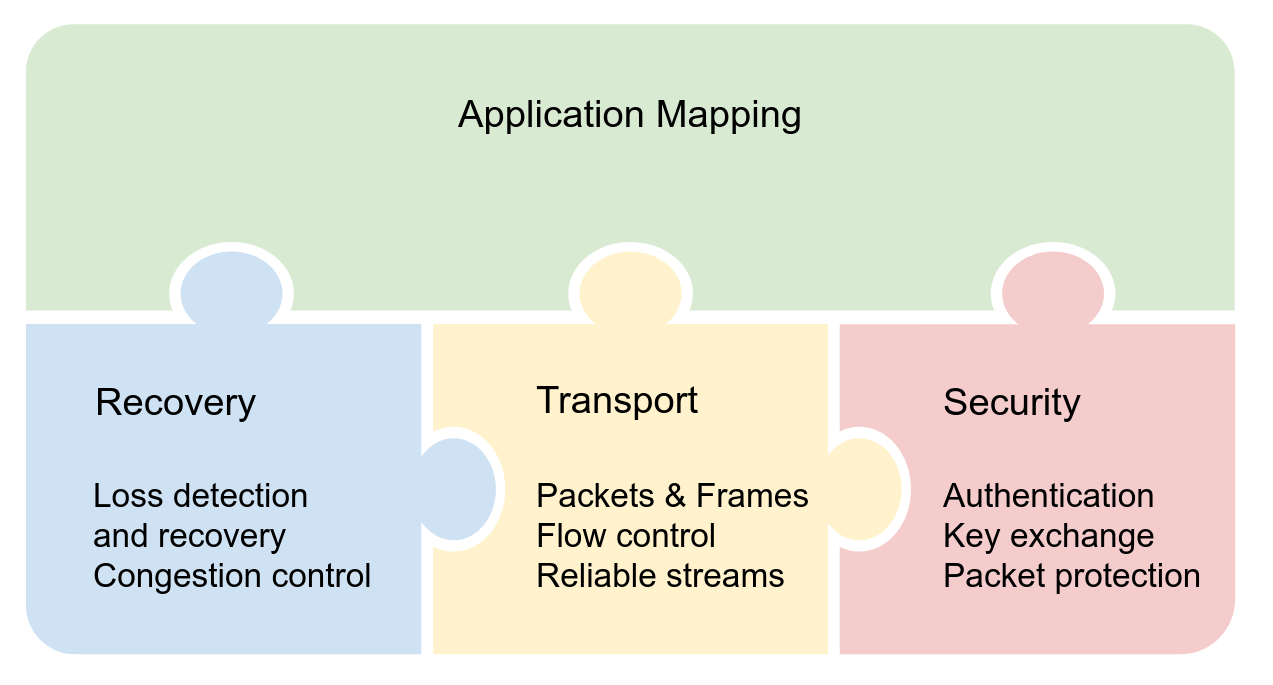
QUIC is a secure-by-default transport protocol that provides performance advantages compared to TCP and TLS via a more efficient handshake, along with stream multiplexing that provides head-of-line blocking avoidance. HTTP/3 is an application protocol that maps HTTP semantics to QUIC, such as defining how HTTP requests and responses are assigned to individual QUIC streams.
Cloudflare has supported QUIC on our global network in some shape or form since 2018. We started while the Internet Engineering Task Force (IETF) was earnestly standardizing the protocol, working through early iterations and using interoperability testing and experience to help provide feedback for the standards process. We launched support for QUIC version 1 and HTTP/3 as soon as RFC 9000 (and its accompanying specifications) were published in 2021.
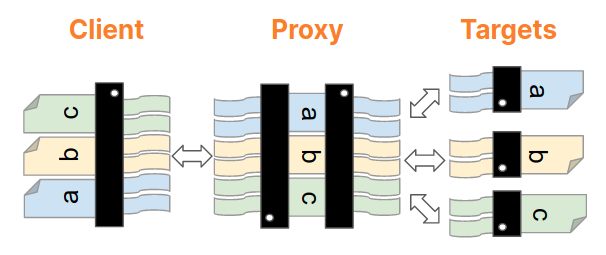
We work on the Protocols team, who own the ingress proxy into the Cloudflare network. This is essentially Cloudflare’s “front door” — HTTP requests that come to Cloudflare from the Internet pass through us first. The majority of requests are passed onwards to things like rulesets, workers, caches, or a customer origin. However, you might be surprised that many requests don’t ever make it that far because they are, in some way, invalid or malformed. Servers listening on the Internet have to be robust to traffic that is not RFC compliant, whether caused by accident or malicious intent.
The Protocols team actively participates in IETF standardization work and has also helped build and maintain other Cloudflare services that leverage quiche for QUIC and HTTP/3, from the proxies that help iCloud Private Relay via MASQUE proxying, to replacing WARP’s use of Wireguard with MASQUE, and beyond.
Throughout all of these different use cases, it is important for us to extensively test all aspects of the protocols. A deep dive into protocol details is a blog post (or three) in its own right. So let’s take a thin slice across HTTP to help illustrate the concepts.
HTTP Semantics are common to all versions of HTTP — the overall architecture, terminology, and protocol aspects such as request and response messages, methods, status codes, header and trailer fields, message content, and much more. Each individual HTTP version defines how semantics are transformed into a “wire format” for exchange over the Internet. You can read more about HTTP/1.1 and HTTP/2 in some of our previous blogposts.
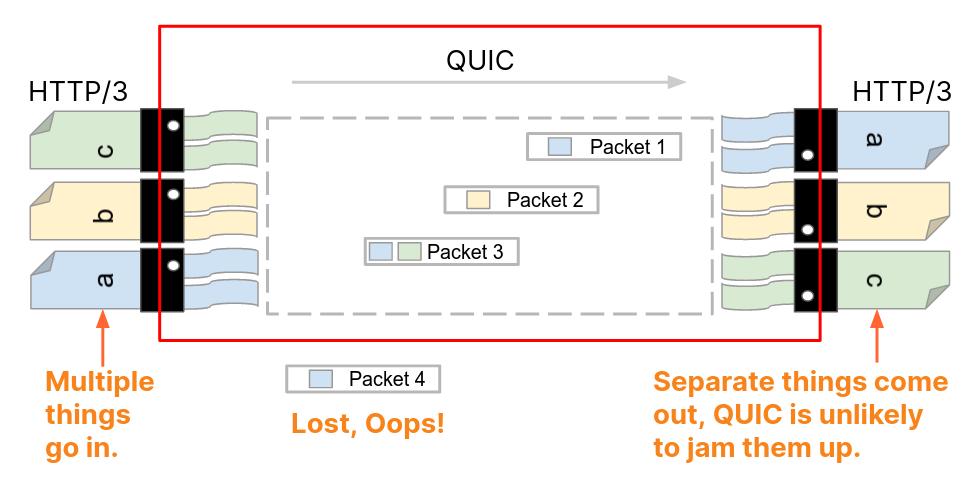
With HTTP/3, HTTP request and response messages are split into a series of binary frames. HEADERS frames carry a representation of HTTP metadata (method, path, status code, field lines). The payload of the frame is the encoded QPACK compression output. DATA frames carry HTTP content (aka “message body”). In order to exchange these frames, HTTP/3 relies on QUIC streams. These provide an ordered and reliable byte stream and each have an identifier (ID) that is unique within the scope of a connection. There are four different stream types, denominated by the two least significant bits of the ID.
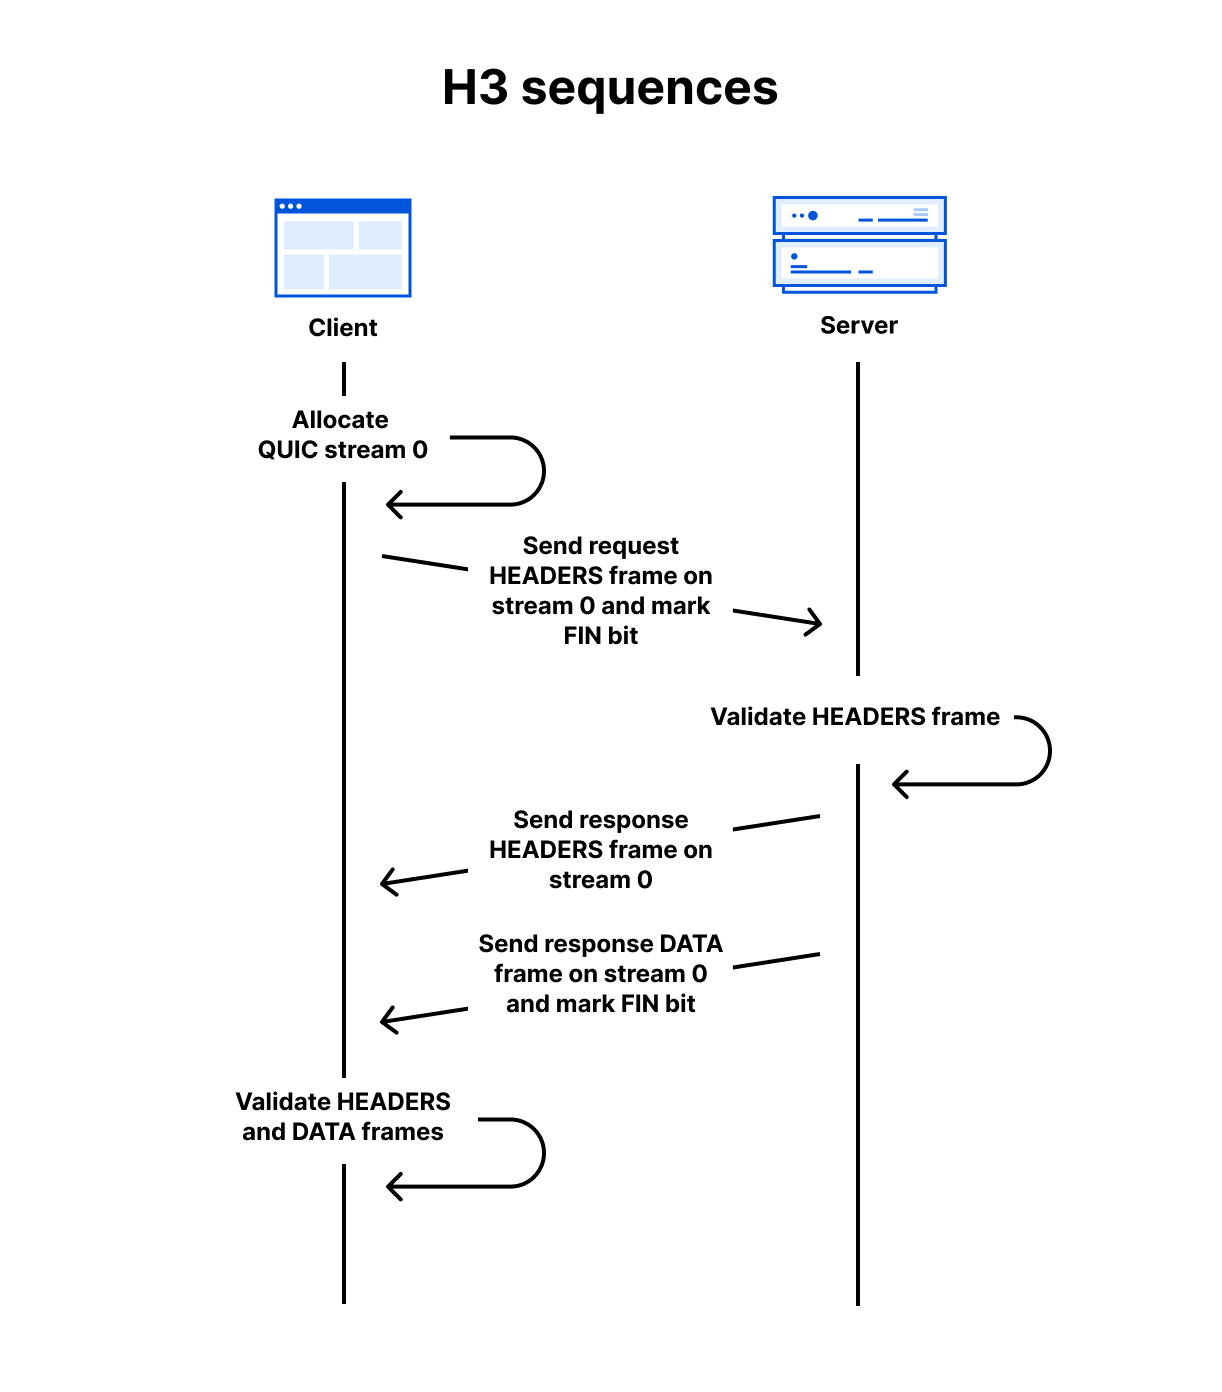
As a simple example, assuming a QUIC connection has already been established, a client can make a GET request and receive a 200 OK response with an HTML body using the follow sequence:
Client allocates the first available client-initiated bidirectional QUIC stream. (The IDs start at 0, then 4, 8, 12 and so on)
Client sends the request HEADERS frame on the stream and sets the stream’s FIN bit to mark the end of stream.
Server receives the request HEADERS frame and validates it against RFC 9114 rules. If accepted, it processes the request and prepares the response.
Server sends the response HEADERS frame on the same stream.
Server sends the response DATA frame on the same stream and sets the FIN bit.
Client receives the response frames and validates them. If accepted, the content is presented to the user.
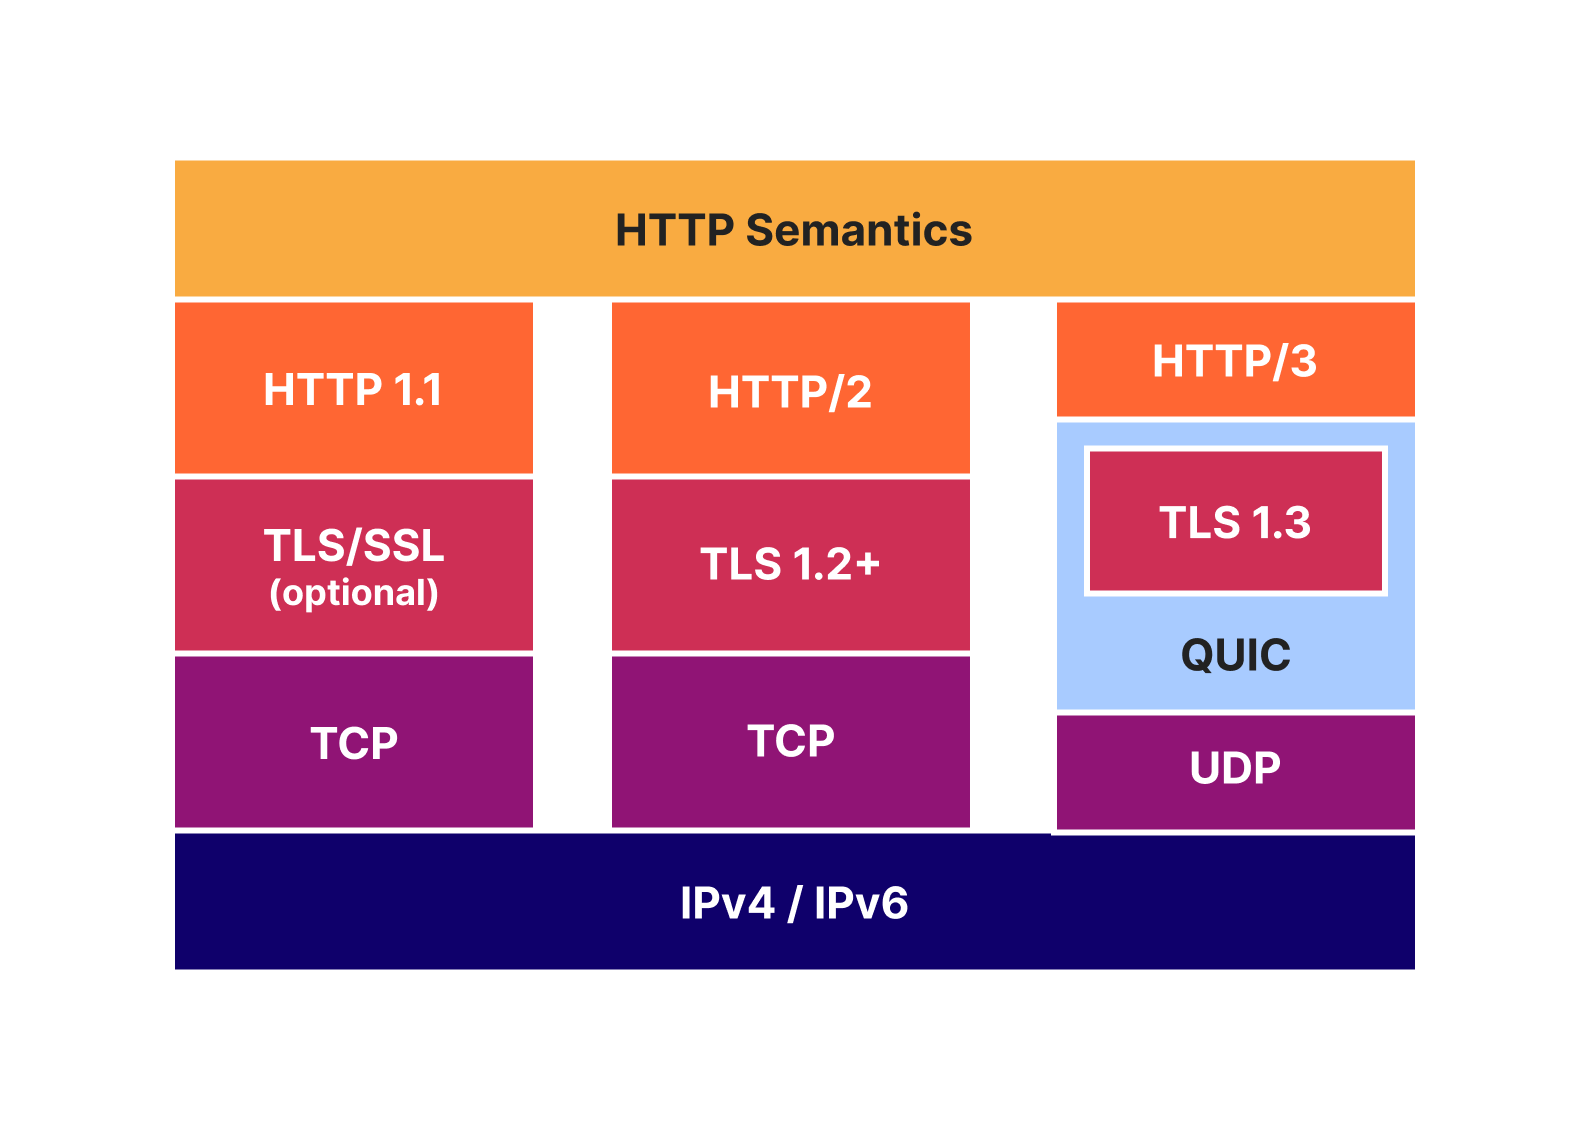
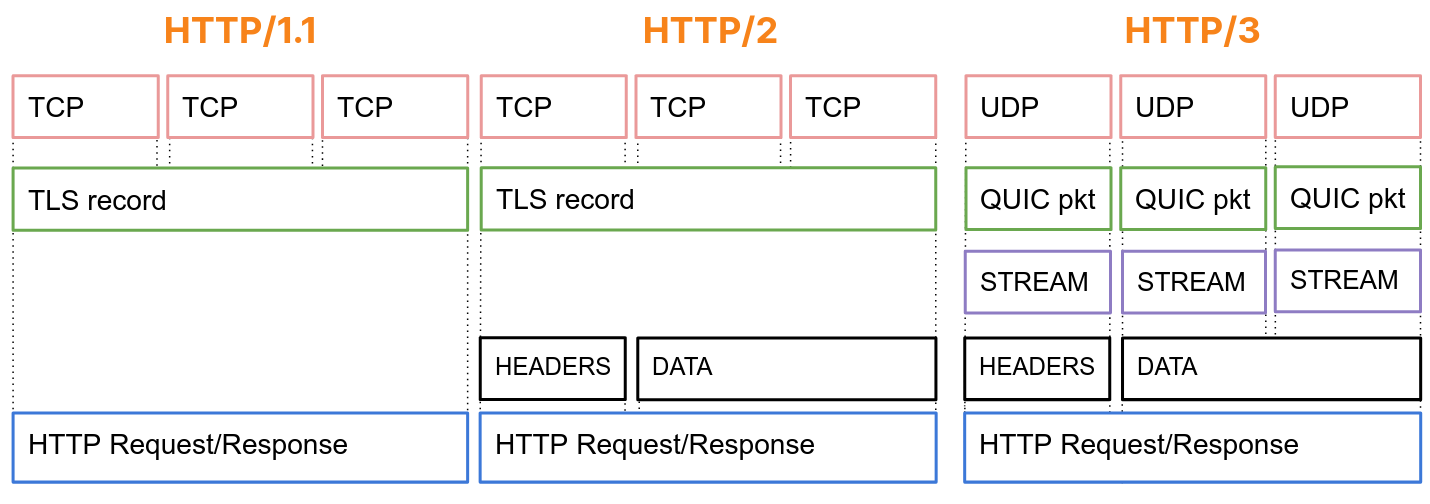
At the QUIC layer, stream data is split into STREAM frames, which are sent in QUIC packets over UDP. QUIC deals with any loss detection and recovery, helping to ensure stream data is reliable. The layer cake diagram below provides a handy comparison of how HTTP/1.1, HTTP/2 and HTTP/3 use TCP, UDP and IP.
Background on testing QUIC and HTTP/3 at Cloudflare
The Protocols team has a diverse set of automated test tools that exercise our ingress proxy software in order to ensure it can stand up to the deluge that the Internet can throw at it. Just like a bouncer at a nightclub front door, we need to prevent as much bad traffic as possible before it gets inside and potentially causes damage.
HTTP/2 and HTTP/3 share several concepts. When we started developing early HTTP/3 support, we’d already learned a lot from production experience with HTTP/2. While HTTP/2 addressed many issues with HTTP/1.1 (especially problems like request smuggling, caused by its ASCII-based message delineation), HTTP/2 also added complexity and new avenues for attack. Security is an ongoing process, and the Protocols team continually hardens our software and systems to threats. For example, mitigating the range of denial-of-service attacks identified by Netflix in 2019, or the HTTP/2 Rapid Reset attacks of 2023.
For testing HTTP/2, we rely on the Python Requests library for testing conventional HTTP exchanges. However, that mostly only exercises HEADERS and DATA frames. There are eight other frame types and a plethora of ways that they can interact (hence the new attack vectors mentioned above). In order to get full testing coverage, we have to break down into the lower layer h2 library, which allows exact frame-by-frame control. However, even that is not always enough. Libraries tend to want to follow the RFC rules and prevent their users from doing “the wrong thing”. This is entirely logical for most purposes. For our needs though, we need to take off the safety guards just like any potential attackers might do. We have a few cases where the best way to exercise certain traffic patterns is to handcraft HTTP/2 frames in a hex editor, store that as binary, and replay it with a tool such as OpenSSL s_client.
We knew we’d need similar testing approaches for HTTP/3. However, when we started in 2018, there weren’t many other suitable client implementations. The rate of iteration on the specifications also meant it was hard to always keep in sync. So we built tests on quiche, using a mix of our quiche-client and http3_test. Over time, the python library aioquic has matured, and we have used it to add a range of lower-layer tests that break or bend HTTP/3 rules, in order to prove our proxies are robust.
Finally, we would be remiss not to mention that all the tests in our ingress proxy are in addition to the suite of over 500 integration tests that run on the quiche project itself.
Making HTTP/3 testing more accessible and maintainable with h3i
While we are happy with the coverage of our current tests, the smorgasbord of test tools makes it hard to know what to reach for when adding new tests. For example, we’ve had cases where aioquic’s safety guards prevent us from doing something, and it has needed a patch or workaround. This sort of thing requires a time investment just to debug/develop the tests.
We believe it shouldn’t take a protocol or code expert to develop what are often very simple to describe tests. While it is important to provide guide rails for the majority of conventional use cases, it is also important to provide accessible methods for taking them off.
Let’s consider a simple example. In HTTP/3 there is something called the control stream. It’s used to exchange frames such as SETTINGS, which affect the HTTP/3 connection. RFC 9114 Section 6.2.1 states:
Each side MUST initiate a single control stream at the beginning of the connection and send its SETTINGS frame as the first frame on this stream. If the first frame of the control stream is any other frame type, this MUST be treated as a connection error of type H3_MISSING_SETTINGS. Only one control stream per peer is permitted; receipt of a second stream claiming to be a control stream MUST be treated as a connection error of type H3_STREAM_CREATION_ERROR. The sender MUST NOT close the control stream, and the receiver MUST NOT request that the sender close the control stream. If either control stream is closed at any point, this MUST be treated as a connection error of type H3_CLOSED_CRITICAL_STREAM. Connection errors are described in Section 8.
There are many tests we can conjure up just from that paragraph:
Send a non-SETTINGS frame as the first frame on the control stream.
Open two control streams.
Open a control stream and then close it with a FIN bit.
Open a control stream and then reset it with a RESET_STREAM QUIC frame.
Wait for the peer to open a control stream and then ask for it to be reset with a STOP_SENDING QUIC frame.
All of the above actions should cause a remote peer that has implemented the RFC properly to close the connection. Therefore, it is not in the interest of the local client or server applications to ever do these actions.
Many QUIC and HTTP/3 implementations are developed as libraries that are integrated into client or server applications. There may be an extensive set of unit or integration tests of the library checking RFC rules. However, it is also important to run the same tests on the integrated assembly of library and application, since it’s all too common that an unhandled/mishandled library error can cascade to cause issues in upper layers. For instance, the HTTP/2 Rapid Reset attacks affected Cloudflare due to their impact on how one service spoke to another.
We’ve developed h3i, a command line tool and library, to make testing more accessible and maintainable for all. We started with a client that can exercise servers, since that’s what our focus has been. Future developments could support the opposite, a server that behaves in unusual ways in order to exercise clients.
Note: h3i is not intended to be a production client! Its flexibility may cause issues that are not observed in other production-oriented clients. It is also not intended to be used for any type of performance testing and measurement.
The h3i command line tool
The primary purpose of the h3i command line tool is quick low-level debugging and exploratory testing. Rather than worrying about writing code or a test script, users can quickly run an ad-hoc client test against a target, guided by interactive prompts.
In the simplest case, you can think of h3i a bit like curl but with access to some extra HTTP/3 parameters. In the example below, we issue a request to https://cloudflare-quic.com/ and receive a response.
Walking through a simple GET with h3i step-by-step:
Grab a copy of the h3i binary either by running cargo install h3i or cloning the quiche source repo at https://github.com/cloudflare/quiche/. Both methods assume you have some familiarity with Rust and Cargo. See the cargo documentation for more information.
cargo install will place the binary on your path, so you can then just run it by executing h3i.
If running from source, navigate to the quiche/h3i directory and then use cargo run.
Run the binary and provide the name and port of the target server. If the port is omitted, the default value 443 is assumed. E.g, cargo run cloudflare-quic.com
h3i then enters the action prompting phase. A series of one or more HTTP/3 actions can be queued up, such as sending frames, opening or terminating streams, or waiting on data from the server. The full set of options is documented in the readme.
The prompting interface adapts to keyboard inputs and supports tab completion.
In the example above, the headers action is selected, which walks through populating the fields in a HEADERS frame. It includes mandatory fields from RFC 9114 for convenience. If a test requires omitting these, the headers_no_pseudo can be used instead.
The commit prompt choice finalizes the action list and moves to the connection phase. h3i initiates a QUIC connection to the server identified in step 2. Once connected, actions are executed in order.
By default, h3i reports some limited information about the frames the server sent. To get more detailed information, the RUST_LOG environment can be set with either debug or trace levels.
Instant record and replay, powered by qlog
It can be fun to play around with the h3i command line tool to see how different servers respond to different combinations or sequences of actions. Occasionally, you’ll find a certain set that you want to run over and over again, or share with a friend or colleague. Having to manually enter the prompts repeatedly, or share screenshots of the h3i input can turn tedious. Fortunately, h3i records all the actions in a log file by default — the file path is printed immediately after h3i starts. The format of this file is based on qlog, an in-progress standard in development at the IETF for network protocol logging. It’s a perfect fit for our low-level needs.
h3i logs can be replayed using the --qlog-input option. You can change the target server host and port, and keep all the same actions. However, most servers will validate the :authority pseudo-header or Host header contained in a HEADERS frame. The –replay-host-override option allows changing these fields without needing to modify the file by hand.
And yes, qlog files are human-readable text in the JSON-SEQ format. So you can also just write these by hand in the first place if you like! However, if you’re going to start writing things, maybe Rust is your preferred option…
Using the h3i library to send a malformed request with Rust
In our previous example, we just sent a valid request so there wasn’t anything interesting to observe. Where h3i really shines is in generating traffic that isn’t RFC compliant, such as malformed HTTP messages, invalid frame sequences, or other actions on streams. This helps determine if a server is acting robustly and defensively.
Let’s explore this more with an example of HTTP content-length mismatch. RFC 9114 section 4.1.2 specifies:
A request or response that is defined as having content when it contains a Content-Length header field (Section 8.6 of [HTTP]) is malformed if the value of the Content-Length header field does not equal the sum of the DATA frame lengths received. A response that is defined as never having content, even when a Content-Length is present, can have a non-zero Content-Length header field even though no content is included in DATA frames.
Intermediaries that process HTTP requests or responses (i.e., any intermediary not acting as a tunnel) MUST NOT forward a malformed request or response. Malformed requests or responses that are detected MUST be treated as a stream error of type H3_MESSAGE_ERROR.
For malformed requests, a server MAY send an HTTP response indicating the error prior to closing or resetting the stream.
There are good reasons that the RFC is so strict about handling mismatched content lengths. They can be a vector for desynchronization attacks (similar to request smuggling), especially when a proxy is converting inbound HTTP/3 to outbound HTTP/1.1.
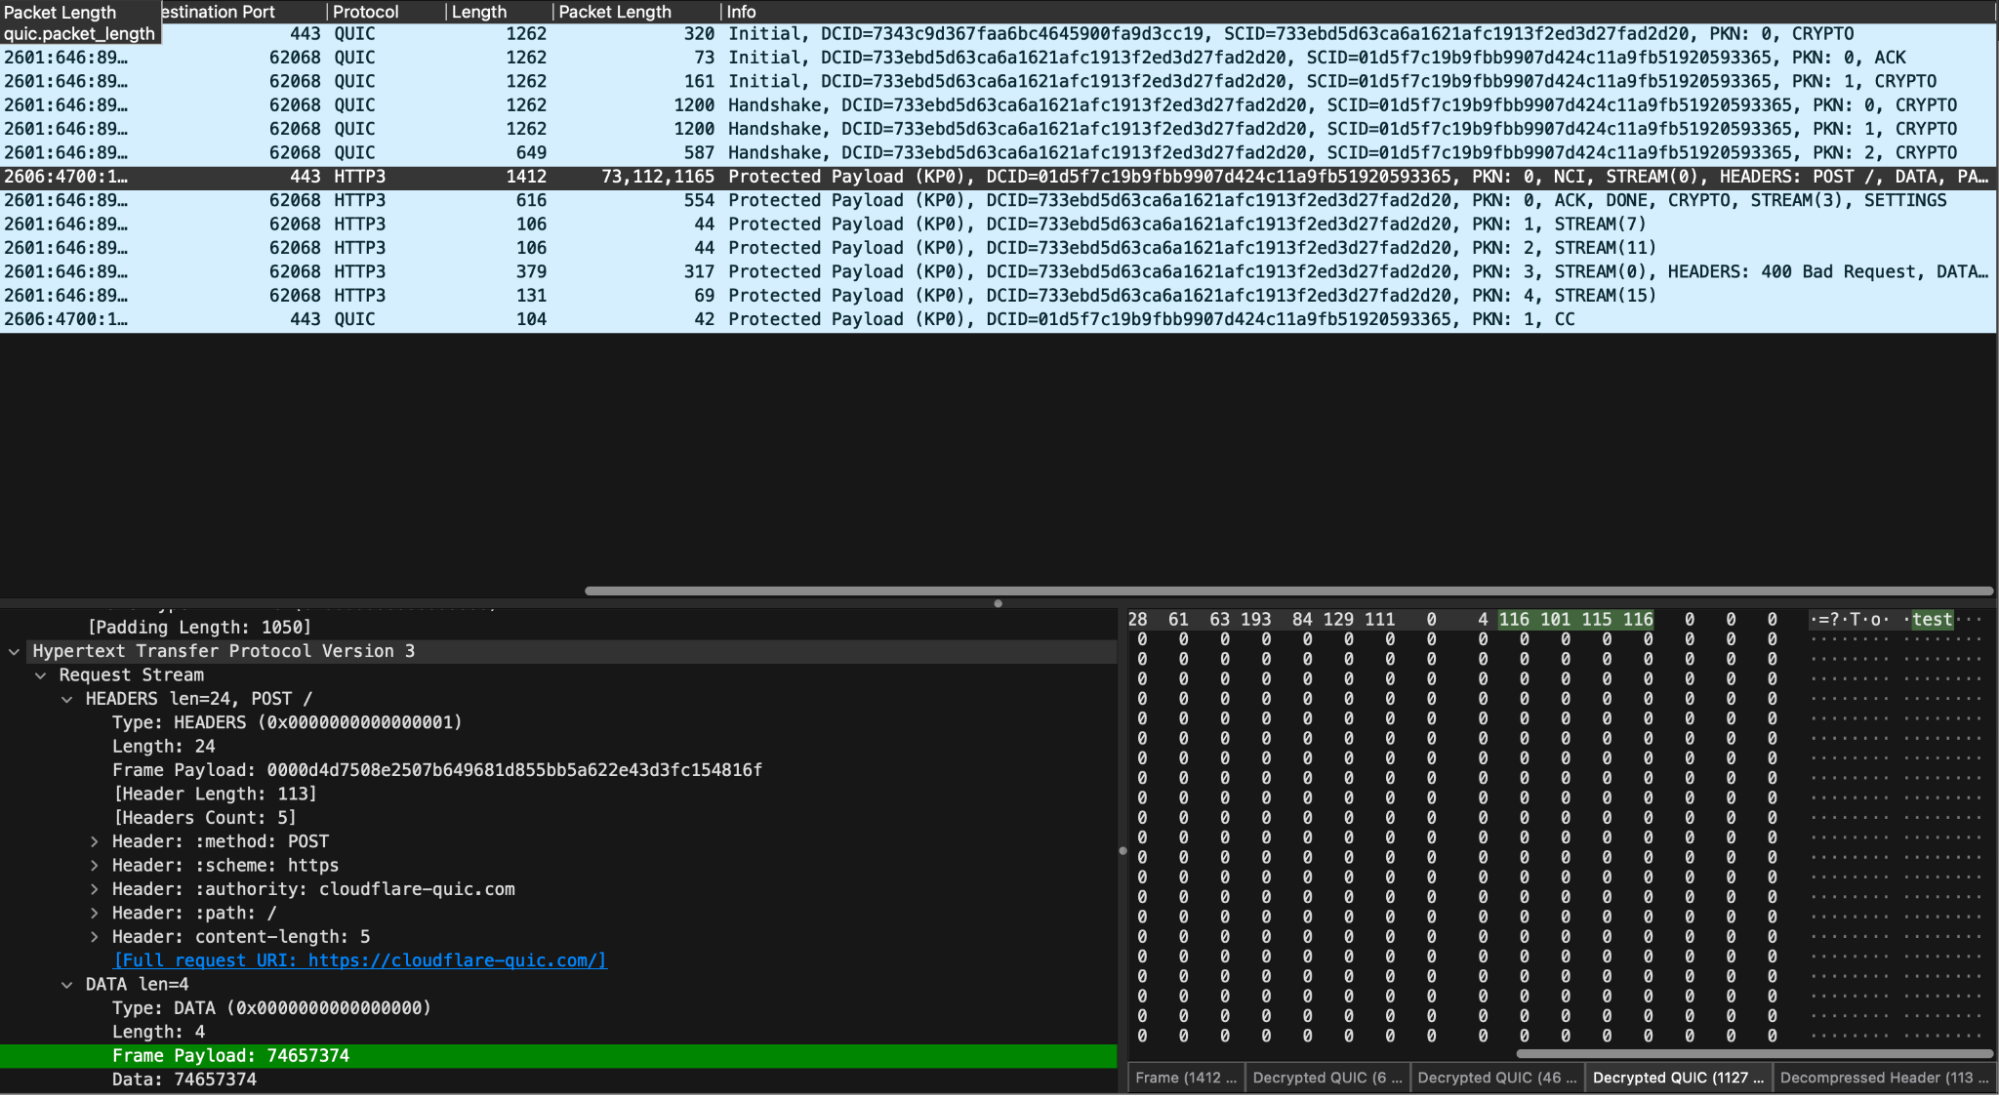
We’ve provided an example of how to use the h3i Rust library to write a tailor-made test client that sends a mismatched content length request. It sends a Content-Length header of 5, but its body payload is “test”, which is only 4 bytes. It then waits for the server to respond, after which it explicitly closes the connection by sending a QUIC CONNECTION_CLOSE frame.
When running low-level tests, it can be interesting to also take a packet capture (pcap) and observe what is happening on the wire. Since QUIC is an encrypted transport, we’ll need to use the SSLKEYLOG environment variable to capture the session keys so that tools like Wireshark can decrypt and dissect.
To follow along at home, clone a copy of the quiche repository, start a packet capture on the appropriate network interface and then run:
cd quiche/h3i
SSLKEYLOGFILE="h3i-example.keys" cargo run --example content_length_mismatch
In our decrypted capture, we see the expected sequence of handshake, request, response, and then closure.
Surveying the example code
The example is a simple binary app with a main() entry point. Let’s survey the key elements.
First, we set up an h3i configuration to a target server:
let config = Config::new()
        .with_host_port("cloudflare-quic.com".to_string())
        .with_idle_timeout(2000)
        .build()
        .unwrap();
The idle timeout is a QUIC concept which tells each endpoint when it should close the connection if the connection has been idle. This prevents endpoints from spinning idly if the peer hasn’t closed the connection. h3i’s default is 30 seconds, which can be too long for tests, so we set ours to 2 seconds here.
Next, we define a set of request headers and encode them with QPACK compression, ready to put in a HEADERS frame. Note that h3i does provide a send_headers_frame helper method which does this for you, but the example does it manually for clarity:
let headers = vec![
        Header::new(b":method", b"POST"),
        Header::new(b":scheme", b"https"),
        Header::new(b":authority", b"cloudflare-quic.com"),
        Header::new(b":path", b"/"),
        // We say that we're going to send a body with 5 bytes...
        Header::new(b"content-length", b"5"),
    ];

    let header_block = encode_header_block(&headers).unwrap();
Then, we define the set of h3i actions that we want to execute in order: send HEADERS, send a too-short DATA frame, wait for the server’s HEADERS, then close the connection.
let actions = vec![
        Action::SendHeadersFrame {
            stream_id: STREAM_ID,
            fin_stream: false,
            headers,
            frame: Frame::Headers { header_block },
        },
        Action::SendFrame {
            stream_id: STREAM_ID,
            fin_stream: true,
            frame: Frame::Data {
                // ...but, in actuality, we only send 4 bytes. This should yield a
                // 400 Bad Request response from an RFC-compliant
                // server: https://datatracker.ietf.org/doc/html/rfc9114#section-4.1.2-3
                payload: b"test".to_vec(),
            },
        },
        Action::Wait {
            wait_type: WaitType::StreamEvent(StreamEvent {
                stream_id: STREAM_ID,
                event_type: StreamEventType::Headers,
            }),
        },
        Action::ConnectionClose {
            error: quiche::ConnectionError {
                is_app: true,
                error_code: quiche::h3::WireErrorCode::NoError as u64,
                reason: vec![],
            },
        },
    ];
Finally, we’ll set things in motion with connect(), which sets up the QUIC connection, executes the actions list and collects the summary.
let summary =
        sync_client::connect(config, &actions).expect("connection failed");

    println!(
        "=== received connection summary! ===\n\n{}",
        serde_json::to_string_pretty(&summary).unwrap_or_else(|e| e.to_string())
    );
ConnectionSummary provides data about the connection, including the frames h3i received, details about why the connection closed, and connection statistics. The example prints the summary out. However, you can programmatically check it. We do this to write our own internal automation tests.
If you’re running the example, it should print something like the following:
Let’s walk through the output. Up first is the StreamMap, which is a record of all frames received on each stream. We can see that we received 5 frames on stream 0: 2 UNKNOWNs, one EnrichedHeaders frame, and two DATA frames.
The UNKNOWN frames are extension frames that are unknown to h3i; the server under test is sending what are known as GREASE frames to help exercise the protocol and ensure clients are not erroring when they receive something unexpected per RFC 9114 requirements.
The EnrichedHeaders frame is essentially an HTTP/3 HEADERS frame, but with some small helpers, like one to get the response status code. The server under test sent a 400 as expected.
The DATA frames carry response body bytes. In this case, the body is the HTML required to render the Cloudflare Bad Request page (you can peek at the HTML yourself in Wireshark). We chose to omit the raw bytes from the ConnectionSummary since they may not be representable safely as text. A future improvement could be to encode the bytes in base64 or hex, in order to support tests that need to check response content.
h3i for test automation
We believe h3i is a great library for building automated tests on. You can take the above example and modify it to fit within various types of (continuous) integration tests.
We outlined earlier how the Protocols team HTTP/3 testing has organically grown to use three different frameworks. Even within those, we still didn’t have much flexibility and ease of use. Over the last year we’ve been building h3i itself and reimplementing our suite of ingress proxy test cases using the Rust library. This has helped us improve test coverage with a range of new tests not previously possible. It also surprisingly identified some problems with the old tests, particularly for some edge cases where it wasn’t clear how the old test code implementation was running under the hood.
Bake offs, interop, and wider testing of HTTP
RFC 1025 was published in 1987. Authored by Jon Postel, it discusses bake offs:
In the early days of the development of TCP and IP, when there were very few implementations and the specifications were still evolving, the only way to determine if an implementation was “correct” was to test it against other implementations and argue that the results showed your own implementation to have done the right thing. These tests and discussions could, in those early days, as likely change the specification as change the implementation.
There were a few times when this testing was focused, bringing together all known implementations and running through a set of tests in hopes of demonstrating the N squared connectivity and correct implementation of the various tricky cases. These events were called “Bake Offs”.
While nearly 4 decades old, the concept of exercising Internet protocol implementations and seeing how they compare to the specification still holds true. The QUIC WG made heavy use of interoperability testing through its standardization process. We started off sitting in a room and running tests manually by hand (or with some help from scripts). Then Marten Seemann developed the QUIC Interop Runner, which runs regular automated testing and collects and renders all the results. This has proven to be incredibly useful.
The state of HTTP/3 interoperability testing is not quite as mature. Although there are tools such as Kazu Yamamoto’s excellent h3spec (in Haskell) for testing conformance, there isn’t a similar continuous integration process of collection and rendering of results. While h3i shares similarities with h3spec, we felt it important to focus on the framework capabilities rather than creating a corpus of tests and assertions. Cloudflare is a big fan of Rust and as several teams move to Rust-based proxies, having a consistent ecosystem provides advantages (such as developer velocity).
We certainly feel there is a great opportunity for continued collaboration and cross-pollination between projects in the QUIC and HTTP space. For example, h3i might provide a suitable basis to build another tool (or set of scripts) to run bake offs or interop tests. Perhaps it even makes sense to have a common collection of test cases owned by the community, that can be specialized to the most appropriate or preferred tooling. This topic was recently presented at the HTTP Workshop 2024 by Mohammed Al-Sahaf, and it excites us to see new potential directions of testing improvements.
When using any tools or methods for protocol testing, we encourage responsible handling of security-related matters. If you believe you may have identified a vulnerability in an IETF Internet protocol itself, please follow the IETF’s reporting guidance. If you believe you may have discovered an implementation vulnerability in a product, open source project, or service using QUIC or HTTP, then you should report these directly to the responsible party. Implementers or operators often provide their own publicly-available guidance and contact details to send reports. For example, the Cloudflare quiche security policy is available in the Security tab of the GitHub repository.
Summary and outlook
Cloudflare takes testing very seriously. While h3i has a limited feature set as a test HTTP/3 client, we believe it provides a strong framework that can be extended to a wider range of different cases and different protocols. For example, we’d like to add support for low-level HTTP/2.
We’ve designed h3i to integrate into a wide range of testing methodologies, from manual ad-hoc testing, to native Rust tests, to conformance testbenches built with scripting languages. We’ve had great success migrating our existing zoo of test tools to a single one that is more accessible and easier to maintain.
Now that you’ve read about h3i’s capabilities, it’s left as an exercise to the reader to go back to the example of HTTP/3 control streams and consider how you could write tests to exercise a server.
We encourage the community to experiment with h3i and provide feedback, and propose ideas or contributions to the GitHub repository as issues or Pull Requests.
Starting on Aug 25, 2023, we started to notice some unusually big HTTP attacks hitting many of our customers. These attacks were detected and mitigated by our automated DDoS system. It was not long however, before they started to reach record breaking sizes — and eventually peaked just above 201 million requests per second. This was nearly 3x bigger than our previous biggest attack on record.
Concerning is the fact that the attacker was able to generate such an attack with a botnet of merely 20,000 machines. There are botnets today that are made up of hundreds of thousands or millions of machines. Given that the entire web typically sees only between 1–3 billion requests per second, it's not inconceivable that using this method could focus an entire web’s worth of requests on a small number of targets.
Detecting and Mitigating
This was a novel attack vector at an unprecedented scale, but Cloudflare's existing protections were largely able to absorb the brunt of the attacks. While initially we saw some impact to customer traffic — affecting roughly 1% of requests during the initial wave of attacks — today we’ve been able to refine our mitigation methods to stop the attack for any Cloudflare customer without it impacting our systems.
We noticed these attacks at the same time two other major industry players — Google and AWS — were seeing the same. We worked to harden Cloudflare’s systems to ensure that, today, all our customers are protected from this new DDoS attack method without any customer impact. We’ve also participated with Google and AWS in a coordinated disclosure of the attack to impacted vendors and critical infrastructure providers.
This attack was made possible by abusing some features of the HTTP/2 protocol and server implementation details (see CVE-2023-44487 for details). Because the attack abuses an underlying weakness in the HTTP/2 protocol, we believe any vendor that has implemented HTTP/2 will be subject to the attack. This included every modern web server. We, along with Google and AWS, have disclosed the attack method to web server vendors who we expect will implement patches. In the meantime, the best defense is using a DDoS mitigation service like Cloudflare’s in front of any web-facing web or API server.
This post dives into the details of the HTTP/2 protocol, the feature that attackers exploited to generate these massive attacks, and the mitigation strategies we took to ensure all our customers are protected. Our hope is that by publishing these details other impacted web servers and services will have the information they need to implement mitigation strategies. And, moreover, the HTTP/2 protocol standards team, as well as teams working on future web standards, can better design them to prevent such attacks.
RST attack details
HTTP is the application protocol that powers the Web. HTTP Semantics are common to all versions of HTTP — the overall architecture, terminology, and protocol aspects such as request and response messages, methods, status codes, header and trailer fields, message content, and much more. Each individual HTTP version defines how semantics are transformed into a "wire format" for exchange over the Internet. For example, a client has to serialize a request message into binary data and send it, then the server parses that back into a message it can process.
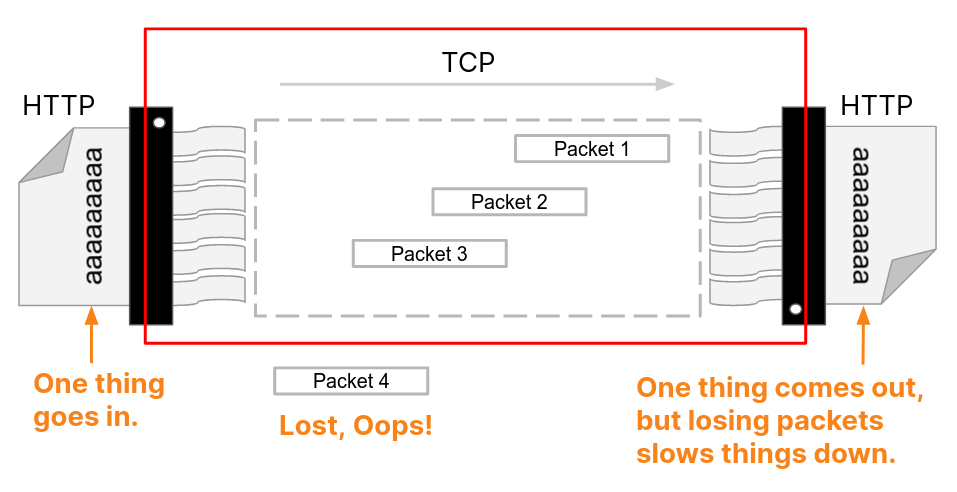
HTTP/1.1 uses a textual form of serialization. Request and response messages are exchanged as a stream of ASCII characters, sent over a reliable transport layer like TCP, using the following format (where CRLF means carriage-return and linefeed):
HTTP/1.1 200 OK CRLFServer: cloudflareCRLFContent-Length: 100CRLFtext/html; charset=UTF-8CRLF<100 bytes of data>
This format frames messages on the wire, meaning that it is possible to use a single TCP connection to exchange multiple requests and responses. However, the format requires that each message is sent whole. Furthermore, in order to correctly correlate requests with responses, strict ordering is required; meaning that messages are exchanged serially and can not be multiplexed. Two GET requests, for https://blog.cloudflare.com/ and https://blog.cloudflare.com/page/2/, would be:
GET / HTTP/1.1 CRLFHost: blog.cloudflare.comCRLFGET /page/2 HTTP/1.1 CRLFHost: blog.cloudflare.comCRLF
With the responses:
HTTP/1.1 200 OK CRLFServer: cloudflareCRLFContent-Length: 100CRLFtext/html; charset=UTF-8CRLF<100 bytes of data>HTTP/1.1 200 OK CRLFServer: cloudflareCRLFContent-Length: 100CRLFtext/html; charset=UTF-8CRLF<100 bytes of data>
Web pages require more complicated HTTP interactions than these examples. When visiting the Cloudflare blog, your browser will load multiple scripts, styles and media assets. If you visit the front page using HTTP/1.1 and decide quickly to navigate to page 2, your browser can pick from two options. Either wait for all of the queued up responses for the page that you no longer want before page 2 can even start, or cancel in-flight requests by closing the TCP connection and opening a new connection. Neither of these is very practical. Browsers tend to work around these limitations by managing a pool of TCP connections (up to 6 per host) and implementing complex request dispatch logic over the pool.
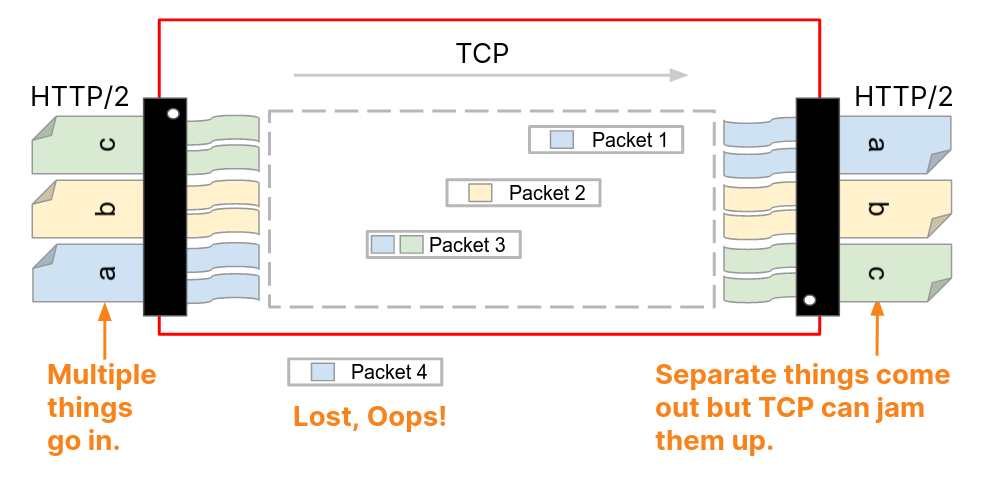
HTTP/2 addresses many of the issues with HTTP/1.1. Each HTTP message is serialized into a set of HTTP/2 frames that have type, length, flags, stream identifier (ID) and payload. The stream ID makes it clear which bytes on the wire apply to which message, allowing safe multiplexing and concurrency. Streams are bidirectional. Clients send frames and servers reply with frames using the same ID.
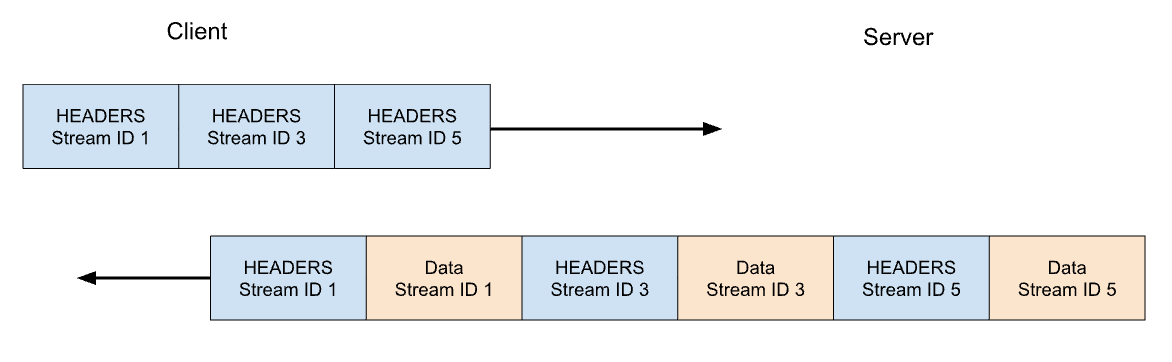
In HTTP/2 our GET request for https://blog.cloudflare.com would be exchanged across stream ID 1, with the client sending one HEADERS frame, and the server responding with one HEADERS frame, followed by one or more DATA frames. Client requests always use odd-numbered stream IDs, so subsequent requests would use stream ID 3, 5, and so on. Responses can be served in any order, and frames from different streams can be interleaved.
Stream multiplexing and concurrency are powerful features of HTTP/2. They enable more efficient usage of a single TCP connection. HTTP/2 optimizes resources fetching especially when coupled with prioritization. On the flip side, making it easy for clients to launch large amounts of parallel work can increase the peak demand for server resources when compared to HTTP/1.1. This is an obvious vector for denial-of-service.
In order to provide some guardrails, HTTP/2 provides a notion of maximum active concurrent streams. The SETTINGS_MAX_CONCURRENT_STREAMS parameter allows a server to advertise its limit of concurrency. For example, if the server states a limit of 100, then only 100 requests can be active at any time. If a client attempts to open a stream above this limit, it must be rejected by the server using a RST_STREAM frame. Stream rejection does not affect the other in-flight streams on the connection.
The true story is a little more complicated. Streams have a lifecycle. Below is a diagram of the HTTP/2 stream state machine. Client and server manage their own views of the state of a stream. HEADERS, DATA and RST_STREAM frames trigger transitions when they are sent or received. Although the views of the stream state are independent, they are synchronized.
HEADERS and DATA frames include an END_STREAM flag, that when set to the value 1 (true), can trigger a state transition.
Let's work through this with an example of a GET request that has no message content. The client sends the request as a HEADERS frame with the END_STREAM flag set to 1. The client first transitions the stream from idle to open state, then immediately transitions into half-closed state. The client half-closed state means that it can no longer send HEADERS or DATA, only WINDOW_UPDATE, PRIORITY or RST_STREAM frames. It can receive any frame however.
Once the server receives and parses the HEADERS frame, it transitions the stream state from idle to open and then half-closed, so it matches the client. The server half-closed state means it can send any frame but receive only WINDOW_UPDATE, PRIORITY or RST_STREAM frames.
The response to the GET contains message content, so the server sends HEADERS with END_STREAM flag set to 0, then DATA with END_STREAM flag set to 1. The DATA frame triggers the transition of the stream from half-closed to closed on the server. When the client receives it, it also transitions to closed. Once a stream is closed, no frames can be sent or received.
Applying this lifecycle back into the context of concurrency, HTTP/2 states:
Streams that are in the "open" state or in either of the "half-closed" states count toward the maximum number of streams that an endpoint is permitted to open. Streams in any of these three states count toward the limit advertised in the SETTINGS_MAX_CONCURRENT_STREAMS setting.
In theory, the concurrency limit is useful. However, there are practical factors that hamper its effectiveness— which we will cover later in the blog.
HTTP/2 request cancellation
Earlier, we talked about client cancellation of in-flight requests. HTTP/2 supports this in a much more efficient way than HTTP/1.1. Rather than needing to tear down the whole connection, a client can send a RST_STREAM frame for a single stream. This instructs the server to stop processing the request and to abort the response, which frees up server resources and avoids wasting bandwidth.
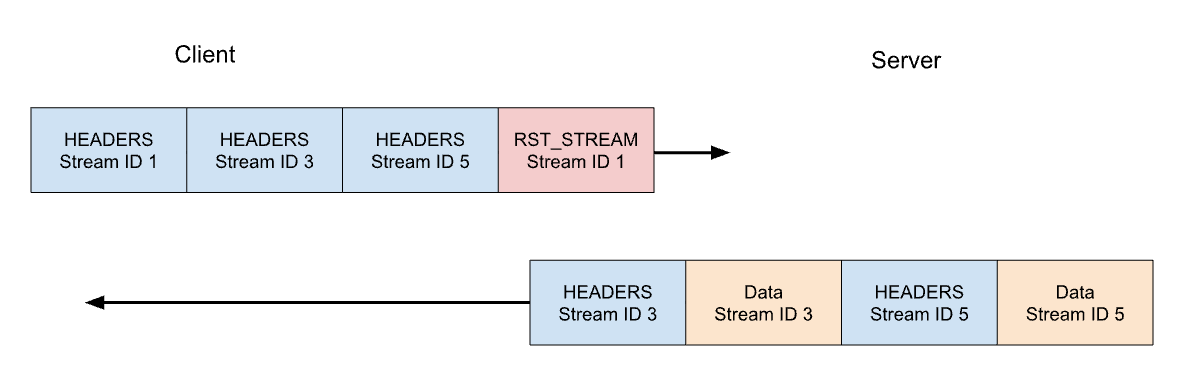
Let's consider our previous example of 3 requests. This time the client cancels the request on stream 1 after all of the HEADERS have been sent. The server parses this RST_STREAM frame before it is ready to serve the response and instead only responds to stream 3 and 5:
Request cancellation is a useful feature. For example, when scrolling a webpage with multiple images, a web browser can cancel images that fall outside the viewport, meaning that images entering it can load faster. HTTP/2 makes this behaviour a lot more efficient compared to HTTP/1.1.
A request stream that is canceled, rapidly transitions through the stream lifecycle. The client's HEADERS with END_STREAM flag set to 1 transitions the state from idle to open to half-closed, then RST_STREAM immediately causes a transition from half-closed to closed.
Recall that only streams that are in the open or half-closed state contribute to the stream concurrency limit. When a client cancels a stream, it instantly gets the ability to open another stream in its place and can send another request immediately. This is the crux of what makes CVE-2023-44487 work.
Rapid resets leading to denial of service
HTTP/2 request cancellation can be abused to rapidly reset an unbounded number of streams. When an HTTP/2 server is able to process client-sent RST_STREAM frames and tear down state quickly enough, such rapid resets do not cause a problem. Where issues start to crop up is when there is any kind of delay or lag in tidying up. The client can churn through so many requests that a backlog of work accumulates, resulting in excess consumption of resources on the server.
A common HTTP deployment architecture is to run an HTTP/2 proxy or load-balancer in front of other components. When a client request arrives it is quickly dispatched and the actual work is done as an asynchronous activity somewhere else. This allows the proxy to handle client traffic very efficiently. However, this separation of concerns can make it hard for the proxy to tidy up the in-process jobs. Therefore, these deployments are more likely to encounter issues from rapid resets.
When Cloudflare's reverse proxies process incoming HTTP/2 client traffic, they copy the data from the connection’s socket into a buffer and process that buffered data in order. As each request is read (HEADERS and DATA frames) it is dispatched to an upstream service. When RST_STREAM frames are read, the local state for the request is torn down and the upstream is notified that the request has been canceled. Rinse and repeat until the entire buffer is consumed. However this logic can be abused: when a malicious client started sending an enormous chain of requests and resets at the start of a connection, our servers would eagerly read them all and create stress on the upstream servers to the point of being unable to process any new incoming request.
Something that is important to highlight is that stream concurrency on its own cannot mitigate rapid reset. The client can churn requests to create high request rates no matter the server's chosen value of SETTINGS_MAX_CONCURRENT_STREAMS.
Rapid Reset dissected
Here's an example of rapid reset reproduced using a proof-of-concept client attempting to make a total of 1000 requests. I've used an off-the-shelf server without any mitigations; listening on port 443 in a test environment. The traffic is dissected using Wireshark and filtered to show only HTTP/2 traffic for clarity. Download the pcap to follow along.
It's a bit difficult to see, because there are a lot of frames. We can get a quick summary via Wireshark's Statistics > HTTP2 tool:
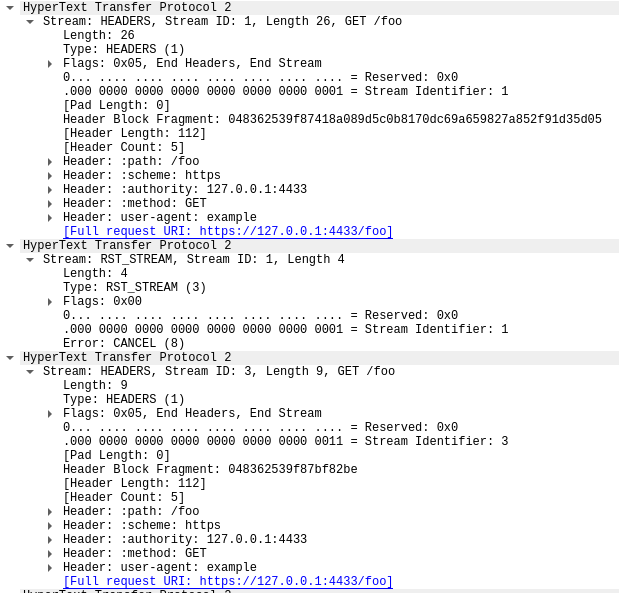
The first frame in this trace, in packet 14, is the server's SETTINGS frame, which advertises a maximum stream concurrency of 100. In packet 15, the client sends a few control frames and then starts making requests that are rapidly reset. The first HEADERS frame is 26 bytes long, all subsequent HEADERS are only 9 bytes. This size difference is due to a compression technology called HPACK. In total, packet 15 contains 525 requests, going up to stream 1051.
Interestingly, the RST_STREAM for stream 1051 doesn't fit in packet 15, so in packet 16 we see the server respond with a 404 response. Then in packet 17 the client does send the RST_STREAM, before moving on to sending the remaining 475 requests.
Note that although the server advertised 100 concurrent streams, both packets sent by the client sent a lot more HEADERS frames than that. The client did not have to wait for any return traffic from the server, it was only limited by the size of the packets it could send. No server RST_STREAM frames are seen in this trace, indicating that the server did not observe a concurrent stream violation.
Impact on customers
As mentioned above, as requests are canceled, upstream services are notified and can abort requests before wasting too many resources on it. This was the case with this attack, where most malicious requests were never forwarded to the origin servers. However, the sheer size of these attacks did cause some impact.
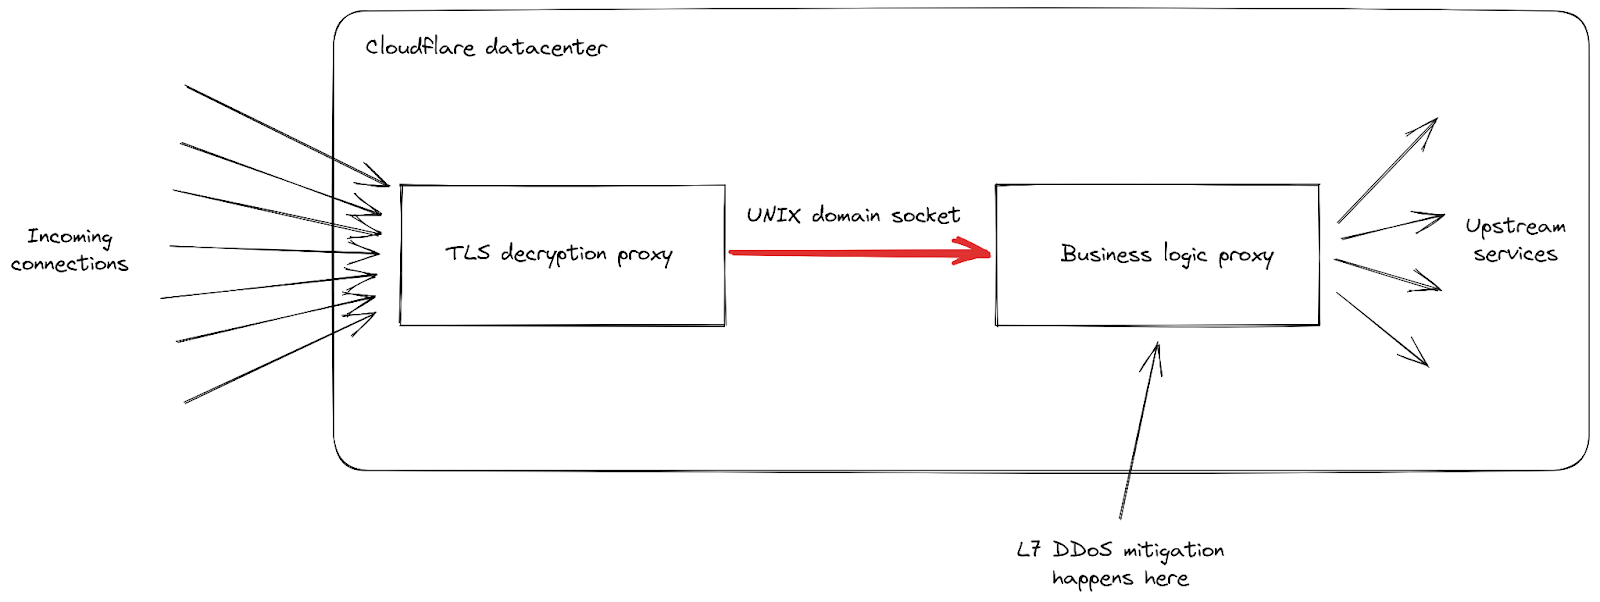
First, as the rate of incoming requests reached peaks never seen before, we had reports of increased levels of 502 errors seen by clients. This happened on our most impacted data centers as they were struggling to process all the requests. While our network is meant to deal with large attacks, this particular vulnerability exposed a weakness in our infrastructure. Let's dig a little deeper into the details, focusing on how incoming requests are handled when they hit one of our data centers:
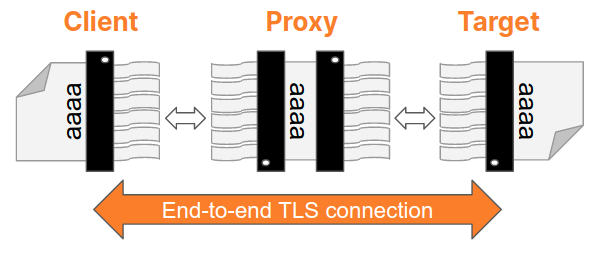
We can see that our infrastructure is composed of a chain of different proxy servers with different responsibilities. In particular, when a client connects to Cloudflare to send HTTPS traffic, it first hits our TLS decryption proxy: it decrypts TLS traffic, processes HTTP 1, 2 or 3 traffic, then forwards it to our "business logic" proxy. This one is responsible for loading all the settings for each customer, then routing the requests correctly to other upstream services — and more importantly in our case, it is also responsible for security features. This is where L7 attack mitigation is processed.
The problem with this attack vector is that it manages to send a lot of requests very quickly in every single connection. Each of them had to be forwarded to the business logic proxy before we had a chance to block it. As the request throughput became higher than our proxy capacity, the pipe connecting these two services reached its saturation level in some of our servers.
When this happens, the TLS proxy cannot connect anymore to its upstream proxy, this is why some clients saw a bare "502 Bad Gateway" error during the most serious attacks. It is important to note that, as of today, the logs used to create HTTP analytics are also emitted by our business logic proxy. The consequence of that is that these errors are not visible in the Cloudflare dashboard. Our internal dashboards show that about 1% of requests were impacted during the initial wave of attacks (before we implemented mitigations), with peaks at around 12% for a few seconds during the most serious one on August 29th. The following graph shows the ratio of these errors over a two hours while this was happening:
We worked to reduce this number dramatically in the following days, as detailed later on in this post. Both thanks to changes in our stack and to our mitigation that reduce the size of these attacks considerably, this number is today is effectively zero:
499 errors and the challenges for HTTP/2 stream concurrency
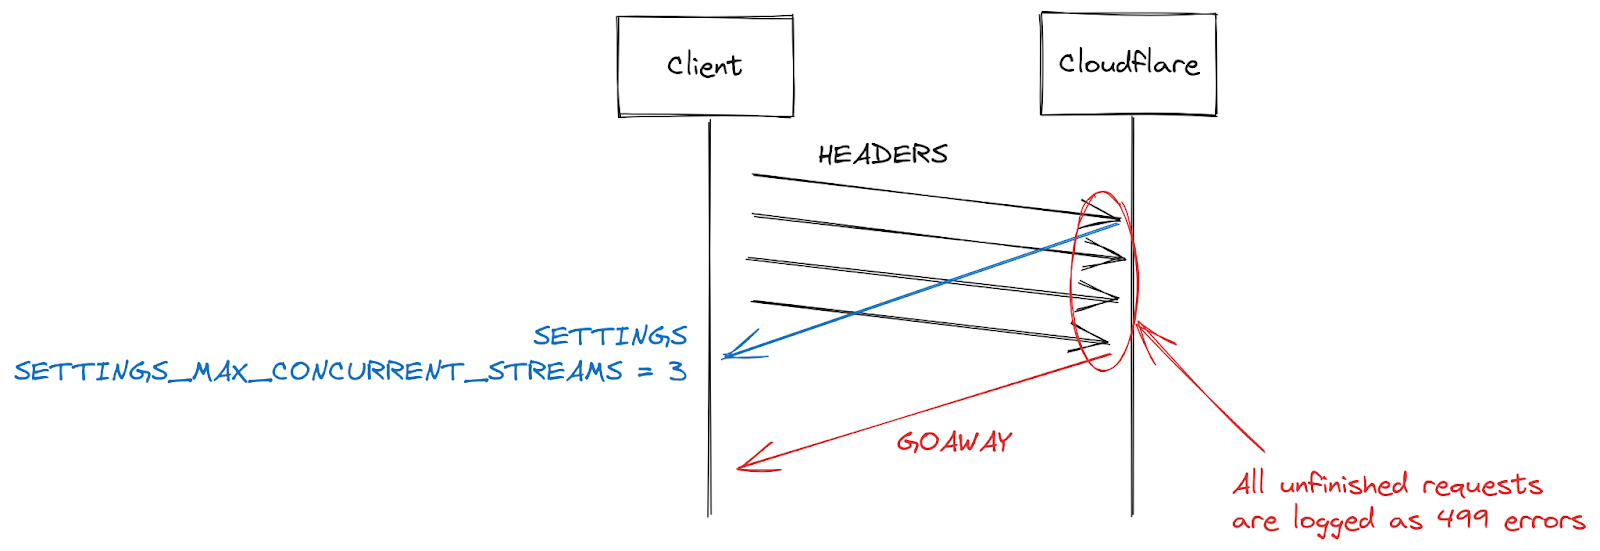
Another symptom reported by some customers is an increase in 499 errors. The reason for this is a bit different and is related to the maximum stream concurrency in a HTTP/2 connection detailed earlier in this post.
HTTP/2 settings are exchanged at the start of a connection using SETTINGS frames. In the absence of receiving an explicit parameter, default values apply. Once a client establishes an HTTP/2 connection, it can wait for a server's SETTINGS (slow) or it can assume the default values and start making requests (fast). For SETTINGS_MAX_CONCURRENT_STREAMS, the default is effectively unlimited (stream IDs use a 31-bit number space, and requests use odd numbers, so the actual limit is 1073741824). The specification recommends that a server offer no fewer than 100 streams. Clients are generally biased towards speed, so don't tend to wait for server settings, which creates a bit of a race condition. Clients are taking a gamble on what limit the server might pick; if they pick wrong the request will be rejected and will have to be retried. Gambling on 1073741824 streams is a bit silly. Instead, a lot of clients decide to limit themselves to issuing 100 concurrent streams, with the hope that servers followed the specification recommendation. Where servers pick something below 100, this client gamble fails and streams are reset.
There are many reasons a server might reset a stream beyond concurrency limit overstepping. HTTP/2 is strict and requires a stream to be closed when there are parsing or logic errors. In 2019, Cloudflare developed several mitigations in response to HTTP/2 DoS vulnerabilities. Several of those vulnerabilities were caused by a client misbehaving, leading the server to reset a stream. A very effective strategy to clamp down on such clients is to count the number of server resets during a connection, and when that exceeds some threshold value, close the connection with a GOAWAY frame. Legitimate clients might make one or two mistakes in a connection and that is acceptable. A client that makes too many mistakes is probably either broken or malicious and closing the connection addresses both cases.
While responding to DoS attacks enabled by CVE-2023-44487, Cloudflare reduced maximum stream concurrency to 64. Before making this change, we were unaware that clients don't wait for SETTINGS and instead assume a concurrency of 100. Some web pages, such as an image gallery, do indeed cause a browser to send 100 requests immediately at the start of a connection. Unfortunately, the 36 streams above our limit all needed to be reset, which triggered our counting mitigations. This meant that we closed connections on legitimate clients, leading to a complete page load failure. As soon as we realized this interoperability issue, we changed the maximum stream concurrency to 100.
Actions from the Cloudflare side
In 2019 several DoS vulnerabilities were uncovered related to implementations of HTTP/2. Cloudflare developed and deployed a series of detections and mitigations in response. CVE-2023-44487 is a different manifestation of HTTP/2 vulnerability. However, to mitigate it we were able to extend the existing protections to monitor client-sent RST_STREAM frames and close connections when they are being used for abuse. Legitimate client uses for RST_STREAM are unaffected.
In addition to a direct fix, we have implemented several improvements to the server's HTTP/2 frame processing and request dispatch code. Furthermore, the business logic server has received improvements to queuing and scheduling that reduce unnecessary work and improve cancellation responsiveness. Together these lessen the impact of various potential abuse patterns as well as giving more room to the server to process requests before saturating.
Mitigate attacks earlier
Cloudflare already had systems in place to efficiently mitigate very large attacks with less expensive methods. One of them is named "IP Jail". For hyper volumetric attacks, this system collects the client IPs participating in the attack and stops them from connecting to the attacked property, either at the IP level, or in our TLS proxy. This system however needs a few seconds to be fully effective; during these precious seconds, the origins are already protected but our infrastructure still needs to absorb all HTTP requests. As this new botnet has effectively no ramp-up period, we need to be able to neutralize attacks before they can become a problem.
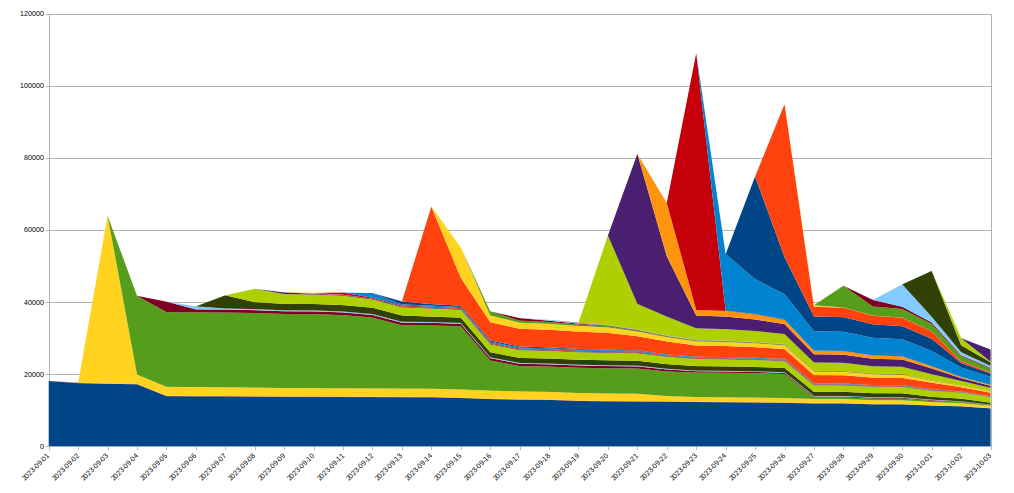
To achieve this we expanded the IP Jail system to protect our entire infrastructure: once an IP is "jailed", not only it is blocked from connecting to the attacked property, we also forbid the corresponding IPs from using HTTP/2 to any other domain on Cloudflare for some time. As such protocol abuses are not possible using HTTP/1.x, this limits the attacker's ability to run large attacks, while any legitimate client sharing the same IP would only see a very small performance decrease during that time. IP based mitigations are a very blunt tool — this is why we have to be extremely careful when using them at that scale and seek to avoid false positives as much as possible. Moreover, the lifespan of a given IP in a botnet is usually short so any long term mitigation is likely to do more harm than good. The following graph shows the churn of IPs in the attacks we witnessed:
As we can see, many new IPs spotted on a given day disappear very quickly afterwards.
As all these actions happen in our TLS proxy at the beginning of our HTTPS pipeline, this saves considerable resources compared to our regular L7 mitigation system. This allowed us to weather these attacks much more smoothly and now the number of random 502 errors caused by these botnets is down to zero.
Observability improvements
Another front on which we are making change is observability. Returning errors to clients without being visible in customer analytics is unsatisfactory. Fortunately, a project has been underway to overhaul these systems since long before the recent attacks. It will eventually allow each service within our infrastructure to log its own data, instead of relying on our business logic proxy to consolidate and emit log data. This incident underscored the importance of this work, and we are redoubling our efforts.
We are also working on better connection-level logging, allowing us to spot such protocol abuses much more quickly to improve our DDoS mitigation capabilities.
Conclusion
While this was the latest record-breaking attack, we know it won’t be the last. As attacks continue to become more sophisticated, Cloudflare works relentlessly to proactively identify new threats — deploying countermeasures to our global network so that our millions of customers are immediately and automatically protected.
Cloudflare has provided free, unmetered and unlimited DDoS protection to all of our customers since 2017. In addition, we offer a range of additional security features to suit the needs of organizations of all sizes. Contact us if you’re unsure whether you’re protected or want to understand how you can be.
GET / HTTP/1.1 CRLFHost: blog.cloudflare.comCRLFCRLFGET /page/2/ HTTP/1.1 CRLFHost: blog.cloudflare.comCRLFCRLF
レスポンスは、次のようになります:
HTTP/1.1 200 OK CRLFServer: cloudflareCRLFContent-Length: 100CRLFtext/html; charset=UTF-8CRLFCRLF<100 bytes of data>CRLFHTTP/1.1 200 OK CRLFServer: cloudflareCRLFContent-Length: 100CRLFtext/html; charset=UTF-8CRLFCRLF<100 bytes of data>
これが起こると、TLSプロキシはアップストリームプロキシに接続できなくなり、最も深刻な攻撃時に「502 Bad Gateway」エラーが表示されるクライアントがあるのは、これが理由です。重要なのは、現在ではHTTP分析の作成に使用されるログは、ビジネスロジックプロキシからも出力されることになります。その結果、これらのエラーはCloudflareのダッシュボードには表示されません。当社内部のダッシュボードによると、(緩和策を実施する前の)最初の攻撃波では、リクエストの約1%が影響を受け、8月29日の最も深刻な攻撃では数秒間で約12%のピークが見られました。次のグラフは、この現象が起きていた2時間にわたるエラーの割合を示したものです:
À compter du 25 août 2023, nous avons commencé à observer des attaques HTTP inhabituellement volumineuses frappant bon nombre de nos clients. Ces attaques ont été détectées et atténuées par notre système anti-DDoS automatisé. Il n’a pas fallu longtemps pour que ces attaques atteignent des tailles record, pour finir par culminer à un peu plus de 201 millions de requêtes par seconde, soit un chiffre près de trois fois supérieur à la précédente attaque la plus volumineuse que nous ayons enregistrée.
Le fait que l’acteur malveillant soit parvenu à générer une attaque d’une telle ampleur à l’aide d’un botnet de tout juste 20 000 machines s’avère préoccupant. Certains botnets actuels se composent de centaines de milliers ou de millions de machines. Comme qu’Internet dans son ensemble ne reçoit habituellement qu’entre 1 et 3 milliards de requêtes chaque seconde, il n’est pas inconcevable que l’utilisation de cette méthode puisse concentrer l’intégralité du nombre de requêtes du réseau sur un petit nombre de cibles.
Détection et atténuation
Il s’agissait d’un nouveau vecteur d’attaque évoluant à une échelle sans précédent, mais les protections Cloudflare existantes ont largement pu absorber le plus gros de ces attaques. Si nous avons constaté au départ un certain impact sur le trafic client (environ 1 % des requêtes ont été touchées pendant la vague d’attaques initiale), nous avons ensuite pu perfectionner nos méthodes d’atténuation afin de bloquer l’attaque pour n’importe quel client Cloudflare sans affecter nos systèmes.
Nous avons remarqué ces attaques en même temps que deux autres acteurs majeurs du secteur : Google et AWS. Nous nous sommes attelés au renforcement des systèmes de Cloudflare afin de nous assurer qu’aujourd’hui tous nos clients sont protégés contre cette nouvelle méthode d’attaque DDoS sans impact sur ces derniers. Nous avons également participé, avec Google et AWS, à une révélation coordonnée de l’attaque aux prestataires affectés et aux fournisseurs d’infrastructure essentielle.
Cette attaque a été rendue possible par l’abus de certaines fonctionnalités du protocole HTTP/2 et des détails de mise en œuvre des serveurs (voir la CVE-2023-44487 pour plus d’informations). Comme l’attaque tire parti d’une faiblesse sous-jacente du protocole HTTP/2, nous pensons que tous les fournisseurs qui ont déployé le HTTP/2 subiront l’attaque. Ce constat comprend tous les serveurs web modernes. Aux côtés de Google et d’AWS, nous avons divulgué la méthode d’attaque aux fournisseurs de serveurs web qui, nous l’espérons, déploieront les correctifs. Entre temps, la meilleure défense consiste à utiliser un service d’atténuation des attaques DDoS tel que Cloudflare en amont de chaque réseau en contact avec Internet ou de chaque serveur d’API.
Cet article s’intéressera en profondeur aux détails du protocole HTTP/2, la fonctionnalité exploitée par les acteurs malveillants pour générer ces attaques d’envergure, ainsi qu’aux stratégies d’atténuation que nous avons appliquées pour nous assurer que tous nos clients sont protégés. Nous espérons qu’en publiant ces détails d’autres serveurs web et services affectés disposeront des informations dont ils ont besoin pour mettre en œuvre ces stratégies d’atténuation. En outre, l’équipe chargée des normes du protocole HTTP/2, de même que les équipes travaillant sur les futures normes web, pourront mieux concevoir ces dernières afin d’empêcher de telles attaques.
Détails de l’attaque RST
Le protocole d’application HTTP sous-tend Internet. La norme HTTP Semantics est commune à toutes les versions de HTTP : l’architecture générale, la terminologie et les aspects de protocole, comme les messages de requête et de réponse, les méthodes, les codes d’état, les champs d’en-tête et de trailer, le contenu des messages et bien d’autres. Chaque version individuelle de HTTP définit la manière dont la sémantique est transformée au « format conversation » (wire) pour l’échange sur Internet. Un client doit, par exemple, sérialiser un message de requête en données binaires avant de l’envoyer. Le serveur l’analyse ensuite et le retransforme en message qu’il peut traiter.
Le protocole HTTP/1.1 utilise une forme textuelle de sérialisation. Les messages de requête et de réponse sont échangés sous la forme d’un flux de caractères ASCII, envoyé via une couche de transport fiable, comme le TCP, selon le format suivant (dans lequel CRLF signifie retour chariot et saut de ligne) :
Une requête GET très simple pour https://blog.cloudflare.com/ ressemblerait, par exemple, à ceci sur la conversation :
GET / HTTP/1.1 CRLFHost: blog.cloudflare.comCRLFCRLF
Et la réponse ressemblerait à ce qui suit :
HTTP/1.1 200 OK CRLFServer: cloudflareCRLFContent-Length: 100CRLFtext/html; charset=UTF-8CRLFCRLF<100 bytes of data>
Ce format encapsule les messages sur la conversation, pour indiquer qu’il est possible d’utiliser une unique connexion TCP pour échanger plusieurs requêtes et réponses. Le format nécessite toutefois que chaque message soit envoyé en entier. En outre, afin de faire entrer correctement en corrélation les requêtes avec les réponses, un ordre strict se révèle nécessaire. Les messages peuvent donc être échangés de manière sérielle et ne peuvent pas être multiplexés. Deux requêtes GET, pour https://blog.cloudflare.com/ et https://blog.cloudflare.com/page/2/,, se présenteraient ainsi sous la forme suivante :
GET / HTTP/1.1 CRLFHost: blog.cloudflare.comCRLFCRLFGET /page/2/ HTTP/1.1 CRLFHost: blog.cloudflare.comCRLFCRLF
Et les réponses :
HTTP/1.1 200 OK CRLFServer: cloudflareCRLFContent-Length: 100CRLFtext/html; charset=UTF-8CRLFCRLF<100 bytes of data>CRLFHTTP/1.1 200 OK CRLFServer: cloudflareCRLFContent-Length: 100CRLFtext/html; charset=UTF-8CRLFCRLF<100 bytes of data>
Les pages web nécessitent davantage d’interactions HTTP compliquées que ces exemples. Lorsque vous visitez le blog de Cloudflare, votre navigateur charge plusieurs scripts, styles et ressources multimédias. Si vous accédez à la page d’accueil à l’aide du protocole HTTP/1.1 et que vous décidez rapidement de vous rendre sur la page 2, votre navigateur a le choix entre deux options. Soit attendre l’ensemble des réponses en attente pour la page que vous ne souhaitez plus consulter avant de démarrer la page 2, soit annuler les requêtes en transit en mettant fin à la connexion TCP et en établissant une nouvelle connexion. Aucune de ces options ne s’avère particulièrement pratique. Les navigateurs ont tendance à contourner ces limitations en gérant un pool de connexions TCP (jusqu’à 6 par hôte) et en mettant en œuvre une logique complexe de répartition des requêtes au sein du pool.
Le protocole HTTP/2 répond à bon nombre des problèmes du HTTP/1.1. Chaque message HTTP est sérialisé sous la forme d’un ensemble de trames HTTP/2 disposant d’un type, d’une longueur, de marqueurs, d’un identifiant (ID) de flux et d’un contenu. L’ID de flux indique clairement quels octets sur la conversation s’appliquent à un message donné, afin de permettre le multiplexage et la concurrence en toute sécurité. Les flux sont bidirectionnels. Les clients envoient des trames et les serveurs répondent par des trames utilisant le même ID.
En HTTP/2, notre requête GET pour https://blog.cloudflare.com serait échangée sur l’ID de flux 1, le client envoyant une trame HEADERS et le serveur répondant par une trame HEADERS, suivies par une ou plusieurs trames DATA. Comme les requêtes du client utilisent toujours des ID de flux impairs, les requêtes suivantes utiliseront donc les ID de flux 3, 5 et ainsi de suite. Les réponses peuvent être transmises dans n’importe quel ordre et les trames provenant de flux différents peuvent être entrelacées.
Le multiplexage et la concurrence des flux constituent de puissantes fonctionnalités du protocole HTTP/2. Elles permettent l’utilisation plus efficace d’une unique connexion TCP. Le HTTP/2 optimise la récupération de ressources, notamment lorsqu’elle est associée à la priorisation. En réciproque, le fait de faciliter le lancement de vastes quantités de tâches parallèles aux clients peut accroître le pic de demande de ressources serveur par rapport au HTTP/1.1. Il s’agit là d’un vecteur évident de déni de service.
Afin de proposer quelques garde-fous, le HTTP/2 avance la notion de maximum de flux concurrents actifs. Le paramètre SETTINGS_MAX_CONCURRENT_STREAMS permet à un serveur d’annoncer sa limite de concurrence. Par exemple, si le serveur annonce une limite de 100, seules 100 requêtes pourront être actives à un moment donné. Si un client tente d’ouvrir un flux au-delà de cette limite, ce dernier devra être rejeté par le serveur à l’aide d’une trame RST_STREAM. Le rejet d’un flux n’affecte pas les autres flux en transit sur la connexion.
La réalité de l’affaire est un peu plus compliquée. Les flux présentent un cycle de vie. Vous trouverez ci-dessous un schéma de l’état d’un flux HTTP/2. Le client et le serveur gèrent leurs propres vues de l’état d’un flux. L’envoi ou la réception de trames HEADERS, DATA et RST_STREAM déclenchent les transitions. Les vues de l’état d’un flux sont indépendantes, mais restent synchronisées.
Les trames HEADERS et DATA intègrent un marqueur END_STREAM qui, lorsqu’il est défini sur la valeur 1 (true), peut déclencher une transition d’état.
Examinons ceci plus en détail avec un exemple de requête GET sans contenu de message. Le client envoie la requête sous la forme d’une trame HEADERS comportant le marqueur END_STREAM défini sur 1. Il déclenche en premier lieu la transition de l’état « idle » (à l’arrêt) à « open » (ouvert), avant de déclencher immédiatement une transition vers l’état « half-closed » (mi-fermé). L’état « half-closed » du client indique qu’il ne peut plus envoyer de trames HEADERS ou DATA, mais uniquement des trames WINDOW_UPDATE, PRIORITY ou RST_STREAM. Il peut toutefois recevoir n’importe quelle trame.
Une fois que le serveur reçoit et analyse la trame HEADERS, il fait passer l’état du flux d’« idle » à « open », puis à « half-closed », afin de correspondre à celui du client. L’état « half-closed » du serveur indique qu’il peut envoyer n’importe quelle trame, mais qu’il ne peut recevoir que des trames WINDOW_UPDATE, PRIORITY ou RST_STREAM.
La réponse à la requête GET contient un contenu de message, aussi le serveur envoie-t-il une trame HEADERS comportant le marqueur END_STREAM défini sur 0, puis une trame DATA comportant le marqueur END_STREAM défini sur 1. La trame DATA déclenche la transition du flux de half-closed à closed (fermé) sur le serveur. Lorsque le client la reçoit, il lance également sa transition vers l’état « closed ». Une fois un flux fermé, plus aucune trame ne peut être envoyée ou reçue.
En appliquant ce cycle de vie dans le contexte de la concurrence, le protocole HTTP/2 précise :
Les flux à l’état « open » ou dans l’un des deux états « half-closed » comptent dans le nombre maximum de flux qu’un point de terminaison est autorisé à ouvrir. Les flux dans l’un de ces trois états comptent à l’égard de la limite annoncée dans le paramètre SETTINGS_MAX_CONCURRENT_STREAMS.
En théorie, la limite de concurrence est utile. Certains facteurs pratiques entravent toutefois son efficacité, que nous aborderons plus tard dans cet article.
Annulation de requête HTTP/2
Un peu plus tôt, nous avons évoqué l’annulation de requêtes en transit par le client. Le protocole HTTP/2 prend cette fonctionnalité en charge de manière plus efficace que le HTTP/1.1. Plutôt que de devoir abandonner la connexion dans son ensemble, un client peut désormais envoyer une trame RST_STREAM pour un seul flux. Cette dernière demande au serveur de mettre fin au traitement de la requête et d’abandonner la réponse. Cette opération libère des ressources serveur et permet d’éviter de gaspiller de la bande passante.
Reprenons notre exemple précédent, avec les trois requêtes. Cette fois, le client annule la requête sur le flux 1 après l’envoi de toutes les trames HEADERS. Le serveur analyse la trame RST_STREAM avant d’être prêt à diffuser la réponse et, à la place, ne répond qu’aux flux 3 et 5 :
L’annulation de requête constitue une fonctionnalité bien utile. Lorsque vous parcourez une page web comportant plusieurs images, par exemple, un navigateur web peut annuler les images qui ne sont pas affichées dès l’ouverture. Les images qui lui parviennent peuvent donc être chargées plus rapidement. Le protocole HTTP/2 rend ce comportement bien plus efficace par rapport au HTTP/1.1.
Un flux de requête annulé passe rapidement par tous les états du cycle de vie d’un flux. La trame HEADERS envoyée par le client, comportant le marqueur END_STREAM défini sur 1, passe de l’état « idle » à « open », puis à « half-closed », avant que la trame RST_STREAM ne déclenche immédiatement sa transition de l’état « half-closed » à « closed ».
Souvenez-vous que seuls les flux à l’état « open » ou « half-closed » sont comptabilisés dans la limite de concurrence du flux. Lorsqu’un client annule un flux, il regagne instantanément la capacité d’ouvrir un autre flux à la place et peut immédiatement envoyer une nouvelle requête. C’est là le cœur du fonctionnement de la vulnérabilité CVE-2023-44487.
Des réinitialisations rapides conduisant à un déni de service
Le processus d’annulation de requête du protocole HTTP/2 peut être utilisé de manière abusive en réinitialisant rapidement un nombre illimité de flux. Lorsqu’un serveur HTTP/2 peut traiter des trames client-sent RST_STREAM et leur faire changer d’état suffisamment rapidement, ces réinitialisations rapides ne posent pas de problème. Les soucis commencent lorsqu’une quelconque forme de retard ou de latence apparaît lors du nettoyage. Le client peut avoir à traiter un nombre de requêtes si important que les tâches s’accumulent, en entraînant une consommation excessive de ressources sur le serveur.
Une architecture de déploiement HTTP courante consiste à exécuter un proxy HTTP/2 ou un équilibreur de charge en amont des autres composants. Lorsqu’une requête client arrive, elle est rapidement retransmise et la tâche réelle est effectuée sous forme d’activité asynchrone à un autre endroit. Cette opération permet au proxy de traiter le trafic client très efficacement. Toutefois, cette séparation des préoccupations peut compliquer la phase de nettoyage des tâches en cours pour le proxy. Ce type de déploiement est donc plus susceptible de rencontrer des problèmes en cas de réinitialisations rapides.
Lorsque les proxys inverses de Cloudflare traitent du trafic client entrant HTTP/2, ils copient les données du socket de la connexion au sein d’un tampon et traitent ces données en tampon dans l’ordre. Chaque requête est lue (trames HEADERS et DATA) et transmise à un service en amont. Lorsque les trames RST_STREAM sont lues, l’état local de la requête est abandonné et l’amont est notifié de l’annulation de la requête. Les proxys répètent ensuite le processus jusqu’à ce que toutes les données en tampon aient été traitées. Cette logique peut toutefois être utilisée de manière abusive : si un client malveillant commence à envoyer une énorme chaîne de requêtes, qu’il réinitialise au début d’une connexion, nos serveurs s’empresseront de toutes les lire. Cette situation engendrera alors une pression sur les serveurs en amont, au point qu’ils se retrouveront incapables de traiter les nouvelles requêtes entrantes.
Un point important à souligner est que la concurrence de flux ne peut pas, par elle-même, atténuer les réinitialisations rapides. Le client peut créer des requêtes afin de produire des taux de requêtes élevés, peu importe la valeur choisie par le serveur pour le paramètre SETTINGS_MAX_CONCURRENT_STREAMS.
Anatomie d’une réinitialisation rapide
Voici un exemple de réinitialisation rapide (Rapid Reset) reproduite à l’aide d’un client de démonstration de faisabilité tentant d’envoyer un total de 1 000 requêtes. J’ai utilisé un serveur du commerce ne disposant d’aucune mesure d’atténuation et écoutant le port 443 au sein d’un environnement de test. Le trafic est disséqué à l’aide de Wireshark et filtré pour ne montrer que le trafic HTTP/2, pour plus de clarté. Téléchargez la pcap pour suivre la démonstration.
Il est un peu difficile à analyser, en raison du grand nombre de trames. Nous pouvons en obtenir un résumé rapide à l’aide de l’outil HTTP/2 de Wireshark, disponible sous « Statistics » (Statistiques) :
La première trame de cette trace, dans le paquet 14, est la trame SETTINGS du serveur, qui annonce un nombre maximum de flux concurrents de 100. Dans le paquet 15, le client envoie quelques trames de contrôle, puis commence à envoyer des requêtes, rapidement réinitialisées. La première trame HEADERS fait 26 octets de long, tandis que toutes les trames HEADERS suivantes ne mesurent que 9 octets. Cette différence de taille est due à une technologie de compression nommée HPACK. Au total, le paquet 15 contient 525 requests, remontant le long du flux 1051.
Curieusement, la trame RST_STREAM du flux 1051 ne rentre pas dans le paquet 15. Nous voyons donc, dans le paquet 16, le serveur répondre par une erreur 404. Le client envoie ensuite la trame RST_STREAM dans le paquet 17, avant de passer à l’envoi des 475 requêtes suivantes.
Veuillez noter que bien que le serveur ait annoncé 100 flux concurrents, les deux paquets envoyés par le client comportaient bien plus de trames HEADERS. Le client n’a pas attendu le trafic de retour du serveur, il n’était limité que par la taille des paquets qu’il pouvait envoyer. Aucune trame RST_STREAM du serveur n’apparaît dans cette trace, un constat qui indique que le serveur n’a pas observé de violation du nombre de flux concurrents.
Impact sur les clients
Comme mentionné plus haut, lorsque les requêtes sont annulées, les services en amont sont notifiés et peuvent abandonner ces dernières avant de gaspiller trop de ressources sur leur traitement. C’est ce qui s’est passé dans cette attaque, au cours de laquelle les requêtes malveillantes n’ont jamais été retransmises aux serveurs d’origine. Toutefois, l’ampleur de ces attaques a engendré des effets.
Tout d’abord, lorsque le taux de requêtes entrantes a atteint des pics jamais encore observés jusqu’ici, nous avons reçu des signalements de niveaux élevés d’erreurs 502 observées par les clients. C’est ce qui s’est produit dans nos datacenters les plus impactés, car ils avaient du mal à traiter toutes les requêtes. Notre réseau est conçu pour faire face aux attaques d’envergure, mais cette vulnérabilité a révélé une faiblesse au sein de notre infrastructure. Intéressons-nous de plus près aux détails, en nous concentrant sur la manière dont les requêtes entrantes sont traitées lorsqu’elles arrivent dans l’un de nos datacenters :
Nous pouvons voir que notre infrastructure se compose d’une chaîne de différents serveurs de proxy aux responsabilités différentes. Plus particulièrement, lorsqu’un client se connecte à Cloudflare pour envoyer du trafic HTTPS, ce dernier passe en premier par notre proxy de déchiffrement TLS, qui déchiffre le trafic TLS et traite le trafic HTTP 1, 2 ou 3, avant de le transmettre à notre proxy de « logique métier ». Ce dernier est responsable du chargement de l’ensemble des paramètres pour chaque client, puis du routage correct des requêtes vers les autres services d’amont. Plus important encore dans le cas qui nous intéresse, il est également responsable des fonctionnalités de sécurité. C’est là que l’atténuation des attaques sur la couche 7 est mise en œuvre.
Le problème avec ce vecteur d’attaque réside dans le fait qu’il parvient à envoyer un grand nombre de requêtes de manière très rapide, sur chaque connexion. Chacune d’elles devait être retransmise au proxy de logique métier avant que nous n’ayons l’occasion de la bloquer. Lorsque le volume de requêtes s’est révélé supérieur à la capacité de notre proxy, le pipeline reliant ces deux services a atteint son niveau de saturation dans certains de nos serveurs.
Quand cette situation se produit, le proxy TLS ne peut plus se connecter à son proxy d’amont. C’est pourquoi certains de nos clients ont vu s’afficher une erreur « 502 Bad Gateway » lors des attaques les plus graves. Il est important de noter qu’à la date d’aujourd’hui, les journaux utilisés pour produire les analyses HTTP sont également émis par notre proxy de logique métier. En conséquence, ces erreurs ne sont pas visibles au sein du tableau de bord Cloudflare. Nos tableaux de bord internes révèlent qu’environ 1 % des requêtes ont été affectées lors de la vague d’attaques initiale (avant la mise en œuvre des mesures d’atténuation), avec un pic se situant autour de 12 % pendant quelques secondes lors de l’attaque la plus massive, le 29 août. Le graphique suivant montre la proportion de ces erreurs sur une période de deux heures au cours de l’attaque :
Nous nous sommes efforcés de réduire ce nombre de manière considérable les jours suivants, comme nous le détaillons plus loin dans cet article. Ce nombre aujourd’hui est effectivement de zéro, à la fois grâce aux modifications apportées à notre pile et à nos mesures d’atténuation, qui ont drastiquement réduit la taille de ces attaques.
Erreurs 499 et les défis liés à la concurrence des flux HTTP/2
Un autre symptôme signalé par certains clients réside dans l’augmentation des erreurs 499. La raison est ici quelque peu différente et se trouve liée à la concurrence de flux maximale au sein d’une connexion HTTP/2, comme détaillée précédemment dans l’article.
Les paramètres HTTP/2 sont échangés au début d’une connexion à l’aide de trames SETTINGS. En l’absence de réception d’un paramètre explicite, ce sont les valeurs par défaut qui s’appliquent. Lorsqu’un client établit une connexion HTTP/2, il peut soit attendre la trame SETTINGS d’un serveur (lent), soit présupposer les valeurs par défaut et commencer à envoyer des requêtes (rapide). Pour le paramètre SETTINGS_MAX_CONCURRENT_STREAMS, la valeur par défaut est, dans les faits, illimitée (les ID de flux s’appuient sur un espace mathématique de 31 bits et les requêtes utilisent les nombres impairs. la limite réelle est donc établie à 1 073 741 824). La spécification recommande qu’un serveur ne propose pas moins de 100 flux concurrents. Les clients sont généralement axés sur la vitesse. Ils n’ont donc pas tendance à attendre les paramètres du serveur et ce fait entraîne en quelque sorte une situation de compétition. Ils « parient » sur la limite que le serveur pourrait avoir choisie. S’ils se trompent, la requête sera rejetée et devra être renvoyée. Le fait de parier sur un ensemble numérique de 1 073 741 824 nombres s’avère pour le moins absurde. Pour contrebalancer cette situation, de nombreux clients décident de se limiter à l’émission de 100 flux concurrents, dans l’espoir que les serveurs suivent la recommandation de la spécification. Si les serveurs ont sélectionné une valeur inférieure à 100, le pari du client échoue et les flux sont réinitialisés.
Un serveur pourrait réinitialiser un flux pour de nombreuses raisons en dehors d’un dépassement de la limite de concurrence. Le HTTP/2 est strict et nécessite qu’un flux soit fermé (closed) en cas d’erreurs d’interprétation ou d’erreurs logiques. En 2019, Cloudflare a développé plusieurs mesures d’atténuation en réponse aux vulnérabilités DoS du protocole HTTP/2. Plusieurs de ces vulnérabilités résultaient d’un mauvais comportement de la part du client, qui poussait le serveur à réinitialiser un flux. Une stratégie très efficace pour freiner ces clients consiste à compter le nombre de réinitialisations du serveur au cours d’une connexion puis, lorsque ce chiffre dépasse un certain seuil, de mettre un terme à cette dernière à l’aide d’une trame GOAWAY. Les clients peuvent commettre une ou deux erreurs au cours d’une connexion et il s’agit là d’un constat acceptable. Un client qui commet trop d’erreurs est probablement soit défectueux, soit malveillant, et le fait de mettre fin à la connexion répond aux deux cas.
En réponse aux attaques DoS permises par la vulnérabilité CVE-2023-44487, Cloudflare a réduit la concurrence de flux maximale à 64. Avant d’effectuer cette modification, nous n’avions pas conscience que les clients n’attendaient pas la trame SETTINGS et supposaient à la place que la concurrence était fixée à 100. Certaines pages web, comme les galeries d’images, entraînent effectivement l’envoi immédiat de 100 requêtes par le navigateur au début d’une connexion. Malheureusement, les 36 flux au-delà de notre limite devaient être réinitialisés et cette opération déclenchait les compteurs de nos mesures d’atténuation. Nous interrompions donc des connexions sur des clients légitimes, avec pour résultat un échec total du chargement des pages. Dès que nous avons constaté ce problème d’interopérabilité, nous avons de nouveau fixé la concurrence de flux maximale à 100.
Actions côté Cloudflare
En 2019, nous avons découvert plusieurs vulnérabilités DoS liées à l’implémentation du protocole HTTP/2. Cloudflare a développé et déployé une série de mesures de détection et d’atténuation en réponse. La vulnérabilité CVE-2023-44487 est une différente manifestation de la vulnérabilité HTTP/2. Toutefois, pour l’atténuer, nous avons pu étendre les protections existantes afin de surveiller les trames RST_STREAM envoyées par les clients et de mettre fin aux connexions lorsque ces dernières étaient utilisées à des fins abusives. Les scénarios d’utilisation légitimes des trames RST_STREAM par les clients n’ont pas été affectés.
En plus d’un correctif direct, nous avons mis en œuvre plusieurs améliorations du serveur concernant le traitement des trames HTTP/2 et du code de répartition des requêtes. Le serveur de logique métier a, en outre, fait l’objet de perfectionnements au niveau de la mise en file d’attente et de la planification. Ces derniers réduisent le travail inutile et améliorent la réponse aux annulations. Ensemble, ces mesures diminuent l’impact des divers schémas d’abus potentiels, tout en accordant plus d’espace au serveur pour traiter les requêtes avant d’atteindre la saturation.
Atténuer les attaques à un moment plus précoce
Cloudflare dispose déjà de systèmes en place permettant d’atténuer efficacement les attaques de très grande ampleur à l’aide de méthodes moins coûteuses. L’une d’elles se nomme « IP Jail » (Prison IP). En cas d’attaques hypervolumétriques, ce système collecte les adresses IP des clients participant à l’attaque et les empêche de se connecter à la propriété attaquée, que ce soit au niveau de l’adresse IP ou de notre proxy TLS. Ce système demande toutefois quelques secondes pour être pleinement efficace. Au cours de ces précieuses secondes, les serveurs d’origine sont déjà protégés, mais notre infrastructure doit encore absorber l’ensemble des requêtes HTTP. Comme ce nouveau botnet ne dispose dans les faits d’aucune période de démarrage, nous devons pouvoir neutraliser ces attaques avant qu’elles ne deviennent un problème.
Pour y parvenir, nous avons étendu le système IP Jail afin qu’il protège l’intégralité de notre infrastructure. Une fois une adresse IP « en prison », nous l’empêchons non seulement de se connecter à la propriété attaquée, mais interdisons également aux adresses IP correspondants d’utiliser le HTTP/2 pour se connecter à un autre domaine sur Cloudflare pendant quelque temps. Comme de tels abus du protocole ne sont pas possibles à l’aide du HTTP/1.x, l’acteur malveillant se trouve sévèrement limité dans sa capacité à conduire des attaques d’envergure, tandis qu’un client légitime partageant la même adresse IP ne constaterait d’une très légère diminution des performances pendant ce temps. Les mesures d’atténuation basées sur l’IP constituent un outil pour le moins brutal. C’est pourquoi nous devons faire preuve d’une extrême prudence lorsque nous les utilisons à grande échelle et chercher à éviter les faux positifs autant que possible. De même, comme la durée de vie d’une adresse IP donnée au sein d’un botnet est généralement courte, l’atténuation à long terme risque davantage de nuire que d’aider. Le graphique suivant montre l’évolution du nombre d’adresses IP lors de l’attaque dont nous avons été témoins :
Il apparaît très clairement que les nouvelles adresses IP repérées lors d’une journée donnée disparaissent très rapidement après l’attaque.
Le fait que ces actions se déroulent dans notre proxy TLS, à l’entrée de notre pipeline HTTPS, permet d’économiser des ressources considérables par rapport à notre système d’atténuation de couche 7 habituel. Cette situation nous a permis de supporter ces attaques d’autant plus facilement et, aujourd’hui, le nombre d’erreurs 502 aléatoires dues à ces botnets a été réduit à zéro.
Améliorations en matière d’observabilité
L’un des autres fronts sur lequel nous avons apporté des modifications est celui de l’observabilité. Le fait de renvoyer des erreurs aux clients sans que ces dernières soient visibles dans les outils d’analyse des clients se révèle pour le moins insatisfaisant. Fort heureusement, nous avons lancé un projet visant à réorganiser ces systèmes bien avant les attaques récentes. Il permettra à terme à chaque service compris au sein de notre infrastructure de journaliser ses propres données, au lieu de s’en remettre à notre proxy de logique métier pour consolider et émettre les données de journalisation. Cet incident a fait ressortir l’importance de ce travail, dans le cadre duquel nous redoublons d’efforts.
Nous travaillons également à une meilleure journalisation au niveau de la connexion, afin de nous permettre de repérer ce type d’abus de protocole bien plus rapidement, afin d’améliorer nos capacités d’atténuation des attaques DDoS.
Conclusion
Si l’attaque à laquelle cet article est consacré constituait sans conteste la dernière attaque record à ce jour, nous savons que ce ne sera pas la dernière. Alors que les attaques gagnent chaque jour en sophistication, Cloudflare travaille avec acharnement aux moyens d’identifier les nouvelles menaces de manière proactive, en déployant des contremesures sur notre réseau mondial afin de protéger nos millions de clients, immédiatement et automatiquement.
Cloudflare fournit une protection contre les attaques DDoS gratuite, totalement illimitée et sans surcoût lié à l’utilisation à l’ensemble de ses clients, et ce depuis 2017. Nous proposons en outre une gamme de fonctionnalités de sécurité supplémentaires afin de répondre aux besoins des entreprises de toutes les tailles. Contactez-nous si vous n’êtes pas sûr de savoir si vous êtes protégé ou si vous souhaitez comprendre comment vous pourriez l’être.
El 25 de agosto de 2023, empezamos a observar algunos ataques de inundación HTTP inusualmente voluminosos que afectaban a muchos de nuestros clientes. Nuestro sistema DDoS automatizado detectó y mitigó estos ataques. Sin embargo, no pasó mucho tiempo antes de que empezaran a alcanzar tamaños sin precedentes, hasta alcanzar finalmente un pico de 201 millones de solicitudes por segundo, casi el triple que el mayor ataque registrado hasta ese momento.
Lo más inquietante es que el atacante fuera capaz de generar semejante ataque con una botnet de solo 20 000 máquinas. Hoy en día existen botnets formadas por cientos de miles o millones de máquinas. La web suele recibir solo entre 1000 y 3000 millones de solicitudes por segundo, por eso no parece imposible que utilizando este método se pudiera concentrar el volumen de solicitudes de toda una web en un pequeño número de objetivos.
Detección y mitigación
Se trataba de un vector de ataque novedoso a una escala sin precedentes, pero las soluciones de protección de Cloudflare pudieron mitigar en gran medida los efectos más graves de los ataques. Si bien al principio observamos cierto impacto en el tráfico de los clientes, que afectó aproximadamente al 1 % de las solicitudes durante la oleada inicial de ataques, hoy hemos podido perfeccionar nuestros métodos de mitigación para detener el ataque de cualquier cliente de Cloudflare sin que nuestros sistemas se vean afectados.
Nos dimos cuenta de estos ataques mientras otros dos grandes empresas del sector, Google y AWS, observaban lo mismo. Trabajamos para consolidar los sistemas de Cloudflare y garantizar que, a día de hoy, todos nuestros clientes estén protegidos de este nuevo método de ataque DDoS sin que afecte a ningún cliente. También hemos participado con Google y AWS en una divulgación coordinada del ataque a los proveedores afectados y a los proveedores de infraestructuras críticas.
Este ataque fue posible mediante el abuso de algunas funciones del protocolo HTTP/2 y de detalles de implementación del servidor (para más información, véase CVE-2023-44487). Dado que el ataque aprovecha una deficiencia subyacente en el protocolo HTTP/2, creemos que cualquier proveedor que haya implementado este protocolo será objeto del ataque. Esto incluye todos los servidores web modernos. Nosotros, junto con Google y AWS, hemos revelado el método de ataque a los proveedores de servidores web, que esperamos implementen revisiones. Mientras tanto, la mejor protección es utilizar un servicio de mitigación de DDoS como el de Cloudflare frente a cualquier servidor web o API pública.
Este artículo analiza los detalles del protocolo HTTP/2, la función que explotaron los atacantes para generar estos ataques masivos, y las estrategias de mitigación que adoptamos para garantizar la protección de todos nuestros clientes. Nuestra esperanza es que, al publicar estos detalles, otros servidores y servicios web afectados dispongan de la información que necesitan para aplicar estrategias de mitigación. Y, además, el equipo de estándares del protocolo HTTP/2, así como los equipos que trabajen en futuros estándares web, puedan diseñarlos mejor para evitar este tipo de incidentes.
Detalles del ataque RST
HTTP es el protocolo de aplicación que permite la transferencia de información en la web. La semántica HTTP es común a todas las versiones de HTTP. La arquitectura general, la terminología y los aspectos del protocolo, como los mensajes de solicitud y respuesta, los métodos, los códigos de estado, los campos de encabezado y finalizador, el contenido de los mensajes y mucho más. Cada versión individual de HTTP define cómo se transforma la semántica en un “formato para transmisión” (wire format) para el intercambio a través de Internet. Por ejemplo, un cliente tiene que serializar un mensaje de solicitud en datos binarios y enviarlo, y luego el servidor lo vuelve a analizar en un mensaje que pueda procesar.
HTTP/1.1 utiliza una forma textual de serialización. Los mensajes de solicitud y respuesta se intercambian como una secuencia de caracteres ASCII, enviados a través de una capa de transporte fiable como TCP y utiliza el siguiente formato (donde CRLF significa “retorno de carro” y “salto de línea”):
Por ejemplo, una solicitud GET muy sencilla para https://blog.cloudflare.com/ tendría este aspecto en el formato para transmisión:
GET / HTTP/1.1 CRLFHost: blog.cloudflare.comCRLFCRLF
Y la respuesta sería la siguiente:
HTTP/1.1 200 OK CRLFServer: cloudflareCRLFContent-Length: 100CRLFtext/html; charset=UTF-8CRLFCRLF<100 bytes of data>
Este formato encapsula los mensajes en la transmisión, lo que significa que es posible utilizar una única conexión TCP para intercambiar varias solicitudes y respuestas. Sin embargo, el formato requiere que cada mensaje se envíe entero. Además, para correlacionar correctamente las solicitudes con las respuestas, se requiere un orden estricto, lo que significa que los mensajes se intercambian en serie y no se pueden multiplexar. Dos solicitudes GET, para https://blog.cloudflare.com/ y https://blog.cloudflare.com/page/2/,, serían:
GET / HTTP/1.1 CRLFHost: blog.cloudflare.comCRLFCRLFGET /page/2/ HTTP/1.1 CRLFHost: blog.cloudflare.comCRLFCRLF
Con las respuestas:
HTTP/1.1 200 OK CRLFServer: cloudflareCRLFContent-Length: 100CRLFtext/html; charset=UTF-8CRLFCRLF<100 bytes of data>CRLFHTTP/1.1 200 OK CRLFServer: cloudflareCRLFContent-Length: 100CRLFtext/html; charset=UTF-8CRLFCRLF<100 bytes of data>
Las páginas web requieren interacciones HTTP más complicadas que estos ejemplos. Cuando visites el blog de Cloudflare, tu navegador cargará numerosos scripts, estilos y activos multimedia. Si visitas la página principal utilizando HTTP/1.1 y decides rápidamente ir a la página 2, tu navegador puede elegir entre dos opciones. O bien esperar todas las respuestas en cola para la página que ya no quieres antes de que la página 2 pueda siquiera comenzar, o bien cancelar las solicitudes abiertas cerrando la conexión TCP y abriendo una nueva conexión. Ninguna de estas opciones es muy práctica. Los navegadores tienden a sortear estas limitaciones gestionando un conjunto de conexiones TCP (hasta 6 por host) e implementando una compleja lógica de envío de solicitudes sobre el conjunto.
HTTP/2 aborda muchos de los problemas de HTTP/1.1. Cada mensaje HTTP se serializa en un conjunto de tramas HTTP/2 que tienen tipo, longitud, etiquetas, identificador (Id.) de secuencia y carga malintencionada. El identificador de secuencia deja claro qué bytes de la transmisión corresponden a cada mensaje, lo que permite una multiplexación y concurrencia seguras. Las secuencias son bidireccionales. Los clientes envían tramas y los servidores responden con tramas que utilizan el mismo Id.
En HTTP/2, nuestra solicitud GET de https://blog.cloudflare.comse intercambiaría a través del identificador de secuencia 1. El cliente enviaría una trama HEADERS, y el servidor respondería con una trama HEADERS, seguida de una o más tramas DATA. Las solicitudes del cliente siempre utilizan identificadores de secuencia impares, por lo que las solicitudes posteriores utilizarían identificadores de secuencia 3, 5, etc. Las respuestas se pueden servir en cualquier orden, y se pueden intercalar tramas de distintas secuencias.
La multiplexación de secuencias y la concurrencia son potentes funciones de HTTP/2. Permiten un uso más eficiente de una única conexión TCP. HTTP/2 optimiza la obtención de recursos, especialmente cuando se combina con la priorización. Por otro lado, facilitar a los clientes el lanzamiento de grandes cantidades de trabajo paralelo puede aumentar el pico de demanda de recursos del servidor en comparación con HTTP/1.1. Este es un vector obvio de denegación de servicio.
Para ofrecer protección, HTTP/2 proporciona una noción de secuencias concurrentes activas máximas. El parámetro SETTINGS_MAX_CONCURRENT_STREAMS permite a un servidor anunciar su límite de concurrencia. Por ejemplo, si el servidor declara un límite de 100, entonces solo pueden estar activas 100 solicitudes en cualquier momento. Si un cliente intenta abrir una secuencia por encima de este límite, el servidor la rechazará mediante una trama RST_STREAM. El rechazo de la secuencia no afecta a las demás secuencias en curso en la conexión.
La realidad es un poco más complicada. Las secuencias tienen un ciclo de vida. A continuación se muestra un diagrama de la máquina de estado de la secuencia HTTP/2. El cliente y el servidor gestionan sus propias vistas del estado de una secuencia. Las tramas HEADERS, DATA y RST_STREAM activan transiciones cuando se envían o reciben. Aunque las vistas del estado de la secuencia son independientes, están sincronizadas.
Las tramas HEADERS y DATA incluyen una etiqueta END_STREAM, que cuando se establece en el valor 1 (verdadero), puede activar una transición de estado.
Examinemos esto con un ejemplo de una solicitud GET que no tiene contenido de mensaje. El cliente envía la solicitud como una trama HEADERS con la etiqueta END_STREAM establecida en 1. El cliente primero pasa la secuencia del estado inactivo al estado abierto, y luego pasa inmediatamente al estado semicerrado. El estado semicerrado del cliente significa que ya no puede enviar tramas HEADERS ni DATA, solo tramas WINDOW_UPDATE, PRIORITY o RST_STREAM. Sin embargo, puede recibir cualquier trama.
Una vez que el servidor recibe y analiza la trama HEADERS, cambia el estado de la secuencia de inactivo a abierto y luego a semicerrado, para que coincida con el cliente. El estado semicerrado del servidor significa que puede enviar cualquier trama, pero solo recibir tramas WINDOW_UPDATE, PRIORITY o RST_STREAM.
La respuesta a la solicitud GET incluye el contenido del mensaje, por lo que el servidor envía una trama HEADERS con la etiqueta END_STREAM establecida en 0, y luego una trama DATA con la etiqueta END_STREAM establecida en 1. La trama DATA marca la transición de la secuencia de semicerrado a cerrado en el servidor. Cuando el cliente la recibe, también pasa a cerrado. Una vez se cierra una secuencia, no se pueden enviar ni recibir tramas.
Aplicando de nuevo este ciclo de vida al contexto de la concurrencia, HTTP/2 establece:
Las secuencias que están en estado “abierto” o en cualquiera de los estados “semicerrado” cuentan para el número máximo de secuencias que un punto final puede abrir. Las secuencias en cualquiera de estos tres estados cuentan para el límite anunciado en el ajuste SETTINGS_MAX_CONCURRENT_STREAMS.
En teoría, el límite de concurrencia es útil. Sin embargo, hay factores prácticos que dificultan su eficacia, de los que hablaremos más adelante en el blog.
Anulación de solicitudes HTTP/2
Antes hemos hablado de la anulación por parte del cliente de solicitudes en curso. El protocolo HTTP/2 admite esta función de una forma mucho más eficaz que HTTP/1.1. En lugar de tener que interrumpir toda la conexión, un cliente puede enviar una trama RST_STREAM para una única secuencia. Esta ventaja indica al servidor que deje de procesar la solicitud y anule la respuesta, lo que libera recursos del servidor y evita malgastar ancho de banda.
Consideremos nuestro ejemplo anterior de tres solicitudes. Esta vez el cliente anula la solicitud en la secuencia 1 después de que se hayan enviado todas las tramas HEADERS. El servidor analiza esta trama RST_STREAM antes de estar preparado para servir la respuesta y, en su lugar, solo responde a las secuencias 3 y 5:
La anulación de solicitudes es una función útil. Por ejemplo, al desplazarse por una página web con varias imágenes, un navegador web puede cancelar las imágenes que quedan fuera de la ventanilla, lo que significa que las imágenes que entran en ella pueden cargarse más rápido. El protocolo HTTP/2 hace que este comportamiento sea mucho más eficiente en comparación con HTTP/1.1.
Una secuencia de solicitud que se anula, pasa rápidamente por el ciclo de vida de la secuencia. La trama HEADERS del cliente con la etiqueta END_STREAM establecida en 1 pasa del estado de inactivo a abierto a semicerrado, luego RST_STREAM marca inmediatamente una transición de semicerrado a cerrado.
Recuerda que solo las secuencias que están en estado abierto o semicerrado contribuyen al límite de concurrencia de la secuencia. Cuando un cliente anula una secuencia, obtiene instantáneamente la capacidad de abrir otra en su lugar, y puede enviar otra solicitud inmediatamente. Este es el quid de la cuestión que permite el funcionamiento de CVE-2023-44487.
Restablecimientos rápidos que conducen a la denegación de servicio
Se puede abusar de la anulación de solicitudes HTTP/2 para restablecer rápidamente un número ilimitado de secuencias. Cuando un servidor HTTP/2 es capaz de procesar las tramas RST_STREAM enviadas por el cliente y cambiar el estado con suficiente rapidez, estos restablecimientos rápidos no causan ningún problema. Los problemas empiezan a surgir cuando se produce algún tipo de retraso o demora en la limpieza. El cliente puede hacer tantas solicitudes que se acumule trabajo atrasado, lo que se traduce en un consumo excesivo de recursos en el servidor.
Una arquitectura común de implementación HTTP consiste en ejecutar un proxy HTTP/2 o un equilibrador de carga delante de otros componentes. Cuando llega una solicitud de un cliente, se envía rápidamente y el trabajo real se realiza como una actividad asíncrona en otro lugar. Esta operación permite al proxy gestionar el tráfico de clientes de forma muy eficiente. Sin embargo, esta separación de preocupaciones puede dificultar que el proxy ordene los trabajos en proceso. Por lo tanto, estas implementaciones son más propensas a tropezar con problemas derivados de los restablecimientos rápidos.
Cuando los proxies inversos de Cloudflare procesan el tráfico entrante de clientes HTTP/2, copian los datos del socket de la conexión en un búfer y procesan esos datos almacenados en búfer en orden. A medida que se lee cada solicitud (tramas HEADERS y DATA), se envía a un servicio ascendente. Cuando se leen tramas RST_STREAM, se elimina el estado local de la solicitud y se notifica al servicio ascendente que la solicitud se ha anulado. Todo el proceso se repite hasta que se consuma todo el búfer. Sin embargo, se puede abusar de esta lógica. Si un cliente malintencionado empieza a enviar una enorme cadena de solicitudes y restablecimientos al inicio de una conexión, nuestros servidores las leerán todas con impaciencia y añadirán tensión a los servidores ascendentes hasta el punto de ser incapaces de procesar ninguna nueva solicitud entrante.
Algo que es importante destacar es que la concurrencia de secuencias por sí sola no puede mitigar el restablecimiento rápido. El cliente puede editar las solicitudes para crear altas tasas de solicitudes, independientemente del valor SETTINGS_MAX_CONCURRENT_STREAMS elegido por el servidor.
Análisis exhaustivo de Rapid Reset
A continuación, mostramos un ejemplo de restablecimiento rápido reproducido utilizando un cliente de prueba de concepto que intenta enviar un total de 1000 solicitudes. He utilizado un servidor estándar sin ningún tipo de medida de mitigación, que escucha en el puerto 443 en un entorno de prueba. El tráfico se examina utilizando Wireshark y se filtra para que solo muestre el tráfico HTTP/2 para mayor claridad. Descarga la interfaz pcap para ver explicación.
Es un poco difícil de ver, porque hay muchas tramas. Podemos ver un resumen rápido con la herramienta Estadísticas > HTTP2 de Wireshark:
La primera trama de este rastreo, en el paquete 14, es la trama SETTINGS del servidor, que anuncia una concurrencia de secuencia máxima de 100. En el paquete 15, el cliente envía unas cuantas tramas de control y luego empieza a hacer solicitudes que se restablecen rápidamente. La primera trama HEADERS tiene 26 bytes de longitud, todas las tramas HEADERS posteriores tienen solo 9 bytes. Esta diferencia de tamaño se debe a una tecnología de compresión llamada HPACK. En total, el paquete 15 contiene 525 solicitudes, que llegan hasta la secuencia 1051.
Curiosamente, la trama RST_STREAM para la secuencia 1051 no cabe en el paquete 15, por lo que en el paquete 16 vemos que el servidor envía una respuesta 404. A continuación, en el paquete 17, el cliente sí envía la trama RST_STREAM, antes de pasar a enviar las 475 solicitudes restantes.
Observa que, aunque el servidor anunciaba 100 secuencias simultáneas, los dos paquetes enviados por el cliente enviaban muchas más tramas HEADERS. El cliente no tenía que esperar ningún tráfico de retorno del servidor, solo estaba limitado por el tamaño de los paquetes que podía enviar. No se ven tramas RST_STREAM del servidor en este rastreo, lo que indica que el servidor no observó una violación de secuencia concurrente.
Impacto en los clientes
Como se ha mencionado anteriormente, a medida que se anulan las solicitudes, los servicios ascendentes reciben una notificación y pueden cancelar las solicitudes antes de gastar demasiados recursos en ello. Así fue este ataque, en el que la mayoría de las solicitudes maliciosas nunca se reenviaron a los servidores de origen. Sin embargo, el gran tamaño de estos ataques causó cierto impacto.
En primer lugar, cuando la tasa de solicitudes entrantes alcanzó picos nunca vistos, recibimos informes de un aumento de los niveles de errores 502 que recibían los clientes. Esto ocurrió en nuestros centros de datos más afectados, mientras trabajaban para procesar todas las solicitudes. Aunque nuestra red está diseñada para hacer frente a grandes ataques, esta vulnerabilidad concreta expuso un punto débil de nuestra infraestructura. Profundicemos un poco más en los detalles, centrándonos en cómo se gestionan las solicitudes entrantes cuando llegan a uno de nuestros centros de datos:
Podemos ver que nuestra infraestructura está compuesta por una cadena de diferentes servidores proxy con distintas responsabilidades. En concreto, cuando un cliente se conecta a Cloudflare para enviar tráfico HTTPS, primero llega a nuestro proxy de descifrado TLS: descifra el tráfico TLS, procesa el tráfico HTTP 1, 2 o 3, y luego lo reenvía a nuestro proxy de “lógica empresarial”. Este se encarga de cargar todas las configuraciones para cada cliente, luego enruta las solicitudes correctamente a otros servicios ascendentes, y lo que es más importante en nuestro caso, también se encarga de las funciones de seguridad. Aquí es donde se procesa la mitigación del ataque a la capa 7.
El problema de este vector de ataque es que consigue enviar muchas solicitudes muy rápido en cada conexión. Cada una de ellas tenía que reenviarse al proxy de lógica empresarial antes de que tuviéramos la oportunidad de bloquearla. A medida que el procesamiento de solicitudes superaba la capacidad de nuestro proxy, la canalización que conecta estos dos servicios alcanzó su nivel de saturación en algunos de nuestros servidores.
Cuando esto ocurre, el proxy TLS ya no se puede conectar a su proxy ascendente, por eso algunos clientes recibieron un error básico “502 Bad Gateway” durante los ataques más graves. Es importante señalar que, a partir de hoy, los registros utilizados para crear análisis HTTP también se emiten por nuestro proxy de lógica empresarial. La consecuencia de ello es que estos errores no son visibles en el panel de control de Cloudflare. Nuestros paneles de control internos muestran que alrededor del 1 % de las solicitudes se vieron afectadas durante la oleada inicial de ataques (antes de que implementáramos las medidas de mitigación). En ese momento, se alcanzaron picos de alrededor del 12 % durante unos segundos en el ataque más grave, ocurrido el 29 de agosto. El siguiente gráfico muestra la relación de estos errores durante dos horas mientras ocurría el ataque:
Trabajamos para reducir este número drásticamente en los días siguientes, como se detalla más adelante en este artículo. Gracias a los cambios en nuestra pila y a nuestras medidas de mitigación, que reducen considerablemente el tamaño de estos ataques, este número es, en la práctica, nulo hoy día.
Errores 499 y los desafíos para la concurrencia de secuencias HTTP/2
Otro síntoma notificado por algunos clientes es un aumento de los errores 499. La razón de este inconveniente es un poco diferente y está relacionada con la máxima concurrencia de secuencias en una conexión HTTP/2 detallada anteriormente en este artículo.
Los parámetros de HTTP/2 se intercambian al inicio de una conexión mediante tramas SETTINGS. Si no se recibe un parámetro explícito, se aplican los valores por defecto. Una vez que un cliente establece una conexión HTTP/2, puede esperar las tramas SETTINGS de un servidor (lento) o puede asumir los valores por defecto y empezar a hacer solicitudes (rápido). Para el ajuste SETTINGS_MAX_CONCURRENT_STREAMS, el valor por defecto es ilimitado en la práctica (los identificadores de secuencia utilizan un espacio numérico de 31 bits, y las solicitudes utilizan números impares, por lo que el límite real es 1073741824). La especificación recomienda que un servidor no ofrezca menos de 100 secuencias. Los clientes se suelen inclinar por la velocidad, por lo que no suelen esperar a la configuración del servidor, lo que crea una especie de condición de anticipación. Los clientes arriesgan en cuanto al límite que puede elegir el servidor. Si se equivocan, la solicitud será rechazada y habrá que volver a intentar. El riesgo en las secuencias 1073741824 es ridículo. En su lugar, muchos clientes deciden limitarse a emitir 100 secuencias simultáneas, con la esperanza de que los servidores sigan la recomendación de la especificación. Cuando los servidores eligen algo por debajo de 100, esta apuesta del cliente falla y las secuencias se reinician.
Hay muchas razones por las que un servidor puede restablecer una secuencia más allá de la superación del límite de concurrencia. HTTP/2 es estricto y exige que se cierre una secuencia cuando se produzcan errores de análisis sintáctico o lógicos. En 2019, Cloudflare desarrolló varias medidas de mitigación en respuesta a las vulnerabilidades DoS de HTTP/2. Varias de esas vulnerabilidades obedecían a un mal comportamiento del cliente, que llevaba al servidor a reiniciar una secuencia. Una estrategia muy eficaz para restringir a esos clientes consiste en contar el número de restablecimientos del servidor durante una conexión y, cuando supera algún valor umbral, cerrar la conexión con una trama GOAWAY. Los clientes legítimos pueden cometer uno o dos errores en una conexión y eso es aceptable. Un cliente que cometa demasiados errores probablemente tenga un problema o sea malintencionado, por lo que el cierre de la conexión aborda ambos casos.
Al responder a los ataques DoS habilitados por CVE-2023-44487, Cloudflare redujo la concurrencia máxima de secuencias a 64. Antes de realizar este cambio, no éramos conscientes de que los clientes no esperan a la trama SETTINGS y, en su lugar, asumen una concurrencia de 100. En efecto, algunas páginas web, como una galería de imágenes, hacen que un navegador envíe 100 solicitudes inmediatamente al inicio de una conexión. Por desgracia, las 36 secuencias que superaban nuestro límite necesitaban restablecerse, lo que activó nuestras medidas de mitigación de recuento. Esta operación implicaba cerrar las conexiones de los clientes legítimos, lo que provocaba un fallo total en la carga de la página. En cuanto nos dimos cuenta de este problema de interoperabilidad, cambiamos la concurrencia máxima de secuencias a 100.
Respuesta de Cloudflare
En 2019 se revelaron varias vulnerabilidades DoS relacionadas con implementaciones de HTTP/2. Cloudflare desarrolló e implementó una serie de detecciones y medidas de mitigación en respuesta. CVE-2023-44487 es una manifestación diferente de la vulnerabilidad HTTP/2. Sin embargo, para mitigarla pudimos ampliar las protecciones existentes para supervisar las tramas RST_STREAM enviadas por el cliente y cerrar las conexiones cuando se utilizan con fines abusivos. Los usos legítimos de RST_STREAM por parte del cliente no se ven afectados.
Además de una solución directa, hemos implementado varias mejoras en el código de procesamiento de tramas y envío de solicitudes HTTP/2 del servidor. Además, hemos mejorado las colas y la programación del servidor de lógica empresarial para reducir el trabajo innecesario y mejorar la capacidad de respuesta de la anulación. En conjunto, estos avances disminuyen el impacto de varios patrones potenciales de abuso, además de dar más espacio al servidor para procesar las solicitudes antes de que pueda saturarse.
Mitigación previa de los ataques
Cloudflare ya disponía de sistemas para mitigar eficazmente los ataques muy grandes con métodos menos costosos. Uno de ellos se llama “IP Jail”. En los ataques hipervolumétricos, este sistema recoge las direcciones IP de los clientes que participan en el ataque e impide que se conecten a la propiedad que es objeto de ataque, bien a nivel de IP, bien en nuestro proxy TLS. Sin embargo, este sistema necesita unos segundos para ser plenamente eficaz. Durante estos preciados segundos, los servidores de origen ya están protegidos, pero nuestra infraestructura aún tiene que aceptar todas las solicitudes HTTP. Como esta nueva botnet no tiene un periodo de inicialización en la práctica, necesitamos poder neutralizar los ataques antes de que se conviertan en un problema.
Para conseguirlo, hemos ampliado el sistema de IP Jail para proteger toda nuestra infraestructura. Una vez que se “bloquea” una dirección IP, no solo se bloquea su conexión a la propiedad que está siendo blanco de ataque, sino que también prohibimos que las direcciones IP correspondientes utilicen HTTP/2 a cualquier otro dominio en Cloudflare durante un tiempo. Como tales abusos de protocolo no son posibles utilizando HTTP/1.x, este enfoque limita la capacidad del atacante para ejecutar grandes ataques, mientras que cualquier cliente legítimo que comparta la misma dirección IP solo percibirá un leve impacto en rendimiento durante ese tiempo. Las medidas de mitigación basadas en la IP son una herramienta deficiente, por eso debemos ser muy prudentes al utilizarlas a esa escala, y tratar de evitar los falsos positivos en la medida de lo posible. Además, la vida útil de una IP determinada en una botnet suele ser corta, por lo que cualquier medida de mitigación a largo plazo probablemente hará más mal que bien. El siguiente gráfico muestra la rotación de direcciones IP en los ataques que presenciamos:
Como podemos observar, muchas direcciones IP nuevas detectadas en un día determinado desaparecen muy rápido después.
Como todas estas acciones ocurren en nuestro proxy TLS al principio de nuestra canalización HTTPS, se ahorran considerables recursos en comparación con nuestro sistema de mitigación de capa 7 habitual. Esto nos ha permitido aguantar estos ataques mucho mejor y ahora el número de errores 502 aleatorios causados por estas botnets se ha reducido a cero.
Mejoras en la observabilidad
Otro frente en el que estamos implementando cambios es la observabilidad. La devolución de errores a los clientes sin que sean visibles en los análisis de los clientes es insatisfactorio. Afortunadamente, hay un proyecto en marcha para revisar estos sistemas desde mucho antes de estos ataques. Con el tiempo, permitirá que cada servicio de nuestra infraestructura registre sus propios datos, en lugar de depender de nuestro proxy de lógica empresarial para consolidar y emitir datos de registro. Este incidente subrayó la importancia de este trabajo, y estamos redoblando nuestros esfuerzos.
También estamos trabajando en mejorar el registro a nivel de conexión para que nos permita detectar estos abusos de protocolo mucho más rápido y así mejorar nuestras capacidades de mitigación de ataques DDoS.
Conclusión
Aunque este ha sido el último ataque que ha batido récords, sabemos que no será el último. Conforme los ataques se vuelven más sofisticados, Cloudflare trabaja sin descanso para identificar proactivamente nuevas amenazas, implementando contramedidas en nuestra red global para que nuestros millones de clientes estén protegidos de forma inmediata y automática.
Cloudflare ofrece protección DDoS gratuita e ilimitada a todos nuestros clientes desde 2017. Además, ofrecemos una serie de funciones de seguridad adicionales que se adaptan a las necesidades de organizaciones de todos los tamaños. Ponte en contacto con nosotros si no estás seguro de estar protegido o quieres saber cómo puedes estarlo].
Am 25. August 2023 begannen wir, ungewöhnlich große HTTP-Angriffe auf viele unserer Kunden zu bemerken. Diese Angriffe wurden von unserem automatischen DDoS-System erkannt und abgewehrt. Es dauerte jedoch nicht lange, bis sie rekordverdächtige Ausmaße annahmen und schließlich einen Spitzenwert von knapp über 201 Millionen Anfragen pro Sekunde erreichten. Damit waren sie fast dreimal so groß wie der bis zu diesem Zeitpunkt größte Angriff, den wir jemals verzeichnet hatten.
Besorgniserregend ist die Tatsache, dass der Angreifer in der Lage war, einen solchen Angriff mit einem Botnetz von lediglich 20.000 Rechnern durchzuführen. Es gibt heute Botnetze, die aus Hunderttausenden oder Millionen von Rechnern bestehen. Bedenkt man, dass das gesamte Web in der Regel nur zwischen 1 bis 3 Milliarden Anfragen pro Sekunde verzeichnet, ist es nicht unvorstellbar, dass sich mit dieser Methode quasi die Anzahl aller Anfragen im Internet auf eine kleine Reihe von Zielen konzentrieren ließe.
Erkennen und Abwehren
Dies war ein neuartiger Angriffsvektor in einem noch nie dagewesenen Ausmaß, aber die bestehenden Schutzmechanismen von Cloudflare konnten die Wucht der Angriffe weitgehend bewältigen. Zunächst sahen wir einige Auswirkungen auf den Traffic unserer Kunden – etwa 1 % der Anfragen waren während der ersten Angriffswelle betroffen –, doch heute konnten wir unsere Abwehrmethoden so verfeinern, dass der Angriff für jeden Cloudflare-Kunden gestoppt werden konnte, ohne dass er unsere Systeme beeinträchtigte.
Wir haben diese Angriffe zur gleichen Zeit bemerkt, als zwei andere große Branchenakteure – Google und AWS – dasselbe erlebten. Wir haben daran gearbeitet, die Systeme von Cloudflare zu verstärken, um sicherzustellen, dass alle unsere Kunden heute vor dieser neuen DDoS-Angriffsmethode geschützt sind, ohne dass es Auswirkungen auf die Kunden gibt. Außerdem haben wir gemeinsam mit Google und AWS an einer koordinierten Offenlegung des Angriffs gegenüber den betroffenen Anbietern und Betreibern kritischer Infrastrukturen mitgewirkt.
Dieser Angriff wurde durch den Missbrauch einiger Funktionen des HTTP/2-Protokolls und von Details der Server-Implementierung ermöglicht (siehe CVE-2023-44487 für Details). Da der Angriff eine zugrundeliegende Sicherheitslücke im HTTP/2-Protokoll ausnutzt, glauben wir, dass jeder Anbieter, der HTTP/2 implementiert hat, dem Angriff ausgesetzt ist. Dazu gehört jeder moderne Webserver. Gemeinsam mit Google und AWS haben wir die Angriffsmethode den Anbietern von Webservern offengelegt, von denen wir erwarten, dass sie Patches implementieren werden. Die beste Schutzmaßnahme ist einstweilen die Verwendung eines DDoS-Abwehrdienstes wie Cloudflare vor jedem Web- oder API-Server, der mit dem Internet verbunden ist.
Dieser Beitrag befasst sich mit allen Einzelheiten zum HTTP/2-Protokoll, der Funktion, die Angreifer ausnutzen, um diese massiven Angriffe zu generieren, und den Abwehrstrategien, die wir ergriffen haben, um sicherzustellen, dass alle unsere Kunden geschützt sind. Wir hoffen, dass durch die Bekanntgabe dieser Details andere betroffene Webserver und -dienste die Informationen erhalten, die sie benötigen, um Abwehrstrategien zum Schutz vor dieser Sicherheitslücke zu implementieren. Darüber hinaus können das Team für die HTTP/2-Protokollstandards sowie die Teams, die an künftigen Webstandards arbeiten, diese besser gestalten, um solche Angriffe zu verhindern.
Nähere Einzelheiten zum RST-Angriff
HTTP ist das Anwendungsprotokoll, auf dem das Web basiert. HTTP Semantics ist allen Versionen von HTTP gemeinsam – die Gesamtarchitektur, Terminologie und Protokollaspekte wie Anfrage- und Antwortnachrichten, Methoden, Statuscodes, Header- und Trailer-Felder, Nachrichteninhalte und vieles mehr. Jede einzelne HTTP-Version definiert, wie die Semantik in ein „Austauschformat“ („wire format“) für den Austausch über das Internet umgewandelt wird. So muss ein Client beispielsweise eine Anfragenachricht in binäre Daten serialisieren und senden, die dann vom Server wieder in eine verarbeitbare Nachricht umgewandelt werden.
HTTP/1.1 verwendet eine textuelle Form der Serialisierung. Anfrage- und Antwortnachrichten werden als Strom von ASCII-Zeichen ausgetauscht, die über eine zuverlässige Transportebene wie TCP unter Verwendung des folgenden Formats (wobei CRLF für Carriage-Return und Linefeed steht) gesendet werden:
Eine sehr einfache GET-Anfrage für https://blog.cloudflare.com/ würde beim Austausch zum Beispiel so aussehen:
GET / HTTP/1.1 CRLFHost: blog.cloudflare.comCRLFCRLF
Und die Antwort würde so aussehen:
HTTP/1.1 200 OK CRLFServer: cloudflareCRLFContent-Length: 100CRLFtext/html; charset=UTF-8CRLFCRLF<100 bytes of data>
Dieses Format rahmt (Frame)Nachrichten bei der Übertragung ein, was bedeutet, dass es möglich ist, eine einzige TCP-Verbindung für den Austausch mehrerer Anfragen und Antworten zu verwenden. Das Format erfordert jedoch, dass jede Nachricht als Ganzes gesendet wird. Außerdem ist für die korrekte Zuordnung von Anfragen und Antworten eine strikte Reihenfolge erforderlich, d. h. die Nachrichten werden seriell ausgetauscht und können nicht gemultiplext werden. Zwei GET-Anfragen für https://blog.cloudflare.com/ und https://blog.cloudflare.com/page/2/, wären:
GET / HTTP/1.1 CRLFHost: blog.cloudflare.comCRLFCRLFGET /page/2/ HTTP/1.1 CRLFHost: blog.cloudflare.comCRLFCRLF
Mit den Antworten:
HTTP/1.1 200 OK CRLFServer: cloudflareCRLFContent-Length: 100CRLFtext/html; charset=UTF-8CRLFCRLF<100 bytes of data>CRLFHTTP/1.1 200 OK CRLFServer: cloudflareCRLFContent-Length: 100CRLFtext/html; charset=UTF-8CRLFCRLF<100 bytes of data>
Webseiten erfordern kompliziertere HTTP-Interaktionen als diese Beispiele. Wenn Sie den Cloudflare-Blog besuchen, lädt Ihr Browser mehrere Skripte, Stile und Medieninhalte. Wenn Sie den Cloudflare-Blog besuchen, lädt Ihr Browser mehrere Skripte, Stile und Medieninhalte. Entweder muss man alle in der Warteschlange befindlichen Antworten für die nicht mehr gewünschte Seite abwarten, bevor Seite 2 überhaupt starten kann, oder man bricht laufende Anfragen ab, indem man die TCP-Verbindung schließt und eine neue Verbindung öffnet. Beides ist nicht gerade zweckmäßig. Browser neigen dazu, diese Beschränkungen zu umgehen, indem sie einen Pool von TCP-Verbindungen (bis zu 6 pro Host) verwalten und eine komplexe Logik für den Versand von Anfragen über den Pool implementieren.
HTTP/2 behebt viele der Probleme mit HTTP/1.1. Jede HTTP-Nachricht wird in einen Satz von HTTP/2-Frames serialisiert, die Typ, Länge, Flags, Stream Identifier (ID) und Payload haben. Die Stream-ID macht deutlich, welche Bytes bei der Übertragung zu welcher Nachricht gehören, was sicheres Multiplexing und Gleichzeitigkeit ermöglicht. Streams sind bidirektional. Clients senden Frames und Server antworten mit Frames, die dieselbe ID verwenden.
In HTTP/2 würde unsere GET-Anfrage für https://blog.cloudflare.com über Stream-ID 1 ausgetauscht, wobei der Client einen HEADERS-Frame sendet und der Server mit einem HEADERS-Frame antwortet, gefolgt von einem oder mehreren DATA-Frames. Client-Anfragen verwenden immer ungerade Stream-IDs, sodass nachfolgende Anfragen die Stream-ID 3, 5 usw. verwenden würden. Die Antworten können in beliebiger Reihenfolge gesendet werden, und Frames aus verschiedenen Streams können ineinander verschachtelt werden.
Stream-Multiplexing und Gleichzeitigkeit sind leistungsstarke Funktionen von HTTP/2. Sie ermöglichen eine effizientere Nutzung einer einzigen TCP-Verbindung. HTTP/2 optimiert den Abruf von Ressourcen, insbesondere in Verbindung mit der Priorisierung. Andererseits kann die Erleichterung für Clients, große Mengen an paralleler Arbeit zu starten, den Spitzenbedarf an Serverressourcen im Vergleich zu HTTP/1.1 erhöhen. Dies ist ein naheliegender Vektor für Denial-of-Service.
Um einige Leitlinien bereitzustellen, bietet HTTP/2 einen Begriff für maximal aktive gleichzeitige Streams. Der Parameter SETTINGS_MAX_CONCURRENT_STREAMS ermöglicht es einem Server, sein Limit für die Gleichzeitigkeit bekannt zu geben. Wenn der Server beispielsweise ein Limit von 100 angibt, können zu jedem Zeitpunkt nur 100 Anfragen aktiv sein. Versucht ein Client, einen Stream oberhalb dieser Grenze zu öffnen, muss er vom Server mit einem RST_STREAM-Frame abgelehnt werden. Die Ablehnung eines Streams hat keine Auswirkungen auf die anderen Streams, die sich in der Verbindung befinden.
In Wahrheit ist die Sache ein wenig komplizierter. Streams haben einen Lebenszyklus. Unten sehen Sie ein Diagramm des HTTP/2-Stream-Zustandsrechner. Client und Server verwalten ihre eigenen Ansichten über den Zustand bzw. Status eines Streams. HEADERS-, DATA- und RST_STREAM-Frames lösen Übergänge aus, wenn sie gesendet oder empfangen werden. Obwohl die Ansichten des Stream-Zustands unabhängig sind, werden sie synchronisiert.
HEADERS- und DATA-Frames enthalten ein END_STREAM-Flag, das, wenn es auf den Wert 1 (true) gesetzt ist, einen Übergang des Zustands auslösen kann.
Lassen Sie uns dies anhand eines Beispiels für eine GET-Anfrage ohne Nachrichteninhalt durchgehen. Der Client sendet die Anfrage als HEADERS-Frame, wobei das END_STREAM-Flag auf 1 gesetzt ist. Der Client überführt den Stream zunächst vom Zustand „idle“ in den Zustand „open“ und geht dann sofort in den Zustand „half-closed“ über. Hat der Client den Zustand „half-closed“, bedeutet dies, dass er keine HEADERS oder DATA mehr senden kann, sondern nur noch WINDOW_UPDATE-, PRIORITY- oder RST_STREAM-Frames. Er kann jedoch jeden Frame empfangen.
Sobald der Server den HEADERS-Frame empfängt und analysiert, ändert er den Stream-Zustand von „idle“ zu „open“ und dann zu „half-closed“, damit er mit dem Client übereinstimmt. Der Zustand „half-closed“ bedeutet, dass der Server jeden Frame senden kann, aber nur WINDOW_UPDATE-, PRIORITY- oder RST_STREAM-Frames empfangen kann.
Die Antwort auf die GET-Anfrage enthält Nachrichteninhalte, daher sendet der Server HEADERS mit dem END_STREAM-Flag auf 0, dann DATA mit dem END_STREAM-Flag auf 1. Der DATA-Frame löst auf dem Server den Übergang des Streams von „half-closed“ auf „closed“ aus. Wenn der Client ihn empfängt, geht er ebenfalls in den Zustand „closed“ über. Sobald ein Stream geschlossen ist, können keine Frames mehr gesendet oder empfangen werden.
Wenn man diesen Lebenszyklus zurück in den Kontext der Gleichzeitigkeit überträgt, stellt HTTP/2 fest:
Streams, die sich im Zustand „open“ oder im Zustand „half-closed“ befinden, werden auf die maximale Anzahl von Streams angerechnet, die ein Endpunkt öffnen darf. Streams, die sich in einem dieser drei Zustände befinden, werden auf das in der Einstellung SETTINGS_MAX_CONCURRENT_STREAMS angegebene Limit angerechnet.
Theoretisch ist das Limit für die Gleichzeitigkeit nützlich. Es gibt jedoch praktische Faktoren, die seine Wirksamkeit beeinträchtigen, worauf wir später in diesem Blog eingehen werden.
Widerruf einer HTTP/2-Anfrage
Vorhin haben wir über den Widerruf von gerade in Bearbeitung befindlichen Client-Anfragen gesprochen. HTTP/2 unterstützt dies auf wesentlich effizientere Weise als HTTP/1.1. Anstatt die gesamte Verbindung zu unterbrechen, kann ein Client einen RST_STREAM-Frame für einen einzelnen Stream senden. Dadurch wird der Server angewiesen, die Bearbeitung der Anfrage zu beenden und die Antwort abzubrechen, wodurch Serverressourcen frei werden und keine Bandbreite verschwendet wird.
Betrachten wir unser vorheriges Beispiel mit 3 Anfragen. Dieses Mal widerruft der Client die Anfrage auf Stream 1, nachdem alle HEADERS gesendet wurden. Der Server analysiert diesen RST_STREAM-Frame, bevor er bereit ist, die Antwort zu übermitteln, und antwortet stattdessen nur auf Stream 3 und 5:
Der Widerruf von Anfragen ist eine nützliche Funktion. Beim Scrollen einer Webseite mit mehreren Bildern kann ein Webbrowser beispielsweise Bilder, die außerhalb des Sichtfensters liegen, löschen, sodass Bilder, die in das Sichtfenster gelangen, schneller geladen werden können. HTTP/2 macht dieses Verhalten im Vergleich zu HTTP/1.1 wesentlich effizienter.
Ein widerrufener Anfrage-Stream durchläuft den Lebenszyklus des Streams sehr schnell. Die HEADERS des Clients mit dem auf 1 gesetzten END_STREAM-Flag wechseln den Zustand von „idle“ zu „open“ zu „half-closed“, dann bewirkt RST_STREAM sofort einen Übergang von „half-closed“ zu „closed“.
Erinnern Sie sich, dass nur Streams, die sich im „open“ oder „half-closed“ Zustand befinden, auf das Limit für die Gleichzeitigkeit von Streams angerechnet werden. Wenn ein Client einen Stream abbricht, erhält er sofort die Möglichkeit, an dessen Stelle einen anderen Stream zu öffnen und kann sofort eine weitere Anfrage senden. Genau darum funktioniert CVE-2023-44487.
Schnelles Reset führt zu Denial of Service
Der Widerruf von HTTP/2-Anfragen kann dazu missbraucht werden, eine unbegrenzte Anzahl von Streams schnell zurückzusetzen. Wenn ein HTTP/2-Server in der Lage ist, vom Client gesendete RST_STREAM-Frames zu verarbeiten und den Zustand schnell genug abzubauen, stellen solche schnellen Resets kein Problem dar. Problematisch wird es dann, wenn es bei den Aufräumarbeiten zu Verzögerungen oder Resets kommt.Der Client kann so viele Anfragen stellen, dass sich ein Rückstau bildet, der zu einem übermäßigen Ressourcenverbrauch auf dem Server führt.
Eine gängige HTTP-Bereitstellungsarchitektur besteht darin, einen HTTP/2-Proxy oder Load-Balancer vor anderen Komponenten zu betreiben. Wenn eine Client-Anfrage eintrifft, wird sie schnell abgewickelt und die eigentliche Arbeit wird als asynchrone Aktivität an anderer Stelle erledigt. So kann der Proxy den Client-Traffic sehr effizient verarbeiten. Diese Trennung kann es dem Proxy jedoch erschweren, die in Bearbeitung befindlichen Aufträge aufzuräumen. Daher ist es bei diesen Bereitstellungen wahrscheinlicher, dass es zu Problemen durch schnelle Resets kommt.
Wenn die Reverse-Proxies von Cloudflare eingehenden HTTP/2-Client-Traffic verarbeiten, kopieren sie die Daten aus dem Socket der Verbindung in einen Puffer und verarbeiten diese gepufferten Daten der Reihe nach. Beim Lesen jeder Anfrage (HEADERS- und DATA-Frames) wird diese an einen Upstream-Service weitergeleitet. Wenn RST_STREAM-Frames gelesen werden, wird der lokale Zustand für die Anfrage abgebaut und der vorgelagerte Dienst wird benachrichtigt, dass die Anfrage abgebrochen wurde. Dieser Vorgang wird so lange wiederholt, bis der gesamte Puffer verbraucht ist. Diese Logik kann jedoch missbraucht werden: Wenn ein böswilliger Client eine enorme Kette von Anfragen und Resets zu Beginn einer Verbindung sendet, würden unsere Server sie alle eifrig lesen und die vorgelagerten Server so stark belasten, dass sie keine neuen eingehenden Anfragen mehr verarbeiten können.
Es ist wichtig hervorzuheben, dass die Gleichzeitigkeit von Streams allein das schnelle Reset nicht abwehren kann. Der Client kann Anfragen abwälzen, um hohe Anfrageraten zu erzeugen, unabhängig von dem vom Server gewählten Wert von SETTINGS_MAX_CONCURRENT_STREAMS.
Rapid Reset genau analysiert
Hier ein Beispiel für das Reset anhand eines Proof-of-Concept-Clients, der versucht, insgesamt 1000 Anfragen zu stellen. Ich habe einen handelsüblichen Server ohne jegliche Abwehrmechanismen verwendet, der in einer Testumgebung auf Port 443 lauscht. Der Traffic wurde mit Wireshark analysiert und gefiltert, um nur HTTP/2-Traffic zu zeigen. Jetzt pcap herunterladen, um dem Vorgang zu folgen.
Das ist ein bisschen schwierig zu sehen, weil es viele Bilder gibt. Mit dem Wireshark-Tool Statistik > HTTP2 erhalten wir einen schnellen Überblick:
Der erste Frame in dieser Aufzeichnung, in Paket 14, ist der SETTINGS-Frame des Servers, der eine maximale Anzahl an gleichzeitigen Stream von 100 angibt. In Paket 15 sendet der Client einige Kontrollframes und beginnt dann mit Anfragen, die schnell zurückgesetzt werden. Der erste HEADERS-Frame ist 26 Byte lang, alle folgenden HEADERS sind nur 9 Byte lang. Dieser Größenunterschied ist auf eine Komprimierungstechnologie namens HPACK. zurückzuführen. Insgesamt enthält Paket 15 dabei 525 Anfragen, die bis zum Stream 1051 reichen.
Interessanterweise passt der RST_STREAM für Stream 1051 nicht in Paket 15, so dass der Server in Paket 16 mit einer 404-Antwort antwortet. In Paket 17 sendet der Client dann das RST_STREAM, bevor er mit dem Senden der restlichen 475 Anfragen fortfährt.
Beachten Sie, dass der Server zwar 100 gleichzeitige Streams ankündigte, die beiden vom Client gesendeten Pakete jedoch viel mehr HEADERS-Frames als diese Zahl enthielten. Der Client musste nicht auf den Antwort-Traffic des Servers warten, er war lediglich durch die Größe der Pakete begrenzt, die er senden konnte. In dieser Aufzeichnung sind keine RST_STREAM-Frames des Servers zu sehen, was darauf hindeutet, dass der Server keinen Verstoß gegen das Limit der Gleichzeitigkeit von Streams festgestellt hat.
Auswirkungen auf Kunden
Wie bereits erwähnt, werden vorgelagerte Dienste benachrichtigt, wenn Anfragen abgebrochen werden, und können diese abbrechen, bevor sie zu viele Ressourcen dafür verschwenden. Dies war bei diesem Angriff der Fall, bei dem die meisten bösartigen Anfragen nie an die Ursprungsserver weitergeleitet wurden. Die schiere Größe dieser Angriffe hatte jedoch einige Auswirkungen.
Erstens erreichten die eingehenden Anfragen höhere Spitzenwerte als jemals zuvor, und die Clients meldeten vermehrt 502-Fehler. Dies geschah in unseren am stärksten betroffenen Rechenzentren, da sie Mühe hatten, alle Anfragen zu verarbeiten. Unser Netzwerk ist zwar für große Angriffe ausgelegt, aber diese spezielle Sicherheitslücke deckte eine Schwäche in unserer Infrastruktur auf. Werfen wir einen genaueren Blick auf die Details, wobei wir uns darauf konzentrieren, wie eingehende Anfragen verarbeitet werden, wenn sie eines unserer Rechenzentren erreichen:
Wir sehen, dass unsere Infrastruktur aus einer Kette verschiedener Proxy-Server mit unterschiedlichen Zuständigkeiten besteht. Wenn sich ein Client mit Cloudflare verbindet, um HTTPS-Traffic zu senden, trifft er zunächst auf unseren TLS-Entschlüsselungs-Proxy: Er entschlüsselt den TLS-Traffic, verarbeitet den HTTP-1-, -2- oder -3-Traffic und leitet ihn dann an unseren Proxy für die „Geschäftslogik“ weiter. Dieser ist dafür zuständig, alle Einstellungen für jeden Kunden zu laden und dann die Anfragen korrekt an andere vorgelagerte Dienste weiterzuleiten – und, was in unserem Fall noch wichtiger ist, er ist auch für die Sicherheitsfunktionen zuständig. Hier wird die L7-Angriffsabwehr abgewickelt.
Das Problem bei diesem Angriffsvektor ist, dass er bei jeder einzelnen Verbindung sehr schnell sehr viele Anfragen senden kann. Jede dieser Anfragen musste an den Proxy für die Geschäftslogik weitergeleitet werden, bevor wir die Möglichkeit hatten, sie zu blockieren. Da der Anfragedurchsatz unsere Proxy-Kapazität überstieg, erreichte die Verbindungsleitung zwischen diesen beiden Diensten bei einigen unserer Server ihre Belastungsgrenze.
Wenn dies geschieht, kann der TLS-Proxy keine Verbindung mehr zu seinem vorgeschalteten Proxy herstellen, weshalb einige Clients bei den schwerwiegendsten Angriffen eine einfache „502 Bad Gateway“-Fehlermeldung erhielten. Es ist wichtig zu beachten, dass die Protokolle, die zur Erstellung von HTTP-Analysen verwendet werden, ab sofort auch von unserem Proxy für die Geschäftslogik ausgegeben werden. Dies hat zur Folge, dass diese Fehler im Cloudflare-Dashboard nicht sichtbar sind. Unsere internen Dashboards zeigen, dass etwa 1 % der Anfragen während der ersten Angriffswelle (bevor wir Abwehrmaßnahmen ergriffen) betroffen waren, mit Spitzenwerten von etwa 12 % für einige Sekunden während der schwerwiegendsten Angriffswelle am 29. August. Das folgende Diagramm zeigt das Verhältnis dieser Fehler über einen Zeitraum von zwei Stunden, in dem dies geschah:
In den darauffolgenden Tagen haben wir hart daran gearbeitet, diese Zahl drastisch zu reduzieren, wie in diesem Beitrag näher erläutert wird. Dank der Änderungen in unserem Stack und unserer Abwehreinrichtungen, die die Größe dieser Angriffe erheblich reduzieren, liegt diese Zahl heute praktisch bei null:
499-Fehler und die Herausforderungen für die Gleichzeitigkeit von HTTP/2-Streams
Ein weiteres Phänomen, von dem einige Kunden berichten, ist die Zunahme von 499.Fehlermeldungen. Die Ursache hierfür ist etwas anders und hängt mit der maximalen Anzahl gleichzeitiger Streams in einer HTTP/2-Verbindung zusammen, die weiter oben in diesem Beitrag beschrieben wurde.
HTTP/2-Einstellungen werden zu Beginn einer Verbindung über SETTINGS-Frames ausgetauscht. Wird kein expliziter Parameter angegeben, gelten die Standardwerte. Sobald ein Client eine HTTP/2-Verbindung aufgebaut hat, kann er auf die SETTINGS eines Servers warten (langsam) oder er kann die Standardwerte annehmen und mit den Anfragen beginnen (schnell). Für SETTINGS_MAX_CONCURRENT_STREAMS ist der Standardwert praktisch unbegrenzt (Stream-IDs verwenden einen 31-Bit-Zahlenraum, und Anfragen verwenden ungerade Zahlen, sodass das tatsächliche Limit bei 1073741824 liegt). In der Spezifikation wird empfohlen, dass ein Server nicht weniger als 100 Streams anbietet. Clients sind in der Regel auf Schnelligkeit bedacht und warten daher nicht auf Servereinstellungen, was zu einer Art Wettlauf führt. Clients wetten darauf, welchen Grenzwert der Server auswählt; wenn sie sich irren, wird die Anfrage abgelehnt und muss erneut gestellt werden. Auf 1073741824 zu wetten ist ein bisschen albern. Stattdessen beschließen viele Clients, sich auf die Ausgabe von 100 gleichzeitigen Streams zu beschränken, in der Hoffnung, dass die Server die empfohlene Spezifikation befolgen. Wenn die Server einen Wert unter 100 wählen, schlägt dieses Client-Ratespiel fehl und die Streams werden zurückgesetzt.
Es gibt viele Gründe, warum ein Server einen Stream bei Überschreitung des Limits für die Anzahl gleichzeitiger Streams zurücksetzen kann. HTTP/2 ist streng und verlangt, dass ein Stream geschlossen wird, wenn Parsing- oder Logikfehler auftreten. 2019 entwickelte Cloudflare mehrere Abwehrmaßnahmen als Reaktion auf HTTP/2 DoS-Schwachstellen. Mehrere dieser Schwachstellen wurden durch das Fehlverhalten eines Clients verursacht, was den Server dazu veranlasste, einen Stream zurückzusetzen. Eine sehr effektive Strategie, um solche Clients einzudämmen, besteht darin, die Anzahl der Server-Resets während einer Verbindung zu zählen und, wenn diese einen bestimmten Schwellenwert überschreitet, die Verbindung mit einem GOAWAY-Frame zu schließen. Legitime Clients machen vielleicht ein oder zwei Fehler während einer Verbindung, und das ist akzeptabel. Ein Client, der zu viele Fehler macht, ist wahrscheinlich entweder defekt oder böswillig; das Schließen der Verbindung ist in beiden Fällen zielführend.
Als Reaktion auf DoS-Angriffe, die durch CVE-2023-44487, ermöglicht wurden, hat Cloudflare die Anzahl der gleichzeitig zugelassenen Streams auf 64 reduziert. Vor dieser Änderung war uns nicht bewusst, dass Clients nicht auf SETTINGS warten und stattdessen für die maximale Anzahl gleichzeitiger Streams 100 annehmen. Einige Webseiten, wie z. B. eine Bildergalerie, veranlassen einen Browser in der Tat dazu, gleich zu Beginn einer Verbindung 100 Anfragen zu senden. Leider mussten die 36 Streams, die über unserem Limit lagen, alle zurückgesetzt werden, was unsere durch Zählung aktivierten Abwehrmaßnahmen auslöste. Das bedeutete, dass wir die Verbindungen von legitimen Clients beendeten, was zu einem kompletten Seitenladefehler führte. Als wir dieses Interoperabilitätsproblem erkannten, änderten wir die maximale Anzahl der gleichzeitig zugelassenen Streams auf 100.
Diese Schritte hat Cloudflare gesetzt
2019 wurden mehrere DoS-Schwachstellen im Zusammenhang mit Implementierungen von HTTP/2 aufgedeckt. Cloudflare hat daraufhin eine Reihe von Erkennungs- und Abwehrmaßnahmen entwickelt und implementiert. CVE-2023-44487 ist eine andere Ausprägung der HTTP/2-Schwachstelle. Um sie abzuwehren, konnten wir jedoch die bestehenden Schutzmaßnahmen erweitern, um vom Client gesendete RST_STREAM-Frames zu überwachen und Verbindungen zu schließen, wenn sie missbräuchlich verwendet werden. Legitime Client-Nutzungen für RST_STREAM sind davon nicht betroffen.
Neben einer direkten Korrektur haben wir mehrere Verbesserungen an der HTTP/2-Frame-Verarbeitung des Servers und am Code für die Anfragenabwicklung vorgenommen. Darüber hinaus wurden die Warteschlangen und die Scheduling-Funktion des Servers für die Geschäftslogik verbessert, um unnötige Arbeit zu vermeiden und die Reaktionsfähigkeit bei Widerrufen zu verbessern. Dadurch werden die Auswirkungen verschiedener potenzieller Missbrauchsmuster verringert und der Server erhält mehr Raum, um Anfragen zu bearbeiten, bevor er ausgelastet ist.
Angriffe einfacher abwehren
Cloudflare verfügte bereits über Systeme, um sehr große Angriffe mit weniger kostspieligen Methoden effizient abwehren zu können. Eines dieser Systeme heißt „IP Jail“ (weil IPs hier quasi „gefangen genommen“ werden). Bei hypervolumetrischen Angriffen sammelt dieses System die am Angriff beteiligten Client-IPs und verhindert, dass sie sich mit dem angegriffenen Objekt verbinden, entweder auf IP-Ebene oder in unserem TLS-Proxy. Dieses System benötigt jedoch einige Sekunden, um seine volle Wirkung zu entfalten; während dieser kostbaren Sekunden sind die Ursprünge bereits geschützt, aber unsere Infrastruktur muss immer noch alle HTTP-Anfragen aufnehmen. Da dieses neue Botnetz praktisch keine Anlaufzeit hat, müssen wir Angriffe neutralisieren können, bevor sie zu einem Problem werden können.
Zu diesem Zweck haben wir das IP-Jail-System erweitert, um unsere gesamte Infrastruktur zu schützen: Sobald eine IP darin „gefangen“ ist, kann sie sich nicht nur nicht mehr mit der angegriffenen Domain verbinden, sondern wir verbieten den entsprechenden IPs für einige Zeit auch die Nutzung von HTTP/2 für jede andere auf Cloudflare gehostete Domain. Da derartige Protokollmissbräuche mit HTTP/1.x nicht möglich sind, schränkt dies die Möglichkeiten des Angreifers ein, groß angelegte Angriffe auszuführen, während ein legitimer Client, der dieselbe IP-Adresse nutzt, in dieser Zeit nur einen sehr geringen Performance-Verlust erleiden würde. IP-basierte Abwehrmaßnahmen sind ein sehr hartes Mittel – deshalb müssen wir bei ihrem Einsatz in diesem Ausmaß äußerst vorsichtig sein und versuchen, Fehlalarme so weit wie möglich zu vermeiden. Außerdem ist die Lebensdauer einer bestimmten IP in einem Botnetz in der Regel kurz, so dass jede langfristige Abwehrmaßnahme wahrscheinlich mehr schadet als nützt. Die folgende Grafik zeigt den Wechsel der IPs bei den von uns beobachteten Angriffen:
Wir sehen: Viele neue IPs, die an einem bestimmten Tag entdeckt werden, verschwinden sehr schnell wieder.
Da alle diese Aktionen in unserem TLS-Proxy am Anfang unserer HTTPS-Pipeline stattfinden, spart dies im Vergleich zu unserem regulären L7-Abwehrsystem erhebliche Ressourcen. Dadurch konnten wir diese Angriffe viel besser abwehren, und die Zahl der zufälligen 502-Fehler, die von diesen Botnetzen verursacht werden, ist jetzt auf null gesunken.
Verbesserungen der Beobachtbarkeit
Auch im Bereich der Beobachtbarkeit nehmen wir Veränderungen vor. Es ist nicht zufriedenstellend, wenn Clients Fehler erhalten, ohne dass diese in der Kundenanalyse sichtbar sind. Glücklicherweise wurde bereits lange vor den jüngsten Angriffen ein Projekt zur Überarbeitung dieser Systeme eingeleitet. Damit kann jeder Dienst innerhalb unserer Infrastruktur seine eigenen Daten protokollieren, anstatt sich auf unseren Proxy für die Geschäftslogik zu verlassen, der die Protokolldaten konsolidiert und ausgibt. Dieser Vorfall hat gezeigt, wie wichtig diese Arbeit ist, und wir intensivieren unsere Bemühungen.
Wir arbeiten auch an einer besseren Protokollierung auf Verbindungsebene, damit wir solche Protokollmissbräuche viel schneller erkennen und unsere Fähigkeiten zur DDoS-Abwehr verbessern können.
Fazit
Auch wenn dies der jüngste rekordverdächtige Angriff war, wissen wir, dass es nicht der letzte sein wird. Die Angriffe werden immer raffinierter. Darum arbeiten wir bei Cloudflare unermüdlich daran, neue Bedrohungen proaktiv zu identifizieren und Gegenmaßnahmen in unserem globalen Netzwerk zu implementieren, damit unsere Millionen von Kunden sofort und automatisch geschützt sind.
Seit 2017 bietet Cloudflare allen Kunden kostenlosen und zeitlich unbefristeten DDoS-Schutz ohne Volumensbegrenzung. Darüber hinaus bieten wir eine Reihe zusätzlicher Sicherheitsfunktionen, die den Bedürfnissen von Unternehmen jeder Größe entsprechen. Kontaktieren Sie uns, wenn Sie sich nicht sicher sind, ob Sie geschützt sind, oder wenn Sie wissen möchten, wie Sie sich schützen können.
此攻擊是透過濫用 HTTP/2 通訊協定部分功能和伺服器實作詳細資料才得以發動(請參閱 CVE-2023-44487 瞭解詳細資料)。因為攻擊會濫用 HTTP/2 通訊協定中的潛在弱點,所以我們認為任何實作 HTTP/2 的廠商都會遭受攻擊。這包括每部現代 Web 伺服器。我們與 Google 和 AWS 已經將攻擊方法披露給預期將實作修補程式的 Web 伺服器廠商。在這段期間,最佳防禦就是針對任何面向 Web 的網頁或 API 伺服器使用 DDoS 緩解服務(例如 Cloudflare)。
本文將深入探討 HTTP/2 通訊協定、攻擊者用於發動這些大規模攻擊的功能,以及我們為確保所有客戶均受到保護而採取的緩解策略。我們希望在發布這些詳細資料後,其他受影響的 Web 伺服器和服務即可取得實施緩解策略所需的資訊。此外,HTTP/2 通訊協定標準團隊和未來 Web 標準制定團隊,都能進一步設計出預防此類攻擊的功能。
RST 攻擊詳細資料
HTTP 是支援 Web 的應用程式通訊協定。HTTP 語意為所有版本的 HTTP 所共用;整體架構、術語及通訊協定方面,例如請求和回應訊息、方法、狀態碼、標頭和後端項目欄位、訊息內容等等。每個 HTTP 版本將定義如何將語意轉化為「有線格式」以透過網際網路交換。例如,客戶必須將請求訊息序列化為二進位資料並進行傳送,接著伺服器會將其剖析回可處理的訊息。
例如,對 https://blog.cloudflare.com/ 非常簡單的 GET 請求在網路上看起來像這樣:
GET / HTTP/1.1 CRLFHost: blog.cloudflare.comCRLFCRLF
回應如下所示:
HTTP/1.1 200 OK CRLFServer: cloudflareCRLFContent-Length: 100CRLFtext/html; charset=UTF-8CRLFCRLF<100 bytes of data>
此格式框住網路上的訊息,表示可使用單一 TCP 連線來交換多個請求和回應。但是,該格式要求完整傳送每則訊息。此外,為使請求與回應正確關聯,需要嚴格排序;表示訊息會依次交換且無法多工處理。以下是 https://blog.cloudflare.com/ 和 https://blog.cloudflare.com/page/2/ 的兩個 GET 請求:
GET / HTTP/1.1 CRLFHost: blog.cloudflare.comCRLFCRLFGET /page/2/ HTTP/1.1 CRLFHost: blog.cloudflare.comCRLFCRLF
回應如下:
HTTP/1.1 200 OK CRLFServer: cloudflareCRLFContent-Length: 100CRLFtext/html; charset=UTF-8CRLFCRLF<100 bytes of data>CRLFHTTP/1.1 200 OK CRLFServer: cloudflareCRLFContent-Length: 100CRLFtext/html; charset=UTF-8CRLFCRLF<100 bytes of data>
為實現此目標,我們擴展了 IP Jail 系統以保護整個基礎架構:只要 IP「受到監禁」,不僅無法連線至受到攻擊的財產,我們還會在一段期間內禁止相應 IP 使用 HTTP/2 連線至 Cloudflare 上的其他網域。由於使用 HTTP/1.x 時無法濫用此類通訊協定,這限制了攻擊者執行大型攻擊的能力,而任何共用相同 IP 的合法用戶端在此期間內只會看到非常小幅度的效能降低。基於 IP 的緩解措施是非常遲鈍的工具;這就是為什麼我們在大規模採用並儘量設法避免誤判時必須極度謹慎。此外,殭屍網路中特定 IP 的生命週期通常很短,所以任何長期緩解措施有可能弊大於利。下圖顯示我們所見證攻擊中 IP 流失的情況:
Cloudfare에서는 2023년 8월 25일부터 다수의 고객을 향한 일반적이지 않은 일부 대규모 HTTP 공격을 발견했습니다. 이 공격은 우리의 자동 DDos 시스템에서 탐지하여 완화되었습니다. 하지만 얼마 지나지 않아 기록적인 규모의 공격이 시작되어, 나중에 최고조에 이르러서는 초당 2억 1백만 요청이 넘었습니다. 이는 우리 기록상 가장 대규모 공격이었던 이전의 공격의 거의 3배에 달하는 크기입니다.
우려되는 부분은 공격자가 머신 20,000개로 이루어진 봇넷만으로 그러한 공격을 퍼부을 수 있었다는 사실입니다. 오늘날의 봇넷은 수십만 혹은 수백만 개의 머신으로 이루어져 있습니다. 웹 전체에서 일반적으로 초당 10억~30억 개의 요청이 목격된다는 점을 생각하면, 이 방법을 사용했을 때 웹 전체 요청에 달하는 규모를 소수의 대상에 집중시킬 수 있다는 가능성도 완전히 배제할 수는 없습니다.
감지 및 완화
이는 전례 없는 규모의 새로운 공격 벡터였으나, Cloudflare는 기존 보호 기능을 통해 치명적인 공격을 대부분 흡수할 수 있었습니다. 처음에 목격된 충격은 초기 공격 웨이브 동안 고객 트래픽 요청의 약 1%에 영향을 주었으나, 현재는 완화 방법을 개선하여 시스템에 영향을 주지 않고 Cloudflare 고객을 향한 공격을 차단할 수 있습니다.
우리는 업계의 다른 주요 대기업인 Google과 AWS에서도 같은 시기에 이러한 공격이 있었음을 알게 되었습니다. 이에 따라 지금은 우리의 모든 고객을 이 새로운 DDoS 공격 방법으로부터 어떤 영향도 받지 않도록 보호하기 위하여 Cloudflare의 시스템을 강화했습니다. 또한 Google 및 AWS와 협력하여 영향을 받은 업체와 주요 인프라 제공 업체에 해당 공격을 알렸습니다.
이 공격은 HTTP/2 프로토콜과 서버 구현 세부 사항의 일부 주요 기능을 악용했기에 가능했습니다(자세한 내용은 CVE-2023-44487 참조). HTTP/2 프로토콜의 숨어 있는 약점을 파고들었던 공격이었기 때문에, HTTP/2을 구현한 업체라면 해당 공격의 대상이 될 것이라 판단하고 있습니다. 여기에는 요즘의 모든 웹 서버가 포함됩니다. 우리는 Google 및 AWS와 더불어 패치를 구현할 것이라 예상하고 있는 웹 서버 업체를 향한 해당 공격 방법을 공개해왔습니다. 그 동안 최고의 방어는 웹을 대면하는 웹과 API 서버의 프론트에 Cloudflare와 같이 DDoS 완화 서비스를 적용하는 것입니다.
이 포스팅에서는 HTTP/2 프로토콜의 세부 사항, 즉 공격자가 대규모 공격을 만들어내는 데 악용한 주요 기능과 모든 고객을 보호하기 위해 Couldfare가 채택한 완화 전략을 상세히 살펴봅니다. 우리의 희망은 이러한 세부 사항을 공개해 영향을 받는 다른 웹 서버와 서비스에서 완화 전략 구현에 필요한 정보를 갖추는 것입니다. 또한 이에 그치지 않고, HTTP/2 프로토콜 표준 팀과 미래의 웹 표준을 수립하는 팀에서 더 나은 설계를 내놓아 이와 같은 공격을 예방하는 것입니다.
RST 공격 세부 내용
HTTP는 웹을 구동하는 애플리케이션 프로토콜입니다. HTTP Semantics는 HTTP의 모든 버전, 즉 전반적 아키텍처, 용어, 프로토콜 측면(예: 요청 및 응답 메시지, 메서드, 상태 코드, 헤더 및 트레일러 필드, 메시지 내용 등)에서 공통입니다. 각 HTTP 버전은 인터넷에서 상호작용을 위해 “와이어 포맷”으로 시맨틱을 변환하는 방법을 정의합니다. 예를 들어 클라이언트가 요청 메시지를 바이너리 데이터로 직렬화한 후 전송하면, 서버는 이를 다시 처리할 수 있는 메시지로 다시 구문 분석합니다.
HTTP/1.1은 직렬화된 텍스트 형식을 사용합니다. 요청과 응답 메시지는 ASCII 문자의 스트림으로 교환되고, TCP처럼 안정적인 전송 계층을 통해 다음 형식(CRLF는 캐리지 리턴 및 줄바꿈을 의미)으로 전송됩니다.
예를 들어, https://blog.cloudflare.com/ 에 대한 매우 간단한 GET 요청은 와이어에서 다음과 같이 표시됩니다:
GET / HTTP/1.1 CRLFHost: blog.cloudflare.comCRLFCRLF
그리고 응답은 다음과 같습니다:
HTTP/1.1 200 OK CRLFServer: cloudflareCRLFContent-Length: 100CRLFtext/html; charset=UTF-8CRLFCRLF<100 bytes of data>
이 형식은 와이어에서 메시지의 형식을 정의하는데, 이는 단일 TCP 연결을 사용하여 다수의 요청과 응답을 주고받을 수 있다는 의미입니다. 그러나 이 형식은 각 메시지를 전체로 보내야 합니다. 추가로 요청과 응답을 정확하게 상호 연결하려면 순서를 엄격하게 지켜야 합니다. 즉, 메시지는 직렬로 교환되고, 다중화될 수 없습니다. https://blog.cloudflare.com/과 https://blog.cloudflare.com/page/2/에 대한 두 개의 GET 요청은 다음과 같이 표시됩니다:
GET / HTTP/1.1 CRLFHost: blog.cloudflare.comCRLFCRLFGET /page/2/ HTTP/1.1 CRLFHost: blog.cloudflare.comCRLFCRLF
응답은 다음과 같습니다.
HTTP/1.1 200 OK CRLFServer: cloudflareCRLFContent-Length: 100CRLFtext/html; charset=UTF-8CRLFCRLF<100 bytes of data>CRLFHTTP/1.1 200 OK CRLFServer: cloudflareCRLFContent-Length: 100CRLFtext/html; charset=UTF-8CRLFCRLF<100 bytes of data>
웹 페이지에는 예시보다 더 복잡한 HTTP 상호작용이 필요합니다. Cloudflare 블로그를 방문할 때 브라우저는 여러 스크립트, 스타일, 미디어 에셋을 로드합니다. HTTP/1.1로 해당 페이지를 방문하고, 빠르게 다음 페이지로 넘어가고자 할 때, 브라우저는 2가지 선택지 중 하나를 고를 수 있습니다. 페이지가 시작하기도 전에 이제는 원하지 않는 다음 페이지에 대해 대기 중인 모든 응답을 기다리거나, TCP 연결을 닫고 새로운 연결을 열어 전송 중인 요청을 취소할 수 있습니다. 2가지 선택지 모두 그다지 실용적이지는 않습니다. 브라우저는 TCP 연결 풀(호스트당 최대 6개)을 관리하고 풀에서 복잡한 요청 전송 로직을 구현하며 이러한 제한을 준수합니다.
HTTP/2에서는 HTTP/1.1에서 발생한 문제 대부분이 해결됩니다. 각 HTTP 메시지는 유형, 길이, 플래그, 스트림 식별자(ID), 페이로드가 있는 HTTP/2 프레임 조합으로 직렬화됩니다. 스트림 ID는 와이어의 어떤 바이트가 어떤 메시지에 적용되는지 분명히 하는 동시에 안전하게 다중화하고 동시성을 부여합니다. 스트림은 양방향입니다. 클라이언트가 프레임을 전송하면, 서버는 같은 ID를 사용하는 프레임으로 응답합니다.
HTTP/2에서 https://blog.cloudflare.com에 대한 GET 요청은 스트림 ID 1을 통해 교환됩니다. 클라이언트가 1개의 HEADERS 프레임을 보내면 서버는 1개의 HEADERS 프레임과 뒤이어 1개 이상의 DATA 프레임으로 응답합니다. 클라이언트가 요청하는 스트림 ID는 항상 홀수이므로, 후속 요청은 스트림 ID 3, 5 등이 됩니다. 응답은 순서와 관계없이 전달되고, 다른 스트림의 프레임이 인터리빙될 수 있습니다.
스트림 다중화와 동시성은 HTTP/2의 강력한 주요 특징입니다. 두 이점은 단일 TCP 연결의 더욱 더 효율적인 사용을 지원합니다. HTTP/2는 우선순위 지정과 짝을 이룰 때 특히나 리소스 가져오기를 최적화합니다. 반대로 생각해보면, 클라이언트의 대규모 병렬 작업을 수월하게 시행할 수 있게 만들어 줌으로써 HTTP/1.1과 비교했을 때, 서버 리소스에 대한 피크 수요가 높아집니다. 이는 서비스 거부에 대한 분명한 벡터입니다.
HTTP/2는 약간의 방어 수단을 제공하기 위해 최대 활성 동시 스트림의 개념을 제시합니다. SETTINGS_MAX_CONCURRENT_STREAMS 매개변수는 서버가 자신의 동시성 제한을 알릴 수 있도록 합니다. 예를 들어, 서버에 100개로 제한을 둔다면, 어느 시점에서도 100개의 요청만이 활성화될 수 있습니다. 클라이언트가 제한을 초과하는 스트림을 열고자 한다면, 이 시도는 RST_STREAM 을 사용하는 서버에서 거부되어야 합니다. 스트림 거부는 연결 상의 이동 중인 다른 스트림에 영향을 주지 않습니다.
실제 이야기는 조금 더 복잡합니다. 스트림에는 수명 주기가 있습니다. 아래 HTTP/2 스트림 상태인 기기의 도표가 나와있습니다. 클라이언트와 서버는 스트림 상태인 자신의 뷰를 관리합니다. HEADERS, DATA, RST_STREAM 프레임은 전송되거나 수신될 때, 전환을 유발합니다. 스트림 상태의 뷰는 독립적이기는 하지만, 동기화됩니다.
HEADERS와 DATA 프레임에는 값이 1(true)로 설정되었을 때, 상태 전환을 일으킬 수 있는 END_STREAM이 포함되어 있습니다.
메시지 내용이 없는 GET 요청의 예시를 자세히 살펴보겠습니다. 클라이언트는 END_STREAM 플래그 조합을 1로 설정한 HEADERS 프레임으로 요청을 전송합니다. 클라이언트는 먼저 스트림 상태를 유휴에서 열림 상태로 전환한 다음, 곧바로 반 닫힘 상태로 전환합니다. 클라이언트의 반 닫힘 상태란 더 이상 HEADERS 또는 DATA를 보낼 수 없고, WINDOW_UPDATE, PRIORITY 또는 RST_STREAM 프레임만을 보낼 수 있는 상태를 말합니다. 하지만 클라이언트가 받는 프레임의 종류에는 제한이 없습니다.
서버가 HEADERS 프레임을 받아 구문 분석하고 나면 스트림 상태를 유휴에서 열림, 그리고 반 닫힘 상태로 전환해 클라이언트와 상태를 일치시킵니다. 서버가 반 닫힘 상태라는 의미는 어떤 프레임이든지 보낼 수 있지만, WINDOW_UPDATE, PRIORITY, RST_STREAM만 받을 수 있는 상태를 말합니다.
GET에 대한 응답에는 메시지 내용이 포함되므로 서버에서는 0으로 설정된 END_STREAM 플래그가 포함된 HEADERS를 보내고 난 다음, 1로 설정한 END_STREAM 플래그가 포함된 HEADERS를 보냅니다. DATA 프레임은 서버에서 스트림이 반 닫힘 상태에서 닫힘 상태로 전환되게 합니다. 클라이언트가 DATA 프레임을 받으면, 클라이언트 또한 닫힘 상태로 전환됩니다. 스트림이 닫히고 나면 어떤 프레임도 보내거나 받을 수 없습니다.
“열림” 상태이거나 “반 닫힘” 상태인 스트림은 엔드포인트가 열 수 있도록 허용된 최대 스트림 수에 포함됩니다. 이 세 가지 상태 중 하나에 있는 스트림은 SETTINGS_MAX_CONCURRENT_STREAMS 설정에서 통지된 한도에 포함됩니다.
이론상, 동시성 제한은 유용합니다. 그렇지만, 그 효과를 방해하는 실용적인 요소가 있으며, 이는 블로그 뒷 부분에서 다룰 예정입니다.
HTTP/2 요청 취소
앞서 전송 중인 요청의 클라이언트 취소에 관해 설명했습니다. HTTP/2에서는 이를 HTTP/1.1보다 더 효율적인 방식으로 지원합니다. 클라이언트는 전체 연결을 끊지 않고도 단일 스트림에 대한 RST_STREAM 프레임을 보낼 수 있습니다. 이로 인해 서버는 요청 처리를 멈추고, 응답을 중단함으로써, 서버 리소스를 확보하고 대역폭 낭비를 방지할 수 있습니다.
앞선 예시인 3개의 요청을 살펴보겠습니다. 이번에는 클라이언트가 모든 HEADERS를 보내고 난 후에 스트림 1의 요청을 취소하는 경우를 가정해 보겠습니다. 서버는 응답을 보낼 준비를 하기 전에 이 RST_STREAM 프레임을 구문 분석하고 그 대신 스트림 3과 5에 대해서만 응답합니다.
요청 취소는 유용한 기능입니다. 예를 들어, 여러 이미지가 있는 웹 페이지를 스크롤할 때, 웹 브라우저는 뷰포트에서 벗어난 이미지를 취소할 수 있는데, 다시 말해 뷰포트로 들어오는 이미지는 더 빨리 로드된다는 의미입니다. HTTP/1.1과 비교했을 때 HTTP/2가 이러한 행위를 훨씬 더 효율적으로 수행합니다.
취소된 요청 스트림은 스트림 수명주기를 통해 빠르게 전환됩니다. END_STREAM 플래그가 1로 설정된 HEADERS는 클라이언트를 유휴 상태에서 열림, 반 닫힘 상태로 전환시키고, 이어서 RST_STREAM이 곧바로 반 닫힘 상태에서 닫힘 상태로 전환시킵니다.
열림 또는 반 닫힘 상태의 스트림만이 스트림 동시성 제한에 영향을 미친다는 점을 상기해 보세요. 클라이언트가 스트림을 취소하면 즉시 그 자리에 다른 스트림을 열 수 있고 바로 다른 요청을 보낼 수도 있습니다. 이는 CVE-2023-44487을 작동시키는 핵심입니다.
서비스 거부로 이어지는 Rapid Reset
HTTP/2 요청 취소는 무한한 스트림을 빠르게 초기화하는 데 악용될 수 있습니다. HTTP/2 서버가 클라이언트가 보낸 RST_STREAM 프레임을 처리할 수 있고, 충분히 빠르게 상태를 분해할 수 있다면, Rapid Reset은 문제가 되지 않습니다. 정리 과정에서 지연이나 처짐이 발생할 때 문제가 발생하기 시작합니다. 이때 클라이언트는 작업 백로그를 누적시키는 많은 요청으로 인해 이탈될 수 있으며, 이는 서버 리소스의 과도한 소모로 이어집니다.
일반적인 HTTP 배포 아키텍처는 다른 구성 요소보다 앞서서 HTTP/2 프록시 또는 부하 분산 장치를 실행할 수 있습니다. 클라이언트 요청이 도착하면 빠르게 전송되고, 실제 작업은 다른 곳에서 비동기 활동으로 이루어집니다. 이로 인해 프록시는 클라이언트 트래픽을 매우 효율적으로 처리할 수 있습니다. 그러나 이러한 분리로 인해 프록시가 처리 중인 작업은 정리하는 것이 어려워질 수 있습니다. 따라서 이러한 배포는 Rapid Reset로 인한 문제를 만날 가능성이 더 높습니다.
Cloudflare의 역프록시가 수신되는 HTTP/2 클라이언트 트래픽을 처리할 때, 연결의 소켓에서 버퍼로 데이터를 복사한 다음 버퍼에 있는 데이터를 순서대로 처리합니다. 각 요청을 읽으면(HEADER와 DATA 프레임) 이는 업스트림 서비스로 전송됩니다. RST_STREAM 프레임을 읽으면, 해당 요청에 대한 로컬 상태는 해체되고, 업스트림에서는 요청이 취소되었다는 알림을 받습니다. 버퍼를 비우고 버퍼 전체가 사용될 때까지 이를 반복합니다. 하지만 이 로직은 악용될 수 있습니다. 그 이유는 악의적 클라이언트가 연결을 시작할 때 엄청난 양의 요청과 초기화 체인을 보내기 시작하면, 우리의 서버는 의욕이 넘쳐서 체인을 모두 읽고, 업스트림 서버에 새롭게 수신되는 요청을 처리할 수 없는 시점까지 압력을 만들어내기 때문입니다.
짚고 넘어가야 하는 중요한 점은 그 자체의 스트림 동시성이 Rapid Reset를 완화시켜줄 수 없다는 것입니다. 클라이언트는 요청이 서버의 SETTINGS_MAX_CONCURRENT_STREAMS 설정 값과 관계 없이 높은 요청 속도를 만들어낼 수 있습니다.
Rapid Reset 분석
여기 총 1,000건의 요청을 생산하려는 개념 증명 클라이언트로 재생산된 Rapid Reset의 예가 있습니다. 여기서는 어떤 완화도 없는 상용 서버를 사용했으며, 테스트 환경에서는 443 포트가 수신 대기 중입니다. 트래픽은 Wireshark로 분석되며, 명확성을 위해 HTTP/2 트래픽만을 표시하도록 필터링됩니다. pcap을 다운로드하여 다음을 확인하세요.
프레임이 많으므로 트래픽을 확인하는 데 조금 어려울 수 있습니다. Wireshark 통계 > HTTP2 툴을 통한 빠른 요악을 받아볼 수 있습니다.
패킷 14에서 이 트레이스의 첫 번째 프레임은 서버의 SETTINGS 프레임으로, 최대 100개의 스트림 동시성을 알립니다. 패킷 15에서 클라이언트는 몇몇 제어 프레임을 보낸 다음 Rapid Reset이 되는 요청을 시작합니다. 첫 번째 HEADERS 프레임은 26바이트이고, 모든 후속 HEADERS는 9바이트에 불과합니다. 이 크기 차이는 HPACK이라는 압축 기술 덕분입니다. 패킷 15에는 총 525개의 요청이 포함되어 있으며, 스트림 1051까지 올라갑니다.
흥미롭게도 스트림 1051에 대한 RST_STREAM은 패킷 15에 맞지 않아 패킷 16에서 서버가 404로 응답하는 것을 볼 수 있습니다. 그 후에 클라이언트는 패킷 17에서 나머지 475개의 요청을 전송하기 전에 RST_STREAM을 전송합니다.
서버에서는 동시 스트림이 100개라고 알렸으나, 클라이언트에서 보낸 2개의 패킷 모두 그보다 훨씬 더 많은 HEADERS 프레임을 보냈습니다. 클라이언트는 서버로부터의 응답 트래픽을 기다릴 필요가 없었고, 보낼 수 있는 패킷의 크기에 따른 제한만을 받았습니다. 이 트레이스에서 서버의 RST_STREAM 프레임이 전혀 보이지 않는 것은 서버가 동시 스트림 위반을 관찰하지 못했음을 말해줍니다.
고객에게 미치는 영향
위에서 언급한 것과 같이 요청이 취소되면 업스트림 서비스는 알림을 전달받고, 너무 많은 리소스를 낭비하기 전에 요청을 중단할 수 있습니다. 이번 공격 케이스에서도 마찬가지였고, 대부분의 악의적 요청은 원본 서버로 전혀 포워딩되지 않았습니다. 그렇지만, 그 공격의 규모만으로도 일부 영향이 있었습니다.
첫째, 들어오는 요청의 속도가 이전에는 볼 수 없었던 최고치에 도달함에 따라, 고객의 502 오류 보고 횟수가 늘었다는 보고가 있었습니다. 이는 가장 지대한 영향을 받은 데이터 센터에서 모든 요청을 처리하기 위해 분투하는 과정에서 발생했습니다. 우리의 네트워크는 대규모 공격에 대응할 수 있도록 설계되었음에도, 이 특정한 취약점으로 인해 인프라의 약점이 노출되었습니다. 이제 더 세부 사항으로 들어가서, 데이터센터 중 한 곳에 공격이 발생했을 때, 들어오는 요청이 어떻게 처리되는지에 초점을 맞추어 보겠습니다.
Cloudflare 인프라는 각각 다른 책임을 맡은 여러 프록시 서버 체인으로 구성되어 있음을 확인할 수 있습니다. 특히 클라이언트가 HTTPS 트래픽을 전송하기 위해 Cloudflare에 연결하면 먼저 TLS 복호화 프록시에 연결됩니다. 프록시는 TLS 트래픽을 복호화하고 HTTP 1, 2 또는 3 트래픽을 처리한 다음, 이를 “비즈니스 로직” 프록시로 포워딩합니다. 이 프록시는 각 고객에 대한 모든 설정을 로드하고, 요청을 다른 업스트림 서비스로 정확하게 라우팅하는데, 이 케이스에서는 그보다 더 중요한 보안 기능도 담당합니다. L7 공격 완화도 이 프록시에서 처리됩니다.
이번 공격 벡터의 문제점은 모든 연결에서 매우 빠르게 다량의 요청을 보낼 수 있다는 사실입니다. 우리가 공격 벡터를 차단할 기회를 갖기도 전에 각 요청이 비즈니스 로직 프록시로 포워딩되어야 했습니다. 요청 처리량이 프록시 용량을 앞지르면서 이 두 서비스를 연결하는 채널이 우리의 일부 서버에서는 포화 상태에 도달했습니다.
이렇게 되면 TLS 프록시가 업스트림 프록시에 더 이상 연결될 수 없으며, 이것이 몇몇 클라이언트에서 가장 심각한 공격 중 소량의 “502 Bad Gateway” 오류가 발생했던 원인입니다. 주목해야 할 점은 오늘 현재 HTTP 분석을 생성하기 위해 사용하는 로그 또한 비즈니스 로직 프록시에서 전송된다는 사실입니다. 그 결과, 이러한 오류는 Cloudflare 대시보드에서 보이지 않습니다. 내부 대시보드에서는 초기 공격 웨이브(완화 조치를 구현하기 전) 중 약 1%의 요청이 영향을 받았으며, 가장 심각한 공격이 발생했던 8월 29일에는 수 초 동안 약 12%를 기록하며, 최고치를 달성했습니다. 다음 그래프에는 공격이 발생한 2시간 동안 오류의 비율이 나와있습니다.
이 글 아래에서 설명될 내용과 같이 그다음 날에는 이 숫자를 극적으로 낮추는 작업이 진행되었습니다. 스택의 변화와 이러한 공격 규모를 상당히 감소시킨 완화 조치 덕분에 현재 이 수치는 사실상 0입니다.
499 오류 및 HTTP/2 스트림 동시성의 문제
일부 고객이 알려온 또 다른 증상은 499 오류의 증가입니다. 그 이유는 조금 다른데, 이는 앞서 설명한 HTTP/2 연결의 최대 스트림 동시성 수와 관련이 있습니다.
HTTP/2 설정은 SETTINGS 프레임을 사용해 연결이 시작될 때 교환됩니다. 명시적 매개변수를 받지 않은 경우에는 기본값이 적용됩니다. 클라이언트가 HTTP/2 연결을 설정하고 나면, 서버의 SETTINGS(느림)를 기다리거나, 기본값을 가정하고 요청(빠름)을 시작할 수 있습니다. SETTINGS_MAX_CONCURRENT_STREAMS의 기본값은 사실상 무제한입니다(스트림 ID는 31비트 숫자 공간을 사용, 요청은 홀수를 사용하므로 실제 제한은 1073741824). 사양에서는 서버에서 100개 이상의 스트림을 제공하기를 권장합니다. 클라이언트는 일반적으로 속도에 편향되어 있으므로 서버 설정을 기다리지 않는 경향이 있으며, 이로 인해 약간의 경쟁 조건이 만들어집니다. 클라이언트는 서버에서 어떤 제한을 선택할지 도박을 하는 것과 같습니다. 잘못 선택한다면, 요청은 거부되고, 다시 시도해야 하기 때문입니다. 1073741824 스트림에 대한 도박은 다소 어리석은 일입니다. 그 대신 다수의 클라이언트는 서버가 사양 권장 사항을 따르기를 바라면서, 100개의 동시 스트림으로 제한할 것을 결정합니다. 서버가 100개 미만을 선택한다면, 클라이언트의 도박은 실패하고 스트림은 초기화됩니다.
서버가 동시성 제한을 초과한 스트림을 초기화하는 데는 여러가지 이유가 있습니다. HTTP/2는 프로토콜이 엄격하고, 구문 분석이 있거나 로직 오류가 있을 때 스트림을 닫아야 합니다. 2019년, Cloudflare에서는 HTTP/2 DoS 취약점에 대응해 몇 가지 완화 조치를 개발했습니다. 몇몇 취약점은 클라이언트의 올바르지 않은 행동, 서버에서 스트림을 초기화하도록 이끄는 클라이언트가 그 원인이었습니다. 이러한 클라이언트를 단속하는 매우 효과적인 방법은 연결 중 서버 초기화 횟수를 세고, 몇몇 임계값을 넘을 때 GOAWAY 프레임으로 연결을 끊는 것입니다. 합법적인 클라이언트라면 연결 시 한두 가지 정도의 실수는 할 수 있습니다. 클라이언트에서 너무 많은 실수를 범한다면, 문제가 있거나 악의를 가진 경우이며, 연결을 끊으면 두 가지 케이스가 모두 해결됩니다.
Cloudflare에서는 CVE-2023-44487으로 활성화된 DoS 공격에 대응하는 동안, 최대 스트림 동시성을 64개로 줄였습니다. 이러한 변화를 주기 전에는 클라이언트에서 SETTINGS를 기다리지 않고 100개의 동시성을 가정한다는 사실을 알지 못했습니다. 이미지 갤러리와 같은 일부 웹 페이지는 연결 시작 시에 곧바로 브라우저가 100개의 요청을 보내도록 하기도 합니다. 하지만, 우리의 제한을 초과한 36개의 스트림은 모두 초기화되어야 했으며, 이는 카운팅 완화 조치의 시행 조건으로 작용했습니다. 이는 합법적인 클라이언트와의 연결을 끊게 만들어 페이지 가져오기의 완전한 실패로 이어졌습니다. 따라서 이 상호운용성 문제를 인지하자마자 최대 스트림 동시성 수를 100개로 변경했습니다.
Cloudflare 측의 조치
2019년, HTTP/2 구현과 관련한 몇 가지 DoS 취약점이 발견되었습니다. Cloudflare에서는 이에 대한 대응으로 일련의 감지 및 완화 조치를 개발하고 배포했습니다. CVE-2023-44487은 HTTP/2 취약점의 다른 표현입니다. 하지만, 이를 완화하기 위해 기존의 보호 기능을 확장하여 클라이언트가 전송한 RST_STREAM 프레임을 모니터링하고, 악용되는 경우 연결을 닫을 수 있었습니다. 합법적인 클라이언트의 RST_STREAM 사용은 영향을 받지 않습니다.
우리는 직접적인 수정에 그치치 않고, 서버의 HTTP/2 프레임 처리 및 요청 전송 코드에도 몇 가지 개선점을 구현했습니다. 추가로, 비즈니스 로직 서버의 대기열 및 스케줄링 또한 개선해서, 불필요한 작업을 줄이고 취소 응답성을 높일 수 있었습니다. 이러한 개선 모두에 힘입어 다양한 잠재적 남용 패턴의 영향이 줄어들고 서버가 포화 상태에 이르기 전에 요청을 처리할 수 있는 공간이 더 확보됩니다.
공격의 조기 완화
Cloudflare에서는 더욱 저렴한 방식으로 대규모 공격을 효율적으로 완화할 수 있는 시스템을 이미 갖추고 있습니다. 그중 하나가 “IP Jail”입니다. IP Jail은 대규모 볼류메트릭 공격 시 공격에 참여하는 클라이언트 IP를 수집하고, 해당 IP 레벨이나 TLS 프록시에서 공격받은 위치와의 연결을 끊습니다. 하지만 이 시스템이 온전히 효과를 발휘하기 위해서는 몇 초가 필요합니다. 이 귀중한 시간에 원본은 보호받지만, 인프라는 여전히 모든 HTTP 요청을 받아들여야 합니다. 이 새로운 봇넷은 사실상 램프업 기간이 없으므로 우리는 문제가 되기 전에 공격을 무력화할 수 있는 능력을 갖추어야 합니다.
우리는 이를 구현하기 위해 전체 인프라를 보호하는 IP Jail 시스템을 확장했습니다. 일단 IP가 “구속되면”, 공격받은 위치로의 연결이 차단될 뿐만 아니라, 해당 IP는 일정 시간 Cloudflare의 다른 도메인에 HTTP/2를 사용하는 것도 금지됩니다. 이러한 프로토콜의 악용은 HTTP/1.x로는 불가능하므로, 공격자는 대규모 공격을 퍼부을 수 있는 능력이 제한되는 반면, 동일한 IP를 공유하는 합법적인 클라이언트는 해당 시간 아주 미세한 성능 저하만을 겪습니다. IP 기반의 완화 조치는 매우 무딘 도구이며, 그렇기 때문에 해당 규모로 사용할 때는 극도로 신중을 기해야 하며, 가능한 한 긍정 오류를 피해야 합니다. 또한 봇넷에서 특정 IP의 수명은 일반적으로 짧으므로, 장기간의 완화 조치는 장점보다 단점이 더 많을 수도 있습니다. 다음 그래프에는 우리가 목격한 공격 중 급격한 변화가 나와있습니다.
그래프에서 확인할 수 있듯이, 다수의 새로운 IP가 특정한 날 이후 매우 빠르게 사라집니다.
이 모든 조치는 HTTPS 파이프라인의 시작 부분에 있는 TLS 프록시에서 이루어지므로 우리의 일반 L7 완화 시스템과 비교했을 때 상당한 리소스를 절약할 수 있습니다. 이로 인해 훨씬 더 원활하게 공격에 대응할 수 있었고, 이제 봇넷으로 인한 무작위 502 오류 수는 0개가 되었습니다.
관찰 가능성 개선
Cloudflare에서 변화를 만들어 가고 있는 영역은 관찰 가능성입니다. 고객 분석에서 보이지 않고, 고객에게 오류를 돌려주는 상황은 만족할 수 없는 부분입니다. 다행스럽게도 최근 공격이 발생하기 훨씬 이전부터 해당 시스템을 정비하는 프로젝트가 진행 중이었습니다. 프로젝트의 궁극적인 방향은 비즈니스 로직 프록시에 의존하여 로그 데이터를 통합하고 방출하는 것이 아닌, 인프라 내의 각 서비스가 자체 데이터를 로깅할 수 있는 것입니다. 이번 사고로 인해 해당 작업의 중요성이 대두되었기에, 노력을 배가하고 있습니다.
또한 이러한 프로토콜 악용을 훨씬 더 빠르게 발견해 DDoS 완화 기능을 개선할 수 있는 연결 수준의 로깅 개선 업무도 작업 중입니다.
결론
이 사고는 가장 최근의 기록적인 공격이었지만, 이번이 마지막은 아닐 것이라는 사실은 잘 알고 있습니다. 공격이 점점 더 정교해짐에 따라 Cloudflare에서는 새로운 위협을 적극적으로 식별해서 수백만 고객이 즉각적이고 자동적으로 보호받을 수 있도록 전역 네트워크에 대응책을 배포하는 등 끊임없는 노력을 기울이고 있습니다.
Cloudflare는 2017년부터 고객에게 무료로 무제한 DDoS 방어를 제공해 왔습니다. 이와 더불어, 모든 규모의 조직 니즈에 맞는 광범위한 부가 보안 기능 또한 제공합니다. 보호받고 있는지 확신할 수 없거나 어떻게 보호받을 수 있는지 알고 싶다면 이곳으로 문의하세요.
这种攻击是通过滥用 HTTP/2 协议的某些功能和服务器实施详细信息实现的(详情请参见 CVE-2023-44487)。由于该攻击滥用了 HTTP/2 协议中的一个潜在弱点,我们认为实施了 HTTP/2 的任何供应商都会受到攻击。这包括所有现代网络服务器。我们已经与谷歌和 AWS 一起向网络服务器供应商披露了攻击方法,我们希望他们能够实施补丁。与此同时,最好的防御方法是在任何面向网络的 Web 服务器或 API 服务器前面使用诸如 Cloudflare 之类的 DDoS 缓解服务。
这篇文章深入探讨了 HTTP/2 协议的详细信息、攻击者利用来实施这些大规模攻击的功能,以及我们为确保所有客户受到保护而采取的缓解策略。我们希望通过公布这些详细信息,其他受影响的 Web 服务器和服务能够获得实施缓解策略所需的信息。此外,HTTP/2 协议标准团队以及开发未来 Web 标准的团队可以更好地设计这些标准,以防止此类攻击。
RST 攻击详细信息
HTTP 是为 Web 提供支持的应用协议。HTTP 语义对于所有版本的 HTTP 都是通用的 — 整体架构、术语和协议方面,例如请求和响应消息、方法、状态代码、标头和尾部字段、消息内容等等。每个单独的 HTTP 版本都定义了如何将语义转换为“有线格式”以通过 Internet 进行交换。例如,客户端必须将请求消息序列化为二进制数据并发送,然后服务器将其解析回它可以处理的消息。
例如,对于 https://blog.cloudflare.com/ 的一个非常简单的 GET 请求在线路上将如下所示:
GET / HTTP/1.1 CRLFHost: blog.cloudflare.comCRLFCRLF
响应将如下所示:
HTTP/1.1 200 OK CRLFServer: cloudflareCRLFContent-Length: 100CRLFtext/html; charset=UTF-8CRLFCRLF<100 bytes of data>
这种格式在线路上构造消息,这意味着可以使用单个 TCP 连接来交换多个请求和响应。但是,该格式要求每条消息都完整发送。此外,为了正确地将请求与响应关联起来,需要严格的排序;这意味着消息是串行交换的并且不能多路复用。https://blog.cloudflare.com/ 和 https://blog.cloudflare.com/page/2/ 的两个 GET 请求将是:
GET / HTTP/1.1 CRLFHost: blog.cloudflare.comCRLFCRLFGET /page/2/ HTTP/1.1 CRLFHost: blog.cloudflare.comCRLFCRLF
With the responses:
HTTP/1.1 200 OK CRLFServer: cloudflareCRLFContent-Length: 100CRLFtext/html; charset=UTF-8CRLFCRLF<100 bytes of data>CRLFHTTP/1.1 200 OK CRLFServer: cloudflareCRLFContent-Length: 100CRLFtext/html; charset=UTF-8CRLFCRLF<100 bytes of data>
HTTP/2 解决了 HTTP/1.1 的许多问题。每个 HTTP 消息都被序列化为一组 HTTP/2 帧,这些帧具有类型、长度、标志、流标识符 (ID) 和有效负载。流 ID 清楚地表明线路上的哪些字节适用于哪个消息,从而允许安全的多路复用和并发。流是双向的。客户端发送帧,服务器使用相同的 ID 回复帧。
在 HTTP/2 中,我们对 https://blog.cloudflare.com 的 GET 请求将通过流 ID 1 交换,客户端发送一个 HEADERS 帧,服务器使用一个 HEADERS 帧进行响应,后跟一个或多个 DATA 帧。客户端请求始终使用奇数流 ID,因此后续请求将使用流 ID 3、5 等。可以以任何顺序提供响应,并且来自不同流的帧可以交织。
Cloudflare 已经部署了一套系统,可以通过成本较低的方法有效缓解超大型攻击。其中一个系统名为 IP Jail。对于超容量攻击,该系统会收集参与攻击的客户端 IP,并阻止它们连接到受攻击的财产(无论是在 IP 级别还是在我们的 TLS 代理中)。然而,该系统需要几秒钟才能完全生效; 在这宝贵的几秒钟内,源头已经受到保护,但我们的基础设施仍然需要吸收所有 HTTP 请求。由于这种新的僵尸网络实际上没有启动期,因此我们需要能够在攻击成为问题之前将其消灭。
为此,我们扩展了 IP Jail 系统,以保护我们的整个基础设施:一旦一个 IP 被“监禁”,它不仅会被阻止连接到受攻击的资产,我们还会禁止相应的 IP 在一段时间内使用 HTTP/2 连接到 Cloudflare 上的任何其他域。因此,无法通过使用 HTTP/1.x 来滥用协议。这就限制了攻击者实施大规模攻击的能力,而共用同一 IP 的任何合法客户端在此期间只会看到非常小的性能下降。基于 IP 的缓解措施是一种非常笨拙的工具 – 这就是为什么我们在这种规模下使用它们时必须非常小心,并尽可能避免误报。此外,僵尸网络中给定 IP 的寿命通常很短,因此任何长期缓解措施都可能弊大于利。下图显示了我们目睹的攻击中 IP 的变化情况:
Today, Cloudflare is very excited to announce full support for HTTP/3 Extensible Priorities, a new standard that speeds the loading of webpages by up to 37%. Cloudflare worked closely with standards builders to help form the specification for HTTP/3 priorities and is excited to help push the web forward. HTTP/3 Extensible Priorities is available on all plans on Cloudflare. For paid users, there is an enhanced version available that improves performance even more.
Web pages are made up of many objects that must be downloaded before they can be processed and presented to the user. Not all objects have equal importance for web performance. The role of HTTP prioritization is to load the right bytes at the most opportune time, to achieve the best results. Prioritization is most important when there are multiple objects all competing for the same constrained resource. In HTTP/3, this resource is the QUIC connection. In most cases, bandwidth is the bottleneck from server to client. Picking what objects to dedicate bandwidth to, or share bandwidth amongst, is a critical foundation to web performance. When it goes askew, the other optimizations we build on top can suffer.
Today, we're announcing support for prioritization in HTTP/3, using the full capabilities of the HTTP Extensible Priorities (RFC 9218) standard, augmented with Cloudflare's knowledge and experience of enhanced HTTP/2 prioritization. This change is compatible with all mainstream web browsers and can improve key metrics such as Largest Contentful Paint (LCP) by up to 37% in our test. Furthermore, site owners can apply server-side overrides, using Cloudflare Workers or directly from an origin, to customize behavior for their specific needs.
Looking at a real example
The ultimate question when it comes to features like HTTP/3 Priorities is: how well does this work and should I turn it on? The details are interesting and we'll explain all of those shortly but first lets see some demonstrations.
In order to evaluate prioritization for HTTP/3, we have been running many simulations and tests. Each web page is unique. Loading a web page can require many TCP or QUIC connections, each of them idiosyncratic. These all affect how prioritization works and how effective it is.
To evaluate the effectiveness of priorities, we ran a set of tests measuring Largest Contentful Paint (LCP). As an example, we benchmarked blog.cloudflare.com to see how much we could improve performance:
As a film strip, this is what it looks like:
In terms of actual numbers, we see Largest Contentful Paint drop from 2.06 seconds down to 1.29 seconds. Let’s look at why that is. To analyze exactly what’s going on we have to look at a waterfall diagram of how this web page is loading. A waterfall diagram is a way of visualizing how assets are loading. Some may be loaded in parallel whilst some might be loaded sequentially. Without smart prioritization, the waterfall for loading assets for this web page looks as follows:
There are several interesting things going on here so let's break it down. The LCP image at request 21 is for 1937-1.png, weighing 30.4 KB. Although it is the LCP image, the browser requests it as priority u=3,i, which informs the server to put it in the same round-robin bandwidth-sharing bucket with all of the other images. Ahead of the LCP image is index.js, a JavaScript file that is loaded with a "defer" attribute. This JavaScript is non-blocking and shouldn't affect key aspects of page layout.
What appears to be happening is that the browser gives index.js the priority u=3,i=?0, which places it ahead of the images group on the server-side. Therefore, the 217 KB of index.js is sent in preference to the LCP image. Far from ideal. Not only that, once the script is delivered, it needs to be processed and executed. This saturates the CPU and prevents the LCP image from being painted, for about 300 milliseconds, even though it was delivered already.
The waterfall with prioritization looks much better:
We used a server-side override to promote the priority of the LCP image 1937-1.png from u=3,i to u=2,i. This has the effect of making it leapfrog the "defer" JavaScript. We can see at around 1.2 seconds, transmission of index.js is halted while the image is delivered in full. And because it takes another couple of hundred milliseconds to receive the remaining JavaScript, there is no CPU competition for the LCP image paint. These factors combine together to drastically improve LCP times.
How Extensible Priorities actually works
First of all, you don't need to do anything yourselves to make it work. Out of the box, browsers will send Extensible Priorities signals alongside HTTP/3 requests, which we'll feed into our priority scheduling decision making algorithms. We'll then decide the best way to send HTTP/3 response data to ensure speedy page loads.
Extensible Priorities has a similar interaction model to HTTP/2 priorities, client send priorities and servers act on them to schedule response data, we'll explain exactly how that works in a bit.
HTTP/2 priorities used a dependency tree model. While this was very powerful it turned out hard to implement and use. When the IETF came to try and port it to HTTP/3 during the standardization process, we hit major issues. If you are interested in all that background, go and read my blog post describing why we adopted a new approach to HTTP/3 prioritization.
Extensible Priorities is a far simpler scheme. HTTP/2's dependency tree with 255 weights and dependencies (that can be mutual or exclusive) is complex, hard to use as a web developer and could not work for HTTP/3. Extensible Priorities has just two parameters: urgency and incremental, and these are capable of achieving exactly the same web performance goals.
Urgency is an integer value in the range 0-7. It indicates the importance of the requested object, with 0 being most important and 7 being the least. The default is 3. Urgency is comparable to HTTP/2 weights. However, it's simpler to reason about 8 possible urgencies rather than 255 weights. This makes developer's lives easier when trying to pick a value and predicting how it will work in practice.
Incremental is a boolean value. The default is false. A true value indicates the requested object can be processed as parts of it are received and read – commonly referred to as streaming processing. A false value indicates the object must be received in whole before it can be processed.
Let's consider some example web objects to put these parameters into perspective:
An HTML document is the most important piece of a webpage. It can be processed as parts of it arrive. Therefore, urgency=0 and incremental=true is a good choice.
A CSS style is important for page rendering and could block visual completeness. It needs to be processed in whole. Therefore, urgency=1 and incremental=false is suitable, this would mean it doesn't interfere with the HTML.
An image file that is outside the browser viewport is not very important and it can be processed and painted as parts arrive. Therefore, urgency=3 and incremental=true is appropriate to stop it interfering with sending other objects.
An image file that is the "hero image" of the page, making it the Largest Contentful Pain element. An urgency of 1 or 2 will help it avoid being mixed in with other images. The choice of incremental value is a little subjective and either might be appropriate.
When making an HTTP request, clients decide the Extensible Priority value composed of the urgency and incremental parameters. These are sent either as an HTTP header field in the request (meaning inside the HTTP/3 HEADERS frame on a request stream), or separately in an HTTP/3 PRIORITY_UPDATE frame on the control stream. HTTP headers are sent once at the start of a request; a client might change its mind so the PRIORITY_UPDATE frame allows it to reprioritize at any point in time.
For both the header field and PRIORITY_UPDATE, the parameters are exchanged using the Structured Fields Dictionary format (RFC 8941) and serialization rules. In order to save bytes on the wire, the parameters are shortened – urgency to 'u', and incremental to 'i'.
Here's how the HTTP header looks alongside a GET request for important HTML, using HTTP/3 style notation:
The PRIORITY_UPDATE frame only carries the serialized Extensible Priority value:
PRIORITY_UPDATE:
    u=0,i
Structured Fields has some other neat tricks. If you want to indicate the use of a default value, then that can be done via omission. Recall that the urgency default is 3, and incremental default is false. A client could send "u=1" alongside our important CSS request (urgency=1, incremental=false). For our lower priority image it could send just "i=?1" (urgency=3, incremental=true). There's even another trick, where boolean true dictionary parameters are sent as just "i". You should expect all of these formats to be used in practice, so it pays to be mindful about their meaning.
Extensible Priority servers need to decide how best to use the available connection bandwidth to schedule the response data bytes. When servers receive priority client signals, they get one form of input into a decision making process. RFC 9218 provides a set of scheduling recommendations that are pretty good at meeting a board set of needs. These can be distilled down to some golden rules.
For starters, the order of requests is crucial. Clients are very careful about asking for things at the moment they want it. Serving things in request order is good. In HTTP/3, because there is no strict ordering of stream arrival, servers can use stream IDs to determine this. Assuming the order of the requests is correct, the next most important thing is urgency ordering. Serving according to urgency values is good.
Be wary of non-incremental requests, as they mean the client needs the object in full before it can be used at all. An incremental request means the client can process things as and when they arrive.
With these rules in mind, the scheduling then becomes broadly: for each urgency level, serve non-incremental requests in whole serially, then serve incremental requests in round robin fashion in parallel. What this achieves is dedicated bandwidth for very important things, and shared bandwidth for less important things that can be processed or rendered progressively.
Let's look at some examples to visualize the different ways the scheduler can work. These are generated by using quiche'sqlog support and running it via the qvis analysis tool. These diagrams are similar to a waterfall chart; the y-dimension represents stream IDs (0 at the top, increasing as we move down) and the x-dimension shows reception of stream data.
Example 1: all streams have the same urgency and are non-incremental so get served in serial order of stream ID.
Example 2: the streams have the same urgency and are incremental so get served in round-robin fashion.
Example 3: the streams have all different urgency, with later streams being more important than earlier streams. The data is received serially but in a reverse order compared to example 1.
Beyond the Extensible Priority signals, a server might consider other things when scheduling, such as file size, content encoding, how the application vs content origins are configured etc.. This was true for HTTP/2 priorities but Extensible Priorities introduces a new neat trick, a priority signal can also be sent as a response header to override the client signal.
This works especially well in a proxying scenario where your HTTP/3 terminating proxy is sat in front of some backend such as Workers. The proxy can pass through the request headers to the backend, it can inspect these and if it wants something different, return response headers to the proxy. This allows powerful tuning possibilities and because we operate on a semantic request basis (rather than HTTP/2 priorities dependency basis) we don't have all the complications and dangers. Proxying isn't the only use case. Often, one form of "API" to your local server is via setting response headers e.g., via configuration. Leveraging that approach means we don't have to invent new APIs.
Let's consider an example where server overrides are useful. Imagine we have a webpage with multiple images that are referenced via <img> tags near the top of the HTML. The browser will process these quite early in the page load and want to issue requests. At this point, it might not know enough about the page structure to determine if an image is in the viewport or outside the viewport. It can guess, but that might turn out to be wrong if the page is laid out a certain way. Guessing wrong means that something is misprioritized and might be taking bandwidth away from something that is more important. While it is possible to reprioritize things mid-flight using the PRIORITY_UPDATE frame, this action is "laggy" and by the time the server realizes things, it might be too late to make much difference.
Fear not, the web developer who built the page knows exactly how it is supposed to be laid out and rendered. They can overcome client uncertainty by overriding the Extensible Priority when they serve the response. For instance, if a client guesses wrong and requests the LCP image at a low priority in a shared bandwidth bucket, the image will load slower and web performance metrics will be adversely affected. Here's how it might look and how we can fix it:
Priority response headers are one tool to tweak client behavior and they are complementary to other web performance techniques. Methods like efficiently ordering elements in HTML, using attributes like "async" or "defer", augmenting HTML links with Link headers, or using more descriptive link relationships like “preload” all help to improve a browser's understanding of the resources comprising a page. A website that optimizes these things provides a better chance for the browser to make the best choices for prioritizing requests.
More recently, a new attribute called “fetchpriority” has emerged that allows developers to tune some of the browser behavior, by boosting or dropping the priority of an element relative to other elements of the same type. The attribute can help the browser do two important things for Extensible priorities: first, the browser might send the request earlier or later, helping to satisfy our golden rule #1 – ordering. Second, the browser might pick a different urgency value, helping to satisfy rule #2. However, "fetchpriority" is a nudge mechanism and it doesn't allow for directly setting a desired priority value. The nudge can be a bit opaque. Sometimes the circumstances benefit greatly from just knowing plainly what the values are and what the server will do, and that's where the response header can help.
Conclusions
We’re excited about bringing this new standard into the world. Working with standards bodies has always been an amazing partnership and we’re very pleased with the results. We’ve seen great results with HTTP/3 priorities, reducing Largest Contentful Paint by up to 37% in our test. If you’re interested in turning on HTTP/3 priorities for your domain, just head on over to the Cloudflare dashboard and hit the toggle.
Today, a cluster of Internet standards were published that rationalize and modernize the definition of HTTP – the application protocol that underpins the web. This work includes updates to, and refactoring of, HTTP semantics, HTTP caching, HTTP/1.1, HTTP/2, and the brand-new HTTP/3. Developing these specifications has been no mean feat and today marks the culmination of efforts far and wide, in the Internet Engineering Task Force (IETF) and beyond. We thought it would be interesting to celebrate the occasion by sharing some analysis of Cloudflare’s view of HTTP traffic over the last 12 months.
However, before we get into the traffic data, for quick reference, here are the new RFCs that you should make a note of and start using:
HTTP’s overall architecture, common terminology and shared protocol aspects such as request and response messages, methods, status codes, header and trailer fields, message content, representation data, content codings and much more. Obsoletes RFCs 2818, 7231, 7232, 7233, 7235, 7538, 7615, 7694, and portions of 7230.
A syntax of HTTP that uses a binary framing format, which provides streams to support concurrent requests and responses. Message fields can be compressed using HPACK. Typically used over TCP and TLS. Obsoletes RFCs 7540 and 8740.
A variation of HPACK field compression that is optimized for the QUIC transport protocol.
On May 28, 2021, we enabled QUIC version 1 and HTTP/3 for all Cloudflare customers, using the final “h3” identifier that matches RFC 9114. So although today’s publication is an occasion to celebrate, for us nothing much has changed, and it’s business as usual.
A browser and web server typically automatically negotiate the highest HTTP version available. Thus, HTTP/3 takes precedence over HTTP/2. We looked back over the last year to understand HTTP/3 usage trends across the Cloudflare network, as well as analyzing HTTP versions used by traffic from leading browser families (Google Chrome, Mozilla Firefox, Microsoft Edge, and Apple Safari), major search engine indexing bots, and bots associated with some popular social media platforms. The graphs below are based on aggregate HTTP(S) traffic seen globally by the Cloudflare network, and include requests for website and application content across the Cloudflare customer base between May 7, 2021, and May 7, 2022. We used Cloudflare bot scores to restrict analysis to “likely human” traffic for the browsers, and to “likely automated” and “automated” for the search and social bots.
Traffic by HTTP version
Overall, HTTP/2 still comprises the majority of the request traffic for Cloudflare customer content, as clearly seen in the graph below. After remaining fairly consistent through 2021, HTTP/2 request volume increased by approximately 20% heading into 2022. HTTP/1.1 request traffic remained fairly flat over the year, aside from a slight drop in early December. And while HTTP/3 traffic initially trailed HTTP/1.1, it surpassed it in early July, growing steadily and roughly doubling in twelve months.
HTTP/3 traffic by browser
Digging into just HTTP/3 traffic, the graph below shows the trend in daily aggregate request volume over the last year for HTTP/3 requests made by the surveyed browser families. Google Chrome (orange line) is far and away the leading browser, with request volume far outpacing the others.
Below, we remove Chrome from the graph to allow us to more clearly see the trending across other browsers. Likely because it is also based on the Chromium engine, the trend for Microsoft Edge closely mirrors Chrome. As noted above, Mozilla Firefox first enabled production support in version 88 in April 2021, making it available by default by the end of May. The increased adoption of that updated version during the following month is clear in the graph as well, as HTTP/3 request volume from Firefox grew rapidly. HTTP/3 traffic from Apple Safari increased gradually through April, suggesting growth in the number of users enabling the experimental feature or running a Technology Preview version of the browser. However, Safari’s HTTP/3 traffic has subsequently dropped over the last couple of months. We are not aware of any specific reasons for this decline, but our most recent observations indicate HTTP/3 traffic is recovering.
Looking at the lines in the graph for Chrome, Edge, and Firefox, a weekly cycle is clearly visible in the graph, suggesting greater usage of these browsers during the work week. This same pattern is absent from Safari usage.
Across the surveyed browsers, Chrome ultimately accounts for approximately 80% of the HTTP/3 requests seen by Cloudflare, as illustrated in the graphs below. Edge is responsible for around another 10%, with Firefox just under 10%, and Safari responsible for the balance.
We also wanted to look at how the mix of HTTP versions has changed over the last year across each of the leading browsers. Although the percentages vary between browsers, it is interesting to note that the trends are very similar across Chrome, Firefox and Edge. (After Firefox turned on default HTTP/3 support in May 2021, of course.) These trends are largely customer-driven – that is, they are likely due to changes in Cloudflare customer configurations.
Most notably we see an increase in HTTP/3 during the last week of September, and a decrease in HTTP/1.1 at the beginning of December. For Safari, the HTTP/1.1 drop in December is also visible, but the HTTP/3 increase in September is not. We expect that over time, once Safari supports HTTP/3 by default that its trends will become more similar to those seen for the other browsers.
Traffic by search indexing bot
Back in 2014, Google announced that it would start to consider HTTPS usage as a ranking signal as it indexed websites. However, it does not appear that Google, or any of the other major search engines, currently consider support for the latest versions of HTTP as a ranking signal. (At least not directly – the performance improvements associated with newer versions of HTTP could theoretically influence rankings.) Given that, we wanted to understand which versions of HTTP the indexing bots themselves were using.
Despite leading the charge around the development of QUIC, and integrating HTTP/3 support into the Chrome browser early on, it appears that on the indexing/crawling side, Google still has quite a long way to go. The graph below shows that requests from GoogleBot are still predominantly being made over HTTP/1.1, although use of HTTP/2 has grown over the last six months, gradually approaching HTTP/1.1 request volume. (A blog post from Google provides some potential insights into this shift.) Unfortunately, the volume of requests from GoogleBot over HTTP/3 has remained extremely limited over the last year.
Microsoft’s BingBot also fails to use HTTP/3 when indexing sites, with near-zero request volume. However, in contrast to GoogleBot, BingBot prefers to use HTTP/2, with a wide margin developing in mid-May 2021 and remaining consistent across the rest of the past year.
Traffic by social media bot
Major social media platforms use custom bots to retrieve metadata for shared content, improve language models for speech recognition technology, or otherwise index website content. We also surveyed the HTTP version preferences of the bots deployed by three of the leading social media platforms.
Although Facebook supports HTTP/3 on their main website (and presumably their mobile applications as well), their back-end FacebookBot crawler does not appear to support it. Over the last year, on the order of 60% of the requests from FacebookBot have been over HTTP/1.1, with the balance over HTTP/2. Heading into 2022, it appeared that HTTP/1.1 preference was trending lower, with request volume over the 25-year-old protocol dropping from near 80% to just under 50% during the fourth quarter. However, that trend was abruptly reversed, with HTTP/1.1 growing back to over 70% in early February. The reason for the reversal is unclear.
Similar to FacebookBot, it appears TwitterBot’s use of HTTP/3 is, unfortunately, pretty much non-existent. However, TwitterBot clearly has a strong and consistent preference for HTTP/2, accounting for 75-80% of its requests, with the balance over HTTP/1.1.
In contrast, LinkedInBot has, over the last year, been firmly committed to making requests over HTTP/1.1, aside from the apparently brief anomalous usage of HTTP/2 last June. However, in mid-March, it appeared to tentatively start exploring the use of other HTTP versions, with around 5% of requests now being made over HTTP/2, and around 1% over HTTP/3, as seen in the upper right corner of the graph below.
Conclusion
We’re happy that HTTP/3 has, at long last, been published as RFC 9114. More than that, we’re super pleased to see that regardless of the wait, browsers have steadily been enabling support for the protocol by default. This allows end users to seamlessly gain the advantages of HTTP/3 whenever it is available. On Cloudflare’s global network, we’ve seen continued growth in the share of traffic speaking HTTP/3, demonstrating continued interest from customers in enabling it for their sites and services. In contrast, we are disappointed to see bots from the major search and social platforms continuing to rely on aging versions of HTTP. We’d like to build a better understanding of how these platforms chose particular HTTP versions and welcome collaboration in exploring the advantages that HTTP/3, in particular, could provide.
Current statistics on HTTP/3 and QUIC adoption at a country and autonomous system (ASN) level can be found on Cloudflare Radar.
Running HTTP/3 and QUIC on the edge for everyone has allowed us to monitor a wide range of aspects related to interoperability and performance across the Internet. Stay tuned for future blog posts that explore some of the technical developments we’ve been making.
And this certainly isn’t the end of protocol innovation, as HTTP/3 and QUIC provide many exciting new opportunities. The IETF and wider community are already underway building new capabilities on top, such as MASQUE and WebTransport. Meanwhile, in the last year, the QUIC Working Group has adopted new work such as QUIC version 2, and the Multipath Extension to QUIC.
In the last post, we discussed how HTTP CONNECT can be used to proxy TCP-based applications, including DNS-over-HTTPS and generic HTTPS traffic, between a client and target server. This provides significant benefits for those applications, but it doesn’t lend itself to non-TCP applications. And if you’re wondering whether or not we care about these, the answer is an affirmative yes!
For instance, HTTP/3 is based on QUIC, which runs on top of UDP. What if we wanted to speak HTTP/3 to a target server? That requires two things: (1) the means to encapsulate a UDP payload between client and proxy (which the proxy decapsulates and forward to the target in an actual UDP datagram), and (2) a way to instruct the proxy to open a UDP association to a target so that it knows where to forward the decapsulated payload. In this post, we’ll discuss answers to these two questions, starting with encapsulation.
Encapsulating datagrams
While TCP provides a reliable and ordered byte stream for applications to use, UDP instead provides unreliable messages called datagrams. Datagrams sent or received on a connection are loosely associated, each one is independent from a transport perspective. Applications that are built on top of UDP can leverage the unreliability for good. For example, low-latency media streaming often does so to avoid lost packets getting retransmitted. This makes sense, on a live teleconference it is better to receive the most recent audio or video rather than starting to lag behind while you’re waiting for stale data
QUIC is designed to run on top of an unreliable protocol such as UDP. QUIC provides its own layer of security, packet loss detection, methods of data recovery, and congestion control. If the layer underneath QUIC duplicates those features, they can cause wasted work or worse create destructive interference. For instance, QUIC congestion control defines a number of signals that provide input to sender-side algorithms. If layers underneath QUIC affect its packet flows (loss, timing, pacing, etc), they also affect the algorithm output. Input and output run in a feedback loop, so perturbation of signals can get amplified. All of this can cause congestion control algorithms to be more conservative in the data rates they use.
If we could speak HTTP/3 to a proxy, and leverage a reliable QUIC stream to carry encapsulated datagrams payload, then everything can work. However, the reliable stream interferes with expectations. The most likely outcome being slower end-to-end UDP throughput than we could achieve without tunneling. Stream reliability runs counter to our goals.
Fortunately, QUIC’s unreliable datagram extension adds a new DATAGRAM frame that, as its name plainly says, is unreliable. It has several uses; the one we care about is that it provides a building block for performant UDP tunneling. In particular, this extension has the following properties:
DATAGRAM frames are individual messages, unlike a long QUIC stream.
DATAGRAM frames do not contain a multiplexing identifier, unlike QUIC’s stream IDs.
Like all QUIC frames, DATAGRAM frames must fit completely inside a QUIC packet.
DATAGRAM frames are subject to congestion control, helping senders to avoid overloading the network.
DATAGRAM frames are acknowledged by the receiver but, importantly, if the sender detects a loss, QUIC does not retransmit the lost data.
The Datagram “Unreliable Datagram Extension to QUIC” specification will be published as an RFC soon. Cloudflare’s quiche library has supported it since October 2020.
Now that QUIC has primitives that support sending unreliable messages, we have a standard way to effectively tunnel UDP inside it. QUIC provides the STREAM and DATAGRAM transport primitives that support our proxying goals. Now it is the application layer responsibility to describe how to use them for proxying. Enter MASQUE.
MASQUE: Unlocking QUIC’s potential for proxying
Now that we’ve described how encapsulation works, let’s now turn our attention to the second question listed at the start of this post: How does an application initialize an end-to-end tunnel, informing a proxy server where to send UDP datagrams to, and where to receive them from? This is the focus of the MASQUE Working Group, which was formed in June 2020 and has been designing answers since. Many people across the Internet ecosystem have been contributing to the standardization activity. At Cloudflare, that includes Chris (as co-chair), Lucas (as co-editor of one WG document) and several other colleagues.
MASQUE started solving the UDP tunneling problem with a pair of specifications: a definition for how QUIC datagrams are used with HTTP/3, and a new kind of HTTP request that initiates a UDP socket to a target server. These have built on the concept of extended CONNECT, which was first introduced for HTTP/2 in RFC 8441 and has now been ported to HTTP/3. Extended CONNECT defines the :protocol pseudo-header that can be used by clients to indicate the intention of the request. The initial use case was WebSockets, but we can repurpose it for UDP and it looks like this:
A client sends an extended CONNECT request to a proxy server, which identifies a target server in the :path. If the proxy succeeds in opening a UDP socket, it responds with a 2xx (Successful) status code. After this, an end-to-end flow of unreliable messages between the client and target is possible; the client and proxy exchange QUIC DATAGRAM frames with an encapsulated payload, and the proxy and target exchange UDP datagrams bearing that payload.
Anatomy of Encapsulation
UDP tunneling has a constraint that TCP tunneling does not – namely, the size of messages and how that relates to path MTU (Maximum Transmission Unit; for more background see our Learning Center article). The path MTU is the maximum size that is allowed on the path between client and server. The actual maximum is the smallest maximum across all elements at every hop and at every layer, from the network up to application. All it takes is for one component with a small MTU to reduce the path MTU entirely. On the Internet, 1,500 bytes is a common practical MTU. When considering tunneling using QUIC, we need to appreciate the anatomy of QUIC packets and frames in order to understand how they add bytes of overheard. This consumes bytes and subtracts from our theoretical maximum.
We’ve been talking in terms of HTTP/3 which normally has its own frames (HEADERS, DATA, etc) that have a common type and length overhead. However, there is no HTTP/3 framing when it comes to DATAGRAM, instead the bytes are placed directly into the QUIC frame. This frame is composed of two fields. The first field is a variable number of bytes, called the Quarter Stream ID field, which is an encoded identifier that supports independent multiplexed DATAGRAM flows. It does so by binding each DATAGRAM to the HTTP request stream ID. In QUIC, stream IDs use two bits to encode four types of stream. Since request streams are always of one type (client-initiated bidirectional, to be exact), we can divide their ID by four to save space on the wire. Hence the name Quarter Stream ID. The second field is payload, which contains the end-to-end message payload. Here’s how it might look on the wire.
If you recall our lesson from the last post, DATAGRAM frames (like all frames) must fit completely inside a QUIC packet. Moreover, since QUIC requires that fragmentation is disabled, QUIC packets must fit completely inside a UDP datagram. This all combines to limit the maximum size of things that we can actually send: the path MTU determines the size of the UDP datagram, then we need to subtract the overheads of the UDP datagram header, QUIC packet header, and QUIC DATAGRAM frame header. For a better understanding of QUIC’s wire image and overheads, see Section 5 of RFC 8999 and Section 12.4 of RFC 9000.
If a sender has a message that is too big to fit inside the tunnel, there are only two options: discard the message or fragment it. Neither of these are good options. Clients create the UDP tunnel and are more likely to accurately calculate the real size of encapsulated UDP datagram payload, thus avoiding the problem. However, a target server is most likely unaware that a client is behind a proxy, so it cannot accommodate the tunneling overhead. It might send a UDP datagram payload that is too big for the proxy to encapsulate. This conundrum is common to all proxy protocols! There’s an art in picking the right MTU size for UDP-based traffic in the face of tunneling overheads. While approaches like path MTU discovery can help, they are not a silver bullet. Choosing conservative maximum sizes can reduce the chances of tunnel-related problems. However, this needs to be weighed against being too restrictive. Given a theoretical path MTU of 1,500, once we consider QUIC encapsulation overheads, tunneled messages with a limit between 1,200 and 1,300 bytes can be effective.This is especially important when we think about tunneling QUIC itself. RFC 9000 Section 8.1 details how clients that initiate new QUIC connections must send UDP datagrams of at least 1,200 bytes. If a proxy can’t support that, then QUIC will not work in a tunnel.
Nested tunneling for Improved Privacy Proxying
MASQUE gives us the application layer building blocks to support efficient tunneling of TCP or UDP traffic. What’s cool about this is that we can combine these blocks into different deployment architectures for different scenarios or different needs.
One example of this case is nested tunneling via multiple proxies, which can minimize the connection metadata available to each individual proxy or server (one example of this type of deployment is described in our recent post on iCloud Private Relay). In this kind of setup, a client might manage at least three logical connections. First, a QUIC connection between Client and Proxy 1. Second, a QUIC connection between Client and Proxy 2, which runs via a CONNECT tunnel in the first connection. Third, an end-to-end byte stream between Client and Server, which runs via a CONNECT tunnel in the second connection. A real TCP connection only exists between Proxy 2 and Server. If additional Client to Server logical connections are needed, they can be created inside the existing pair of QUIC connections.
Towards a full tunnel with IP tunneling
Proxy support for UDP and TCP already unblocks a huge assortment of use cases, including TLS, QUIC, HTTP, DNS, and so on. But it doesn’t help protocols that use different IP protocols, like ICMP or IPsec Encapsulating Security Payload (ESP). Fortunately, the MASQUE Working Group has also been working on IP tunneling. This is a lot more complex than UDP tunneling, so they first spent some time defining a common set of requirements. The group has recently adopted a new specification to support IP proxying over HTTP. This behaves similarly to the other CONNECT designs we’ve discussed but with a few differences. Indeed, IP proxying support using HTTP as a substrate would unlock many applications that existing protocols like IPsec and WireGuard enable.
At this point, it would be reasonable to ask: “A complete HTTP/3 stack is a bit excessive when all I need is a simple end-to-end tunnel, right?” Our answer is, it depends! CONNECT-based IP proxies use TLS and rely on well established PKIs for creating secure channels between endpoints, whereas protocols like WireGuard use a simpler cryptographic protocol for key establishment and defer authentication to the application. WireGuard does not support proxying over TCP but can be adapted to work over TCP transports, if necessary. In contrast, CONNECT-based proxies do support TCP and UDP transports, depending on what version of HTTP is used. Despite these differences, these protocols do share similarities. In particular, the actual framing used by both protocols – be it the TLS record layer or QUIC packet protection for CONNECT-based proxies, or WireGuard encapsulation – are not interoperable but only slightly differ in wire format. Thus, from a performance perspective, there’s not really much difference.
In general, comparing these protocols is like comparing apples and oranges – they’re fit for different purposes, have different implementation requirements, and assume different ecosystem participants and threat models. At the end of the day, CONNECT-based proxies are better suited to an ecosystem and environment that is already heavily invested in TLS and the existing WebPKI, so we expect CONNECT-based solutions for IP tunnels to become the norm in the future. Nevertheless, it’s early days, so be sure to watch this space if you’re interested in learning more!
Looking ahead
The IETF has chartered the MASQUE Working Group to help design an HTTP-based solution for UDP and IP that complements the existing CONNECT method for TCP tunneling. Using HTTP semantics allows us to use features like request methods, response statuses, and header fields to enhance tunnel initialization. For example, allowing for reuse of existing authentication mechanisms or the Proxy-Status field. By using HTTP/3, UDP and IP tunneling can benefit from QUIC’s secure transport native unreliable datagram support, and other features. Through a flexible design, older versions of HTTP can also be supported, which helps widen the potential deployment scenarios. Collectively, this work brings proxy protocols to the masses.
While the design details of MASQUE specifications continue to be iterated upon, so far several implementations have been developed, some of which have been interoperability tested during IETF hackathons. This running code helps inform the continued development of the specifications. Details are likely to continue changing before the end of the process, but we should expect the overarching approach to remain similar. Join us during the MASQUE WG meeting in IETF 113 to learn more!
Traffic proxying, the act of encapsulating one flow of data inside another, is a valuable privacy tool for establishing boundaries on the Internet. Encapsulation has an overhead, Cloudflare and our Internet peers strive to avoid turning it into a performance cost. MASQUE is the latest collaboration effort to design efficient proxy protocols based on IETF standards. We’re already running these at scale in production; see our recent blog post about Cloudflare’s role in iCloud Private Relay for an example.
In this blog post series, we’ll dive into proxy protocols.
To begin, let’s start with a simple question: what is proxying? In this case, we are focused on forward proxying — a client establishes an end-to-end tunnel to a target server via a proxy server. This contrasts with the Cloudflare CDN, which operates as a reverse proxy that terminates client connections and then takes responsibility for actions such as caching, security including WAF, load balancing, etc. With forward proxying, the details about the tunnel, such as how it is established and used, whether or not it provides confidentiality via authenticated encryption, and so on, vary by proxy protocol. Before going into specifics, let’s start with one of the most common tunnels used on the Internet: TCP.
Transport basics: TCP provides a reliable byte stream
The TCP transport protocol is a rich topic. For the purposes of this post, we will focus on one aspect: TCP provides a readable and writable, reliable, and ordered byte stream. Some protocols like HTTP and TLS require a reliable transport underneath them and TCP’s single byte stream is an ideal fit. The application layer reads or writes to this byte stream, but the details about how TCP sends this data “on the wire” are typically abstracted away.
Large application objects are written into a stream, then they are split into many small packets and they are sent in order to the network. At the receiver, packets are read from the network and combined back into an identical stream. Networks are not perfect and packets can be lost or reordered. TCP is clever at dealing with this and not worrying the application with details. It just works. A way to visualize this is to imagine a magic paper shredder that can both shred documents and convert shredded papers back to whole documents. Then imagine you and your friend bought a pair of these and decided that it would be fun to send each other shreds.
The one problem with TCP is that when a lost packet is detected at a receiver, the sender needs to retransmit it. This takes time to happen and can mean that the byte stream reconstruction gets delayed. This is known as TCP head-of-line blocking. Applications regularly use TCP via a socket API that abstracts away protocol details; they often can’t tell if there are delays because the other end is slow at sending or if the network is slowing things down via packet loss.
Proxy Protocols
Proxying TCP is immensely useful for many applications, including, though certainly not limited to HTTPS, SSH, and RDP. In fact, Oblivious DoH, which is a proxy protocol for DNS messages, could very well be implemented using a TCP proxy, though there are reasons why this may not be desirable. Today, there are a number of different options for proxying TCP end-to-end, including:
SOCKS, which runs in cleartext and requires an expensive connection establishment step.
Transparent TCP proxies, commonly referred to as performance enhancing proxies (PEPs), which must be on path and offer no additional transport security, and, definitionally, are limited to TCP protocols.
Layer 4 proxies such as Cloudflare Spectrum, which might rely on side carriage metadata via something like the PROXY protocol.
HTTP CONNECT, which transforms HTTPS connections into opaque byte streams.
While SOCKS and PEPs are viable options for some use cases, when choosing which proxy protocol to build future systems upon, it made most sense to choose a reusable and general-purpose protocol that provides well-defined and standard abstractions. As such, the IETF chose to focus on using HTTP as a substrate via the CONNECT method.
The concept of using HTTP as a substrate for proxying is not new. Indeed, HTTP/1.1 and HTTP/2 have supported proxying TCP-based protocols for a long time. In the following sections of this post, we’ll explain in detail how CONNECT works across different versions of HTTP, including HTTP/1.1, HTTP/2, and the recently standardized HTTP/3.
HTTP/1.1 and CONNECT
In HTTP/1.1, the CONNECT method can be used to establish an end-to-end TCP tunnel to a target server via a proxy server. This is commonly applied to use cases where there is a benefit of protecting the traffic between the client and the proxy, or where the proxy can provide access control at network boundaries. For example, a Web browser can be configured to issue all of its HTTP requests via an HTTP proxy.
A client sends a CONNECT request to the proxy server, which requests that it opens a TCP connection to the target server and desired port. It looks something like this:
If the proxy succeeds in opening a TCP connection to the target, it responds with a 2xx range status code. If there is some kind of problem, an error status in the 5xx range can be returned. Once a tunnel is established there are two independent TCP connections; one on either side of the proxy. If a flow needs to stop, you can simply terminate them.
HTTP CONNECT proxies forward data between the client and the target server. The TCP packets themselves are not tunneled, only the data on the logical byte stream. Although the proxy is supposed to forward data and not process it, if the data is plaintext there would be nothing to stop it. In practice, CONNECT is often used to create an end-to-end TLS connection where only the client and target server have access to the protected content; the proxy sees only TLS records and can’t read their content because it doesn’t have access to the keys.
Finally, it’s worth noting that after a successful CONNECT request, the HTTP connection (and the TCP connection underpinning it) has been converted into a tunnel. There is no more possibility of issuing other HTTP messages, to the proxy itself, on the connection.
HTTP/2 and CONNECT
HTTP/2 adds logical streams above the TCP layer in order to support concurrent requests and responses on a single connection. Streams are also reliable and ordered byte streams, operating on top of TCP. Returning to our magic shredder analogy: imagine you wanted to send a book. Shredding each page one after another and rebuilding the book one page at a time is slow, but handling multiple pages at the same time might be faster. HTTP/2 streams allow us to do that. But, as we all know, trying to put too much into a shredder can sometimes cause it to jam.
In HTTP/2, each request and response is sent on a different stream. To support this, HTTP/2 defines frames that contain the stream identifier that they are associated with. Requests and responses are composed of HEADERS and DATA frames which contain HTTP header fields and HTTP content, respectively. Frames can be large. When they are sent on the wire they might span multiple TLS records or TCP segments. Side note: the HTTP WG has been working on a new revision of the document that defines HTTP semantics that are common to all HTTP versions. The terms message, header fields, and content all come from this description.
HTTP/2 concurrency allows applications to read and write multiple objects at different rates, which can improve HTTP application performance, such as web browsing. HTTP/1.1 traditionally dealt with this concurrency by opening multiple TCP connections in parallel and striping requests across these connections. In contrast, HTTP/2 multiplexes frames belonging to different streams onto the single byte stream provided by one TCP connection. Reusing a single connection has benefits, but it still leaves HTTP/2 at risk of TCP head-of-line blocking. For more details, refer to Perf Planet blog.
HTTP/2 also supports the CONNECT method. In contrast to HTTP/1.1, CONNECT requests do not take over an entire HTTP/2 connection. Instead, they convert a single stream into an end-to-end tunnel. It looks something like this:
If the proxy succeeds in opening a TCP connection, it responds with a 2xx (Successful) status code. After this, the client sends DATA frames to the proxy, and the content of these frames are put into TCP packets sent to the target. In the return direction, the proxy reads from the TCP byte stream and populates DATA frames. If a tunnel needs to stop, you can simply terminate the stream; there is no need to terminate the HTTP/2 connection.
By using HTTP/2, a client can create multiple CONNECT tunnels in a single connection. This can help reduce resource usage (saving the global count of TCP connections) and allows related tunnels to be logically grouped together, ensuring that they “share fate” when either client or proxy need to gracefully close. On the proxy-to-server side there are still multiple independent TCP connections.
One challenge of multiplexing tunnels on concurrent streams is how to effectively prioritize them. We’ve talked in the past about prioritization for web pages, but the story is a bit different for CONNECT. We’ve been thinking about this and captured considerations in the new Extensible Priorities draft.
QUIC, HTTP/3 and CONNECT
QUIC is a new secure and multiplexed transport protocol from the IETF. QUIC version 1 was published as RFC 9000 in May 2021 and, the next day, we enabled it for all Cloudflare customers.
QUIC is composed of several foundational features. You can think of these like individual puzzle pieces that interlink to form a transport service. This service needs one more piece, an application mapping, to bring it all together.
Similar to HTTP/2, QUIC version 1 provides reliable and ordered streams. But QUIC streams live at the transport layer and they are the only type of QUIC primitive that can carry application data. QUIC has no opinion on how streams get used. Applications that wish to use QUIC must define that themselves.
QUIC streams can be long (up to 2^62 – 1 bytes). Stream data is sent on the wire in the form of STREAM frames. All QUIC frames must fit completely inside a QUIC packet. QUIC packets must fit entirely in a UDP datagram; fragmentation is prohibited. These requirements mean that a long stream is serialized to a series of QUIC packets sized roughly to the path MTU (Maximum Transmission Unit). STREAM frames provide reliability via QUIC loss detection and recovery. Frames are acknowledged by the receiver and if the sender detects a loss (via missing acknowledgments), QUIC will retransmit the lost data. In contrast, TCP retransmits packets. This difference is an important feature of QUIC, letting implementations decide how to repacketize and reschedule lost data.
When multiplexing streams, different packets can contain STREAM frames belonging to different stream identifiers. This creates independence between streams and helps avoid the head-of-line blocking caused by packet loss that we see in TCP. If a UDP packet containing data for one stream is lost, other streams can continue to make progress without being blocked by retransmission of the lost stream.
To use our magic shredder analogy one more time: we’re sending a book again, but this time we parallelise our task by using independent shredders. We need to logically associate them together so that the receiver knows the pages and shreds are all for the same book, but otherwise they can progress with less chance of jamming.
HTTP/3 is an example of an application mapping that describes how streams are used to exchange: HTTP settings, QPACK state, and request and response messages. HTTP/3 still defines its own frames like HEADERS and DATA, but it is overall simpler than HTTP/2 because QUIC deals with the hard stuff. Since HTTP/3 just sees a logical byte stream, its frames can be arbitrarily sized. The QUIC layer handles segmenting HTTP/3 frames over STREAM frames for sending in packets. HTTP/3 also supports the CONNECT method. It functions identically to CONNECT in HTTP/2, each request stream converting to an end-to-end tunnel.
HTTP packetization comparison
We’ve talked about HTTP/1.1, HTTP/2 and HTTP/3. The diagram below is a convenient way to summarize how HTTP requests and responses get serialized for transmission over a secure transport. The main difference is that with TLS, protected records are split across several TCP segments. While with QUIC there is no record layer, each packet has its own protection.
Limitations and looking ahead
HTTP CONNECT is a simple and elegant protocol that has a tremendous number of application use cases, especially for privacy-enhancing technology. In particular, applications can use it to proxy DNS-over-HTTPS similar to what’s been done for Oblivious DoH, or more generic HTTPS traffic (based on HTTP/1.1 or HTTP/2), and many more.
However, what about non-TCP traffic? Recall that HTTP/3 is an application mapping for QUIC, and therefore runs over UDP as well. What if we wanted to proxy QUIC? What if we wanted to proxy entire IP datagrams, similar to VPN technologies like IPsec or WireGuard? This is where MASQUE comes in. In the next post, we’ll discuss how the MASQUE Working Group is standardizing technologies to enable proxying for datagram-based protocols like UDP and IP.
QUIC is a new Internet transport protocol for secure, reliable and multiplexed communications. HTTP/3 builds on top of QUIC, leveraging the new features to fix performance problems such as Head-of-Line blocking. This enables web pages to load faster, especially over troublesome networks.
QUIC and HTTP/3 are open standards that have been under development in the IETF for almost exactly 4 years. On October 21, 2020, following two rounds of Working Group Last Call, draft 32 of the family of documents that describe QUIC and HTTP/3 were put into IETF Last Call. This is an important milestone for the group. We are now telling the entire IETF community that we think we’re almost done and that we’d welcome their final review.
Speaking personally, I’ve been involved with QUIC in some shape or form for many years now. Earlier this year I was honoured to be asked to help co-chair the Working Group. I’m pleased to help shepherd the documents through this important phase, and grateful for the efforts of everyone involved in getting us there, especially the editors. I’m also excited about future opportunities to evolve on top of QUIC v1 to help build a better Internet.
There are two aspects to protocol development. One aspect involves writing and iterating upon the documents that describe the protocols themselves. Then, there’s implementing, deploying and testing libraries, clients and/or servers. These aspects operate hand in hand, helping the Working Group move towards satisfying the goals listed in its charter. IETF Last Call marks the point that the group and their responsible Area Director (in this case Magnus Westerlund) believe the job is almost done. Now is the time to solicit feedback from the wider IETF community for review. At the end of the Last Call period, the stakeholders will take stock, address feedback as needed and, fingers crossed, go onto the next step of requesting the documents be published as RFCs on the Standards Track.
Although specification and implementation work hand in hand, they often progress at different rates, and that is totally fine. The QUIC specification has been mature and deployable for a long time now. HTTP/3 has been generally available on the Cloudflare edge since September 2019, and we’ve been delighted to see support roll out in user agents such as Chrome, Firefox, Safari, curl and so on. Although draft 32 is the latest specification, the community has for the time being settled on draft 29 as a solid basis for interoperability. This shouldn’t be surprising, as foundational aspects crystallize the scope of changes between iterations decreases. For the average person in the street, there’s not really much difference between 29 and 32.
So today, if you visit a website with HTTP/3 enabled—such as https://cloudflare-quic.com—you’ll probably see response headers that contain Alt-Svc: h3-29=”… . And in a while, once Last Call completes and the RFCs ship, you’ll start to see websites simply offer Alt-Svc: h3=”… (note, no draft version!).
Need a deep dive?
We’ve collected a bunch of resource links at https://cloudflare-quic.com. If you’re more of an interactive visual learner, you might be pleased to hear that I’ve also been hosting a series on Cloudflare TV called “Levelling up Web Performance with HTTP/3”. There are over 12 hours of content including the basics of QUIC, ways to measure and debug the protocol in action using tools like Wireshark, and several deep dives into specific topics. I’ve also been lucky to have some guest experts join me along the way. The table below gives an overview of the episodes that are available on demand.
Understanding the role of congestion control in QUIC. Featuring Junho Choi.
Whither QUIC?
So does Last Call mean QUIC is “done”? Not by a long shot. The new protocol is a giant leap for the Internet, because it enables new opportunities and innovation. QUIC v1 is basically the set of documents that have gone into Last Call. We’ll continue to see people gain experience deploying and testing this, and no doubt cool blog posts about tweaking parameters for efficiency and performance are on the radar. But QUIC and HTTP/3 are extensible, so we’ll see people interested in trying new things like multipath, different congestion control approaches, or new ways to carry data unreliably such as the DATAGRAM frame.
We’re also seeing people interested in using QUIC for other use cases. Mapping other application protocols like DNS to QUIC is a rapid way to get its improvements. We’re seeing people that want to use QUIC as a substrate for carrying other transport protocols, hence the formation of the MASQUE Working Group. There’s folks that want to use QUIC and HTTP/3 as a “supercharged WebSocket”, hence the formation of the WebTransport Working Group.
Whatever the future holds for QUIC, we’re just getting started, and I’m excited.
The collective thoughts of the interwebz
Manage Consent
To provide the best experiences, we use technologies like cookies to store and/or access device information. Consenting to these technologies will allow us to process data such as browsing behavior or unique IDs on this site. Not consenting or withdrawing consent, may adversely affect certain features and functions.
Functional
Always active
The technical storage or access is strictly necessary for the legitimate purpose of enabling the use of a specific service explicitly requested by the subscriber or user, or for the sole purpose of carrying out the transmission of a communication over an electronic communications network.
Preferences
The technical storage or access is necessary for the legitimate purpose of storing preferences that are not requested by the subscriber or user.
Statistics
The technical storage or access that is used exclusively for statistical purposes.The technical storage or access that is used exclusively for anonymous statistical purposes. Without a subpoena, voluntary compliance on the part of your Internet Service Provider, or additional records from a third party, information stored or retrieved for this purpose alone cannot usually be used to identify you.
Marketing
The technical storage or access is required to create user profiles to send advertising, or to track the user on a website or across several websites for similar marketing purposes.