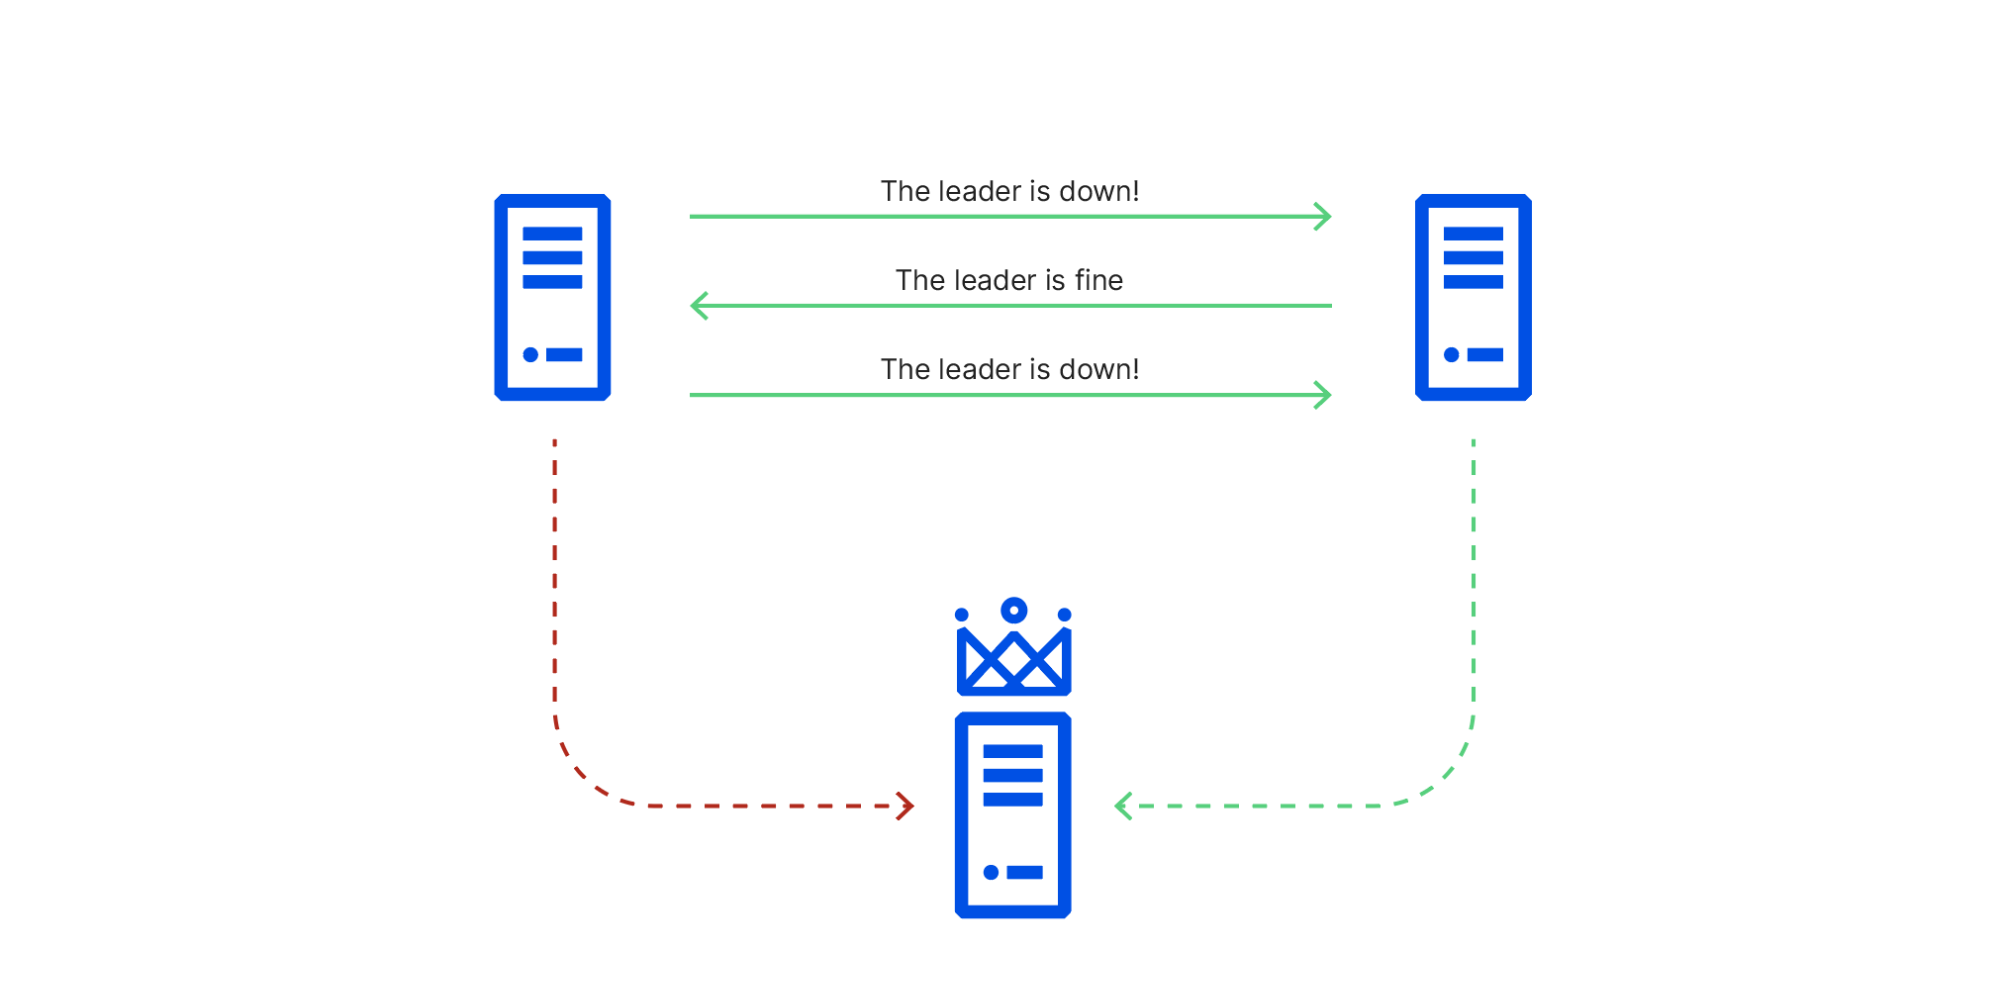
Security Insights provides actionable security recommendations for every Cloudflare account. To find these insights, we perform regular scans for all accounts, zones, and DNS records, looking for potential security risks and misconfigurations.
However, two key issues emerged. First, our scans were too infrequent. Scans were only being performed every week or two, and therefore newly introduced security risks could remain undetected for up to two weeks. Second, automatic scanning was opt-in for many free plan accounts – meaning lots of accounts weren’t being scanned at all.
The risks of infrequent or nonexistent scans are rising: as automated attacks accelerate, the window for detecting security misconfigurations is shrinking. Making sure that we’re finding these issues for all of our customers is crucial to our aim of building a better Internet for everyone.
We calculated that to increase our scanning frequencies and enable automatic scanning for all accounts, we would need to increase our scanning throughput by around 10x on average – from 10 scans per second to 100 per second. But our system was already struggling with its load: millions of events were filling up our backlog waiting to be processed; our API was frequently timing out; our processes were crashing. We needed to fix our system, and we needed to make it scale.
This is the story of how we increased scanning throughput for Security Insights by more than 10x, enabled security insights for millions of customers, and doubled our scanning frequency for all customers. Read on to find out how we achieved these improvements.
How we scan for security insights
At a high level, our automatic security scans are triggered by a scheduler. When an account or zone is due for a scan, the scheduler publishes a message (or messages) to Apache Kafka, an open-source distributed event streaming platform. These messages fan out to a number of checkers: specialized Go microservices that scan specific assets or configurations.
For every message, each checker sends its results (the security insights that it found) to our internal API, which then persists these in a Postgres database.
Making it scale
Scaling Kafka
Apache Kafka is not strictly a queue: it is a partitioned event stream (though recently gained queue semantics). Within a partition, messages must be consumed and processed in order. This differs from typical queues where messages may be consumed in order but are processed out-of-order. As a result, we can only have one active consumer per partition within a consumer group.
This has two consequences for us:
Messages that are slow to process block the consumer from progressing to the next message
For each checker, we can only have as many consumers as there are partitions (each checker has its own consumer group)
We could have tried to scale by adding more partitions. However, this would have increased resource usage for the Kafka broker itself, which is shared by many other services. We reserved this as a last resort, aiming to improve our code and architecture first.
Introducing parallel processing
Although we can only consume messages in order, there is nothing stopping us from consuming multiple messages at once.
We changed our checkers to consume messages in batches, processing each message in a separate goroutine. The trade-offs are that we’d have more work to re-do if our process crashed midway through a batch, and our memory usage would be slightly increased. In our case, these were both acceptable.
Avoiding head-of-line blocking
Some messages processed by a few of our checkers take much longer to process than others. For example, one account/zone may have far more assets than another. In the worst case, these messages can take minutes or hours to process compared to the average case of seconds or milliseconds.
We opted for a very simple approach: splitting our consumer groups and checkers in two – the ‘slow lane’ and the ‘fast lane’. We could determine quickly whether a message would be slow or fast to process. If the ‘fast lane’ checker encounters a slow message, it skips it.
This solved the problem: slow messages had the dedicated resources and time to be processed with minimal delay, and fast messages were able to proceed at their regular fast pace.
Optimizing our database queries
Every insight we find gets written to our Postgres database. This is handled by a single API endpoint that our checkers invoke with a list of insights. The implementation looked like this:
for _, issue := range issues {
	_, err = tx.Exec(ctx, `INSERT INTO table ... VALUES ($1, $2, ...) ON CONFLICT DO UPDATE ...`, ...)
	if err != nil {
		return err
	}
}
The astute reader will notice that for large sets of insights, this code makes a round trip to the database per insight. With a maximum observed size of 500,000, this was half a million round trips, queries, and transactions in a single API call.
We initially tried the gold standard for bulk inserts in Postgres: COPY into a temporary table. However, we found that this approach led to bloat in the Postgres system tables.
We settled on a hybrid approach:
Using UNNEST when the number of issues was below a threshold
Using COPY when the number of issues exceeded this threshold
This provided the best of both worlds: reasonably fast inserts for huge sets of insights (seconds), and even faster inserts (milliseconds) for small sets of insights.
Investigating our API timeouts
We noticed several strange behaviours in our internal API as we tried to scale:
A large number of requests were triggering client-side timeouts
Many checkers were spending 20-90% of their processing time on a single API call
When triggering a large volume of scans, our throughput would start high and deteriorate
All of these problems had the same root cause: latency.
Our primary database is located in Portland, Oregon. Our API, however, was running active-active in both Portland and Amsterdam. Even at the speed of light, the round-trip latency between Portland and Amsterdam would be 50 milliseconds.
As a result of this latency, database queries from the Amsterdam API instance took much longer, holding connections from our client-side connection pool open. With the large volume of requests that we were making to the API, the connection pool was quickly becoming exhausted, leading to timeouts waiting for a free connection. Our average API call completed in 10 ms in Portland, but almost 3 seconds in Amsterdam!
But why the drop in message throughput? Each checker process gets assigned a set of partitions of the Kafka stream to consume. Our API is load-balanced. Since we hold the connection open throughout the life of the process, some processes had a connection to the Amsterdam API, and others had a connection to the Portland API. The partitions linked to Portland were processed quickly, but the ones consumed by the Amsterdam-bound processes were lagging behind:
Kafka lag (number of messages waiting to be processed within a single consumer group) by partition for one of our checkers. Note that we have 30 partitions in this case. Exactly 15 partitions can be seen lagging behind (the lines that reach or approach zero later than around 03/10 03:00). This is because the load balancer splits traffic evenly between our API endpoints.
This was a simple fix: we switched our API to active-passive, ensuring the active API followed our primary database. Our latency problems disappeared overnight.
Rethinking the scheduler
We’d scaled Kafka. We’d optimised our database queries. We’d fixed our API. However, we still had a problem: we needed to be sure our scans would be roughly uniformly distributed in time. It wasn’t feasible to queue all of our scans at the same time, as our Kafka topic uses a time-based retention policy: the scans would pile up in Kafka, and eventually be deleted before they could be processed.
Our scheduler was not good at uniformly distributing our scans. The number of scans that would be triggered at a given time was spiky and unpredictable. At certain points throughout the week, hundreds of thousands of scans would be triggered within minutes of each other. What was going on?
The scheduler triggers scans on fixed recurring periods. In pseudocode, the scheduler looked like this:
Loop forever:
    Find accounts where last_scheduled_at + scanning frequency <= now
    For each account:
        Trigger scan for account
        Trigger scan for all zones in the account
        Update last_scheduled_at = now
We quickly noticed that last_scheduled_at was similar for a large number of accounts in our database, which was responsible for some of this unevenness.
However, even with perfectly even distribution, increasing our scanning frequency would have compounded this problem. For example, changing the scanning frequency from every 15 days to every seven days would mean 53% of accounts would suddenly be due for a scan.
There was a further problem with this logic. Some accounts have a very large number of zones. When these accounts were scheduled, there was a cascade of scans for all of their zones. This was saturating our Kafka partitions and leading to delays for scans of much smaller accounts.
To fix these problems, we made three key changes:
Schedule zones independently of accounts: each zone gets its own last_scheduled_at field.
Randomize the last_scheduled_at time for existing accounts and zones.
Introduce adaptive rate limiting for scan scheduling.
Scheduling zones independently was an obvious way to solve the problem of large accounts. Randomizing the last_scheduled_at time (and ensuring that no scans were delayed during this process) allowed us to fix the existing unevenness in our database.
Adaptive rate limiting is slightly more interesting. Rate limiting would allow us to solve the problem of a spike in scans when we change scanning frequencies. For example, if we wanted to increase our scanning frequency to every 7 days, and we had 50 million accounts, then a rate limit of ~83 scans/second would ensure that they were spread out evenly across 7 days.
But what if we added 10 million more accounts? Then, this rate limit would force us to take 8 days to scan all of these accounts. This is where the adaptive part comes in: the rate limit is asynchronously recalculated every half-hour based on the total number of accounts and zones we have, and our scanning frequencies. This ensures we continue scanning on time even if we onboard thousands or millions more accounts and zones.
func computeRate(free, pro, biz, ent int64) rate.Limit {
   r := float64(free)/freeScanInterval.Seconds() +
      float64(pro)/proScanInterval.Seconds() +
      float64(biz)/bizScanInterval.Seconds() +
      float64(ent)/entScanInterval.Seconds()


   // Guard against zero counts. We always want to schedule at least one scan per second.
   if r < 1 {
      r = 1
   }


   // Increase rate limit beyond the 'perfect' value, to have a buffer in case of any downtime
   // or spikes in load.
   r *= rateLimitBufferFactor


   return rate.Limit(r)
}
Where we stand today
With these fixes, our 7-day moving average throughput per checker over time rose by more than 10x.
Before these improvements, we were executing around 10 scans per second. The gap between this and our target throughput of 100 scans per second seemed vast. We discussed throwing more resources at the problem, throwing more partitions at our Kafka topic – even throwing out our entire architecture.
But our fixes made all the difference. Today, Security Insights sustains over 120 scans per second during peak scheduling, exceeding our 10x improvement goal. Our internal API is no longer timing out, and our Kafka lag metrics look much healthier. These scalability improvements have allowed us to turn on automatic scanning for all free accounts and zones and increase the scanning frequency for all customers:
Free: every 7 days
Pro and Business: every 3 days
Enterprise: daily
The improved system stability has given us confidence to build new features that we were previously constrained from creating. We’ve added the ability to perform granular on-demand scans. You can now manually re-scan a Cloudflare account, zone, insight, or insight type.
Starting a granular on-demand scan from the Security Overview page in the Cloudflare dashboard
The lesson we learned is that it’s crucial to deeply understand the existing system before throwing anything away. By looking closely at our code, SQL queries, logs, and metrics (especially metrics!), we were able to increase our capacity without simply adding more pods or partitions. By questioning our assumptions, digging into weird-looking metrics, and refusing to take the easy shortcuts (such as increasing API client-side timeouts), we built a more stable and resilient system.
Throwing more resources at the problem might sometimes be the answer, but at Cloudflare, we believe in engineering our way out of problems.
Security Insights scans are enabled by default on all Cloudflare plans. Log in to the Cloudflare dashboard today to review and manage your security insights.
Cloudflare announced our PlanetScale partnership last September to give Cloudflare Workers direct access to Postgres and MySQL databases for fast, full-stack applications.
Soon, we’re bringing our technologies even closer: you’ll be able to create PlanetScale Postgres and MySQL databases directly from the Cloudflare dashboard and API, and have them billed to your Cloudflare account.
You choose the data storage that fits your Worker application needs and keep a single system for billing as a Cloudflare self-serve or enterprise customer. Cloudflare credits like those given in our startup program or Cloudflare committed spend can be used towards PlanetScale databases.
Postgres & MySQL for Workers
SQL relational databases like Postgres and MySQL are a foundation of modern applications. In particular, Postgres has risen in developer popularity with its rich tooling ecosystem (ORMs, GUIs, etc) and extensions like pgvector for building vector search in AI-driven applications. Postgres is the default choice for most developers who need a powerful, flexible, and scalable database to power their applications.
You can already connect your PlanetScale account and create Postgres databases directly from the Cloudflare dashboard for your Workers. Starting next month, a new Cloudflare subscription will bill for new PlanetScale databases direct to your Cloudflare account as a self-serve or enterprise user.
How to create PlanetScale databases via Cloudflare dashboard after your PlanetScale account is connected. Cloudflare billing is coming next month.
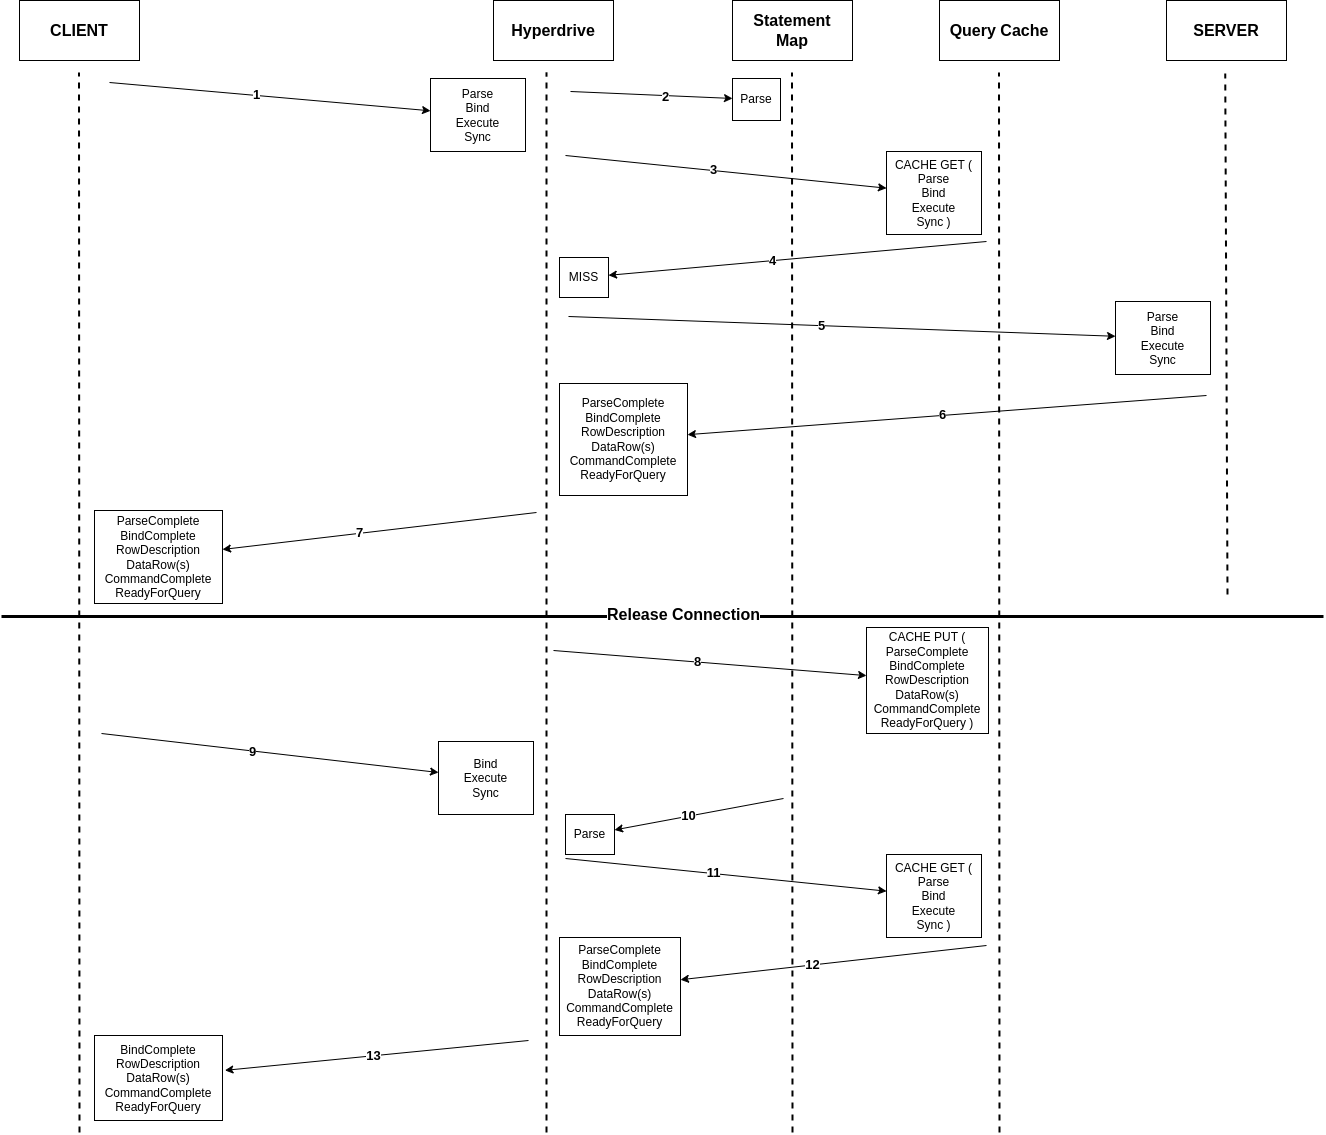
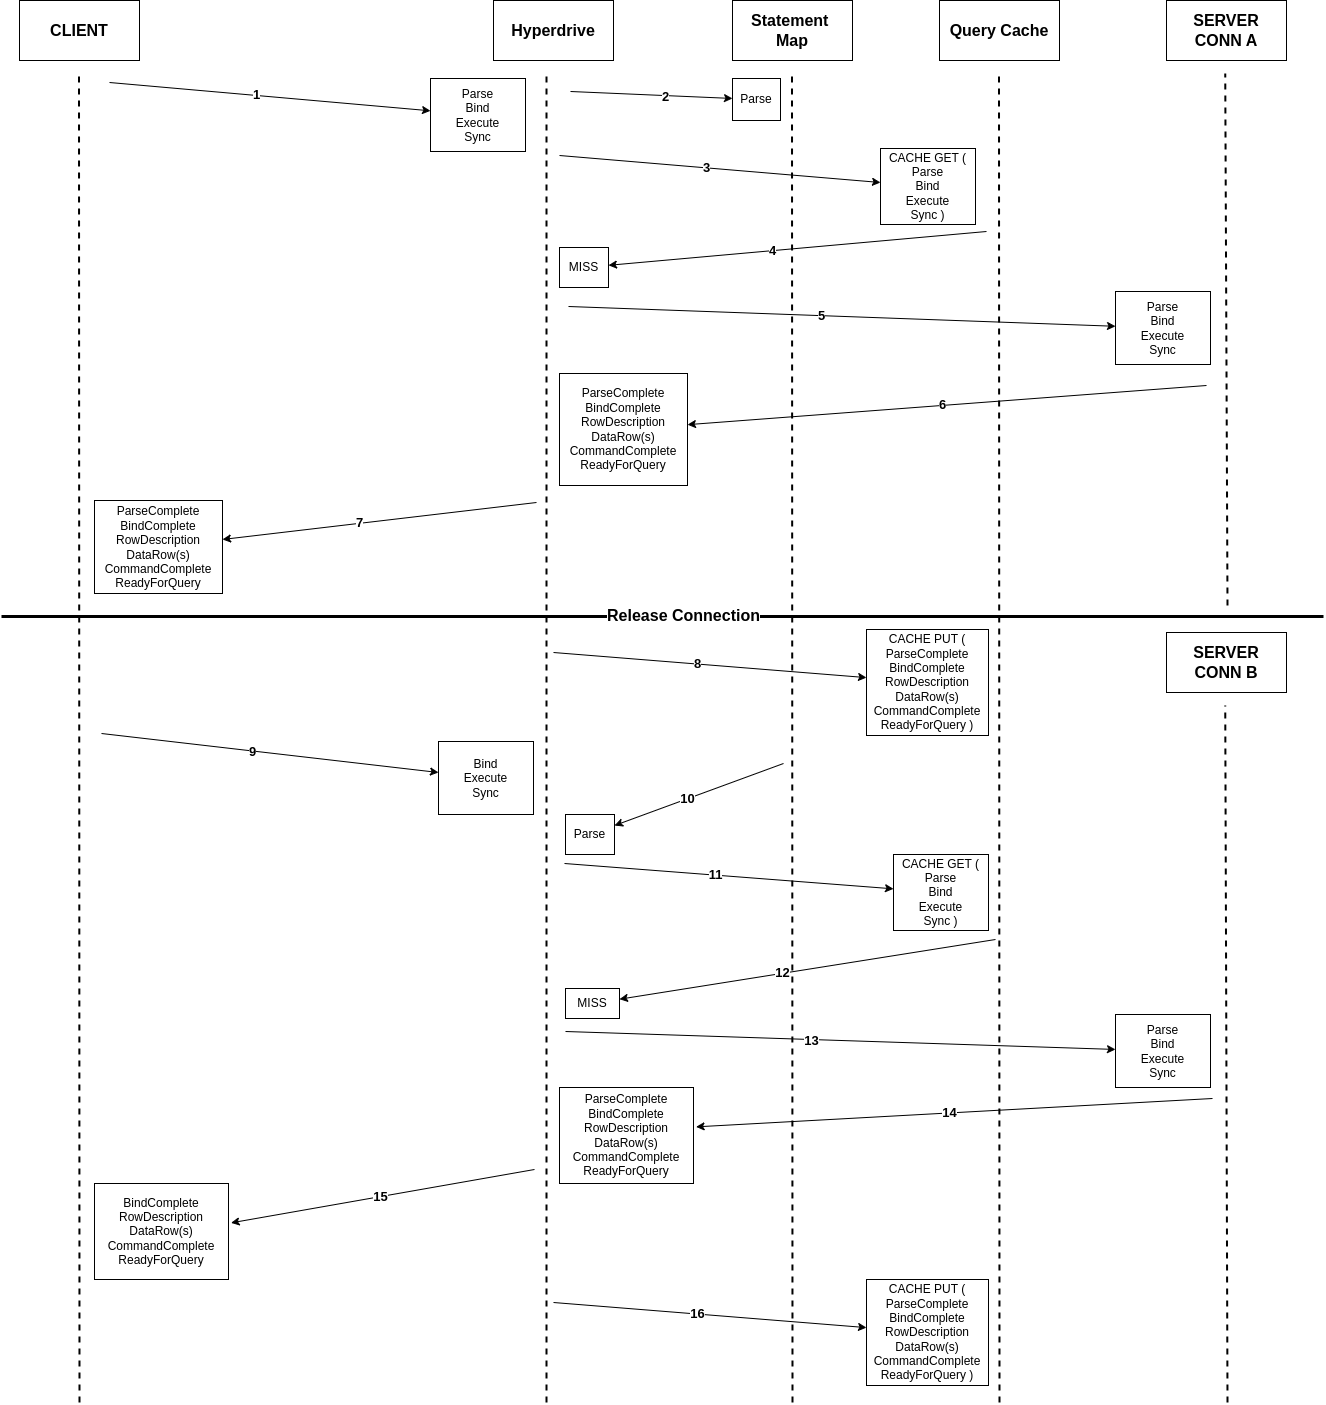
With our built-in integration, PlanetScale databases automatically work with Workers using Hyperdrive, our database connectivity service. Hyperdrive service manages database connection pools and query caching to make database queries fast and reliable. You just add a binding to your Worker’s config file:
And start running SQL queries via your Worker with your Postgres client of choice:
import { Client } from "pg";

export default {
  async fetch(request, env, ctx) {

    const client = new Client({ connectionString: env.DATABASE.connectionString });
    await client.connect();

    const result = await client.query("SELECT * FROM pg_tables");
    ...
}
PlanetScale developer experience
PlanetScale was the obvious choice to provide to the Workers community due to it’s unrivaled performance and reliability. Developers can choose from two of the most popular relational databases with Postgres or Vitess MySQL. PlanetScale matches how Cloudflare treats performance and reliability as key features of a developer platform. And with features like query insights and agent driven workflows for improving SQL query performance and branching for deploying code safely, including database changes, the PlanetScale database developer experience is first-class.
Cloudflare users get the exact same PlanetScale database developer experience. Your PlanetScale databases can be deployed directly from Cloudflare with connections managed via Hyperdrive, which already makes your existing regional databases fast with global Workers. This means access to the same PlanetScale database clusters at standard PlanetScale pricing with all features included like query insights and detailed breakdown of usage and costs.
A single node on PlanetScale Postgres starts at $5/month.
Workers placement
With centralized databases, Workers can run right next to your primary database to reduce latency with an explicit placement hint. By default, Workers execute closest to a user request, which adds network latency when querying a central database especially for multiple queries. Instead, you can configure your Worker to execute in the closest Cloudflare data center to your PlanetScale database. In the future, Cloudflare can automatically set a placement hint based on the location of your PlanetScale database and reduce network latency to single digit milliseconds.
{
  "placement": {
    "region": "aws:us-east-1"
  }
}
Coming soon
You can deploy a PlanetScale Postgres database or connect an existing PlanetScale database to Workers today via the Cloudflare dashboard. Everything today is still billed via PlanetScale.
Launching next month, new PlanetScale databases can be billed to your Cloudflare account.
We are building more with our PlanetScale partners, such as Cloudflare API integration, so tell us what you’d like to see next.
In 2024, the Online Data Stores team at Netflix conducted a comprehensive review of the relational database technologies used across the company. This evaluation examined functionality, performance, and total cost of ownership across our database ecosystem. Based on this analysis, we decided to standardize on Amazon Aurora PostgreSQL as the primary relational database offering for Netflix teams.
Several key factors influenced this decision:
PostgreSQL already underpinnedthe majority of our relational workloads, which made it a natural foundation for standardization. Internal evaluations revealed that Aurora PostgreSQL had supported over 95% of the applications and workloads running on other relational databases across our internal services.
Industry momentum had continued to shift toward PostgreSQL, driven by its open ecosystem, strong community support, and broad adoption across modern data platforms.
Aurora’s cloud-native, distributed architecture provided clear advantages in scalability, high availability, and elasticity compared to traditional single-node PostgreSQL deployments.
Aurora PostgreSQL offered a rich feature set, along with a strong, forward-looking roadmap aligned with the needs of large-scale, globally distributed applications.
A Clear Migration Path Forward
As part of this strategic shift, one of our key initiatives for 2024/2025 was migrating existing users to Aurora PostgreSQL. This effort began with RDS PostgreSQL migrations and will expand to include migrations from other relational systems in subsequent phases.
As a data platform organization, our goal is to make this evolution predictable, well-supported, and minimally disruptive. This allows teams to adopt Aurora PostgreSQL at a pace that aligns with their product and operational roadmaps, while we move toward a unified and scalable relational data platform across the organization.
Database Migration: More Than a Simple Transfer
Migrating a database involves far more than copying rows from one system to another. It is a coordinated process of transitioning both data and database functionality while preserving correctness, availability, and performance. At scale, a well-designed migration must minimize disruption to applications and ensure a clean, deterministic handoff from the old system to the new one.
Most database migrations follow a common set of high-level steps:
Data Replication: Data is first copied from the source database to the destination, typically using replication, so that ongoing changes are continuously captured and applied.
Quiescence: Write traffic to the source database is halted, allowing the destination to fully catch up and eliminate any remaining divergence.
Validation: The system verifies that the source and destination databases are fully synchronized and contain identical data.
Cutover: Client applications are reconfigured to point to the destination database, which becomes the new primary source of truth.
Challenges
Operational Challenges
Migrating to a new relational database at Netflix scale presents substantial operational challenges. With a fleet approaching 400 PostgreSQL clusters, manually migrating each one is simply not scalable for the data platform team. Such an approach would require a significant amount of time, introduce the risk of human error, and necessitate considerable hands-on engineering effort. Compounding the problem, coordinating downtime across the many interconnected services that depend on each database is extremely cumbersome at this scale.
To address these challenges, we designed a self-service migration workflow that enables service owners to run their own RDS PostgreSQL to Aurora PostgreSQL migrations. The workflow automatically handles orchestration, safety checks, and correctness guarantees end-to-end, resulting in lower operational overhead and a predictable, reliable migration experience.
Technical challenges
Zero data loss — We must guarantee that all data from the source cluster is fully and safely migrated to the destination within a very tight window, with no possibility of data loss.
Minimal downtime — Some downtime is unavoidable during migration, as applications must briefly pause write traffic while cutting over to Aurora PostgreSQL. For higher-tier services that power critical parts of the Netflix ecosystem, this window must be kept extremely short to prevent user-facing impact and maintain service reliability.
No control over client applications — As the platform team, we manage the databases, but application teams handle the read and write operations. We cannot assume that they have the ability to pause writes on demand, nor do we want to expose such controls to them, as mistakes could lead to data inconsistencies post migration. Therefore, building a self-service migration pipeline requires creative control-plane solutions to halt traffic, ensuring that no writes occur during the validation and cutover phases.
No direct access to RDS credentials — The migration automation must perform replication, quiescence, and validation without requesting database credentials from users or relying on manual authentication. Source databases are often tightly secured, allowing access only from client applications, but more importantly, requiring credential access — even if it were possible — would significantly increase operational overhead and risk. At the same time, the migration platform may operate in environments without direct access to the source database, making traditional verification or parity checks impossible.
No Degradation in Performance — The migration process must not impact the performance or stability of production databases once they are running in the Aurora PostgreSQL ecosystem.
Full Ecosystem Parity — Beyond migrating the core database, associated components such as parameter groups, read replicas, and replication slots must also be migrated to ensure functional equivalence.
Minimal User Effort — Since we rely on teams who are not database experts to perform migrations, the process must be simple, intuitive, and fully self-guided.
AWS recommended migration techniques
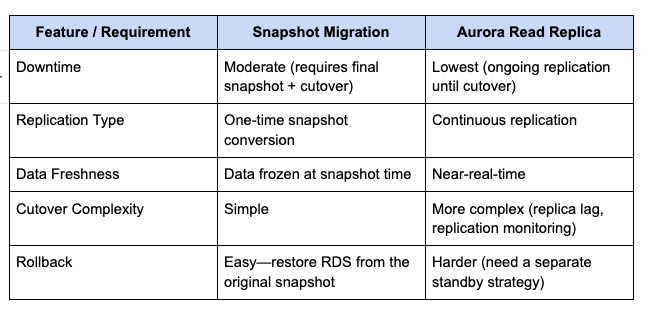
Using a snapshot
One of the simplest AWS-recommended approaches for migrating from RDS PostgreSQL to Aurora PostgreSQL is based on snapshots. In this model, write traffic to the source PostgreSQL database is first stopped. A manual snapshot of the RDS PostgreSQL instance is then taken and migrated to Aurora, where AWS converts it into an Aurora-compatible format.
Once the conversion completes, a new Aurora PostgreSQL cluster is created from the snapshot. After the cluster is brought online and validated, application traffic is redirected to the Aurora endpoint, completing the migration.
In the read-replica–based approach, an Aurora PostgreSQL read replica is created from an existing RDS PostgreSQL instance. AWS establishes continuous, asynchronous replication from the RDS source to the Aurora replica, allowing ongoing changes to be streamed in near real time.
Because replication runs continuously, the Aurora replica remains closely synchronized with the source database. This enables teams to provision and validate the Aurora environment — including configuration, connectivity, and performance characteristics — while production traffic continues to flow to the source.
When the replication lag is sufficiently low, write traffic is briefly paused to allow the replica to fully catch up. The Aurora read replica is then promoted to a standalone Aurora PostgreSQL cluster, and application traffic is redirected to the new Aurora endpoint. This approach significantly reduces downtime compared to snapshot-based migrations and is well-suited for production systems that require minimal disruption.
Migration Strategy Trade-Offs
These differences represent the key considerations when choosing a migration strategy from RDS PostgreSQL to Aurora PostgreSQL. For our automation, we opted for the Aurora Read Replica approach, trading increased implementation complexity for a significantly shorter downtime window for client applications.
Netflix RDS PostgreSQL Deployment Architecture
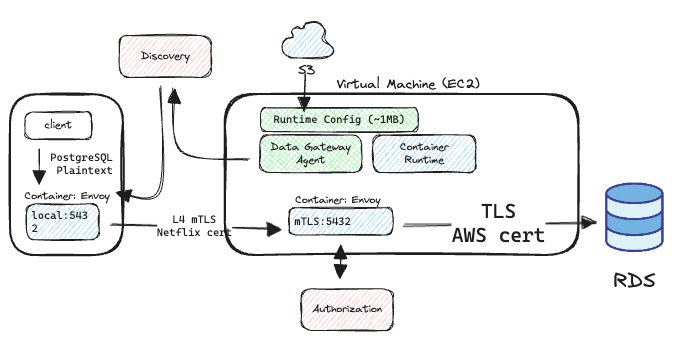
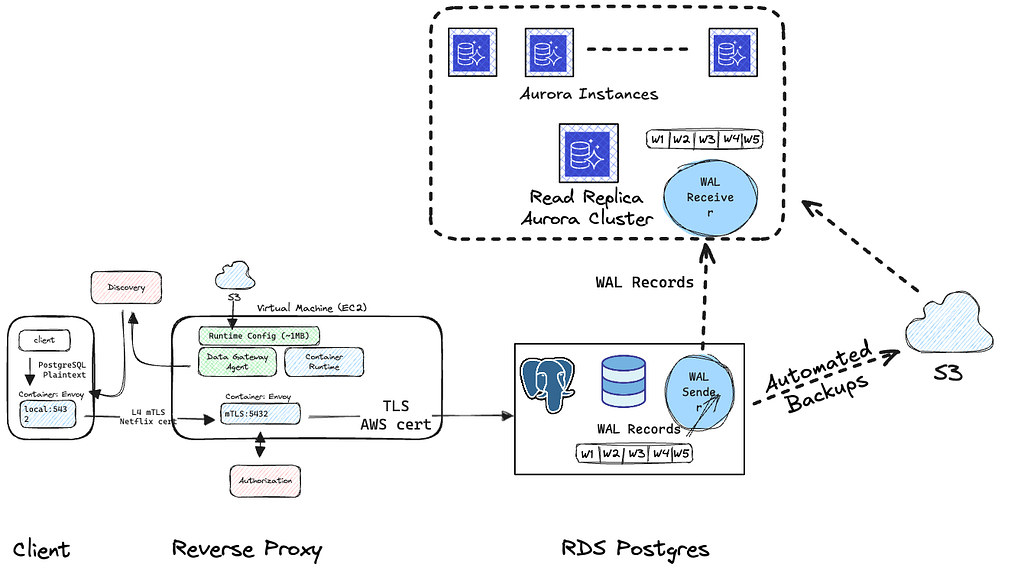
In Netflix’s RDS setup, a Data Access Layer (DAL) sits between applications and backend databases, acting as middleware that centralizes database connectivity, security, and traffic routing on behalf of client applications.
On the client side, applications connect through a forward proxy that manages mutual TLS (mTLS) authentication and establishes a secure tunnel to the Data Gateway service. The Data Gateway, acting as a reverse proxy for database servers, terminates client connections, enforces centralized authentication and authorization, and forwards traffic to the appropriate RDS PostgreSQL instance.
This layered design ensures that applications never handle raw database credentials, provides a consistent and secure access pattern across all datastore types, and delivers isolated, transparent connectivity to managed PostgreSQL clusters. While the primary goal of this architecture is to enforce strong security controls and standardize how applications access external AWS data stores, it also allows backend databases to be switched transparently via configuration, enabling controlled, low-downtime migrations.
Migration Process
The Platform team’s goal is to deliver a fully automated, self-service workflow that helps with the migration of customer RDS PostgreSQL instances to Aurora PostgreSQL clusters. This migration tool orchestrates the entire process — from preparing the source environment, initializing the Aurora read replica, and maintaining continuous synchronization, all the way through to cutover — without requiring any database credentials or manual intervention from the customer.
Designed for minimal downtime and seamless user experience, the workflow ensures full ecosystem parity between RDS and Aurora, preserving performance characteristics and operational behavior while enabling customers to benefit from Aurora’s improved scalability, resilience, and cost efficiency.
Data Replication Phase
Enable Automated Backups
Automated backups must be enabled on the source database because the Aurora read replica is initialized from a consistent snapshot of the source and then kept in sync through continuous replication. Automated backups provide the stable snapshot required to bootstrap the replica, along with the continuous streaming of write-ahead log (WAL) records needed to keep the read replica closely synchronized with the source.
Port RDS parameters to an Aurora parameter group
We create a dedicated Aurora parameter group for each cluster and migrate all RDS-compatible parameters from the source RDS instance. This ensures that the Aurora cluster inherits the same configuration settings — such as memory configuration, connection limits, query planner behavior, and other PostgreSQL engine parameters that have equivalents in Aurora. Parameters that are unsupported or behave differently in Aurora are either omitted or adjusted according to Aurora best practices.
Create an Aurora read replica cluster and instance
Creating an Aurora read replica cluster is a critical step in migrating from RDS PostgreSQL to Aurora PostgreSQL. At this stage, the Aurora cluster is created and attached to the RDS PostgreSQL primary as a replica, establishing continuous replication from the source RDS PostgreSQL instance. These Aurora read replicas stay nearly in sync with ongoing changes by streaming write-ahead logs (WAL) from the source, enabling minimal downtime during cutover. The cluster is fully operational for validation and performance testing, but it is not yet writable — RDS remains the authoritative primary.
Quiescence Phase
The goal of the quiescence phase is to transition client applications from the source RDS PostgreSQL instance to the Aurora PostgreSQL cluster as the new primary database, while preserving data consistency during cutover.
The first step in this process is to stop all write traffic to the source RDS PostgreSQL instance to guarantee consistency. To achieve this, we instruct users to halt application-level traffic, which helps prevent issues such as retry storms, queue backlogs, or unnecessary resource consumption when connectivity changes during cutover. This coordination also gives teams time to prepare operationally, for example, by suppressing alerts, notifying downstream consumers, or communicating planned maintenance to their customers.
However, relying solely on application-side controls is unreliable. Operational gaps, misconfigurations, or lingering connections can still modify the source database state, potentially resulting in changes that are not replicated to the destination and leading to data inconsistency or loss. To enforce a clean and deterministic cutover, we also block traffic at the infrastructure layer. This is done by detaching the RDS instance’s security groups to prevent new inbound connections, followed by a reboot of the instance. With security groups removed, no new SQL sessions can be established, and the reboot forcibly terminates any existing connections.
This approach intentionally avoids requiring database credentials or logging into the PostgreSQL server to manually terminate connections. While it may be slower than application- or database-level intervention, it provides a reliably automated and repeatable mechanism to fully quiesce the source RDS PostgreSQL instance before Aurora promotion, eliminating the risk of divergent writes or an inconsistent WAL state.
Validation Phase
To determine whether the Aurora read replica has fully caught up with the source RDS PostgreSQL instance, we track replication progress using Aurora’s OldestReplicationSlotLag metric. This metric represents how far the Aurora replica is behind the source in applying write-ahead log (WAL) records.
Once client traffic is halted during quiescence, the source RDS PostgreSQL instance stops producing meaningful WAL entries. At that point, the replication lag should converge to zero, indicating that all WAL records corresponding to real writes have been fully replayed on Aurora.
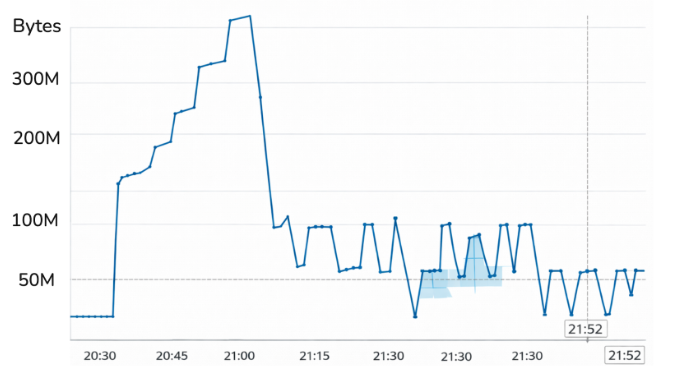
However, in practice, our experiments show that the metric never settles at a steady zero. Instead, it briefly drops to 0, then quickly returns to 64 MB, repeating this pattern every few minutes as shown in the figure below.
OldestReplicationSlotLag
This behavior stems from how OldestReplicationSlotLag is calculated. Internally, the lag is derived using the following query:
SELECT
  slot_name,
  pg_wal_lsn_diff(pg_current_wal_lsn(), restart_lsn) AS slot_lag_bytes
FROM pg_replication_slots;
The restart_lsn represents the oldest write-ahead log (WAL) record that PostgreSQL must retain to ensure a replication consumer can safely resume replication.
When PostgreSQL performs a WAL segment switch, Aurora typically catches up almost immediately. At that moment, the restart_lsn briefly matches the source’s current WAL position, causing the reported lag to drop to 0. During idle periods, PostgreSQL performs an empty WAL segment rotation approximately every five minutes, driven by the archive_timeout = 300s setting in the database parameter group.
Immediately afterward, PostgreSQL begins writing to the new WAL segment. Since this new segment has not yet been fully flushed or consumed by Aurora, the WAL position in source RDS PostgreSQL advances ahead of the restart_lsn of Aurora PostgreSQL by exactly one segment. As a result, OldestReplicationSlotLag jumps to 64 MB, which corresponds to the configured WAL segment size at database initialization, and remains there until the next segment switch occurs.
Because idle PostgreSQL performs an empty WAL rotation approximately every five minutes, this zero-then-64 MB oscillation is expected. Importantly, the moment when the lag drops to 0 indicates that all meaningful WAL records have been fully replicated, and the Aurora read replica is fully caught up with the source.
Cutover Phase
Once the Aurora read replica has fully caught up with the source RDS PostgreSQL instance — as confirmed through replication lag analysis — the final step is to promote the replica and redirect application traffic. Promoting the Aurora read replica converts it into an independent, writable Aurora PostgreSQL cluster with its own writer and reader endpoints. At this point, the source RDS PostgreSQL instance is no longer the authoritative primary and is made inaccessible.
Because Netflix’s RDS ecosystem is fronted by a Data Access Layer (DAL), consisting of client-side forward proxies and a centralized Data Gateway, switching databases does not require application code changes or database credential access. Instead, traffic redirection is handled entirely through configuration updates in the reverse-proxy layer. Specifically, we update the runtime configuration of the Envoy-based Data Gateway to route traffic to the newly promoted Aurora cluster. Once this configuration change propagates, all client-initiated database connections are transparently routed through the DAL to the Aurora writer endpoint, completing the migration without requiring any application changes.
This proxy-level cutover, combined with Aurora promotion, enables a seamless transition for service owners, minimizes downtime, and preserves data consistency throughout the migration process.
Customer Experience: Migrating a Business-Critical Partner Platform
One of the critical teams to adopt the RDS PostgreSQL to Aurora PostgreSQL migration workflow was the Enablement Applications team. This team owns a set of databases that model Netflix’s entire ecosystem of partner integrations, including device manufacturers, discovery platforms, and distribution partners. These databases power a suite of enterprise applications that partners worldwide rely on to build, test, certify, and launch Netflix experiences on their devices and services.
Because these databases sit at the center of Netflix’s partner enablement and certification workflows, they are consumed by a diverse set of client applications across both internal and external organizations. Internally, reliability teams use this data to identify streaming failures for specific devices and configurations, supporting quality improvements across the device ecosystem. At the same time, these databases directly serve external partners operating across many regions. Device manufacturers rely on them to configure, test, and certify new hardware, while payment partners use them to set up and launch bundled offerings with Netflix.
Simplified Enablement Applications Overview
Device Lifecycle Management
Netflix works with a wide range of device partners to ensure Netflix streams seamlessly across a diverse ecosystem of consumer devices. A core responsibility of Device Lifecycle Management is to provide tools and workflows that allow partners to develop, test, and certify Netflix integrations on their devices.
As part of the device lifecycle, partners run Netflix-provided test suites against their NRDP implementation. We store signals that represent the current stage for each device in the certification process. This certification data forms the backbone of Netflix’s device enablement program, ensuring that only validated devices can launch Netflix experiences.
Partner Billed Integrations
In addition to device enablement, the same partner metadata is also consumed by Netflix’s Partner Billed Integrations organization. This group enables external partners to offer Netflix as part of bundled subscription and billing experiences.
Any disruption in these databases affects partner integration workflows. If the database is unavailable, partners may be unable to configure or launch service bundles with Netflix. Maintaining high availability and data correctness is essential to preserving smooth integration operations.
The global nature of these workflows makes it difficult to schedule downtime windows. Any disruption would impact partner productivity and risk eroding trust in Netflix’s integration and certification processes.
Preparation
Given the criticality of the Enablement Applications databases, thorough preparation was essential before initiating the migration. The team invested significant effort upfront to understand traffic patterns, identify all consumers, and establish clear communication channels.
Understand Client Fan-Out and Traffic Patterns The first step was to gain a complete view of how the databases were being used in production. Using observability tools like CloudWatch metrics, the team analyzed PostgreSQL connection counts, read and write patterns, and overall load characteristics. This helped establish a baseline for normal behavior and ensured there were no unexpected traffic spikes or hidden dependencies that could complicate the migration.
Just as importantly, this baseline gave the Enablement Applications team a rough idea of the post-migration behavior on Aurora. For example, they expected to see a similar number of active database connections and comparable traffic patterns after cutover, making it easier to validate that the migration had preserved operational characteristics.
Identify and Enumerate All Database Consumers Unlike most databases, where the set of consumers is well known to the owning team, these databases were accessed by a wide range of internal services and external-facing systems that were not fully enumerated upfront. To address this, we leveraged a tool called flowlogs, an eBPF-based network attribution tooling was used to capture TCP flow data to identify the services and applications establishing connections to the database(link).
This approach allowed the team to enumerate active consumers, including those that were not previously documented, ensuring no clients were missed during migration planning.
Establish Dedicated Communication Channels Once all consumers were identified, a dedicated communication channel was created to provide continuous updates throughout the migration process. This channel was used to share timelines, readiness checks, status updates, and cutover notifications, ensuring that all stakeholders remained aligned and could respond quickly if issues arose.
Migration Process
After completing application-side preparation, the Enablement Applications team initiated the data replication phase of the migration workflow. The automation successfully provisioned the Aurora read replica cluster and ported the RDS PostgreSQL parameter group to a corresponding Aurora parameter group, bringing the destination environment up with equivalent configuration.
Unexpected Replication Slot Behavior
However, shortly after replication began, we observed that the OldestReplicationSlotLag metric was unexpectedly high. This was counterintuitive, as Aurora read replicas are designed to remain closely synchronized with the source database by continuously streaming write-ahead logs (WAL).
Further investigation revealed the presence of an inactive logical replication slot on the source RDS PostgreSQL instance. An inactive replication slot can cause elevated OldestReplicationSlotLag because PostgreSQL must retain all WAL records required by the slot’s last known position (restart_lsn), even if no client is actively consuming data from it. Replication slots are intentionally designed to prevent data loss by ensuring that a consumer can resume replication from where it left off. As a result, PostgreSQL will not recycle or delete WAL segments needed by a replication slot until the slot advances. When a slot becomes inactive — such as when a client migration task is stopped or abandoned — the slot’s position no longer moves forward. Meanwhile, the database continues to generate WAL, forcing PostgreSQL to retain increasingly older WAL files. This growing gap between the current WAL position and the slot’s restart_lsn manifests as a high OldestReplicationSlotLag.
Identifying and addressing these inactive replication slots was a critical prerequisite to proceeding safely with the migration and ensuring accurate replication state during cutover.
Successful Migration After Remediation After identifying the inactive logical replication slot, the team safely cleaned it up on the source RDS PostgreSQL instance and resumed the migration workflow. With the stale slot removed, replication progressed as expected, and the Aurora read replica quickly converged with the source. The migration then proceeded smoothly through the quiescence phase, with no unexpected behavior or replication anomalies observed.
Following promotion, application traffic transitioned seamlessly to the newly writable Aurora PostgreSQL cluster. Through the Data Access Layer, new client connections were automatically routed to Aurora, and observability metrics confirmed healthy behavior — connection counts, read/write patterns, and overall load closely matched pre-migration baselines. From the application and partner perspective, the cutover was transparent, validating both the correctness of the migration workflow and the effectiveness of the preparation steps.
Open questions
How do we select target Aurora PostgreSQL instance types based on the existing production RDS PostgreSQL instance?
When selecting the target Aurora PostgreSQL instance type for a production migration, our guidance is intentionally conservative. We prioritize stability and performance first, and optimize for cost only after observing real workload behavior on Aurora.
In practice, the recommended approach is to adopt Graviton2-based instances (particularly the r6g family) whenever possible, maintain the same instance family and size where feasible, and — at minimum — preserve the memory footprint of the existing RDS instance.
Unlike RDS PostgreSQL, Aurora does not support the m-series, making a direct family match impossible for those instances. In such cases, simply keeping the same “size” (e.g., 2xlarge → 2xlarge) is not meaningful because the memory profiles differ across families. Instead, we map instances by memory equivalence. For example, an Aurora r6g.xlarge provides a memory footprint comparable to an RDS m5.2xlarge, making it a practical replacement. This memory-aligned strategy offers a safer and more predictable baseline for production migrations.
Downtime During RDS → Aurora Cutover?
To achieve minimal downtime during an RDS PostgreSQL → Aurora PostgreSQL migration, we front-load as much work as possible into the preparation phase. By the time we reach cutover, the Aurora read replica is already provisioned and continuously replicating WAL from the source RDS instance. Before initiating downtime, we ensure that the replication lag between Aurora and RDS has stabilized within an acceptable threshold. If the lag is large or fluctuating significantly, forcing a cutover will only inflate downtime.
Downtime begins the moment we remove the security groups from the source RDS instance, blocking all inbound traffic. We then reboot the instance to forcibly terminate existing connections, which typically takes up to a minute. From this point forward, no writes can be performed.
After traffic is halted, the next objective is to verify that Aurora has fully replayed all meaningful WAL records from RDS. We track this using OldestReplicationSlotLag. We first wait for the metric to drop to 0, indicating that Aurora has consumed all WAL with real writes. Under normal idle behavior, PostgreSQL triggers an empty WAL switch every five minutes. After observing one data point at 0, we wait for an additional idle WAL rotation and confirm that the lag oscillates within the expected 0 → 64 MB pattern — signifying that the only remaining WAL segments are empty ones produced during idle time. At this point, we know the Aurora replica is fully caught up and can be safely promoted.
While these validation steps run, we perform the configuration updates on the Envoy reverse proxy in parallel. Once promotion completes and Envoy is restarted with the new runtime configuration, all client-initiated connections begin routing to the Aurora cluster. In practice, the total write-downtime observed across services averages around 10 minutes, dominated largely by the RDS reboot and the idle WAL switch interval.
Optimization: Reducing Idle-Time Wait
For services requiring stricter downtime budgets, waiting the full five minutes for an idle WAL switch can be prohibitively expensive. In such cases, we can force a WAL rotation immediately after traffic is cut off by issuing:
SELECT pg_switch_wal();
Once the switch occurs, OldestReplicationSlotLag will drop to 0 again as Aurora consumes the new (empty) WAL segment. This approach eliminates the need to wait for the default archive_timeout interval, which can significantly reduce overall downtime.
How do we migrate CDC consumers?
As part of the data platform organization in Netflix, we provide a managed Change Data Capture (CDC) service across a variety of datastores. For PostgreSQL, logical replication slots is the way of implementing change data capture. At Netflix, we build a managed abstraction on top of these replication slots called datamesh to manage customers who are leveraging them (link).
Each logical replication slot tracks a consumer’s position in the write-ahead log (WAL), ensuring that WAL records are retained until the consumer has successfully processed them. This guarantees ordered and reliable delivery of row-level changes to downstream systems. At the same time, it tightly couples the lifecycle of replication slots to database operations, making their management a critical consideration during database migrations.
A key challenge in migrating from RDS PostgreSQL to Aurora PostgreSQL is transitioning these CDC consumers safely — without data loss, stalled replication, or extended downtime — while ensuring that replication slots are correctly managed throughout the cutover process.
Each row-level change in PostgreSQL is emitted as a CDC event with an operation type of INSERT, UPDATE, DELETE, or REFRESH. REFRESH events are generated during backfills by querying the database directly and emitting the current state of rows in chunks. Downstream consumers are designed to be idempotent and eventually consistent, allowing them to safely process retries, replays, and backfills.
Handling Replication Slots During Migration
Before initiating database cutover, we temporarily pause CDC consumption by stopping the infrastructure responsible for consuming from PostgreSQL replication slots and writing into datamesh source. This also drops the replication slot from the database and cleans up our internal state around replication slot offsets. This essentially resets the state of the connector to one of a brand new one.
This step is critical for two reasons. First, it prevents replication slots from blocking WAL recycling during migration. Second, it ensures that no CDC consumers are left pointing at the source database once traffic is quiesced and cutover begins. While CDC consumers are paused, downstream systems temporarily stop receiving new change events, but remain stable. Once CDC consumers are paused, we proceed with stopping other client traffic and executing the RDS-to-Aurora cutover.
Reinitializing CDC After Cutover
After the Aurora PostgreSQL cluster has been promoted and traffic has been redirected, CDC consumers are reconfigured to point to the Aurora endpoint and restarted. Because their previous state was intentionally cleared, consumers initialize as if they are starting fresh.
On startup, new logical replication slots are created on Aurora, and a full backfill is performed by querying the database and emitting REFRESH events for all existing rows. These events let the consumer know that a manual refresh was done from Aurora and to treat this as an upsert operation. This establishes a clean and consistent baseline from which ongoing CDC can resume. Consumers are expected to handle these refresh events correctly as part of normal operation.
By explicitly managing PostgreSQL replication slots as part of the migration workflow, we are able to migrate CDC consumers safely and predictably, without leaving behind stalled slots, retained WAL, or consumers pointing to the wrong database. This approach allows CDC pipelines to be cleanly re-established on Aurora while preserving correctness and operational simplicity.
How do we roll back in the middle of the process?
Pre-quiescence Rolling back before the pre-quienscence phase is quite easy. Your primary RDS database is still the source. Rolling back before the quiescence phase is straightforward. At this stage, the primary RDS PostgreSQL instance continues to serve as the sole source of truth, and no client traffic has been redirected.
If a rollback is required, the migration can be safely aborted by deleting the newly created Aurora PostgreSQL cluster along with its associated parameter groups. No changes are needed on the application side, and normal operations on RDS PostgreSQL can continue without impact.
During-quiescence Rolling back during the quiescence phase is more involved. At this point, client traffic to the source RDS PostgreSQL instance has already been stopped by detaching its security groups. To roll back safely, access must first be restored by reattaching the original security groups to the RDS instance, allowing client connections to resume. In addition, any logical replication slots removed during the migration must be recreated so that CDC consumers can continue processing changes from the source database.
Once connectivity and replication slots are restored, the RDS PostgreSQL instance can safely resume its role as the primary source of truth.
Post-quiescence Rolling back after cutover, once the Aurora PostgreSQL cluster is serving production traffic, is significantly more complex. At this stage, Aurora has become the primary source of truth, and client applications may already have written new data to it.
In this scenario, rollback requires setting up replication in the opposite direction, with Aurora as the source and RDS PostgreSQL as the destination. This can be achieved using a service such as AWS Database Migration Service (DMS). AWS provides detailed guidance for setting up this reverse replication flow, which can be followed to migrate data back to RDS if necessary.
Conclusion
Standardizing and reducing the surface area of data technologies is crucial for any large-scale platform. For the Netflix platform team, this strategy allows us to concentrate engineering effort, deliver deeper value on a smaller set of well-understood systems, and significantly cut the operational overhead of running multiple database technologies that serve similar purposes. Within the relational database ecosystem, Aurora PostgreSQL has become the paved-path datastore — offering strong scalability, resilience, and consistent operational patterns across the fleet.
Migrations of this scale demand solutions that are reliable, low-touch, and minimally disruptive for service owners. Our automated RDS PostgreSQL → Aurora PostgreSQL workflow represents a major step forward, providing predictable cutovers, strong correctness guarantees, and a migration experience that works uniformly across diverse workloads.
As we continue this journey, the Relational Data Platform team is building higher-level abstractions and capabilities on top of Aurora, enabling service owners to focus less on the complexities of database internals and more on delivering product value. More to come — stay tuned.
Acknowledgements
Special thanks to our other stunning colleagues/customers who contributed to the success of the RDS PostgreSQL to Aurora PostgreSQL migration. Sumanth Pasupuleti, Cole Perez, Ammar Khaku
According to a survey done by W3Techs, as of October 2024, Cloudflare is used as an authoritative DNS provider by 14.5% of all websites. As an authoritative DNS provider, we are responsible for managing and serving all the DNS records for our clients’ domains. This means we have an enormous responsibility to provide the best service possible, starting at the data plane. As such, we are constantly investing in our infrastructure to ensure the reliability and performance of our systems.
DNS is often referred to as the phone book of the Internet, and is a key component of the Internet. If you have ever used a phone book, you know that they can become extremely large depending on the size of the physical area it covers. A zone file in DNS is no different from a phone book. It has a list of records that provide details about a domain, usually including critical information like what IP address(es) each hostname is associated with. For example:
example.com      59 IN A 198.51.100.0
blog.example.com 59 IN A 198.51.100.1
ask.example.com  59 IN A 198.51.100.2
It is not unusual for these zone files to reach millions of records in size, just for a single domain. The biggest single zone on Cloudflare holds roughly 4 million DNS records, but the vast majority of zones hold fewer than 100 DNS records. Given our scale according to W3Techs, you can imagine how much DNS data alone Cloudflare is responsible for. Given this volume of data, and all the complexities that come at that scale, there needs to be a very good reason to move it from one database cluster to another.
Why migrate
When initially measured in 2022, DNS data took up approximately 40% of the storage capacity in Cloudflare’s main database cluster (cfdb). This database cluster, consisting of a primary system and multiple replicas, is responsible for storing DNS zones, propagated to our data centers in over 330 cities via our distributed KV store Quicksilver. cfdb is accessed by most of Cloudflare’s APIs, including the DNS Records API. Today, the DNS Records API is the API most used by our customers, with each request resulting in a query to the database. As such, it’s always been important to optimize the DNS Records API and its surrounding infrastructure to ensure we can successfully serve every request that comes in.
As Cloudflare scaled, cfdb was becoming increasingly strained under the pressures of several services, many unrelated to DNS. During spikes of requests to our DNS systems, other Cloudflare services experienced degradation in the database performance. It was understood that in order to properly scale, we needed to optimize our database access and improve the systems that interact with it. However, it was evident that system level improvements could only be just so useful, and the growing pains were becoming unbearable. In late 2022, the DNS team decided, along with the help of 25 other teams, to detach itself from cfdb and move our DNS records data to another database cluster.
Pre-migration
From a DNS perspective, this migration to an improved database cluster was in the works for several years. Cloudflare initially relied on a single Postgres database cluster, cfdb. At Cloudflare’s inception, cfdb was responsible for storing information about zones and accounts and the majority of services on the Cloudflare control plane depended on it. Since around 2017, as Cloudflare grew, many services moved their data out of cfdb to be served by a microservice. Unfortunately, the difficulty of these migrations are directly proportional to the amount of services that depend on the data being migrated, and in this case, most services require knowledge of both zones and DNS records.
Although the term “zone” was born from the DNS point of view, it has since evolved into something more. Today, zones on Cloudflare store many different types of non-DNS related settings and help link several non-DNS related products to customers’ websites. Therefore, it didn’t make sense to move both zone data and DNS record data together. This separation of two historically tightly coupled DNS concepts proved to be an incredibly challenging problem, involving many engineers and systems. In addition, it was clear that if we were going to dedicate the resources to solving this problem, we should also remove some of the legacy issues that came along with the original solution.
One of the main issues with the legacy database was that the DNS team had little control over which systems accessed exactly what data and at what rate. Moving to a new database gave us the opportunity to create a more tightly controlled interface to the DNS data. This was manifested as an internal DNS Records gRPC API which allows us to make sweeping changes to our data while only requiring a single change to the API, rather than coordinating with other systems. For example, the DNS team can alter access logic and auditing procedures under the hood. In addition, it allows us to appropriately rate-limit and cache data depending on our needs. The move to this new API itself was no small feat, and with the help of several teams, we managed to migrate over 20 services, using 5 different programming languages, from direct database access to using our managed gRPC API. Many of these services touch very important areas such as DNSSEC, TLS, Email, Tunnels, Workers, Spectrum, and R2 storage. Therefore, it was important to get it right.
One of the last issues to tackle was the logical decoupling of common DNS database functions from zone data. Many of these functions expect to be able to access both DNS record data and DNS zone data at the same time. For example, at record creation time, our API needs to check that the zone is not over its maximum record allowance. Originally this check occurred at the SQL level by verifying that the record count was lower than the record limit for the zone. However, once you remove access to the zone itself, you are no longer able to confirm this. Our DNS Records API also made use of SQL functions to audit record changes, which requires access to both DNS record and zone data. Luckily, over the past several years, we have migrated this functionality out of our monolithic API and into separate microservices. This allowed us to move the auditing and zone setting logic to the application level rather than the database level. Ultimately, we are still taking advantage of SQL functions in the new database cluster, but they are fully independent of any other legacy systems, and are able to take advantage of the latest Postgres version.
Now that Cloudflare DNS was mostly decoupled from the zones database, it was time to proceed with the data migration. For this, we built what would become our Change Data Capture and Transfer Service (CDCTS).
Requirements for the Change Data Capture and Transfer Service
The Database team is responsible for all Postgres clusters within Cloudflare, and were tasked with executing the data migration of two tables that store DNS data: cf_rec and cf_archived_rec, from the original cfdb cluster to a new cluster we called dnsdb. We had several key requirements that drove our design:
Don’t lose data. This is the number one priority when handling any sort of data. Losing data means losing trust, and it is incredibly difficult to regain that trust once it’s lost. Important in this is the ability to prove no data had been lost. The migration process would, ideally, be easily auditable.
Minimize downtime. We wanted a solution with less than a minute of downtime during the migration, and ideally with just a few seconds of delay.
These two requirements meant that we had to be able to migrate data changes in near real-time, meaning we either needed to implement logical replication, or some custom method to capture changes, migrate them, and apply them in a table in a separate Postgres cluster.
We first looked at using Postgres logical replication using pgLogical, but had concerns about its performance and our ability to audit its correctness. Then some additional requirements emerged that made a pgLogical implementation of logical replication impossible:
The ability to move data must be bidirectional. We had to have the ability to switch back to cfdb without significant downtime in case of unforeseen problems with the new implementation.
Partition the cf_rec table in the new database. This was a long-desired improvement and since most access to cf_rec is by zone_id, it was decided that mod(zone_id, num_partitions) would be the partition key.
Transferred data accessible from original database. In case we had functionality that still needed access to data, a foreign table pointing to dnsdb would be available in cfdb. This could be used as emergency access to avoid needing to roll back the entire migration for a single missed process.
Only allow writes in one database. Applications should know where the primary database is, and should be blocked from writing to both databases at the same time.
Details about the tables being migrated
The primary table, cf_rec, stores DNS record information, and its rows are regularly inserted, updated, and deleted. At the time of the migration, this table had 1.7 billion records, and with several indexes took up 1.5 TB of disk. Typical daily usage would observe 3-5 million inserts, 1 million updates, and 3-5 million deletes.
The second table, cf_archived_rec, stores copies of cf_rec that are obsolete — this table generally only has records inserted and is never updated or deleted. As such, it would see roughly 3-5 million inserts per day, corresponding to the records deleted from cf_rec. At the time of the migration, this table had roughly 4.3 billion records.
Fortunately, neither table made use of database triggers or foreign keys, which meant that we could insert/update/delete records in this table without triggering changes or worrying about dependencies on other tables.
Ultimately, both of these tables are highly active and are the source of truth for many highly critical systems at Cloudflare.
Designing the Change Data Capture and Transfer Service
There were two main parts to this database migration:
Initial copy: Take all the data from cfdb and put it in dnsdb.
Change copy: Take all the changes in cfdb since the initial copy and update dnsdb to reflect them. This is the more involved part of the process.
Normally, logical replication replays every insert, update, and delete on a copy of the data in the same transaction order, making a single-threaded pipeline. We considered using a queue-based system but again, speed and auditability were both concerns as any queue would typically replay one change at a time. We wanted to be able to apply large sets of changes, so that after an initial dump and restore, we could quickly catch up with the changed data. For the rest of the blog, we will only speak about cf_rec for simplicity, but the process for cf_archived_rec is the same.
What we decided on was a simple change capture table. Rows from this capture table would be loaded in real-time by a database trigger, with a transfer service that could migrate and apply thousands of changed records to dnsdb in each batch. Lastly, we added some auditing logic on top to ensure that we could easily verify that all data was safely transferred without downtime.
Basic model of change data capture
For cf_rec to be migrated, we would create a change logging table, along with a trigger function and a table trigger to capture the new state of the record after any insert/update/delete.
The change logging table named log_cf_rec had the same columns as cf_rec, as well as four new columns:
change_id: a sequence generated unique identifier of the record
action: a single character indicating whether this record represents an [i]nsert, [u]pdate, or [d]elete
change_timestamp: the date/time when the change record was created
change_user: the database user that made the change.
A trigger was placed on the cf_rec table so that each insert/update would copy the new values of the record into the change table, and for deletes, create a ‘D’ record with the primary key value.
Here is an example of the change logging where we delete, re-insert, update, and finally select from the log_cf_rectable. Note that the actual cf_rec and log_cf_rec tables have many more columns, but have been edited for simplicity.
dns_records=# DELETE FROM  cf_rec WHERE rec_id = 13;

dns_records=# SELECT * from log_cf_rec;
Change_id | action | rec_id | zone_id | name
----------------------------------------------
1         | D      | 13     |         |

dns_records=# INSERT INTO cf_rec VALUES(13,299,'cloudflare.example.com');

dns_records=# UPDATE cf_rec SET name = 'test.example.com' WHERE rec_id = 13;

dns_records=# SELECT * from log_cf_rec;
Change_id | action | rec_id | zone_id | name
----------------------------------------------
1         | D      | 13     |         |
2         | I      | 13     | 299     | cloudflare.example.com
3         | U      | 13     | 299     | test.example.com
In addition to log_cf_rec, we also introduced 2 more tables in cfdb and 3 more tables in dnsdb:
cfdb
transferred_log_cf_rec: Responsible for auditing the batches transferred to dnsdb.
log_change_action:Responsible for summarizing the transfer size in order to compare with the log_change_action in dnsdb.
dnsdb
migrate_log_cf_rec:Responsible for collecting batch changes in dnsdb, which would later be applied to cf_rec in dnsdb.
applied_migrate_log_cf_rec:Responsible for auditing the batches that had been successfully applied to cf_rec in dnsdb.
log_change_action:Responsible for summarizing the transfer size in order to compare with the log_change_action in cfdb.
Initial copy
With change logging in place, we were now ready to do the initial copy of the tables from cfdb to dnsdb. Because we were changing the structure of the tables in the destination database and because of network timeouts, we wanted to bring the data over in small pieces and validate that it was brought over accurately, rather than doing a single multi-hour copy or pg_dump. We also wanted to ensure a long-running read could not impact production and that the process could be paused and resumed at any time. The basic model to transfer data was done with a simple psql copy statement piped into another psql copy statement. No intermediate files were used.
psql_cfdb -c "COPY (SELECT * FROM cf_rec WHERE id BETWEEN n and n+1000000 TO STDOUT)" |
psql_dnsdb -c "COPY cf_rec FROM STDIN"
Prior to a batch being moved, the count of records to be moved was recorded in cfdb, and after each batch was moved, a count was recorded in dnsdb and compared to the count in cfdb to ensure that a network interruption or other unforeseen error did not cause data to be lost. The bash script to copy data looked like this, where we included files that could be touched to pause or end the copy (if they cause load on production or there was an incident). Once again, this code below has been heavily simplified.
#!/bin/bash
for i in "$@"; do
   # Allow user to control whether this is paused or not via pause_copy file
   while [ -f pause_copy ]; do
      sleep 1
   done
   # Allow user to end migration by creating end_copy file
   if [ ! -f end_copy ]; then
      # Copy a batch of records from cfdb to dnsdb
      # Get count of records from cfdb
	# Get count of records from dnsdb
 	# Compare cfdb count with dnsdb count and alert if different
   fi
done
Bash copy script
Change copy
Once the initial copy was completed, we needed to update dnsdb with any changes that had occurred in cfdb since the start of the initial copy. To implement this change copy, we created a function fn_log_change_transfer_log_cf_rec that could be passed a batch_id and batch_size, and did 5 things, all of which were executed in a single database transaction:
Select a batch_size of records from log_cf_rec in cfdb.
Copy the batch to transferred_log_cf_rec in cfdb to mark it as transferred.
Delete the batch from log_cf_rec.
Write a summary of the action to log_change_action table. This will later be used to compare transferred records with cfdb.
Return the batch of records.
We then took the returned batch of records and copied them to migrate_log_cf_rec in dnsdb. We used the same bash script as above, except this time, the copy command looked like this:
psql_cfdb -c "COPY (SELECT * FROM fn_log_change_transfer_log_cf_rec(<batch_id>,<batch_size>) TO STDOUT" |
psql_dnsdb -c "COPY migrate_log_cf_rec FROM STDIN"
Applying changes in the destination database
Now, with a batch of data in the migrate_log_cf_rec table, we called a newly created function log_change_apply to apply and audit the changes. Once again, this was all executed within a single database transaction. The function did the following:
Move a batch from the migrate_log_cf_rec table to a new temporary table.
Write the counts for the batch_id to the log_change_action table.
Delete from the temporary table all but the latest record for a unique id (last action). For example, an insert followed by 30 updates would have a single record left, the final update. There is no need to apply all the intermediate updates.
Delete any record from cf_rec that has any corresponding changes.
Insert any [i]nsert or [u]pdate records in cf_rec.
Copy the batch to applied_migrate_log_cf_rec for a full audit trail.
Putting it all together
There were 4 distinct phases, each of which was part of a different database transaction:
Call fn_log_change_transfer_log_cf_rec in cfdb to get a batch of records.
Copy the batch of records to dnsdb.
Call log_change_apply in dnsdb to apply the batch of records.
Compare the log_change_action table in each respective database to ensure counts match.
This process was run every 3 seconds for several weeks before the migration to ensure that we could keep dnsdb in sync with cfdb.
Managing which database is live
The last major pre-migration task was the construction of the request locking system that would be used throughout the actual migration. The aim was to create a system that would allow the database to communicate with the DNS Records API, to allow the DNS Records API to handle HTTP connections more gracefully. If done correctly, this could reduce downtime for DNS Record API users to nearly zero.
In order to facilitate this, a new table called cf_migration_manager was created. The table would be periodically polled by the DNS Records API, communicating two critical pieces of information:
Which database was active. Here we just used a simple A or B naming convention.
If the database was locked for writing. In the event the database was locked for writing, the DNS Records API would hold HTTP requests until the lock was released by the database.
Both pieces of information would be controlled within a migration manager script.
The benefit of migrating the 20+ internal services from direct database access to using our internal DNS Records gRPC API is that we were able to control access to the database to ensure that no one else would be writing without going through the cf_migration_manager.
During the migration
Although we aimed to complete this migration in a matter of seconds, we announced a DNS maintenance window that could last a couple of hours just to be safe. Now that everything was set up, and both cfdb and dnsdb were roughly in sync, it was time to proceed with the migration. The steps were as follows:
Lower the time between copies from 3s to 0.5s.
Lock cfdb for writes via cf_migration_manager. This would tell the DNS Records API to hold write connections.
Make cfdb read-only and migrate the last logged changes to dnsdb.
Enable writes to dnsdb.
Tell DNS Records API that dnsdb is the new primary database and that write connections can proceed via the cf_migration_manager.
Since we needed to ensure that the last changes were copied to dnsdb before enabling writing, this entire process took no more than 2 seconds. During the migration we saw a spike of API latency as a result of the migration manager locking writes, and then dealing with a backlog of queries. However, we recovered back to normal latencies after several minutes.
DNS Records API Latency and Requests during migration
Unfortunately, due to the far-reaching impact that DNS has at Cloudflare, this was not the end of the migration. There were 3 lesser-used services that had slipped by in our scan of services accessing DNS records via cfdb. Fortunately, the setup of the foreign table meant that we could very quickly fix any residual issues by simply changing the table name.
Post-migration
Almost immediately, as expected, we saw a steep drop in usage across cfdb. This freed up a lot of resources for other services to take advantage of.
cfdb usage dropped significantly after the migration period.
Since the migration, the average requests per second to the DNS Records API has more than doubled. At the same time, our CPU usage across both cfdb and dnsdb has settled at below 10% as seen below, giving us room for spikes and future growth.
cfdb and dnsdb CPU usage now
As a result of this improved capacity, our database-related incident rate dropped dramatically.
As for query latencies, our latency post-migration is slightly lower on average, with fewer sustained spikes above 500ms. However, the performance improvement is largely noticed during high load periods, when our database handles spikes without significant issues. Many of these spikes come as a result of clients making calls to collect a large amount of DNS records or making several changes to their zone in short bursts. Both of these actions are common use cases for large customers onboarding zones.
In addition to these improvements, the DNS team also has more granular control over dnsdb cluster-specific settings that can be tweaked for our needs rather than catering to all the other services. For example, we were able to make custom changes to replication lag limits to ensure that services using replicas were able to read with some amount of certainty that the data would exist in a consistent form. Measures like this reduce overall load on the primary because almost all read queries can now go to the replicas.
Although this migration was a resounding success, we are always working to improve our systems. As we grow, so do our customers, which means the need to scale never really ends. We have more exciting improvements on the roadmap, and we are looking forward to sharing more details in the future.
The DNS team at Cloudflare isn’t the only team solving challenging problems like the one above. If this sounds interesting to you, we have many more tech deep dives on our blog, and we are always looking for curious engineers to join our team — see open opportunities here.
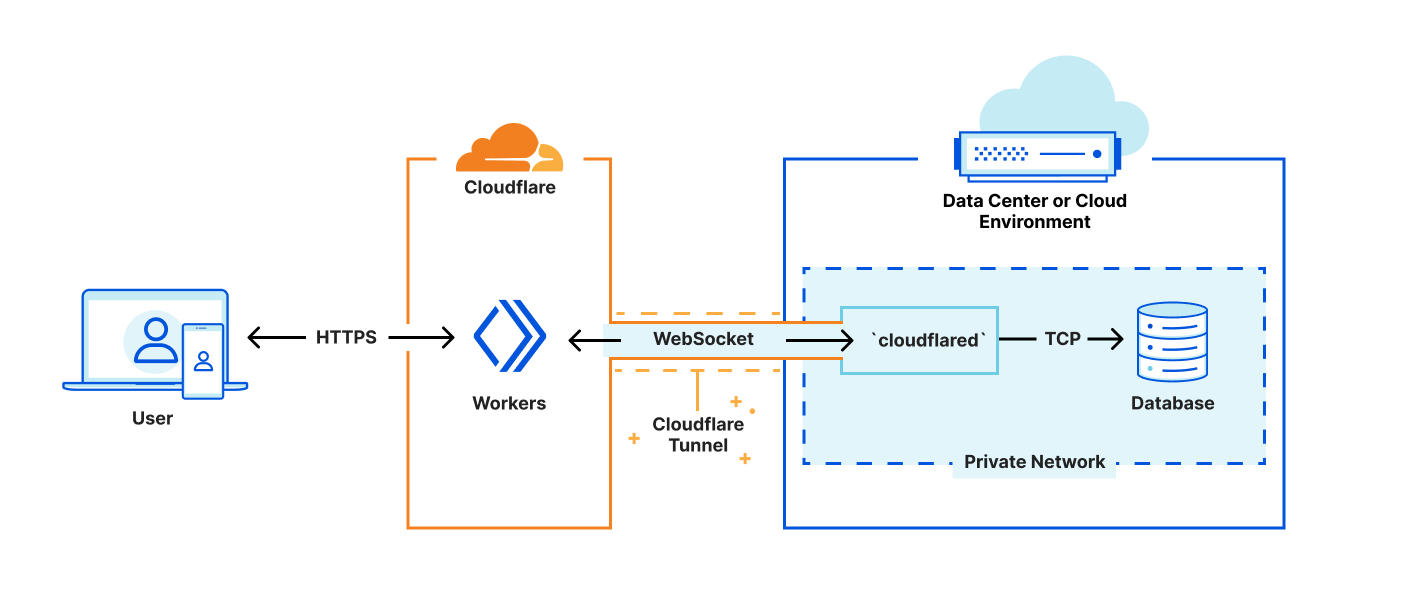
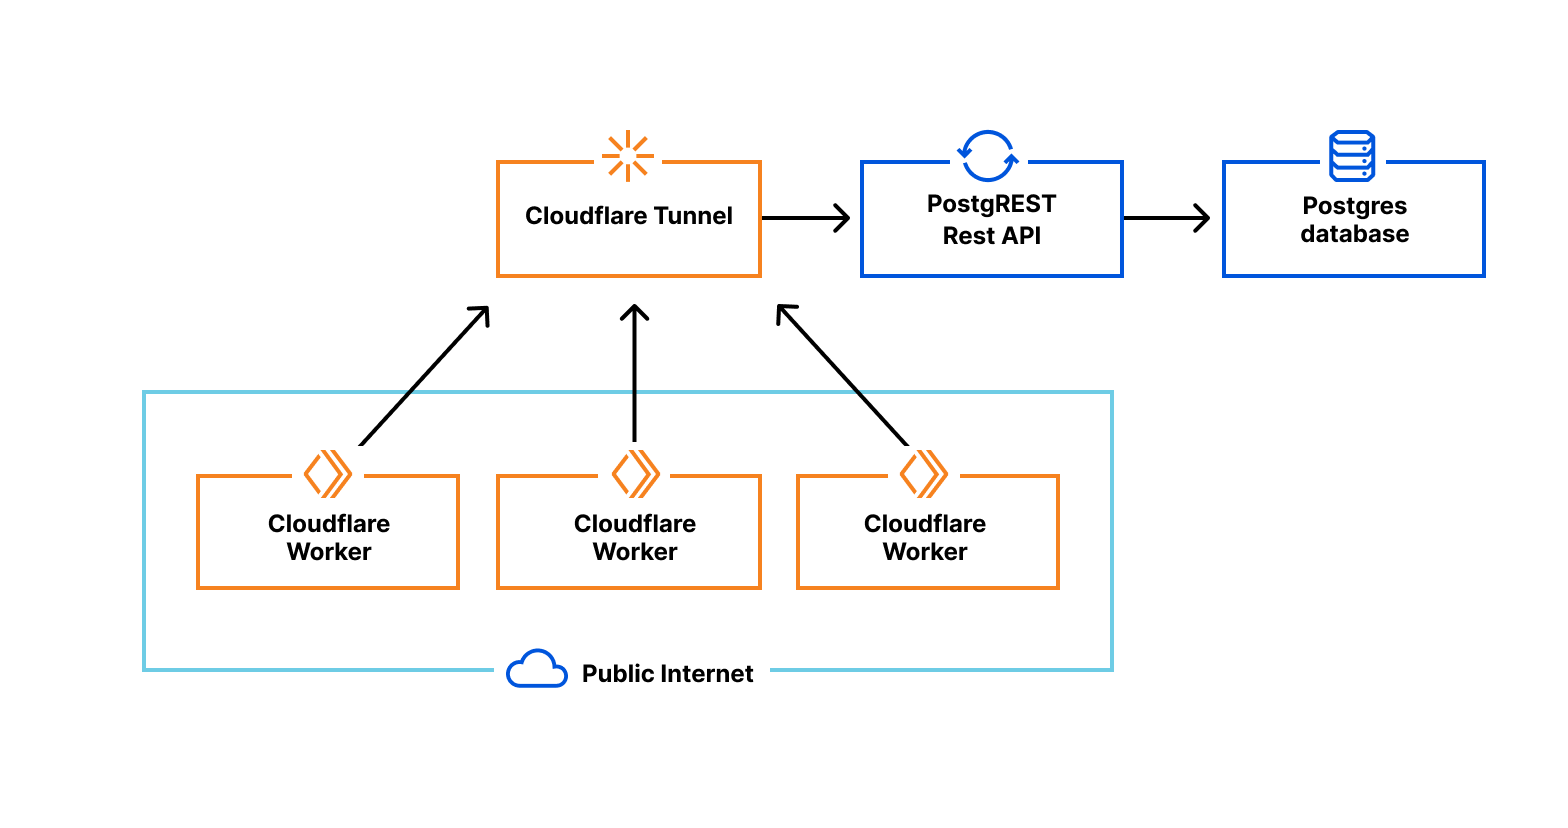
With September’s announcement of Hyperdrive’s ability to send database traffic from Workers over Cloudflare Tunnels, we wanted to dive into the details of what it took to make this happen.
Hyper-who?
Accessing your data from anywhere in Region Earth can be hard. Traditional databases are powerful, familiar, and feature-rich, but your users can be thousands of miles away from your database. This can cause slower connection startup times, slower queries, and connection exhaustion as everything takes longer to accomplish.
Cloudflare Workers is an incredibly lightweight runtime, which enables our customers to deploy their applications globally by default and renders the cold start problem almost irrelevant. The trade-off for these light, ephemeral execution contexts is the lack of persistence for things like database connections. Database connections are also notoriously expensive to spin up, with many round trips required between client and server before any query or result bytes can be exchanged.
Hyperdrive is designed to make the centralized databases you already have feel like they’re global while keeping connections to those databases hot. We use our global network to get faster routes to your database, keep connection pools primed, and cache your most frequently run queries as close to users as possible.
Why a Tunnel?
For something as sensitive as your database, exposing access to the public Internet can be uncomfortable. It is common to instead host your database on a private network, and allowlist known-safe IP addresses or configure GRE tunnels to permit traffic to it. This is complex, toilsome, and error-prone.
On Cloudflare’s Developer Platform, we strive for simplicity and ease-of-use. We cannot expect all of our customers to be experts in configuring networking solutions, and so we went in search of a simpler solution. Being your own customer is rarely a bad choice, and it so happens that Cloudflare offers an excellent option for this scenario: Tunnels.
Integrating with Tunnels to support sending Postgres directly through them was a bit of a new challenge for us. Most of the time, when we use Tunnels internally (more on that later!), we rely on the excellent job cloudflared does of handling all of the mechanics, and we just treat them as pipes. That wouldn’t work for Hyperdrive, though, so we had to dig into how Tunnels actually ingress traffic to build a solution.
Hyperdrive handles Postgres traffic using an entirely custom implementation of the Postgres message protocol. This is necessary, because we sometimes have to alter the specific type or content of messages sent from client to server, or vice versa. Handling individual bytes gives us the flexibility to implement whatever logic any new feature might need.
An additional, perhaps less obvious, benefit of handling Postgres message traffic as just bytes is that we are not bound to the transport layer choices of some ORM or library. One of the nuances of running services in Cloudflare is that we may want to egress traffic over different services or protocols, for a variety of different reasons. In this case, being able to egress traffic via a Tunnel would be pretty challenging if we were stuck with whatever raw TCP socket a library had established for us.
The way we accomplish this relies on a mainstay of Rust: traits (which are how Rust lets developers apply logic across generic functions and types). In the Rust ecosystem, there are two traits that define the behavior Hyperdrive wants out of its transport layers: AsyncRead and AsyncWrite. There are a couple of others we also need, but we’re going to focus on just these two. These traits enable us to code our entire custom handler against a generic stream of data, without the handler needing to know anything about the underlying protocol used to implement the stream. So, we can pass around a WebSocket connection as a generic I/O stream, wherever it might be needed.
As an example, the code to create a generic TCP stream and send a Postgres startup message across it might look like this:
/// Send a startup message to a Postgres server, in the role of a PG client.
/// https://www.postgresql.org/docs/current/protocol-message-formats.html#PROTOCOL-MESSAGE-FORMATS-STARTUPMESSAGE
pub async fn send_startup<S>(stream: &mut S, user_name: &str, db_name: &str, app_name: &str) -> Result<(), ConnectionError>
where
    S: AsyncWrite + Unpin,
{
    let protocol_number = 196608 as i32;
    let user_str = &b"user\0"[..];
    let user_bytes = user_name.as_bytes();
    let db_str = &b"database\0"[..];
    let db_bytes = db_name.as_bytes();
    let app_str = &b"application_name\0"[..];
    let app_bytes = app_name.as_bytes();
    let len = 4 + 4
        + user_str.len() + user_bytes.len() + 1
        + db_str.len() + db_bytes.len() + 1
        + app_str.len() + app_bytes.len() + 1 + 1;

    // Construct a BytesMut of our startup message, then send it
    let mut startup_message = BytesMut::with_capacity(len as usize);
    startup_message.put_i32(len as i32);
    startup_message.put_i32(protocol_number);
    startup_message.put(user_str);
    startup_message.put_slice(user_bytes);
    startup_message.put_u8(0);
    startup_message.put(db_str);
    startup_message.put_slice(db_bytes);
    startup_message.put_u8(0);
    startup_message.put(app_str);
    startup_message.put_slice(app_bytes);
    startup_message.put_u8(0);
    startup_message.put_u8(0);

    match stream.write_all(&startup_message).await {
        Ok(_) => Ok(()),
        Err(err) => {
            error!("Error writing startup to server: {}", err.to_string());
            ConnectionError::InternalError
        }
    }
}

/// Connect to a TCP socket
let stream = match TcpStream::connect(("localhost", 5432)).await {
    Ok(s) => s,
    Err(err) => {
        error!("Error connecting to address: {}", err.to_string());
        return ConnectionError::InternalError;
    }
};
let _ = send_startup(&mut stream, "db_user", "my_db").await;
With this approach, if we wanted to encrypt the stream using TLS before we write to it (upgrading our existing TcpStream connection in-place, to an SslStream), we would only have to change the code we use to create the stream, while generating and sending the traffic would remain unchanged. This is because SslStream also implements AsyncWrite!
/// We're handwaving the SSL setup here. You're welcome.
let conn_config = new_tls_client_config()?;

/// Encrypt the TcpStream, returning an SslStream
let ssl_stream = match tokio_boring::connect(conn_config, domain, stream).await {
    Ok(s) => s,
    Err(err) => {
        error!("Error during websocket TLS handshake: {}", err.to_string());
        return ConnectionError::InternalError;
    }
};
let _ = send_startup(&mut ssl_stream, "db_user", "my_db").await;
Whence WebSocket
WebSocket is an application layer protocol that enables bidirectional communication between a client and server. Typically, to establish a WebSocket connection, a client initiates an HTTP request and indicates they wish to upgrade the connection to WebSocket via the “Upgrade” header. Then, once the client and server complete the handshake, both parties can send messages over the connection until one of them terminates it.
Now, it turns out that the way Cloudflare Tunnels work under the hood is that both ends of the tunnel want to speak WebSocket, and rely on a translation layer to convert all traffic to or from WebSocket. The cloudflared daemon you spin up within your private network handles this for us! For Hyperdrive, however, we did not have a suitable translation layer to send Postgres messages across WebSocket, and had to write one.
One of the (many) fantastic things about Rust traits is that the contract they present is very clear. To be AsyncRead, you just need to implement poll_read. To be AsyncWrite, you need to implement only three functions (poll_write, poll_flush, and poll_shutdown). Further, there is excellent support for WebSocket in Rust built on top of the tungstenite-rs library.
Thus, building our custom WebSocket stream such that it can share the same machinery as all our other generic streams just means translating the existing WebSocket support into these poll functions. There are some existing OSS projects that do this, but for multiple reasons we could not use the existing options. The primary reason is that Hyperdrive operates across multiple threads (thanks to the tokio runtime), and so we rely on our connections to also handle Send, Sync, and Unpin. None of the available solutions had all five traits handled. It turns out that most of them went with the paradigm of Sink and Stream, which provide a solid base from which to translate to AsyncRead and AsyncWrite. In fact some of the functions overlap, and can be passed through almost unchanged. For example, poll_flush and poll_shutdown have 1-to-1 analogs, and require almost no engineering effort to convert from Sink to AsyncWrite.
/// We use this struct to implement the traits we need on top of a WebSocketStream
pub struct HyperSocket<S>
where
    S: AsyncRead + AsyncWrite + Send + Sync + Unpin,
{
    inner: WebSocketStream<S>,
    read_state: Option<ReadState>,
    write_err: Option<Error>,
}

impl<S> AsyncWrite for HyperSocket<S>
where
    S: AsyncRead + AsyncWrite + Send + Sync + Unpin,
{
    fn poll_flush(mut self: Pin<&mut Self>, cx: &mut Context<'_>) -> Poll<io::Result<()>> {
        match ready!(Pin::new(&mut self.inner).poll_flush(cx)) {
            Ok(_) => Poll::Ready(Ok(())),
            Err(err) => Poll::Ready(Err(Error::new(ErrorKind::Other, err))),
        }
    }

    fn poll_shutdown(mut self: Pin<&mut Self>, cx: &mut Context<'_>) -> Poll<io::Result<()>> {
        match ready!(Pin::new(&mut self.inner).poll_close(cx)) {
            Ok(_) => Poll::Ready(Ok(())),
            Err(err) => Poll::Ready(Err(Error::new(ErrorKind::Other, err))),
        }
    }
}
With that translation done, we can use an existing WebSocket library to upgrade our SslStream connection to a Cloudflare Tunnel, and wrap the result in our AsyncRead/AsyncWrite implementation. The result can then be used anywhere that our other transport streams would work, without any changes needed to the rest of our codebase!
That would look something like this:
let websocket = match tokio_tungstenite::client_async(request, ssl_stream).await {
    Ok(ws) => Ok(ws),
    Err(err) => {
        error!("Error during websocket conn setup: {}", err.to_string());
        return ConnectionError::InternalError;
    }
};
let websocket_stream = HyperSocket::new(websocket));
let _ = send_startup(&mut websocket_stream, "db_user", "my_db").await;
Access granted
An observant reader might have noticed that in the code example above we snuck in a variable named request that we passed in when upgrading from an SslStream to a WebSocketStream. This is for multiple reasons. The first reason is that Tunnels are assigned a hostname and use this hostname for routing. The second and more interesting reason is that (as mentioned above) when negotiating an upgrade from HTTP to WebSocket, a request must be sent to the server hosting the ingress side of the Tunnel to perform the upgrade. This is pretty universal, but we also add in an extra piece here.
At Cloudflare, we believe that secure defaults and defense in depth are the correct ways to build a better Internet. This is why traffic across Tunnels is encrypted, for example. However, that does not necessarily prevent unwanted traffic from being sent into your Tunnel, and therefore egressing out to your database. While Postgres offers a robust set of access control options for protecting your database, wouldn’t it be best if unwanted traffic never got into your private network in the first place?
To that end, all Tunnels set up for use with Hyperdrive should have a Zero Trust Access Application configured to protect them. These applications should use a Service Token to authorize connections. When setting up a new Hyperdrive, you have the option to provide the token’s ID and Secret, which will be encrypted and stored alongside the rest of your configuration. These will be presented as part of the WebSocket upgrade request to authorize the connection, allowing your database traffic through while preventing unwanted access.
This can be done within the request’s headers, and might look something like this:
let ws_url = format!("wss://{}", host);
let mut request = match ws_url.into_client_request() {
    Ok(req) => req,
    Err(err) => {
        error!(
            "Hostname {} could not be parsed into a valid request URL: {}",
            host,
            err.to_string()
        );
        return ConnectionError::InternalError;
    }
};
request.headers_mut().insert(
    "CF-Access-Client-Id",
    http::header::HeaderValue::from_str(&client_id).unwrap(),
);
request.headers_mut().insert(
    "CF-Access-Client-Secret",
    http::header::HeaderValue::from_str(&client_secret).unwrap(),
);
Building for customer zero
If you’ve been reading the blog for a long time, some of this might sound a bit familiar. This isn’t the first time that we’ve sent Postgres traffic across a tunnel, it’s something most of us do from our laptops regularly. This works very well for interactive use cases with low traffic volume and a high tolerance for latency, but historically most of our products have not been able to employ the same approach.
Cloudflare operates many data centers around the world, and most services run in every one of those data centers. There are some tasks, however, that make the most sense to run in a more centralized fashion. These include tasks such as managing control plane operations, or storing configuration state. Nearly every Cloudflare product houses its control plane information in Postgres clusters run centrally in a handful of our data centers, and we use a variety of approaches for accessing that centralized data from elsewhere in our network. For example, many services currently use a push-based model to publish updates to Quicksilver, and work through the complexities implied by such a model. This has been a recurring challenge for any team looking to build a new product.
Hyperdrive’s entire reason for being is to make it easy to access such central databases from our global network. When we began exploring Tunnel integrations as a feature, many internal teams spoke up immediately and strongly suggested they’d be interested in using it themselves. This was an excellent opportunity for Cloudflare to scratch its own itch, while also getting a lot of traffic on a new feature before releasing it directly to the public. As always, being “customer zero” means that we get fast feedback, more reliability over time, stronger connections between teams, and an overall better suite of products. We jumped at the chance.
As we rolled out early versions of Tunnel integration, we worked closely with internal teams to get them access to it, and fixed any rough spots they encountered. We’re pleased to share that this first batch of teams have found great success building new or refactored products on Hyperdrive over Tunnels. For example: if you’ve already tried out Workers Builds, or recently submitted an abuse report, you’re among our first users! At the time of this writing, we have several more internal teams working to onboard, and we on the Hyperdrive team are very excited to see all the different ways in which fast and simple connections from Workers to a centralized database can help Cloudflare just as much as they’ve been helping our external customers.
Outro
Cloudflare is on a mission to make the Internet faster, safer, and more reliable. Hyperdrive was built to make connecting to centralized databases from the Workers runtime as quick and consistent as possible, and this latest development is designed to help all those who want to use Hyperdrive without directly exposing resources within their virtual private clouds (VPCs) on the public web.
To this end, we chose to build a solution around our suite of industry-leading Zero Trust tools, and were delighted to find how simple it was to implement in our runtime given the power and extensibility of the Rust trait system.
Without waiting for the ink to dry, multiple teams within Cloudflare have adopted this new feature to quickly and easily solve what have historically been complex challenges, and are happily operating it in production today.
Hyperdrive (Cloudflare’s globally distributed SQL connection pooler and cache) recently added support for Postgres protocol-level named prepared statements across pooled connections. Named prepared statements allow Postgres to cache query execution plans, providing potentially substantial performance improvements. Further, many popular drivers in the ecosystem use these by default, meaning that not having them is a bit of a footgun for developers. We are very excited that Hyperdrive’s users will now have access to better performance and a more seamless development experience, without needing to make any significant changes to their applications!
While we’re not the first connection pooler to add this support (PgBouncer got to it in October 2023 in version 1.21, for example), there were some unique challenges in how we implemented it. To that end, we wanted to do a deep dive on what it took for us to deliver this.
Hyper-what?
One of the classic problems of building on the web is that your users are everywhere, but your database tends to be in one spot. Combine that with pesky limitations like network routing, or the speed of light, and you can often run into situations where your users feel the pain of having your database so far away. This can look like slower queries, slower startup times, and connection exhaustion as everything takes longer to accomplish.
Hyperdrive is designed to make the centralized databases you already have feel like they’re global. We use our global network to get faster routes to your database, keep connection pools primed, and cache your most frequently run queries as close to users as possible.
Postgres Message Protocol
To understand exactly what the challenge with prepared statements is, it’s first necessary to dig in a bit to the Postgres Message Protocol. Specifically, we are going to take a look at the protocol for an “extended” query, which uses different message types and is a bit more complex than a “simple” query, but which is more powerful and thus more widely used.
A query using Hyperdrive might be coded something like this, but a lot goes on under the hood in order for Postgres to reliably return your response.
import postgres from "postgres";

// with Hyperdrive, we don't have to disable prepared statements anymore!
// const sql = postgres(env.HYPERDRIVE.connectionString, {prepare: false});

// make a connection, with the default postgres.js settings (prepare is set to true)
const sql = postgres(env.HYPERDRIVE.connectionString);

// This sends the query, and while it looks like a single action it contains several
// messages implied within it
let [{ a, b, c, id }] = await sql`SELECT a, b, c, id FROM hyper_test WHERE id = ${target_id}`;
To prepare a statement, a Postgres client begins by sending a Parse message. This includes the query string, the number of parameters to be interpolated, and the statement’s name. The name is a key piece of this puzzle. If it is empty, then Postgres uses a special “unnamed” prepared statement slot that gets overwritten on each new Parse. These are relatively easy to support, as most drivers will keep the entirety of a message sequence for unnamed statements together, and will not try to get too aggressive about reusing the prepared statement because it is overwritten so often.
If the statement has a name, however, then it is kept prepared for the remainder of the Postgres session (unless it is explicitly removed with DEALLOCATE). This is convenient because parsing a query string and preparing the statement costs bytes sent on the wire and CPU cycles to process, so reusing a statement is quite a nice optimization.
Once done with Parse, there are a few remaining steps to (the simplest form of) an extended query:
A Bind message, which provides the specific values to be passed for the parameters in the statement (if any).
An Execute message, which tells the Postgres server to actually perform the data retrieval and processing.
And finally a Sync message, which causes the server to close the implicit transaction, return results, and provides a synchronization point for error handling.
While that is the core pattern for accomplishing an extended protocol query, there are many more complexities possible (named Portal, ErrorResponse, etc.).
We will briefly mention one other complexity we often encounter in this protocol, which is Describe messages. Many drivers leverage Postgres’ built-in types to help with deserialization of the results into structs or classes. This is accomplished by sending a Parse-Describe-Flush/Sync sequence, which will send a statement to be prepared, and will expect back information about the types and data the query will return. This complicates bookkeeping around named prepared statements, as now there are two separate queries, with two separate kinds of responses, that must be kept track of. We won’t go into much depth on the tradeoffs of an additional round-trip in exchange for advanced information about the results’ format, but suffice it to say that it must be handled explicitly in order for the overall system to gracefully support prepared statements.
So the basic query from our code above looks like this from a message perspective:
The first challenge that Hyperdrive must solve (that many other connection poolers don’t have) is that it’s also a cache.
The happiest path for a query on Hyperdrive never travels far, and we are quite proud of the low latency of our cache hits. However, this presents a particular challenge in the case of an extended protocol query. A Parse by itself is insufficient as a cache key, both because the parameter values in the Bind messages can alter the expected results, and because it might be followed up with either a Describe or an Execute message which will invoke drastically different responses.
So Hyperdrive cannot simply pass each message to the origin database, as we must buffer them in a message log until we have enough information to reliably distinguish between cache keys. It turns out that receiving a Sync is quite a natural point at which to check whether you have enough information to serve a response. For most scenarios, we buffer until we receive a Sync, and then (assuming the scenario is cacheable) we determine whether we can serve the response from cache or we need to take a connection to the origin database.
Taking a Connection From the Pool
Assuming we aren’t serving a response from cache, for whatever reason, we’ll need to take an origin connection from our pool. One of the key advantages any connection pooler offers is in allowing many client connections to share few database connections, so minimizing how often and for how long these connections are held is crucial to making Hyperdrive performant.
To this end, Hyperdrive operates in what is traditionally called “transaction mode”. This means that a connection taken from the pool for any given transaction is returned once that transaction concludes. This is in contrast to what is often called “session mode”, where once a connection is taken from the pool it is held by the client until the client disconnects.
For Hyperdrive, allowing any client to take any database connection is vital. This is because if we “pin” a client to a given database connection then we have one fewer available for every other possible client. You can run yourself out of database connections very quickly once you start down that path, especially when your clients are many small Workers spread around the world.
The challenge prepared statements present to this scenario is that they exist at the “session” scope, which is to say, at the scope of one connection. If a client prepares a statement on connection A, but tries to reuse it and gets assigned connection B, Postgres will naturally throw an error claiming the statement doesn’t exist in the given session. No results will be returned, the client is unhappy, and all that’s left is to retry with a Parse message included. This causes extra round-trips between client and server, defeating the whole purpose of what is meant to be an optimization.
One of the goals of a connection pooler is to be as transparent to the client and server as possible. There are limitations, as Postgres will let you do some powerful things to session state that cannot be reasonably shared across arbitrary client connections, but to the extent possible the endpoints should not have to know or care about any multiplexing happening between them.
This means that when a client sends a Parse message on its connection, it should expect that the statement will be available for reuse when it wants to send a Bind-Execute-Sync sequence later on. It also means that the server should not get Bind messages for statements that only exist on some other session. Maintaining this illusion is the crux of providing support for this feature.
Putting it all together
So, what does the solution look like? If a client sends Parse-Bind-Execute-Sync with a named prepared statement, then later sends Bind-Execute-Sync to reuse it, how can we make sure that everything happens as expected? The solution, it turns out, needs just a few built-in Rust data structures for efficiently capturing what we need (a HashMap, some LruCaches and a VecDeque), and some straightforward business logic to keep track of when to intervene in the messages being passed back and forth.
Whenever a named Parse comes in, we store it in an in-memory HashMap on the server that handles message processing for that client’s connection. This persists until the client is disconnected. This means that whenever we see anything referencing the statement, we can go retrieve the complete message defining it. We’ll come back to this in a moment.
Once we’ve buffered all the messages we can and gotten to the point where it’s time to return results (let’s say because the client sent a Sync), we need to start applying some logic. For the sake of brevity we’re going to omit talking through error handling here, as it does add some significant complexity but is somewhat out of scope for this discussion.
There are two main questions that determine how we should proceed:
Does our message sequence include a Parse, or are we trying to reuse a pre-existing statement?
Do we have a cache hit or are we serving from the origin database?
This gives us four scenarios to consider:
Parse with cache hit
Parse with cache miss
Reuse with cache hit
Reuse with cache miss
A Parse with a cache hit is the easiest path to address, as we don’t need to do anything special. We use the messages sent as a cache key, and serve the results back to the client. We will still keep the Parse in our HashMap in case we want it later (#2 below), but otherwise we’re good to go.
A Parse with a cache miss is a bit more complicated, as now we need to send these messages to the origin server. We take a connection at random from our pool and do so, passing the results back to the client. With that, we’ve begun to make changes to session state such that all our database connections are no longer identical to each other. To keep track of what we’ve done to muddy up our state, we keep a LruCache on each connection of which statements it already has prepared. In the case where we need to evict from such a cache, we will also DEALLOCATE the statement on the connection to keep things tracked correctly.
Reuse with a cache hit is yet more tricky, but still straightforward enough. In the example below, we are sent a Bind with the same parameters twice (#1 and #9). We must identify that we received a Bind without a preceding Parse, we must go retrieve that Parse (#10), and we must use the information from it to build our cache key. Once all that is accomplished, we can serve our results from cache, needing only to trim out the ParseComplete within the cached results before returning them to the client.
Reuse with a cache miss is the hardest scenario, as it may require us to lie in both directions. In the example below, we cache results for one set of parameters (#8), but are sent a Bind with different parameters (#9). As in the cache hit scenario, we must identify that we were not sent a Parse as part of the current message sequence, retrieve it from our HashMap (#10), and build our cache key to GET from cache and confirm the miss (#11). Once we take a connection from the pool, though, we then need to check if it already has the statement we want prepared. If not, we must take our saved Parse and prepend it to our message log to be sent along to the origin database (#13). Thus, what the server receives looks like a perfectly valid Parse-Bind-Execute-Sync sequence. This is where our VecDeque (mentioned above) comes in, as converting our message log to that structure allowed us to very ergonomically make such changes without needing to rebuild the whole byte sequence. Once we receive the response from the server, all that’s needed is to trim out the initial ParseComplete response from the server, as a well-made client would likely be very confused receiving such a response to a Parse it didn’t send. With that message trimmed out, however, the client is in the position of getting exactly what it asked for, and both sides of the conversation are happy.
Dénouement
Now that we’ve got a working solution, where all parties are functioning well, let’s review! Our solution lets us share database connections across arbitrary clients with no “pinning”, no custom handling on either client or server, and supports reuse of prepared statements to reduce CPU load on re-parsing queries and reduce network traffic on re-sending Parse messages. Engineering always involves tradeoffs, so the cost of this is that we will sometimes still need to sneak in a Parse because a client got assigned a different connection on reuse, and in those scenarios there is a small amount of additional memory overhead because the same statement is prepared on multiple connections.
At Cloudflare, we’re building the best compute platform in the world. We want to make it easy, seamless, and obvious to build your applications with us. But simply making the best compute platform is not enough — at the heart of your applications are the data they interact with.
Cloudflare has multiple data storage solutions available today: Workers KV, R2, and Durable Objects. All three follow Cloudflare’s design goals for Workers: global by default, infinitely scalable, and delightful for developers to use. We’ve partnered with third-party storage solutions like Fauna, MongoDB and Prisma, who have built data platforms that align beautifully with our design goals and written tutorials for databases that already support HTTP connections.
The one area that’s been sorely missed: relational databases. Cloudflare itself runs on relational databases, and we’re not alone. In April, we asked which Node libraries you wanted us to support, and four of the top five requests were related to databases. For this Full Stack Week, we asked ourselves: how could we support relational databases in a way that aligned with our design goals?
Today, we’re taking a first step towards that world by announcing support for relational databases, including Postgres and MySQL from Workers.
Connecting to a database is no simple task — if it were as easy as passing a connection string to a database driver, we would have already done it. We’ve had to overcome several hurdles to reach this point, and have several more still to conquer.
Our goal with this announcement is to work with you, our developers, to solve the unique pain points that come from accessing databases inside Workers. If you’d like to work with us, fill out this form or join us on Discord — this is just the beginning. If you’d just like to grab the code and play around, use this example to get started connecting to your own database, or check out our demo.
Why are Database Connectors so hard to build?
Serverless database connections are challenging to support for several reasons.
Databases are needy — they often require TCP connections, since they assume long-lived connections between an application server and the database. The Workers runtime doesn’t currently support TCP connections, so we’ve only been able to support HTTP-based databases or proxies.
Like a relationship, establishing a connection isn’t quite enough. Developers use client libraries for databases to make submitting queries and managing the responses easy. Since the Workers runtime is not entirely Node.js compatible, we need to either roll our own database library or find one that does not use unsupported built-in libraries.
Finally, databases are sensitive. It often takes external libraries to manage shared connections between an application server and a database, since these connections tend to be expensive to establish.
Moving past these challenges
Our approach today gives us the foundation to address each of these challenges in creative ways going forward.
First, we’re leveraging cloudflared to create a secure tunnel between Cloudflare and a private network within your existing infrastructure. Cloudflared already supports proxying HTTP to TCP over WebSockets — Our challenge is providing interfaces that look like the socket interfaces existing libraries expect, while rewiring the implementations to redirect reads and writes to our websocket. This method is fast, safe, and secure; but limiting in that we lack control of where to direct the final connections. This is a problem we will solve soon, but until then our approach is essential to gathering latency and performance data to see where else we need to improve.
Next, we’ve created a shim-layer that adapts the socket API from a popular runtime to connect directly to databases using a WebSocket. This allows us to bundle code as-is, without forking or otherwise making significant changes to the database library. As part of this announcement, we’ve published a tutorial on how to connect to and query a Postgres database from your Workers, using existing Cloudflare technology and a driver from the growing community at Deno. We’re excited to work with the upstream maintainers, on expanding support.
Finally, we’re most excited for how this approach will let us begin to manage connection pooling and connection establishment overhead. While our current tech demo requires setting up the Cloudflare Tunnel on your own infrastructure, we’re looking for customers who’d like to pilot a model where Cloudflare hosts the tunnel for you.
Where we’re going
We’re just getting started. Our goal with today’s announcement is to find customers who are looking to build new applications or migrate existing applications to Workers while working with data that’s stored in a relational database.
Just as Cloudflare started by providing security, performance, and reliability for customer’s websites, we’re excited about a future where Cloudflare manages database connections, handles replication of data across cloud providers and provides low-latency access to data globally.
First, we’re looking to add support for TCP into the runtime natively. With native support for TCP we’ll not only have better support for databases, but expand the Workers runtime to work with data infrastructure more broadly.
Our position in the network layer of the stack makes providing performance, security benefits and extremely reduced egress costs to global databases all possible realities. To do so, we’ll repurpose the HTTP to TCP proxy service that we’ve currently built and run it for developers as a connection pooling service, managing connections to their databases on their behalf.
Finally, our network makes caching data and making it accessible globally at low latency possible. Once we have connections back to your data, making it globally accessible in Cloudflare’s network will unlock fundamentally new architectures for distributed data.
Take our connectors for a spin
Want to check things out? There are three main steps to getting up-and-running:
Deploying cloudflared within your infrastructure.
Deploying a database that connects to cloudflared.
Deploying a Worker with the database driver that submits queries.
Postgres is a ubiquitous open-source database technology. It contains a vast number of features and offers rock-solid reliability. It’s also one of the most popular SQL database tools in the industry. As the industry builds “modern” developer experience tools—real-time and highly interactive—Postgres has also served as a great foundation. Projects like Hasura, which offers a real-time GraphQL engine, and Supabase, an open-source Firebase alternative, use Postgres under the hood. This makes Postgres a technology that every developer should know, and consider using in their applications.
For many developers, REST APIs serve as the primary way we interact with our data. Language-specific libraries like pg allow developers to connect with Postgres in their code, and directly interact with their databases. Yet in almost every case, developers reinvent the wheel, building the same connection logic on an app-by-app basis.
Many developers building applications with Cloudflare Workers, our serverless functions platform, have asked how they can use Postgres in Workers functions. Today, we’re releasing a new tutorial for Workers that shows how to connect to Postgres inside Workers functions. Built on PostgREST, you’ll write a REST API that communicates directly with your database, on the edge.
This means that you can entirely build applications on Cloudflare’s edge — using Workers as a performant and globally-distributed API, and Cloudflare Pages, our Jamstack deployment platform, as the host for your frontend user interface. With Workers, you can add new API endpoints and handle authentication in front of your database without needing to alter your Postgres configuration. With features like Workers KV and Durable Objects, Workers can provide globally-distributed caching in front of your Postgres database. Features like WebSockets can be used to build real-time interactions for your applications, without having to migrate from Postgres to a new database-as-a-service platform.
PostgREST is an open-source tool that generates a standards-compliant REST API for your Postgres databases. Many growing database-as-a-service startups like Retool and Supabase use PostgREST under the hood. PostgREST is fast and has great defaults, allowing you to access your Postgres data using standard REST conventions.
It’s great to be able to access your database directly from Workers, but do you really want to expose your database directly to the public Internet? Luckily, Cloudflare has a solution for this, and it works great with PostgREST: Cloudflare Tunnel. Cloudflare Tunnel is one of my personal favorite products at Cloudflare. It creates a secure tunnel between your local server and the Cloudflare network. We want to expose our PostgREST endpoint, without making our entire database available on the public internet. Cloudflare Tunnel allows us to do that securely.
By using PostgREST with Postgres, we can build REST API-based applications. In particular, it’s an excellent fit for Cloudflare Workers, our serverless function platform. Workers is a great place to build REST APIs. With the open-source JavaScript library postgrest-js, we can interact with a PostgREST endpoint from inside our Workers function, using simple JS-based primitives.
Scaling applications built on Postgres is an incredibly common problem that developers face. Often, this means duplicating your Postgres database and distributing reads between your primary database, and a fleet of “read replicas”. With PostgREST and Workers, we can begin to explore a different approach to solving the scaling problem. Workers’ unique architecture allows us to deploy hyper-performant functions in front of Postgres databases. With tools like Workers KV and Durable Objects, exposed in Workers as basic JavaScript APIs, we can build intelligent caches for our databases, without sacrificing performance or developer experience.
If you’d like to learn more about building REST APIs in Cloudflare Workers using PostgREST, check out our new tutorial! We’ve also provided two open-source libraries to help you get started. cloudflare/postgres-postgrest-cloudflared-example helps you set up a Cloudflare Tunnel-backed Postgres + PostgREST endpoint. postgrest-worker-example is an example of using postgrest-js inside of Cloudflare Workers, to build REST APIs with your Postgres databases.
With postgrest-js, you can build dynamic queries and request data from your database using the JS primitives you know and love:
// Get all users with at least 100 followers
const { data: users, error } = await client
.from('users')
.select(‘*’)
.gte('followers', 100)
You can also join our Cloudflare Developers Discord community! Learn more about what you can build with Cloudflare Workers, and meet our wonderful community of developers from around the world. Get your invite link here.
An analysis of the Cloudflare API availability incident on 2020-11-02
When we review design documents at Cloudflare, we are always on the lookout for Single Points of Failure (SPOFs). Eliminating these is a necessary step in architecting a system you can be confident in. Ironically, when you’re designing a system with built-in redundancy, you spend most of your time thinking about how well it functions when that redundancy is lost.
On November 2, 2020, Cloudflare had an incident that impacted the availability of the API and dashboard for six hours and 33 minutes. During this incident, the success rate for queries to our API periodically dipped as low as 75%, and the dashboard experience was as much as 80 times slower than normal. While Cloudflare’s edge is massively distributed across the world (and kept working without a hitch), Cloudflare’s control plane (API & dashboard) is made up of a large number of microservices that are redundant across two regions. For most services, the databases backing those microservices are only writable in one region at a time.
Each of Cloudflare’s control plane data centers has multiple racks of servers. Each of those racks has two switches that operate as a pair—both are normally active, but either can handle the load if the other fails. Cloudflare survives rack-level failures by spreading the most critical services across racks. Every piece of hardware has two or more power supplies with different power feeds. Every server that stores critical data uses RAID 10 redundant disks or storage systems that replicate data across at least three machines in different racks, or both. Redundancy at each layer is something we review and require. So—how could things go wrong?
In this post we present a timeline of what happened, and how a difficult failure mode known as a Byzantine fault played a role in a cascading series of events.
2020-11-02 14:43 UTC: Partial Switch Failure
At 14:43, a network switch started misbehaving. Alerts began firing about the switch being unreachable to pings. The device was in a partially operating state: network control plane protocols such as LACP and BGP remained operational, while others, such as vPC, were not. The vPC link is used to synchronize ports across multiple switches, so that they appear as one large, aggregated switch to servers connected to them. At the same time, the data plane (or forwarding plane) was not processing and forwarding all the packets received from connected devices.
This failure scenario is completely invisible to the connected nodes, as each server only sees an issue for some of its traffic due to the load-balancing nature of LACP. Had the switch failed fully, all traffic would have failed over to the peer switch, as the connected links would’ve simply gone down, and the ports would’ve dropped out of the forwarding LACP bundles.
Six minutes later, the switch recovered without human intervention. But this odd failure mode led to further problems that lasted long after the switch had returned to normal operation.
2020-11-02 14:44 UTC: etcd Errors begin
The rack with the misbehaving switch included one server in our etcd cluster. We use etcd heavily in our core data centers whenever we need strongly consistent data storage that’s reliable across multiple nodes.
In the event that the cluster leader fails, etcd uses the RAFT protocol to maintain consistency and establish consensus to promote a new leader. In the RAFT protocol, cluster members are assumed to be either available or unavailable, and to provide accurate information or none at all. This works fine when a machine crashes, but is not always able to handle situations where different members of the cluster have conflicting information.
In this particular situation:
Network traffic between node 1 (in the affected rack) and node 3 (the leader) was being sent through the switch in the degraded state,
Network traffic between node 1 and node 2 were going through its working peer, and
Network traffic between node 2 and node 3 was unaffected.
This caused cluster members to have conflicting views of reality, known in distributed systems theory as a Byzantine fault. As a consequence of this conflicting information, node 1 repeatedly initiated leader elections, voting for itself, while node 2 repeatedly voted for node 3, which it could still connect to. This resulted in ties that did not promote a leader node 1 could reach. RAFT leader elections are disruptive, blocking all writes until they’re resolved, so this made the cluster read-only until the faulty switch recovered and node 1 could once again reach node 3.
2020-11-02 14:45 UTC: Database system promotes a new primary database
Cloudflare’s control plane services use relational databases hosted across multiple clusters within a data center. Each cluster is configured for high availability. The cluster setup includes a primary database, a synchronous replica, and one or more asynchronous replicas. This setup allows redundancy within a data center. For cross-datacenter redundancy, a similar high availability secondary cluster is set up and replicated in a geographically dispersed data center for disaster recovery. The cluster management system leverages etcd for cluster member discovery and coordination.
When etcd became read-only, two clusters were unable to communicate that they had a healthy primary database. This triggered the automatic promotion of a synchronous database replica to become the new primary. This process happened automatically and without error or data loss.
There was a defect in our cluster management system that requires a rebuild of all database replicas when a new primary database is promoted. So, although the new primary database was available instantly, the replicas would take considerable time to become available, depending on the size of the database. For one of the clusters, service was restored quickly. Synchronous and asynchronous database replicas were rebuilt and started replicating successfully from primary, and the impact was minimal.
For the other cluster, however, performant operation of that database required a replica to be online. Because this database handles authentication for API calls and dashboard activities, it takes a lot of reads, and one replica was heavily utilized to spare the primary the load. When this failover happened and no replicas were available, the primary was overloaded, as it had to take all of the load. This is when the main impact started.
Reduce Load, Leverage Redundancy
At this point we saw that our primary authentication database was overwhelmed and began shedding load from it. We dialed back the rate at which we push SSL certificates to the edge, send emails, and other features, to give it space to handle the additional load. Unfortunately, because of its size, we knew it would take several hours for a replica to be fully rebuilt.
A silver lining here is that every database cluster in our primary data center also has online replicas in our secondary data center. Those replicas are not part of the local failover process, and were online and available throughout the incident. The process of steering read-queries to those replicas was not yet automated, so we manually diverted API traffic that could leverage those read replicas to the secondary data center. This substantially improved our API availability.
The Dashboard
The Cloudflare dashboard, like most web applications, has the notion of a user session. When user sessions are created (each time a user logs in) we perform some database operations and keep data in a Redis cluster for the duration of that user’s session. Unlike our API calls, our user sessions cannot currently be moved across the ocean without disruption. As we took actions to improve the availability of our API calls, we were unfortunately making the user experience on the dashboard worse.
This is an area of the system that is currently designed to be able to fail over across data centers in the event of a disaster, but has not yet been designed to work in both data centers at the same time. After a first period in which users on the dashboard became increasingly frustrated, we failed the authentication calls fully back to our primary data center, and kept working on our primary database to ensure we could provide the best service levels possible in that degraded state.
2020-11-02 21:20 UTC Database Replica Rebuilt
The instant the first database replica rebuilt, it put itself back into service, and performance resumed to normal levels. We re-ramped all of the services that had been turned down, so all asynchronous processing could catch up, and after a period of monitoring marked the end of the incident.
Redundant Points of Failure
The cascade of failures in this incident was interesting because each system, on its face, had redundancy. Moreover, no system fully failed—each entered a degraded state. That combination meant the chain of events that transpired was considerably harder to model and anticipate. It was frustrating yet reassuring that some of the possible failure modes were already being addressed.
A team was already working on fixing the limitation that requires a database replica rebuild upon promotion. Our user sessions system was inflexible in scenarios where we’d like to steer traffic around, and redesigning that was already in progress.
This incident also led us to revisit the configuration parameters we put in place for things that auto-remediate. In previous years, promoting a database replica to primary took far longer than we liked, so getting that process automated and able to trigger on a minute’s notice was a point of pride. At the same time, for at least one of our databases, the cure may be worse than the disease, and in fact we may not want to invoke the promotion process so quickly. Immediately after this incident we adjusted that configuration accordingly.
Byzantine Fault Tolerance (BFT) is a hot research topic. Solutions have been known since 1982, but have had to choose between a variety of engineering tradeoffs, including security, performance, and algorithmic simplicity. Most general-purpose cluster management systems choose to forgo BFT entirely and use protocols based on PAXOS, or simplifications of PAXOS such as RAFT, that perform better and are easier to understand than BFT consensus protocols. In many cases, a simple protocol that is known to be vulnerable to a rare failure mode is safer than a complex protocol that is difficult to implement correctly or debug.
The first uses of BFT consensus were in safety-critical systems such as aircraft and spacecraft controls. These systems typically have hard real time latency constraints that require tightly coupling consensus with application logic in ways that make these implementations unsuitable for general-purpose services like etcd. Contemporary research on BFT consensus is mostly focused on applications that cross trust boundaries, which need to protect against malicious cluster members as well as malfunctioning cluster members. These designs are more suitable for implementing general-purpose services such as etcd, and we look forward to collaborating with researchers and the open source community to make them suitable for production cluster management.
We are very sorry for the difficulty the outage caused, and are continuing to improve as our systems grow. We’ve since fixed the bug in our cluster management system, and are continuing to tune each of the systems involved in this incident to be more resilient to failures of their dependencies. If you’re interested in helping solve these problems at scale, please visit cloudflare.com/careers.
The collective thoughts of the interwebz
Manage Consent
To provide the best experiences, we use technologies like cookies to store and/or access device information. Consenting to these technologies will allow us to process data such as browsing behavior or unique IDs on this site. Not consenting or withdrawing consent, may adversely affect certain features and functions.
Functional
Always active
The technical storage or access is strictly necessary for the legitimate purpose of enabling the use of a specific service explicitly requested by the subscriber or user, or for the sole purpose of carrying out the transmission of a communication over an electronic communications network.
Preferences
The technical storage or access is necessary for the legitimate purpose of storing preferences that are not requested by the subscriber or user.
Statistics
The technical storage or access that is used exclusively for statistical purposes.The technical storage or access that is used exclusively for anonymous statistical purposes. Without a subpoena, voluntary compliance on the part of your Internet Service Provider, or additional records from a third party, information stored or retrieved for this purpose alone cannot usually be used to identify you.
Marketing
The technical storage or access is required to create user profiles to send advertising, or to track the user on a website or across several websites for similar marketing purposes.