All posts by aostan

Architecting for seamless on-premises connectivity with AWS Outposts servers

Post Syndicated from aostan original https://aws.amazon.com/blogs/compute/architecting-for-seamless-on-premises-connectivity-with-aws-outposts-servers/

This post is written by Mark Nguyen, Principal Solutions Architect, AWS and Ryan Fillis, Solutions Architect, AWS.

AWS Outposts brings native AWS services, infrastructure, and operating models to virtually any data center, co-location space, or on-premises facility. Deploying Outposts servers in your environment necessitates additional considerations regarding local network connectivity and Amazon Elastic Compute Cloud (Amazon EC2) instance networking. This post demonstrates the scalability of Outposts servers through automation and the deployment of Amazon EC2 network interfaces. This reduces the number of manual steps required to configure an Outposts server.

This post details physically connecting your servers to your Local Area Network (LAN) and the networking options available for EC2 instances running on Outposts. We cover the physical cabling options, virtual networking components such as VPCs and subnets, and walkthrough an example setup for an EC2 instance with a user-data script to route traffic locally over your on-premises network.

This post assumes that you have some familiarity with Outposts servers. If you would like a general refresher, observe What is AWS Outposts. For more information about how to provision your Outposts server, see Installing an AWS Outposts server.

Basic Amazon EC2 networking using a single interface

When launching an EC2 instance on an Outposts server a single interface is created for network connectivity. This default setting, depicted in the following diagram, is the most direct method for your instance to communicate externally.

Figure 1 Simple network connectivity on an Outposts server

Figure 1: Simple network connectivity on an Outposts server

When deploying an EC2 instance to an Outposts server, there are certain differences in using the default Elastic Network Interface (ENI) as compared to deploying in an AWS Region. Understanding these differences is critical before modifying the network configuration, which you do in the next step.

ENI differentiators between Outposts servers and the Region:

  • Primary interface: The primary interface is an ENI. This ENI is associated to a subnet within a VPC. This VPC is extended from the Region to the Outposts server.
  • IP address configuration: The primary network interface within the guest operating system (OS) of the EC2 instance must be configured to obtain an IP address through DHCP. The assigned IP address is from the IP address range of the VPC subnet associated with the Outposts server.
  • Security group: A security group is associated with the ENI. This security group falls within the VPC that is extended from the Region. The user must apply appropriate access control rules to permit access to the EC2 instance. You may reuse security groups that already exist within the VPC.
  • Outbound traffic: By default, an EC2 instance uses its ENI to direct outbound traffic toward the VPC subnet. Traffic flows according to the routing table associated with the Outposts server’s VPC subnet.
  • Inbound traffic: If you’re only using an ENI, then traffic destined to EC2 instances on Outposts servers must traverse through the service link. In the preceding diagram, the user communicates with the EC2 instance over the internet. Traffic from the internet reaches the Region through the Internet Gateway of the VPC. Then, the VPC forwards the traffic to the appropriate subnet of the Outposts server (through the service link) and reaches the EC2 instance. The user must configure the necessary VPC components (Internet Gateway and associated routing table entries) for internet connectivity.
  • Local network connectivity: There is no local network connectivity using the ENI. For local network connectivity, see the next section where we discuss the Outposts server Local Network Interface (LNI).

Local network connectivity for EC2 instances

Outposts servers allow you to communicate through the Local Network Interface (LNI) in addition to the ENI. The LNI is a logical networking component that connects the Amazon EC2 instances in your Outposts subnet to your on-premises network.

The Outposts server EC2 instance local communications characteristics:

  • Local network traffic needs the use of an LNI.
  • The subnets on Outposts servers must be enabled for LNIs. This is done by entering the following command:

aws ec2 modify-subnet-attribute \

--subnet-id subnet-1a2b3c4d \

--enable-lni-at-device-index 1

  • IP address assignment for the LNI can be DHCP or static.
  • You can’t apply VPC security groups to the LNI. To control traffic on the LNI, you can use an OS based firewall, external on-premises firewall, or other security devices.
  • Amazon CloudWatch metrics are produced for each LNI.
  • Outposts servers don’t tag VLAN traffic. If VLAN tags are needed, then the network interface settings inside the guest OS must apply the VLAN tags. Multiple VLAN interfaces can exist within the same LNI (in this case you would be using the LNI as a VLAN trunk).
  • Local traffic bandwidth performance depends on the instance type. The larger the instance type, the higher performance the throughput of the LNI. The maximum throughput is 10 Gbps.
  • EC2 instances that communicate locally always have at least two interfaces: one ENI and one or more LNIs. Therefore, the instance OS’s routing table must be configured based on the desired traffic behavior.

Example configuration: Local traffic for EC2 instance on Outposts server

Figure 2 Example scenario topology

Figure 2: Example scenario topology

In the example scenario, we want to launch an Amazon Linux 2023 instance and route all default traffic through the local network. Eth0 is the primary interface (ENI) and is used for traffic towards the Region. Eth1 is the LNI and is used for all other traffic. A user-data script is used to make the necessary routing changes at launch.

Here is a sample user-data script. These commands run as root so there is no need to prepend each command with sudo.

User data script (my_userdata.txt):

#!/bin/bash 
route add -net 172.31.0.0/16 gw 172.31.239.1 
route del default gw 172.31.239.1 
cp -RL /run/systemd/network/* /etc/systemd/network/ 
echo -e '\n[Route]\nDestination=172.31.0.0/16\nGateway=172.31.239.1\nGatewayOnLink=yes' >> /etc/systemd/network/70-ens5.network 
sed -i -e 's/UseGateway=true/UseGateway=false/g' /etc/systemd/network/70- ens5.network.d/eni.conf

We can break down this script to observe the intent of each command:

route add -net 172.31.0.0/16 gw 172.31.239.1 
route del default gw 172.31.239.1

When an instance is launched on Outposts server, the instance automatically has a default route that points toward the VPC through the ENI. In the example scenario, the desired configuration is to have all default traffic go through the LNI toward our on-premises LAN, not through the ENI. To accomplish this routing behavior for the ENI, we have to add a route toward the VPC and remove the default route. The first line adds a route through the VPC (172.31.0.0/16), using 172.31.239.1 as the gateway. The second line removes the default route that uses 172.31.239.1 (via the ENI) as the gateway.

Traffic not destined for the VPC routes through the LNI. This includes all local traffic and internet-bound traffic. The local network’s DHCP server provides a default-gateway in its DHCP lease. Therefore, there is already a default route assigned to the LNI. This steers any traffic without a more specific route, including internet traffic, toward the LNI.

Next, the user-data script makes the network settings persistent after reboot. The procedure varies depending on your OS. In the case of Amazon Linux 2023, it uses systemd-networkd.

cp -RL /run/systemd/network/* /etc/systemd/network/

This command copies the configuration files from the /run/systemd/network/ folder to /etc/systemd/network/. The configuration files in the /etc/systemd/network/ folder override the default settings and load during boot. The next is step is to modify the newly copied network configuration files.

echo -e '\n[Route] \nDestination=172.31.0.0/16 \nGateway=172.31.239.1 \nGatewayOnLink=yes' >> /etc/systemd/network/70-ens5.network

In this case the ENI is ens5. This line appends the static route section to the 70-ens5.network configuration file. This makes the static route added earlier in the script (route add -net 172.31.0.0/16 gw 172.31.239.1) persistent across reboots.

sed -i -e 's/UseGateway=true/UseGateway=false/g' /etc/systemd/network/70- ens5.network.d/eni.conf

Next, the user-script edits the configuration file, eni.conf, such that the default route isn’t used for the ENI at bootup. This is accomplished using sed to search and replace true with false for the UseGateway parameter.

Launching an instance with ENI and LNI

Now that the user-data script has been created, use the AWS Command Line Interface (AWS CLI) to launch an EC2 instance:

aws ec2 run-instances \
--image-id ami-051f8a213df8bc089 \
--count 1 \
--instance-type c6id.xlarge \
--key-name my_key \
--user-data file://my_userdata.txt \
--network-interfaces '[ \
  { "DeviceIndex":0, "SubnetId":"subnet-0ca6abe6b34adfcce", "Groups": ["sg-0a9f8c2200c0a56f1"] }, \
  { "DeviceIndex":1, "SubnetId":"subnet-0ca6abe6b34adfcce", "Groups": ["sg-0a9f8c2200c0a56f1"] }]' \
--tag-specifications '[{ "ResourceType":"instance","Tags":[ \
  { "Key":"Name", "Value":"server1" } ] }]'

We can break down the parameters used in the preceding command:

--image-id ami-051f8a213df8bc089 \

This specifies the Amazon Machine Image (AMI) ID. ami-051f8a213df8bc089 is the AMI ID for Amazon Linux 2023 in us-east-1.

--count 1 \

This specifies how many EC2 instances to launch. You can launch multiple at the same time.

--instance-type c6id.xlarge

This specifies the instance type. By default, Outposts 2U servers are slotted with the c6id.8xlarge instance type and Outposts 1U servers are slotted with the c6gd.8xlarge instance type. You can adjust the slotting assignment during the ordering process or you can change the slotting assignment later by using the Self-service Capacity Management feature for AWS Outposts.

--key-name my_key

This specifies the public RSA key that is added to your EC2 instance. This key must already be defined in the same Region of your AWS account.

--user-data file://my_userdata.txt

This specifies the filename that contains your user-data script (that was created previously).

{ "DeviceIndex":0, "SubnetId":"subnet-0ca6abe6b34adfcce", "Groups": ["sg-0a9f8c2200c0a56f1"] }, \

{ "DeviceIndex":1, "SubnetId":"subnet-0ca6abe6b34adfcce", "Groups": ["sg-0a9f8c2200c0a56f1"] }]' \

This specifies the network interface configuration. By default, a single network interface, the ENI, is created. This example calls for a second interface for the LNI. DeviceIndex:0 is for the ENI and doesn’t change. DeviceIndex:1 is for the LNI, which we defined when we enabled LNI for the subnet (--enable-lni-at-device-index 1). The SubnetId refers to the subnet that was created on the Outposts server. If you want to deploy to a different Outposts server, then change the SubnetId. Groups refer to the security group that you would like assigned to the ENI. Security groups aren’t supported for the LNI, thus the security group specified for DeviceIndex:1 is only to comply with the command syntax check. A security group will not be applied to the LNI.

--tag-specifications '[{ "ResourceType":"instance","Tags":[ \

{ "Key":"Name", "Value":"server1" } ] }]'

This assigns a name to the EC2 instance, which in this case is server1.

Conclusion

AWS Outposts servers allow you to run native AWS services on-premises by providing local compute. This supports workloads with low latency and data residency requirements through on-premises processing.

Although Outposts servers integrate seamlessly with the AWS cloud, there are some unique networking considerations when deploying in your data center environment. Amazon EC2 instances on the Outposts server can route traffic over the AWS global network, but you can also enable Local Network Interfaces (LNIs) to directly access your on-premises networks.

In this post we’ve demonstrated using user-data scripts during instance launch to automate hybrid cloud networking flows tailored to your requirements. With proper planning, you can use the benefits of consistent AWS services and tooling while maintaining connectivity to your existing on-premises infrastructure.

Ready to get started with hybrid cloud networking on Outposts servers? Check out the Outposts server documentation and best practices guide to begin planning your on-premises deployment.

Dynamically reconfigure your AWS Outposts capacity using Capacity Tasks

Post Syndicated from aostan original https://aws.amazon.com/blogs/compute/dynamically-reconfigure-your-aws-outposts-capacity-using-capacity-tasks/

This post is written by Brianna Rosentrater, Hybrid Edge Specialist SA and Adam Duffield, Senior Technical Account Manager.

AWS Outposts extends AWS infrastructure, AWS services, APIs, and tools to on-premises locations for workloads that require low latency, local data processing, or data residency. Outposts comes in a variety form factors, from 42U Outposts racks to 1U and 2U Outposts servers. Outposts now supports self-service capacity management, making it easy for you to view and manage compute capacity on your Outposts. A default capacity configuration for each new Outpost is determined during the ordering process. This default configuration can subsequently be modified to create a range of instance sizes and quantities to meet your changing business needs. To do so, you create a capacity task, specify the instance sizes and quantity, and run the capacity task to implement the changes. This post focuses on how to use capacity tasks to perform multi-host reconfigurations and view existing capacity configurations.

Overview

Amazon Elastic Compute Cloud (Amazon EC2) capacity on an Outpost is determined by the total volume of compute capacity within the Outpost when ordered. Outposts can also be scaled up or out as needed during your commitment term. For further details on Outpost capacity planning including best practices, refer to the Capacity Planning – AWS Outposts High Availability Design and Architecture whitepaper. We recommend planning spare capacity for N+M host availability when making modifications to your Outpost capacity configuration if your workloads need to be highly available. To calculate, take the number of hosts (N) you need to run all your workloads, and then add (M) additional hosts to meet your requirements for server availability during failure and maintenance events.

Viewing existing Outposts capacity configuration

Outposts users now have visibility into capacity configurations at both an instance family and host level. This gives greater insight into capacity usage and instance placements. Within the Outposts console, after choosing the Outpost ID on which you want to view the capacity configuration, two new views have been provided: the Instance view and the Rack view.

Instance view

The Instance view provides a granular breakdown of the currently deployed instances on the Outpost along with an overall view of instance family capacity pools and their usage, as shown in the preceding figure. The Instances section gives detailed information around the deployed instances, their associated instance ID, instance size, AWS managed service (if applicable), and asset ID of where the instance is running.

Figure 1 - Outposts Instance View

Figure 1 – Outposts Instance View

The Instance capacity distribution summary displays how the various instance sizes are allocated within each instance family, as shown in the following figure. Each host of the same instance family contributes its capacity to the overall pool, which is represented in this section as a percentage rather than number of instance slots. This shows the configured capacity, but it doesn’t reflect any level of usage.

Figure 2 - Outposts Instance Capacity Distribution Summary

Figure 2 – Outposts Instance Capacity Distribution Summary

The Instance capacity distribution details section, shown in the following figure, provides a more detailed breakdown of each instance family capacity pool. This section provides a view of the total available instance capacity, the number of used instances, and the number of instances that are unavailable you at that time (such as when a hardware failure occurs).

Figure 3 - Instance Capacity Distribution Details

Figure 3 – Instance Capacity Distribution Details

Rack view

The Rack view tab provides a more granular view of the overall configuration of each host on a per rack basis, as shown in the following figure. It allows you to analyze the spread and usage of the instance size allocations across each host (asset) and, when choosing the show instance details button, provides the instance ID of each used slot. Using the search box, you can filter by Instance Family or Instance Size to provide a more concise view. If you’re using Outposts server, the Rack view tab will show the capacity configuration of your server.

Figure 4 - Rack View

Figure 4 – Rack View

Obtaining a view of current configuration

Alongside these views, two buttons are available on each of the pages. The Export JSON button gives the ability to download a JSON formatted copy of the current configuration for an Outpost. This is especially useful if you’re looking to record current state, or wanting to use the JSON upload option when submitting a new capacity task. The JSON file structure provides the overall configuration of each capacity pool. However, it doesn’t provide any details in terms of usage. The second button, Modify Instance Capacity, provides a shortcut to creating a capacity task.

This level of capacity visibility is also now available through AWS Command Line Interface (AWS CLI)/Outposts API calls, which some may prefer over the console. For example, the list-assets CLI command can be used to obtain a breakdown of the capacity configuration of each Outpost host:

aws outposts list-assets --outpost-identifier outpost-arn

Figure 5 - list-assets CLI command sample output

Figure 5 – list-assets CLI command sample output

If you want to obtain details of running instances on an Outpost, such as the instance size, the asset ID on which an instance is running, and the related AWS service name (if relevant), then the list-asset-instances CLI command can be used:

aws outposts list-asset-instances --outpost-identifier outpost-arn

Figure 6 - list-asset-instances CLI command sample output

Figure 6 – list-asset-instances CLI command sample output

The list-asset-instances CLI command also allows you to filter through numerous dimensions, such as instance type or AWS service. For example, this can be particularly useful for quickly identifying all running instances of a certain type, such as the m5d.large instance type by using the following command:

aws outposts list-asset-instances --outpost-identifier outpost-arn --instance-type-filter m5d.large

Modifying the Outposts capacity configuration

Due to the finite nature of Outposts capacity, changing operational requirements often mean that adjustments need to be made to your Outposts capacity configuration over time as new workloads are identified or applications need scaling.

From the Outposts console page, choosing Capacity Tasks from the left-hand menu gives a list of previously run capacity tasks and their status. From here, you can choose Create Capacity Task to start the process. To create a capacity task there are two options available: using an interactive capacity configuration tool through the Modify an Outpost capacity configuration option, or uploading a JSON file containing the necessary configuration through the Upload a capacity configuration option.

Figure 7 - Capacity Tasks web form

Figure 7 – Capacity Tasks web form

The interactive Modify an Outpost capacity configuration option using the simple Auto-balance feature and UI is the easiest way for those unfamiliar with Outpost capacity management to get started with making changes. Using this option, you can also choose one of two methods for the task:

  • Run once: This results in the capacity task attempting to run a single time. If any instances block the successful application of the configuration, then the task fails.
  • Run periodically over 48 hours or less: In the event of blocking instances, the capacity task is paused until the instances are stopped. The task rechecks the status every 10 minutes until it can run. If instances aren’t stopped within 48 hours, then the task is cancelled.

To build out the capacity task, capacity pools are displayed, grouped by instance families, and automatically populated with the current configuration of instance sizes and corresponding vCPU allocation. From here, you can make necessary changes to the existing capacity. Specifically, you can add new instance sizes and amend instance quantities in the corresponding fields. The total vCPU count for each instance family will update automatically to reflect your changes. The Auto-balance allows you to automatically adjust the quantities of individual instance sizes to fit within the total vCPU capacity available for the host, which is reflected for each capacity pool at the end. In the event that a capacity pool is over- or under-used, a warning is displayed. You can under provision a host if you choose, but the unprovisioned capacity is unusable, and attempting to overprovision the host results in the capacity task failing to run.

Figure 8 - Modifying existing capacity configuration

Figure 8 – Modifying existing capacity configuration

When the necessary changes have been made to the capacity pools, the second part of the capacity task configuration is choosing instances that should not be impacted by the running of the capacity task. During the run, you may not be in a position to stop certain instances, such as databases or AWS managed services such as Elastic Load Balancing (ELB) or Amazon ElastiCache, due to the impact to production workloads. Choosing these instances allows the capacity task to automatically try to find a path that avoids impacting them. However, in some situations capacity tasks may fail if the chosen instances block the successful running of the task, and there is no possible solution that avoids all the chosen instances. For example, if a capacity task was to remove all c5.xlarge instances and an instance was chosen to ‘keep as-is’ that was running on this instance size, then the task would fail. To avoid this, make sure to include these instances in your capacity configuration. For example, if you have five critical m5.4xlarge instances that must remain running, then include 5 m5.4xlarge instances in your m5 capacity pool configuration.

Figure 9 - Instances to keep as-is

Figure 9 – Instances to keep as-is

After configuring the capacity pools and choosing the necessary instances to keep as-is, an overview of the changes is presented allowing you to validate the configuration prior to running. When you have reviewed the summary, select Create Task to trigger the execution of the capacity task using the chosen method. You can observe the status of a capacity task by choosing the capacity task ID. When it’s initially submitted, the status shows as Requested. During this time, the capacity task evaluates the necessary changes to determine if the task can proceed or if instances need stopping. If the Run once option was chosen and instances do need stopping, then the task moves to a cancelled status and provides details of the blocking instances. Alternatively, if Run periodically was chosen, the task remains in the Requested status until the listed instances have been stopped. In the event that the blocking instances can’t be stopped, the capacity task is cancelled after 48 hours. While a task is running, the Outpost hosts that are impacted by the configuration changes are placed into an isolated state. This means that capacity for new instance launches may be impacted. This isolation only lasts a few minutes while the capacity task is running, but it may impact auto scaling groups if a capacity task coincides with a scaling event.

Instead of using the interactive capacity configurator UI, you can also choose to upload a JSON file to the console containing the necessary configuration. Using this method, choosing instances to keep as-is isn’t available, and the method is automatically chosen as Run once. When a capacity task JSON file is uploaded, the resulting plan is displayed in the following text box and can be amended if needed. Alternatively, rather than uploading the file, the contents can be directly pasted into the text box. Choosing Next moves to the review screen where the remainder of the process continues in line with using the interactive capacity configurator UI.

Figure 10 - Upload a Capacity Configuration using JSON

Figure 10 – Upload a Capacity Configuration using JSON

You may also prefer using the AWS CLI/Outposts API for creating capacity tasks, and a number of new CLI/API actions are now available to support this:

  • cancel-capacity-task / CancelCapacityTask
  • get-capacity-task / GetCapacityTask
  • list-blocking-instances-for-capacity-task / ListBlockingInstancesForCapacityTask
  • list-capacity-tasks / ListCapacityTasks
  • start-capacity-task / StartCapacityTask

In addition to the same options available within the console, it is possible to request a dry run of the capacity task to determine if the instance type and instance size changes are above or below the available instance capacity. Requesting a dry run doesn’t make any changes to your plan.

For example, using the CLI to submit a capacity task to homogeneously slot an Outpost with 2 x m5 and 2 x c5 hosts (192 vCPU for each capacity pool) with xlarge instance sizes, and using periodic running could be achieved by running the following:

aws outposts start-capacity-task \

--outpost-identifier outpost-arn \

--instance-pools '[{"InstanceType":"c5.xlarge","Count":48},{"InstanceType":"m5.xlarge","Count":48}]' \

--task-action-on-blocking-instances WAIT_FOR_EVACUATION

Conclusion

This post demonstrated how to run a capacity task on Outposts and view your existing capacity configuration. For more information on how to manage and monitor your capacity configuration on Outposts, see Capacity management for AWS Outposts user guide and the Capacity planning section of the AWS Outposts High Availability Design and Architecture Considerations whitepaper, and the Modify AWS Outposts instance capacity – Outposts rack/Modify AWS Outposts instance capacity – Outposts server user guide sections for your respective environment. Reach out to your AWS account team to learn more about Outposts and self-service capacity management.

Automating Notifications for Future-Dated Amazon EC2 Capacity Reservation State Changes

Post Syndicated from aostan original https://aws.amazon.com/blogs/compute/automating-notifications-for-future-dated-amazon-ec2-capacity-reservation-state-changes/

This post is written by Ballu Singh, Principal Solutions Architect at AWS, Sandeep Rohilla, Senior Solutions Architect at AWS and Pranjal Gururani, Senior Solutions Architect at AWS.

AWS customers are able to proactively reserve future-dated Amazon EC2 On-Demand Capacity Reservations (known as future-dated CRs) to get capacity assurance for workloads and events. Because reservations can be created weeks in advance, customers are able to ensure that they can monitor their real-time status. Future-dated CRs can transition through various state of a Capacity Reservation, based on capacity availability. Over the course of several weeks, the status of a reservation might only change 1 or 2 times. Even with the low frequency of changes, most customers don’t want to manually poll the state of their reservations, instead they want to be proactively notified when something changes.

Amazon EventBridge is a serverless event bus service that facilitates the routing of events and EventBridge rules establish how events are processed, allowing you to filter events and route them to one or more targets for action. Amazon Simple Notification Service (SNS) is a fully managed messaging service that enables you to send messages or notifications to a variety of endpoints, facilitating scalable, and decoupled communication between different components of your application or with end-users.

In this blog post, we guide you through the process of automating notifications for future-dated CR state changes using AWS services such as Amazon EventBridge and Amazon Simple Notification Service (SNS).

Pre-requisites

  • Existing future-dated Capacity Reservation. To learn how to create future-dated CRs, visit our blog post here.
  • IAM access to create Amazon EventBridge rules
  • IAM access to create Amazon SNS topic and subscription

Architecture

Amazon EC2 continuously monitors the state of your Capacity Reservations and sends events to Amazon EventBridge when Capacity Reservation states change. Using Amazon EventBridge, you can create rules that trigger notifications through Amazon SNS in response to these events. Amazon SNS then pushes these notifications to a variety of supported endpoint types such as Amazon Data Firehose, Amazon Simple Queue Service (SQS), AWS Lambda, HTTP, email, mobile push notifications, and mobile text messages (SMS). In our example, we will send notification to our email address.

Send notification to email address

Walkthrough

To automate the notification process for future-dated CR state changes, we will use the following AWS services:

  1. Amazon Simple Notification Service (SNS): We will use SNS to send email notifications to the designated recipients.
  2. Amazon EventBridge: We will create an EventBridge rule to capture the state change events of future-dated CRs.

AWS Console Walkthrough

Step 1: Set Up Amazon SNS Topics and Subscriptions

  • Create a new topic for future-dated CR state change notifications.
    • Navigate to Amazon SNS console. On the Topics page, choose Create topic
    • In the Details section, for Type, choose Standard and enter the name of Topic (ex: Subscriber)

Set up amazon sns topics and subscriptions

    • Choose rest of details as is. Choose Create topic.
  • Create a subscription for the desired recipients, such as email addresses to receive the notifications.
    • Navigate to Amazon SNS console. In the left navigation pane, choose Subscriptions. Choose Create subscription.
    • On the Create subscription page, in the Details section, for Topic ARN, choose the Amazon Resource Name (ARN) of a topic enter topic ARN noted above. For Protocol, choose Email/Email-JSON
    • For Endpoint, enter your email address. Keep rest of details as is.

create subscription for the desired recipients

    • Choose Create subscription
    • Navigate to your email and choose Confirm subscription in the email from Amazon SNS.

Step 2: Create an Amazon EventBridge Rule

  • Next open the Amazon EventBridge console and navigate to the Rules
  • Click on Create rule and provide a name (ex: EC2CapacityReservationStateChange) and description for the rule. Keep all other setting as it is. Select
  • For Event source, choose AWS events or EventBridge partner events.
  • In the Creation method section, for Method, choose Use pattern form.
  • For Event source, choose AWS services. Under AWS Service, choose EC2 and then choose EC2 Capacity Reservation.
  • Optionally, you can narrow down the state and reservation ID you want to be alerted for by selecting Specific Capacity Reservation State and Specific Capacity reservation ID. Select Next.

Create an amazon eventbridge rule

  • In the Target section, under Target Type, select AWS Service.
  • For Select Target, choose SNS topic, under Topic, select SNS Topic you created in Step 1. Select
  • On Configure Tags page, select Next.
  • On Review and create page, select Create Rule.

CloudFormation Walkthrough

To simplify the setup process and make it easier for you to implement the automated notification solution, we have provided a CloudFormation template. This template automates the creation of the necessary Amazon EventBridge rule and Amazon SNS topic, along with the required configurations and permissions.

  1. Download yaml sample template.
  2. Navigate to AWS CloudFormation console and click on Create stack.
  3. Choose Upload a template file and select the downloaded template. Choose Next
  4. Provide a name for the stack under Stack Name. For CapacityReservationId, enter ID of the EC2 Capacity Reservation to monitor, (e.g., cr-1234567890abcdef0), for EmailAddress, enter email address you want to subscribe to the SNS topic, and for MonitoredStates enter comma-separated list of Capacity Reservation states to monitor (e.g. failed, expired, cancelled, pending). Choose Next

CloudFormation walkthrough

5. On Configure stack options, keep defaults. Choose

6. On Review and create page, choose

Clean up

To avoid ongoing charges, clean up your environment, by following these steps to delete the resources you created by following this blog, if they are no longer needed:

If you followed setup for AWS Console, please follow the below steps:

  1. Delete the Amazon EventBridge Rule
    1. Navigate to Amazon EventBridge console and choose to the Rules from left pane.
    2. Choose the rule you created earlier and click on Delete.
    3. Confirm the deletion by clicking Delete in the confirmation dialog.
  2. Delete the Amazon SNS Topic and Subscriptions
    1. Navigate to Amazon SNS console and navigate to the Topics from left pane.
    2. Choose the topic you created earlier and click on Delete.
    3. Confirm the deletion by clicking Delete in the confirmation dialog.

If you created any subscriptions for the topic (e.g., email or SMS), they will be automatically deleted along with the topic.

If you deployed CloudFormation template, please follow the below steps:

Conclusion

In this blog post we walked you through setting up an EventBridge rule to capture the state change events of your future-dated CRs and configure SNS to send notifications to the designated recipients. This automated approach eliminates the need for manual monitoring and ensures that you stay informed about the status of your capacity reservations.

By proactively managing your future-dated CRs through automated notifications, you can make informed decisions, adjust your reservation plans if need, and take corrective actions to ensure you have the necessary resources available for your critical events.

This solution enhances your operational efficiency, reduces the risk of capacity shortages, and allows you to focus on other important aspects of your business.

We encourage you to implement this automated notification system for your future-dated Amazon EC2 On-Demand Capacity Reservations and experience the benefits of streamlined monitoring and proactive capacity management.

Implementing backup for workloads running on AWS Outposts servers

Post Syndicated from aostan original https://aws.amazon.com/blogs/compute/implementing-backup-for-workloads-running-on-aws-outposts-servers/

This post is written by Leonardo Queirolo, Senior Cloud Support Engineer and Tareq Rajabi, Senior Solutions Architect, Hybrid Cloud

AWS Outposts servers provide fully managed AWS infrastructure, services, APIs, and tools to on-premises and edge locations with limited space or small capacity requirements, such as retail stores, branch offices, healthcare provider locations, or factory floors. Outposts servers provide local compute and networking services.

Outposts servers come with internal NVMe SSD instance storage, supporting local storage used for data access and processing on premises, and for launching Amazon Elastic Block Store (Amazon EBS)-backed Amazon Machine Images (AMIs). The data on these volumes persists after an instance reboot but does not persist after an instance termination. In order for data to persist beyond the lifetime of the instance, it is important to back up your data to a persistent AWS storage, such as an Amazon Simple Storage Service (Amazon S3) bucket or an Amazon Elastic Block Store (Amazon EBS) volume.

In this post, we explore several approaches to back up the data stored in the instance storage volumes of your EC2 instances running on an Outposts server to a persistent storage solution from AWS, and explore their benefits and use cases.

Planning for failure

When evaluating a backup strategy, it’s important to understand the failure modes you are looking to recover from. Some examples are ransomware attacks, accidental data deletion, hardware failure, or a wide scale issue impacting the whole facility where your Outposts servers and on-premises devices (such as network switches, storage appliances) reside. These failures come in many forms and are often unplanned and unexpected events. Next, understand what is considered acceptable recovery for your business. For example, what are the Recovery Time Objective (RTO) and Recovery Point Objective (RPO) for your workload running on Outposts servers? These two values, defined by your organization, profile how long a service can be down during recovery and quantify the acceptable amount of data loss, helping you define the appropriate backup strategy.

Scenario 1: Backup to AWS storage in an AWS Region

Backup to an AWS Region enables data redundancy outside of the data center or facility where your Outpost resides, taking advantage of the durability, high availability, and scalability provided natively by the storage in the Region. This approach offers flexibility for restoration to the Region or to an Outposts server in a different edge location if the original data center/facility is impacted by an irrecoverable incident. However, when restoring the data back to an Outposts server, this approach could result in relatively high RTO, depending on the throughput of the service link and the amount of data to restore. In the following sections, we will cover using the AWS Elastic Disaster Recovery (AWS DRS) and an open source solution based on operating system tools and AWS Systems Manager (AWS SSM).

Option 1: AWS Elastic Disaster Recovery (AWS DRS)

You can use AWS DRS to perform a continuous replication of workloads that reside on the Outposts C6id server powered by Intel processors (C6gd are not supported, since only 64-bit operating systems built for the x86 system architecture are supported by AWS DRS) to a staging area subnet in the Region. AWS DRS provides nearly continuous, block-level replication in the Region and creates periodic EBS Snapshots according to the Point in Time (PIT) state schedule for AWS DRS.

The following diagram shows the continuous replication of the data in the instance store volumes through AWS DRS. The PIT EBS Snapshots are used to create Amazon EBS-backed AMIs as a backup of the EC2 instances running on the Outposts server.

Figure 1 - Continuous replication of the Instance Store Volumes data from the instances running Outpost Server to a staging area in the parent region through DRS

Figure 1 – Continuous replication of the Instance Store Volumes data from the instances running Outpost Server to a staging area in the parent region through DRS

Despite AWS DRS not supporting the failback from the Region to Outposts servers, you can use the EBS snapshots taken by AWS DRS to restore the data back to the Outposts server at the desired PIT following the steps described in this post.

Prerequisites

The following prerequisites are required to complete the walkthrough:

  1. The EC2 instance to restore running on the Outposts server has been added as a source server to AWS DRS by installing the AWS Replication Agent.
  2. The initial sync has been completed and the data replication status is showing as healthy.

Restore the entire EC2 instance on the same or a different Outposts server

  1. Use the describe-recovery-snapshots command to list the PIT Snapshots taken by AWS DRS for the source server to restore.$ aws drs describe-recovery-snapshots --source-server <source-server-id>

2. Based on the time in which you want to restore your data, retrieve the corresponding EBS Snapshots in the output of the command. The following is an example of the output:

{
    "items": [
       {
            "ebsSnapshots": [
                "snap-07bf348d58151a432"
            ],
            "expectedTimestamp": "2024-06-13T16:40:00+00:00",
            "snapshotID": "pit-a4877ff6fa68561bf",
            "sourceServerID": "s-a080ceb10af7275a7",
            "timestamp": "2024-06-13T16:46:56.645979+00:00"
        },
        {
            "ebsSnapshots": [
                "snap-0496020ff7f83486d"
            ],
            "expectedTimestamp": "2024-06-13T16:30:00+00:00",
            "snapshotID": "pit-aece827519e1b0fbb",
            "sourceServerID": "s-a080ceb10af7275a7",
            "timestamp": "2024-06-13T16:37:06.600323+00:00"
        },
        {
            "ebsSnapshots": [
                "snap-0d7ebd23e56346cea"
            ],
            "expectedTimestamp": "2024-06-13T16:20:00+00:00",
            "snapshotID": "pit-a56960f89ff12579e",
            "sourceServerID": "s-a080ceb10af7275a7",
            "timestamp": "2024-06-13T16:27:01.595791+00:00"
        },
…
…

3. Open the Amazon EC2 console. In the navigation pane, choose Snapshots and filter by the Snapshot ID chosen in the previous step: snap-07bf348d58151a432.

4. Choose Actions, Create image from snapshot, and specify the Image name. You can leave the other information as default or customize as desired.

5. To perform the restore, launch a new EC2 instance on the same or a different Outposts server from the Amazon EBS-backed AMI created in the previous step.

Note that since AMIs are downloaded from the Region with every instance launch on Outposts servers, this approach could result in an RTO spanning hours, depending on the throughput of the service link and the size of the local instance storage from which the Snapshot and AMI were taken by AWS DRS. Alternatively, if you need to restore only some files and directories, you can do so by launching the EC2 instance in the Region from the AMI taken in Step 4 and then transferring the desired data from that instance to the source server running on Outposts.

Option 2: Backup to the Region using an open source solution

In addition to AWS DRS, you can use open source solutions and/or operating system (OS) functions to back up data from local instance storage to a Region. Consider this approach when you want a highly-customizable solution for workloads where lack of commercial support is acceptable. The open source solution uses AWS Systems Manager Automation and OS functions to take an Amazon EBS-backed AMI in the Region from a Linux EC2 instance running on your Outposts server. The following diagram provides a high-level overview of the solution.

Figure 2 – Wokflow of the open source solution

Figure 2 – Workflow of the open source solution

  1. The Automation creates a helper instance and a baseline EBS volume attached to it in the Region, using an AWS CloudFormation
  2. The Automation executes commands on the OS of the EC2 instance running on the Outposts server to perform preliminary checks and start syncing data from the local instance store volume to the baseline EBS volume in the Region.
  3. The sync continues until the data has been transferred successfully.
  4. When the sync completes, the Automation takes an EBS Snapshot of the baseline EBS volume and then creates an Amazon EBS-backed AMI from it.

Create the Automation document

  1. Open the github page of the open source solution backup-outposts-servers-linux-instance.
  2. Follow the Installation Instructions to create the Systems Manager Automation document.

Back up an EC2 instance running on Outposts server

  1. After creating the Automation document, follow the Usage Instructions to execute the Automation and initiate the backup.
  2. Monitor the Execution status in the System Manager Automation console.

Restore the entire EC2 instance on the same or a different Outposts server

  1. Open the Amazon EC2 console. In the navigation pane, choose AMIs and filter by the AMI names that contain the InstanceId to restore.

2. Select the desired AMI to restore and note its AMI ID.

3. To perform the restore, launch a new EC2 instance on the same or a different Outposts server from the Amazon EBS-backed AMI identified in the previous step.

Considerations for data residency and service link bandwidth

Data residency is a critical consideration for organizations that need to collect and store data in their own data centers for regulatory or compliance reasons. In this case, users cannot back up their data to the Region and need to consider backing up to another on-premises system.

Another consideration is the impact on the service link connectivity when performing backup and restore operations between the Outposts and the Region. When implementing the solutions described in the “Backup to AWS storage in an AWS Region” scenario, both your backup/restore and management/monitoring operations for your Outpost rely on the service link connectivity. Although AWS DRS provides block-level replication, the open source solution we discuss in this post only replicates data, resulting in smaller snapshot sizes for users with lower service link bandwidth requirement.

If you foresee bandwidth constraints for your service link, consider backing up to another on-premises system that is reachable through the local network interface (LNI) of your Outposts server.

Scenario 2: Backup to AWS storage in your on-premises environment

For the preceding reasons, you may need to back up your workload running on Outposts server to a persistent AWS storage system within the same geo political boundary. To do so, you can use an AWS Outposts rack that resides in the same or a different physical location and is reachable through the LNI of your Outposts server.

Outposts rack with Amazon S3 on Outposts allows you to run AWS infrastructure, services, and object storage to your on-premises to meet local data processing and data residency needs while offering the AWS durable storage that can be used to store your backup.

Thanks to this, you can use the same approaches described in the “Backup to AWS storage in an AWS Region” section at a high level to back up your data, while the storage is hosted on the Outposts rack. When evaluating this approach, keep in mind these important considerations for local snapshots.

With this approach, you can store your backup on premises to meet your data residency requirements. This also keeps the network traffic for your backup and restore within your on-premises network, without impacting the service link.

Conclusion

In this post, we showed different approaches to design backup and restore strategies for your workloads running on Outposts servers. Implementing the right approach can help protect your organization’s data against loss or corruption while meeting your performance, RTO, RPO, and data residency needs, with backup destinations ranging from AWS storage in the Region, locally on Outposts rack, or in a hybrid architecture.

Accelerate your AWS Graviton adoption with the AWS Graviton Savings Dashboard

Post Syndicated from aostan original https://aws.amazon.com/blogs/compute/accelerate-your-aws-graviton-adoption-with-the-aws-graviton-savings-dashboard/

This post is written by Rajani Guptan, Rosa Corley and Shankar Gopalan.

Are you looking to optimize your AWS infrastructure costs while maintaining high performance? AWS Graviton is a custom-built CPU developed by Amazon Web Services (AWS), and it is designed to deliver the best price performance for a broad range of cloud workloads running on Amazon Elastic Compute Cloud (Amazon EC2). Graviton-based instances provide up to 40% better price performance while using up to 60% less energy than comparable EC2 instances.

AWS users recognize that migrating existing workloads to Graviton-based instances results in better price performance. However, migrating to Graviton necessitates identifying comparable instance types, understanding the performance impacts, and estimating the savings opportunities. Furthermore, prioritizing and tracking migration efforts at scale across a diverse set of services such as Amazon EC2, Amazon Relational Database Service (Amazon RDS), Amazon ElastiCache, and Amazon OpenSearch can be challenging. Therefore, AWS has developed the AWS Graviton Savings Dashboard to help users address these complexities and accelerate their Graviton migration.

In this post, we walk you through the dashboard architecture, deployment steps, features, and capabilities. Whether you are an Executive, FinOps Practitioner, Product Owner, or in Engineering, you can use the dashboard to get the following:

  • Centralized visibility across accounts/workloads: The dashboard consolidates and tracks Graviton adoption across multiple management accounts, member accounts, and AWS Regions in a single view.
  • Graviton support across key AWS services: There are dedicated tabs allowing users to review current Graviton usage and potential savings across AWS compute and managed services.
  • Granular resource-level visibility for managed services: The dashboard provides granular resource level visibility for managed services such as Amazon RDS, ElastiCache, and OpenSearch.
  • Accurate savings and unit cost estimations: The dashboard provides accurate cost estimations for existing and comparable Graviton-based instance types by using the existing AWS Cost and Usage Report (CUR) data with the AWS public pricing API.
  • Categorization of migration effort: The dashboard categorizes Graviton migration opportunities into two main groups: Typically Easy and Requires Additional Planning, for EC2 instances. It also identifies Graviton-eligible resources for managed services, which may need version or database upgrades. This categorization helps users prioritize their engineering efforts for migration.

Architecture overview

The solution integrates AWS CUR, the AWS SDK, and AWS Public pricing API to generate comprehensive data on the usage, cost, and resource inventory. This data is stored in Amazon S3 and analyzed using Amazon Athena, providing deep insights into potential cost savings. Then, the results are visualized through Amazon QuickSight, enabling stakeholders to collaborate effectively and make informed, data-driven decisions, as shown in the following figure.

Graviton Savings Dashboard architecture diagram

Figure 1: Graviton Savings Dashboard architecture diagram

Although the solution typically costs between $50–$100 per month, the potential return on investment is substantial. The dashboard often identifies measurable cost savings that significantly outweigh its operational expenses. Moreover, it offers additional productivity benefits by streamlining the process of adopting Graviton, saving valuable time and effort for your team. For a detailed breakdown of the dashboard’s cost structure, we invite you to explore our comprehensive Graviton Savings Dashboard Cost Breakdown guide.

Deployment

The Graviton Savings Dashboard is part of the Cloud Intelligence Dashboards framework. You can deploy it using AWS CloudFormation Templates and a ‘cid-cmd’ command line tool. Prior to deploying the dashboard, make sure that you’ve met the prerequisites. These include the following:

  1. Setting up your AWS CUR: We highly recommend that you complete Steps 1 and 2 from the Cloud Intelligence Dashboard Deployment Guide. This makes sure that your CUR is set up with settings that allow for easy installation and troubleshooting if necessary.
  2. Setting up the Inventory Collector Module of the Optimization Data Collection lab: This provides automation to collect metadata and pricing for Amazon RDS, ElastiCache, and OpenSearch for all accounts in your AWS Organizations and AWS Regions.
  3. Preparing QuickSight: If you’re an existing QuickSight user, then you can skip this step. If not, then you must complete Step 3.1 to Prepare QuickSight.

When the prerequisites are in place, you can deploy the dashboard by running three simple commands (shown as follows) using a terminal application with permissions to run API requests in your AWS account.

python3 -m ensurepip --upgrade

pip3 install --upgrade cid-cmd

cid-cmd deploy --dashboard-id graviton-savings

For detailed instructions about the deployment and prerequisites, refer to the AWS Well-Architected Cost Optimization lab.

Examining the results: unlocking insights from your Graviton Savings Dashboard

Now that you’ve successfully deployed the dashboard, we can explore its powerful features and uncover valuable insights. As you read through this section, we encourage you to interact with your dashboard to familiarize yourself with the dashboard’s intuitive interface and functionality.

The Graviton Savings Dashboard is organized into service-specific tabs, each containing two key sections:

Current Graviton Usage and Savings (top section): This section highlights the tangible benefits you’ve already achieved by migrating workloads to Graviton. You can explore the following:

    • Monthly Graviton adoption trends
    • Usage distribution across different accounts, Regions, and processor types
    • Popular Graviton instance families
    • Unit cost trends
    • Realized Graviton savings

These metrics are calculated by comparing your Graviton usage to comparable non-Graviton instances, which provides a clear picture of your cost optimization efforts, as shown in the following figure.

Current Amazon EC2 Graviton Usage and Savings

Figure 2: Current Amazon EC2 Graviton Usage and Savings

Potential Graviton Savings Opportunities (bottom section): This section identifies areas where you can further optimize costs by adopting Graviton instances. It provides the following:

  • Actionable migration insights
  • Estimated implementation effort
  • Potential savings breakdowns by account, instance family/type, OS, and purchase option

These insights compare potential Graviton savings across various attributes, enabling targeted decision-making for future Graviton migrations and cost optimizations, as shown in the following figure.

Amazon EC2 Graviton Opportunity

Figure 3: Amazon EC2 Graviton Opportunity

Using dashboard insights: a FinOps team use case

In this section we explore a use case where you, as the lead of the Cloud Center of Excellence Team, use the insights from this dashboard to address concerns raised by your Chief Technology Officer (CTO).

Your CTO at your company approaches you with the following questions:

  1. Is our organization using the price-performance benefits of Graviton-based EC2 instances?
  2. How does our Graviton usage and spend and savings compare to other processor types within our overall EC2 compute spend?

Step 1: Initial analysis

You begin generating summary reports from the Current Graviton Usage (Figure 2) and Graviton Opportunity (Figure 3) sections of the dashboard. After reviewing these reports, the CTO asks you to engage with the Engineering team to evaluate potential opportunities for increasing Graviton coverage.

Step 2: Engaging with Engineering on Graviton Migration

When presenting the summary reports to the engineering manager, they expressed interest in understanding the effort level required for this project. This information can help them allocate resources and prioritize workloads, thus identifying what can be started in the short-term and what needs additional planning.

Step 3: Detailed analysis

As shown in the following figure, the Engineering team can focus on identifying candidate workloads with the most significant savings impact by segmenting the dashboard data by:

  • Implementation efforts
  • Linked accounts
  • Regions
  • Instance types
  • Operating systems

Amazon EC2 Graviton opportunity breakdown

Figure 4: Amazon EC2 Graviton opportunity breakdown

Furthermore, the team can use the dashboard to determine comparable Graviton-based instances for migration and their potential savings, as shown in the following figure.

Potential graviton Savings Details

Figure 5: Potential graviton Savings Details

Step 4: Tracking progress

Over time, the FinOps team and Engineering team can showcase the Graviton migration successes by highlighting the increasing Graviton coverage and realized savings using the dashboard’s charts (Figure 2).

Broader application:

Although this post primarily focuses on EC2 instance migration, the dashboard also provides similar insights for AWS managed services such as Amazon RDS, ElastiCache, and OpenSearch. Individual tabs with visualizations guide your Graviton adoption across these services, as shown in the following figure.

Potential graviton savings details

Figure 6: Graviton Savings Dashboard

As demonstrated by this use case, the Graviton Savings Dashboard enables various stakeholders in an organization to collaborate effectively, which leads to efficient outcomes and potential cost savings.

Conclusion

In summary, we showed how the Graviton Savings Dashboard provides clear insights into suitable workloads for Graviton migration, offers easy-to-understand visualizations for monitoring adoption, and automates resource matching and savings calculations. Streamlining the process of identifying and implementing cost-saving opportunities with Graviton-based instances means that the dashboard enables more informed decision-making about your AWS infrastructure. To learn more and get started with the Graviton Savings Dashboard, visit the Graviton Savings Dashboard page and take the first step toward more efficient and cost-effective cloud computing.

Faster scaling with Amazon EC2 Auto Scaling Target Tracking

Post Syndicated from aostan original https://aws.amazon.com/blogs/compute/faster-scaling-with-amazon-ec2-auto-scaling-target-tracking/

This post is written by Shahad Choudhury, Senior Cloud Support Engineer and Tiago Souza, Solutions Architect

Introduction

One of the key benefits of the AWS cloud is elasticity. It enables our users to provision and pay only for resources they need. To fully use the elasticity benefits, users needed a mechanism that is automated and can be widely operated with ease. Amazon EC2 Auto Scaling solves these challenges by helping our users automatically scale the number of Amazon Elastic Compute Cloud (Amazon EC2) instances to meet the changing workload demands, and it offers a wide suite of capabilities to manage the instance’s lifecycle.

To scale their Auto Scaling groups (ASG), users need to create scaling policies. Scaling policies provide ASGs with guidelines for adjusting Amazon EC2 capacity to match the workload demand. There are different types of scaling policies, with each having a different approach to manage capacity. One type of policy is Target Tracking, which offers a simpler yet effective way to scale automatically. To use it, users need to define a utilization metric and set a target value to maintain. For example, setting a 60% Average CPU Utilization policy causes the ASG to keep the metric as close to that value as possible across its fleet of EC2 instances.

In this post, we describe the recently released updates to Target Tracking. We also walk through the steps to create a Target Tracking policy that uses the new feature, and highlight the improvements and benefits users can expect from this new feature.

What’s new with Target Tracking policy

As users modernized their applications, we learned from them that a dynamic Auto Scaling solution must expand beyond our original implementation of the Target Tracking policy.

First, users found that the few minutes Target Tracking took to respond to a demand spike could lead to short-term performance degradation. We’ve seen many users mitigate this challenge by buffering their running capacity, leading to increased costs. Second, different workloads have different scaling requirements. This leads to users having to create tailored scaling policies for each workload, which is a time consuming, error prone, and operationally expensive activity for performance and cost optimizations.

To address these user challenges, we released an intelligent and highly responsive Target Tracking scaling policy. Target Tracking now automatically tunes its responsiveness to the unique usage patterns of individual applications and closely monitors application demand for faster scaling decisions. Automatic tuning allows users to enhance their application performance and maintain high usage for their Amazon EC2 resources to save costs without having to create tailored scaling policies for each workload. Users must specify a target utilization they want to maintain, and Target Tracking scales without any further input needed from users.

For faster auto scaling decisions, users can configure Target Tracking policies using high-resolution metrics in Amazon CloudWatch. This fine-grained monitoring allows Target Tracking to detect and respond to changing demand, not in minutes, but in seconds. This capability is ideal for applications that have volatile demand patterns, such as client-serving APIs, live streaming services, e-commerce websites, and on-demand data processing.

Getting started with the new Target Tracking policy

If you’re already using Target Tracking policies, then no action is necessary for you to upgrade to Target Tracking that automatically tunes itself. Target Tracking policies regularly analyze targeted metric history and determine the appropriate level of sensitivity to initiate scale-outs and scale-ins. Furthermore, it determines the amount of capacity that must be added or removed to optimize both availability and lower cost. These decisions depend on the unique characteristics of the application’s demand patterns, such as the range and frequency of demand changes, and whether spikes in usage are long or short-lived. Target Tracking continues to learn on an ongoing basis, and reevaluates itself to automatically adapt for your specific application and demand patterns.

Enabling faster scaling response from Target Tracking

Moreover, to enable the fastest response from Target Tracking policies, users can track metrics published at sub-minute granularity to CloudWatch (also known as high-resolution CloudWatch metrics). Users can update an existing Target Tracking policy or create a new one with a high-resolution metric as part of a CustomizedMetricSpecification. Users must describe the same metric namespace, metric name, and any dimension(s) and/or unit created when publishing the metric to CloudWatch. They must also define the metric period to indicate the metric granularity at which target tracking should evaluate the metric. The following steps walk you through how to get started on the AWS Management Console for ASG:

Step 1: Choose the ASG

In the console, choose the name of the ASG. This takes you to the Details page, as shown in the following figure.

List of ASGs in the Amazon EC2 console Auto Scaling section

Figure 1: In the Amazon EC2 console, choose the ASG that you want to scale

Choose the Automatic scaling tab that gives you the option to Create a dynamic scaling policy, as shown in the following figure.

Step 2: Create dynamic scaling policy

Step 2: Create dynamic scaling policy

Choose the target tracking policy as the policy type. For Metric Type, choose Custom CloudWatch metric. This shows a prefilled JSON snippet that you can edit to specify the metric name, namespace, and dimensions of the metric that you want to scale using the Target Tracking policy that you used to publish the CloudWatch metric, as shown in the following figure.

Figure 3: Updated CustomizedMetricSpecification section added to the Auto Scaling Console

Figure 3: Updated CustomizedMetricSpecification section added to the Auto Scaling Console

The minimum Period supported is ten seconds. To use the ten second metric periods, your metric should be published at a ten second or higher resolution, for example at one second. However, publishing at one second intervals can substantially increase your CloudWatch cost. We discuss the cost considerations later in this post. Auto Scaling imposes a limit of 60 seconds to make sure that Target Tracking can observe and respond to usage spikes quickly.

These two steps allow you to enable target tracking to scale on a high resolution metric.

Enabling faster scaling impact:

The preceding steps allow the ASG to detect changes in your utilization faster, thus it can add more instances when demand spikes.

In the following diagram, we see the results of running identical load tests against an environment with a default target tracking policy of a 60 second period and a target tracking policy configured with a ten second period. Each policy has a target value of 60% CPU Utilization. The load test ramps up to 20 threads over three minutes each sending http requests to simulate a spike in demand. We can see that, in the 60 second period case (the left diagram) there were three minutes where the application was above the CPU Utilization target of 60% (blue line). The capacity (green line) increased only after the system had reached a peak of 100% CPU Utilization. This may lead to application performance issues and, to avoid that, users would have to aim for lower utilization level so that more capacity can be provisioned, which would increase their cost. However, with the ten second periods (the right diagram), scaling happened rapidly to avoid application impact. The capacity increased after one minute, during which CPU Utilization remained closer to 60% and didn’t hit the peak 100% level. This allows users to reach a higher utilization level, saving the cost without impacting the application performance.

Two graphs of CPU Utilization and Auto Scaling InService Capacity comparing scaling based on 60 seconds period as opposed to 10 seconds period. In the first case, the CPU approaches 100% for multiple minutes before scaling occurs to bring CPU down. Comparatively, when scaling with a 10 second period, the CPU increases over two minutes but remained closer to the 60% target throughout.

Figure 4: Target tracking policy with 60 second periods as opposed to 10 seconds

Considerations

Before applying high resolution custom metrics, we recommend that you consider the following factors as they may impact your costs.

Metric types: Target Tracking assumes that metrics change proportionally to the number of instances in the ASG. Selecting the right metric is key for successful Target Tracking policies. Refer to the Target Tracking public documentation for more details.

Pricing: There is no further charge for EC2 Auto Scaling, including these new features. Users pay only for the AWS resources needed to run their applications and CloudWatch monitoring fees. However, you must understand the three CloudWatch billing items relevant to these features:

1) High-resolution alarms

2) API calls

3) Custom metrics

Target Tracking creates at least two alarms, one each to track high and low usage with a buffer in between their thresholds to reduce oscillation. If the metric period is less than sixty seconds, these alarms are billed as high-resolution alarms. As of this writing, the price for high-resolution alarm for the AWS US East (Ohio) Region is $0.30 per alarm metric as compared to $0.10 per alarm metric for standard resolution alarms.

If you’re using CloudWatch Agent, it sends API calls from each instance based on the metrics_collection_interval setting in the CloudWatch Agent config. Each instance sends an API call once per interval to CloudWatch. In CloudWatch, a metric is defined as a unique combination of a Namespace, MetricName, Dimension(s) (optional), and Unit (optional). Every unique combination of dimensions pushed from the CloudWatch Agent is billed as its custom metric.

The following is an example of expected monthly charges in USD using us-east-2 for an account that has passed the free tier, but is still in the first tier of paid usage (the price reduction for bulk usage). This example assumes an average of ten instances running over the month in an ASG with one target tracking policy where metrics and alarms are configured for ten second intervals.

1) High-resolution alarms:

2 alarms @ $0.30 each = $0.60/month

2) API calls:

10 instances * 30 days * 24 hours * 3600 seconds / 10 second_intervals = 2.592 million API calls

2.592 million API calls * $0.01 per 1,000 requests = $25.92/month

3) Custom metrics:

1 ASG aggregate metric @ $0.30/month = $0.30/month

Total estimate: $26.82/month for a 10 instance ASG

Multiple metrics can be pushed in a single PutMetricData API call. If you decide to configure the CloudWatch Agent to publish more than the single aggregate AutoScalingGroupName metric, then the API charges stay the same until the PutMetricData size limit is hit, and only the Custom metrics charge increases.

For example, if the ASG is running c8g.xlarge instances, then by running one fewer instance due to the higher utilization unlocked by these features, then the monthly cost saving in us-east-2 would be:

1 c8g.xlarge @ $0.15896/hour * 30 days * 24 hours = $114.45/month

Taking away the $26.82/month in estimated CloudWatch costs means a savings of $87.63/month per ASG. This is nearly 8% saving on the EC2 cost in this example.

Template to publish metrics and updating your scaling policies

To help you start publishing high resolution metrics, we have created a sample AWS CloudFormation template. The template provides the scaffolding to demonstrate the new faster scaling period for an existing ASG. It includes installing a CloudWatch agent and publishing the CPU Utilization of the ASG instances to CloudWatch at high resolution. The template also includes a Target Tracking policy, as described in this post.

Instructions on deployment and customization requirements can be found in the AWS Samples Repo for Faster Target Tracking. However, there are a few code snippets in the template that we want to highlight.

First, to install the CloudWatch agent, the template updates the UserData of the Launch Template used with the ASG.

UserData: 
          Fn::Base64: 
            !Sub |
              #!/bin/bash
              yum install amazon-cloudwatch-agent -y
sudo /opt/aws/amazon-cloudwatch-agent/bin/amazon-cloudwatch-agent-ctl -a fetch-config -m ec2 -c ssm:/cw-agent-asg-aggregate-cpu -s

This command refers to an AWS Systems Manager parameter holding the Cloudwatch Agent configuration.

The following snippet of the Systems Manager parameter reports the CPU Utilization metric at a 10 second interval to a custom namespace called FasterScalingDemo. The metric is also aggregated with the name of the ASG as a dimension so that you can easily refer to it in CloudWatch.

CloudWatchMetricsSSMParameter:
    Type: AWS::SSM::Parameter
    Properties:
      Name: cw-agent-asg-aggregate-cpu
      Type: String
      Value: '{"agent":{"metrics_collection_interval":10,"run_as_user":"cwagent"},"metrics":{"force_flush_interval":10,"aggregation_dimensions":[["AutoScalingGroupName"]],"append_dimensions":{"AutoScalingGroupName":"${aws:AutoScalingGroupName}"},"namespace":"FasterScalingDemo","metrics_collected":{"cpu":{"drop_original_metrics":["cpu_usage_active"],"measurement":[{"name":"cpu_usage_active","rename":"CPUUtilization"}]}}}}'
      Tier: Intelligent-Tiering
      Description: Custom metric specification for CloudWatch Agent

Second, the template also includes an updated AWS Identity and Access Management (IAM) Role and corresponding IAM Instance Profile with permissions to PutMetricData to CloudWatch, and to retrieve Systems Manager parameters that we created previously to configure the agent.

IAMInstanceRole:
    Type: 'AWS::IAM::Role'
    Properties:
      AssumeRolePolicyDocument:
        Version: "2012-10-17"
        Statement:
          - Effect: Allow
            Principal:
              Service:
                - ec2.amazonaws.com
            Action:
              - 'sts:AssumeRole'
      Path: /
      Policies:
        - PolicyName: FasterScalingDemo
          PolicyDocument:
            Version: "2012-10-17"
            Statement:
              - Effect: Allow
                Action:
                  - cloudwatch:PutMetricData
                  - ec2:DescribeTags
                  - ssm:GetParameter
                Resource: '*'
      Tags:
        - Key: Name
          Value: !Sub ${EnvironmentName}_IAMROLE

Finally, the following image depicts the architecture deployed by the CloudFormation template.

Amazon VPC with an ASG launching instances in three Availability Zones, publishing high-resolution metrics to CloudWatch

Figure 4: AWS resources created in the CloudFormation example

When the template is deployed with your chosen ASG, you should be ready to test Target Tracking set with high resolution metrics. You can perform a load test to see Target Tracking in action. The closer the load test mimics your application usage pattern, the more conclusive the test would be in determining the benefits of these features.

Conclusion

This post provides an overview of the updates we have made to the Target Tracking policy that deliver higher precision in matching your demand with Amazon EC2 capacity. Specifically, this post demonstrated the value of using high resolution CloudWatch metrics with Target Tracking to increase the Auto Scaling rate to match demand, improve availability, and open possibilities for better resource utilization. We encourage you to test the feature and apply the consideration factors outlined in this post before opting for high-resolution metric scaling. You can find more details about these new features in the Target Tracking documentation.

Hosting containers at the edge using Amazon ECS and AWS Outposts server

Post Syndicated from aostan original https://aws.amazon.com/blogs/compute/hosting-containers-at-the-edge-using-amazon-ecs-and-aws-outposts-server/

This post is written by Craig Warburton, Hybrid Cloud Senior Solutions Architect and Sedji Gaouaou, Hybrid Cloud Senior Solutions Architect

In today’s fast-paced digital landscape, businesses are increasingly looking to process data and run applications closer to the source, at the edge of the network. For those seeking to use the power of containerized workloads in edge environments, AWS Outposts servers offer a compelling solution. This fully managed service brings the AWS infrastructure, services, APIs, and tools to virtually any on-premises or edge location, allowing users to run container-based applications seamlessly across their distributed environments. In this post, we explore how Outposts servers can empower organizations to deploy and manage containerized workloads at the edge, bringing cloud-native capabilities closer to where they’re needed most.

Solution overview

Amazon Elastic Container Service (Amazon ECS) is a fully managed container orchestration service that can be used with Outposts servers. This combination allows users to run containerized applications at the edge with the same ease and flexibility as in the AWS cloud.

By using Outposts server with Amazon ECS, users can effectively extend their container-based workloads to the edge, enabling new use cases and improving application performance for latency-sensitive operations.

The following diagram illustrates an example architecture where a user is looking to deploy a microservices based PHP web application and instance based MySQL database. Furthermore, a container based load balancer appliance is used to receive and distribute traffic to the web application container. The example application writes its data to a MySQL database, which is hosted on an external storage array. The application is deployed on the Outpost server, and can communicate with the database across the user data center network.

In this post we will show how users can deploy an example microservice based application. Each section of this post walks through Steps 1 through 4 shown in the following diagram.

Figure 1: Solution overview

Figure 1: Solution overview

Walkthrough

Prerequisites

Before deploying the sample application, you must have ordered, received, and successfully installed an Outposts server. The server is operational and visible in the AWS Management Console.

This walkthrough assumes you have access to Amazon Elastic Container Registry (Amazon ECR) that is used for the container repository.

You need the following AWS Identity and Access Management (IAM) role provisioned with the necessary permissions included in the policy to permit the load balancer to read the required Amazon ECS attributes. Refer to the user guide Create a role to delegate permissions to an IAM user section to help you through creating an IAM role and associated policy. The Amazon ECS task IAM role needs the following policy configuration to read the necessary Amazon ECS information:

{
    "Version": "2012-10-17",
    "Statement": [
        {
            "Sid": "LoadBalancerECSReadAccess",
            "Effect": "Allow",
            "Action": [
                "ecs:ListClusters",
                "ecs:DescribeClusters",
                "ecs:ListTasks",
                "ecs:DescribeTasks",
                "ecs:DescribeContainerInstances",
                "ecs:DescribeTaskDefinition",
                "ec2:DescribeInstances",
                "ssm:DescribeInstanceInformation"
            ],
            "Resource": [
                "*"
            ]
        }
    ]
}

You also need the Amazon ECS task execution IAM role (ecsTaskExecutionRole) that will grant the Amazon ECS container service the necessary permissions to make AWS API calls on your behalf.

Step 1: Setting up Amazon ECS on Outposts server

Amazon ECS is used in this walkthrough to deploy our container workloads to the Outposts server. Before deploying workloads, an ECS cluster on Outposts needs to be created.

In this configuration, the Amazon ECS cluster targets the private subnets (10.0.1.0/24 and 10.0.2.0/24) and the Amazon Elastic Compute Cloud Amazon (EC2) instances configured on the Outpost server for deployments.

To assist in targeting the deployment of our Amazon ECS services to specific instances with an attached Local Network Interface (LNI), our Amazon EC2 instances are assigned a logical role using custom Amazon ECS container instance attributes. Custom attributes are used to configure task placement constraints, as shown in the following figure.

Figure 2: Amazon ECS container instances used for tasks

Figure 2: Amazon ECS container instances used for tasks

One of the container instances is assigned the role of loadbalancer, as shown in the following figure. Follow the developer guide section to Define which container instances Amazon ECS uses for tasks, and add the following custom attribute to one of your instances:

  • Name = role, Value = loadbalancer

Figure 3: Instance with the Custom Attibutes - loadbalancer

Figure 3: Instance with the Custom Attibutes – loadbalancer

The other container instance is assigned the role of webserver, as shown in the following figure. Add the following custom attribute to each of the remaining instance:

  • Name = role, Value = webserver

Figure 4: Instance with the Custom Attibutes - webserver

Figure 4: Instance with the Custom Attributes – webserver

Step 2: Deploying a load balancer with host mode to use LNI

In this section, you deploy a task for the load balancer as seen in Step 2 of the Solution overview.

First, you must enable the private subnet, where your load balancer is deployed, for LNIs:

aws ec2 modify-subnet-attribute \

    --subnet-id subnet-1a2b3c4d \

    --enable-lni-at-device-index 1

Now add an LNI to the container instance with the attibute “loadbalancer”. This instance can now access your local network.

To deploy the load balancer, create an Amazon ECS task definition named “task-definition-loadbalancer.json”, which describes the container configuration to implement the load balancer as followed:

{
    "containerDefinitions": [
        {
            "name": "loadbalancer",
            "image": "traefik:latest",
            "cpu": 0,
            "portMappings": [
                {
                    "containerPort": 80,
                    "hostPort": 80,
                    "protocol": "tcp"
                },
                {
                    "containerPort": 8080,
                    "hostPort": 8080,
                    "protocol": "tcp"
                }
            ],
            "essential": true,
            "command": [
                "--api.dashboard=true",
                "--api.insecure=true",
                "--accesslog=true",
                "--providers.ecs.ecsAnywhere=false",
                "--providers.ecs.region=<AWS_REGION>",
                "--providers.ecs.autoDiscoverClusters=true",
                "--providers.ecs.clusters=<YOUR_CLUSTER_NAME>",
                "--providers.ecs.exposedByDefault=true"
            ],
            "environment": [],
            "mountPoints": [],
            "volumesFrom": [],
            "systemControls": []
        }
    ],
    "family": "loadbalancer",
    "taskRoleArn": <TASK_ROLE_ARN>,
    "executionRoleArn": <EXECUTION_ROLE_ARN>,
    "networkMode": "host",
    "volumes": [],
    "placementConstraints": [
        {
            "type": "memberOf",
            "expression": "attribute:role == loadbalancer"
        }
    ],
    "requiresCompatibilities": [
        "EC2"
    ],
    "cpu": "256",
    "memory": "128",
    "tags": []
}

Replace the string <TASK_ROLE_ARN> with the Amazon Resource Name (ARN) of the IAM role configured with the LoadBalancerECSReadAccess policy and the string <EXECUTION_ROLE_ARN> with the ARN of the IAM role configured with the ecsTaskExecutionRole policy as configured in the Prerequisites section, <AWS_REGION> with the AWS Region where you deployed your ECS cluster, <YOUR_CLUSTER_NAME> with your cluster name.

Some points to consider:

  • The Amazon ECS Network mode is set to “host”. The load balancer task uses the host’s network to access the LNI.
  • The task definition includes the placement constraint matching the loadbalancer custom attribute value.

Lastly, register the task definition with your cluster and create the loadbalancer service using the following AWS Command Line Interface (AWS CLI) command:

aws ecs register-task-definition --cli-input-json file://task-definition-loadbalancer.json

aws ecs create-service--cluster <CLUSTER_NAME> --service-name loadbalancer --task-definition loadbalancer:1 --desired-count 1

Replace the string <CLUSTER_NAME> with the target Amazon ECS cluster name.

The load balancer is now running.

Connecting to the Amazon EC2 instance with the attibute loadbalancer using Session Manager, you can get the following LNI IP address:

Figure 5: Getting the LNI IP

Figure 5: Getting the LNI IP

You can access the web user interface by browsing to the URL from your local network:

http://<HOST_IP>:8080/dashboard/

Replace the string <HOST_IP> with the Amazon EC2 instance host LNI IP address, or DNS hostname.

Step 3: Deploying sample web application in awsvpc mode

First, make sure that the AWSVPC Trunking is turned on, as shown in the following figure:

Figure 6: Enabling AWSVPC Trunking

Figure 6: Enabling AWSVPC Trunking

Create an Amazon ECS task definition for our application named “task-definition-webapp.json”, which describes the container configuration to implement the example web application as followed:

Replace the <PLACEHOLDER> values for your application.

{
    "containerDefinitions": [
        {
            "name": "whoami",
            "image": "<CONTAINER-IMAGE>:latest",
            "cpu": 0,
            "portMappings": [
                {
                    "name": "<WEBAPP>",
                    "containerPort": 80,
                    "hostPort": 80,
                    "protocol": "tcp"
                }
            ],
            "essential": true,
            "environment": [],
            "mountPoints": [],
            "volumesFrom": [],
            "dockerLabels": {
"traefik.http.routers.<WEBAPP>-host.rule":     "Host(`<WEBAPP>.domain.com`)",
               "traefik.http.routers.<WEBAPP>-path.rule": "Path(`/<WEBAPP>`)",
               "traefik.http.services.<WEBAPP>.loadbalancer.server.port": "80"
            },
            "systemControls": []
        }
    ],
    "family": "<WEBAPP>",
    "networkMode": "awsvpc",
    "volumes": [],
    "placementConstraints": [
        {
            "type": "memberOf",
            "expression": "attribute:role == webserver"
        }
    ],
    "requiresCompatibilities": [
        "EC2"
    ],
    "cpu": "256",
    "memory": "128",
    "tags": []
}

In the task-definition-webapp.json, consider the following:

  • The task definition includes the placement constraint matching the webserver custom attribute value.
  • Docker label traefik.http.routers is used to configure host and path based routing rules.
  • As the example web application container exposes the single TCP port 80, Docker label traefik.http.services.<WEBAPP> is used to configure this port for private communication with the Traefik load balancer.

Register the task definition with your cluster and create the loadbalancer service using the following AWS CLI command:

aws ecs register-task-definition --cli-input-json file://task-definition-webapp.json

aws ecs create-service--cluster <CLUSTER_NAME> --service-name <WEBAPP> --task-definition <WEBAPP>:1 --desired-count 1

Replace the string <CLUSTER_NAME> with the target Amazon ECS cluster name and the string <WEBAPP> with your application.

You can access the whoami application by browsing to the URL from your local network:

http://<HOST_IP>/<WEBAPP>

Step 4: Provision DB instance and attach an external storage

The web application has been successfully deployed, so we will move on to the deployment and configuration of the database server next. First, deploy an Amazon EC2 instance to host a MySQL database. As shown in the following screenshot, use the AWS Console to choose an instance type (this is dependent on your Outposts server instance capacity configuration) and configure its network settings to target the correct VPC and the subnet deployed to the Outposts server.

Figure 7: Provisioning a database instance

Figure 7: Provisioning a database instance

When the instance is available, deploy MySQL following a standard documented approach to install on a Linux host from the vendor. After successfully installing MySQL, configure users and tables necessary for the application. The sample application configuration file can now be updated to allow the PHP web server container to connect to the MySQL database, as well as create a user and list the users, as shown in the following figures.

Figure 8: Updating the application config file to use the database instance

Figure 8: Updating the application config file to use the database instance

Figure 9: Sample application connected to database

Figure 9: Sample application connected to database

For the database instance, make sure that the data associated with the application is stored on an existing storage array in the user data center. To do this, you must complete the following:

(a) Enable connectivity to the user network through the LNI.

(b) Mount the iSCSI volume in the EC2 instance.

(c) Configure MySQL to use this iSCSI volume.

To enable connectivity, follow the same process described in step 2 of this post to add an Elastic Network Interface (ENI) with the correct device index to present the LNI to the instance. The following screenshots show a second ENI configured on the instance and associated with the LNI along with the interface and address configuration of the instance that shows two addresses (VPC and user network addresses).

Figure 10: Network interface configuration

Figure 10: Network interface configuration

Now that connectivity has been established to the user network, you can configure the storage array to present an ISCSI volume to the database instance and mount that volume. The following screenshot shows the /mnt mountpoint being used with iSCSI multi-path across four volumes.

Figure 11: iSCSI volume mount

Figure 11: iSCSI volume mount

Finally, configure MySQL to use the iSCSI volume to store data by stopping the MySQL service, updating the default configuration file /etc/my.cnf, and restarting MySQL, as shown in the following figure.

Figure 12: MySQL configuration

Figure 12: MySQL configuration

Clean up:

Please follow the below instructions to clean up after testing:

  • Delete the <WEBAPP> service
  • Delete the loadbalancer service
  • Delete your Amazon ECS cluster
  • Delete the MySQL Database EC2 instance
  • Delete all VPCs

Conclusion

This post has demonstrated how to deploy a sample container-based web application while connecting to the user network, allowing access to the application and connecting to existing storage appliances.

AWS Outposts server allows users to run containers at the edge, addressing challenges related to low latency, local data processing, and data residency. Amazon ECS allows you to deploy consistently, whether in-Region or at the edge, allowing users to develop once and deploy many times.

Get started with Outposts servers by visiting the Outposts servers webpage and learn more about Amazon ECS to begin deploying your containarized workloads at the edge!

Using zonal shift with Amazon EC2 Auto Scaling

Post Syndicated from aostan original https://aws.amazon.com/blogs/compute/using-zonal-shift-with-amazon-ec2-auto-scaling/

This post is written by Michael Haken, Senior Principal Solutions Architect, AWS

Today, we’re announcing support for zonal shift in Amazon EC2 Auto Scaling. Zonal shift gives allows you to rapidly recover from application impairments in a single Availability Zone (AZ) impacting your Auto Scaling Group (ASG) resources. In this post, we describe how performing an ASG zonal shift fits in to a multi-AZ resilience strategy and considerations for how to use the feature with different architectures.

Overview

Using multiple AZs is an architectural best practice for building resilient applications on AWS. Deploying your application across multiple AZs makes your applications more available, fault tolerant, and scalable. EC2 Auto Scaling enables you to further enhance your application’s availability and fault tolerance by dynamically scaling your Amazon Elastic Compute Cloud (Amazon EC2) instances across multiple AZs and replacing them when they’re unhealthy.

AZs in AWS represent a fault isolation boundary, meaning that failures from various sources are contained to a single AZ, whether caused by a bad deployment, networking issues, power loss, or operator error. In 2023, we launched zonal shift, part of Amazon Application Recovery Controller (ARC), which allows you to Rapidly recover from application impairments in a single AZ by shifting traffic at your Elastic Load Balancing (ELB) load balancer.

Zonal shift for EC2 Auto Scaling enhances this capability for users who have already implemented recovery patterns for single AZ impairments. It also provides recovery capabilities for architectures that aren’t load balanced by allowing you to prevent new instance launches in a specified AZ. Without zonal shift, when EC2 Auto Scaling detects consistent launch failures in an AZ, the service tries to launch instances in other AZs configured for the ASG. However, certain conditions, like gray failures, can cause post-launch problems in a single AZ that EC2 Auto Scaling doesn’t detect. For example, successfully launched instances in a single AZ experience elevated error rates downloading their configuration files over a zonal Amazon S3, Amazon Virtual Private Cloud (Amazon VPC) interface endpoint. The instances can’t correctly configure their application software and respond to requests with errors. Alternatively, the single-AZ impairment could cause the instance to fail its health checks after provisioning. This causes EC2 Auto Scaling to constantly recycle instances in the impaired AZ, leading to the application running with less capacity than desired.

Although you might choose to perform a zonal shift at your load balancer to mitigate the impact caused by the event, new instances can still be launched in the impacted AZ and don’t receive incoming requests. Even if your application architecture doesn’t use load balancers, zonal shift for EC2 Auto Scaling can help you recover from single-AZ impairments by allowing you to prevent instance launches in the impaired AZ.

Using EC2 Auto Scaling zonal shift to recover

To use zonal shift on your ASG, you need to configure it with an AvailabilityZoneImpairmentPolicy parameter either when you create a new ASG or update an existing one. This parameter has two options, ZonalShiftEnabled that enables or disables the ability to perform zonal shifts, and ImpairedZoneHealthCheckBehaviour. The latter option allows you to choose between ignoring or replacing instances identified as unhealthy by EC2 Auto Scaling. First, we look at how you can use zonal shift with a standalone ASG architecture.

Standalone ASG zonal shift

This architecture uses a standalone ASG without being integrated with an ELB load balancer. Workloads with a standalone ASG commonly perform event driven work such as generating load against a target based on a schedule or processing messages from a queue. The architecture in the following figure uses an ASG that reads messages from an Amazon Simple Queue Service (Amazon SQS) queue, performs some processing on the message data, and writes the results into an Amazon Aurora database. The instances communicate with Amazon SQS using a VPC endpoint in each AZ. Each message varies in size, thus the instances use a heartbeat pattern to update the message visibility timeout until they finish processing it. EC2 Auto Scaling scales instances based on the queue depth, which helps make sure that messages are processed in a timely manner.

Figure 1: EC2 instances deployed across three AZs that process messages from an SQS queue

Figure 1: EC2 instances deployed across three AZs that process messages from an SQS queue

Say that a networking degradation causes instances in AZ 1 to experience elevated error rates when attempting to write to the Aurora database, resulting in a 2x increase in the p50 processing latency. The instances in AZ 1 continue to heartbeat until they time out, keeping the message hidden and preventing other healthy instances from taking over the work. As a result, the queue depth grows and EC2 Auto Scaling deploys a new instance, as shown in the following figure.

Figure 2: EC2 Auto Scaling launches a new instance in AZ 1 in response to the queue depth growing

Figure 2: EC2 Auto Scaling launches a new instance in AZ 1 in response to the queue depth growing

The new instance lands in AZ 1 and experiences the same problem as the other instance, thus it can’t decrease the queue depth and processing latency. Instead, it exacerbates the issue by consuming additional messages that aren’t successfully processed. The instances in AZ 1 never appeared unhealthy, thus EC2 Auto Scaling didn’t take any actions to replace them. To mitigate this problem, you can start a zonal shift for your ASG. This makes sure that any future instance launches only happen in AZ 2 or AZ 3, as shown in the following figure.

Figure 3: After the zonal shift new instances are only launched in AZ 2 and AZ 3 by EC2 Auto Scaling

Figure 3: After the zonal shift new instances are only launched in AZ 2 and AZ 3 by EC2 Auto Scaling

You have the option to mark the instances as unhealthy using the SetInstanceHealth API to force EC2 Auto Scaling to replace these instances to prevent them from continuing to contribute to additional latency and errors. Changing the instance health state is considered a mutating change and relies on the EC2 Auto Scaling control plane. Therefore, you should avoid making this a critical step in your recovery plan. When you are confident that the impairment has abated, you can cancel the zonal shift, which causes EC2 Auto Scaling to automatically rebalance capacity across your AZs.

ASG with ELB zonal shift

In this section we observe how to use zonal shift with an ASG that is serving traffic from an ELB. We also examine how the ImpairedZoneHealthCheckBehavior affects recovery in this situation. In this architecture, the instances in the ASG read data from the database when they receive HTTP requests from the ELB, as shown in the following figure.

Figure 4: A three-tier application deployed in three AZs using an ALB, ASG, and Aurora database

Figure 4: A three-tier application deployed in three AZs using an ALB, ASG, and Aurora database

In this scenario, the instances in AZ 1 start experiencing increased latency with their EBS volumes causing them to respond to requests with errors and fail their EC2 instance status checks. Initially, to mitigate the impact, you can start a zonal shift at your load balancer to prevent your users from receiving errors. Then, you can initiate a zonal shift for your ASG to prevent new capacity from being launched into the AZ that isn’t receiving traffic.

If the ASG’s ImpairedZoneHealthCheckBehavior is set to IgnoreUnhealthy, then the instances in AZ 1 that are failing their health checks aren’t terminated by EC2 Auto Scaling, as shown in the following figure. This can be helpful if you’re pre-scaled to handle the loss of an AZ’s worth of capacity by not causing EC2 Auto Scaling to attempt to launch additional instances. It can also make recovery safer by leaving capacity in the AZ, thus when you end your load balancer zonal shift after the impairment ends, the AZ can immediately start receiving traffic again.

Figure 5: Performing a zonal shift on the ALB and ASG, choosing to ignore unhealthy instances in the ASG

Figure 5: Performing a zonal shift on the ALB and ASG, choosing to ignore unhealthy instances in the ASG

Alternatively, you can set the option to ReplaceUnhealthy. Now, instances that are found to be unhealthy by EC2 Auto Scaling are replaced. This option can be helpful if you aren’t pre-scaled to handle the loss of capacity. EC2 Auto Scaling launches new instances into the remaining AZs to bring the ASG back to its desired capacity, as shown in the following figure. However, this approach also has a tradeoff: launching new instances isn’t guaranteed to be successful, thus you might experience delays in acquiring new capacity.

Figure 6: Performing a zonal shift on the ALB and ASG, this time replacing unhealthy instances in the remaining AZs

Figure 6: Performing a zonal shift on the ALB and ASG, this time replacing unhealthy instances in the remaining AZs

In both situations you must consider whether you have cross-zone load balancing enabled or disabled. When cross-zone load balancing is enabled, each instance, regardless of its AZ, receives an approximately equal share of the traffic. This means that you can end your zonal shift for both your load balancer and ASG at the same time safely. As EC2 Auto Scaling rebalances your instances across each enabled AZ, they receive the same percentage of traffic.

If cross-zone load balancing is disabled, then each AZ receives an equal percentage of the traffic, regardless of how many instances are in the AZ. If you’ve chosen to replace unhealthy instances, or if your ASG has scaled during the event, then the capacity across your AZs could have become imbalanced. When you end your load balancer zonal shift and EC2 Auto Scaling begins to rebalance your capacity, you could end up in a situation shown in the following figure, where a single or small number of instances gets an overwhelming portion of the load.

Figure 7: A three-tier architecture with an imbalance of capacity among its three AZs

Figure 7: A three-tier architecture with an imbalance of capacity among its three AZs

This imbalance can present an overload risk, thus you must specify the –skip-zonal-shift-validation parameter when you enable zonal shift to acknowledge that you understand the risk. However, you can help prevent overload from occurring due to imbalance by using the load balancer’s target_group_health.dns_failover.minimum_healthy_targets.count option and specifying the number of instances that should be present in the AZ. If you’re using three AZs and your desired capacity is 12, then you should set the value to four (which represents one third of the ASGs total capacity). This prevents traffic from being routed to the AZ until there is enough healthy capacity there to handle the load. You may need to dynamically adjust this number as the ASG scales over time. The minimum count you set in the past may not be the right minimum count today.

Zonal shift best practices

As a set of best practices, we recommend that you:

  1. Are pre-scaled to handle the loss of an AZ’s worth of capacity
  2. Configure your impairment policy to ignore unhealthy hosts
  3. Enable cross-zone load balancing

With this configuration, you can also safely use zonal autoshift. When zonal autoshift is enabled, AWS automatically starts and ends the zonal shift on your behalf whenever the AWS telemetry indicates there is an impairment affecting a single AZ. This can be used in conjunction with zonal autoshift for your ELB load balancer. If you are not using zonal autoshift, then you can still use the EventBridge observer notifications to inform your zonal shift decisions or start automated processes. Refer to the EC2 Auto Scaling zonal shift documentation for more details on the full set of best practices when using zonal shift.

Conclusion

In this post we showed you the benefits of using zonal shift with your Amazon EC2 Auto Scaling Groups as part of enhancing your resilience in multi-AZ architectures. We explored several scenarios where zonal shift can be used, and reviewed best practices for using zonal shift safely and effectively. To get started using zonal shift with your ASGs, refer to the documentation.

Reduce your Microsoft licensing costs by upgrading to 4th generation AMD processors

Post Syndicated from aostan original https://aws.amazon.com/blogs/compute/reduce-your-microsoft-licensing-costs-by-upgrading-to-4th-generation-amd-processors/

This post is written by Jeremy Girven, Solutions Architect at AWS. 

Amazon Web Services (AWS) and AMD have collaborated since 2018 to deliver cost effective performance for a broad variety of Microsoft workloads, such as Microsoft SQL Server, Microsoft Exchange Server, Microsoft SharePoint Server, Microsoft Systems Center suite, Active Directory, and many other Microsoft workload use cases. This post shows how the performance improvements of the latest generation AMD-powered Amazon Elastic Compute Cloud (Amazon EC2) instances can help you reduce licensing costs on Microsoft workloads running on AWS.

AWS has been running Microsoft workloads for over 16 years. The most common of these workloads are those running Microsoft Windows Server and Microsoft SQL Server. Both can be brought to AWS using the Bring Your Own License (BYOL) or License Included (provided by AWS) licensing models. Many BYOL licensing restrictions need workloads to be run on dedicated tenancy and need Dedicated Hosts. For these workloads, a license would be needed to cover each physical core of the Dedicated Host (for example if the Dedicated Host has 96 physical cores, 96 licenses would be necessary to cover the host). For License Included EC2 instances, the cost of the associated Microsoft licenses is a per-vCPU fee bundled into the total price of the EC2 instance.

Regardless of which licensing option works best for you, the licensing cost is directly related to the number of virtual cores (vCPUs) or physical cores used by your workloads. Using high-performance processors allows you to potentially reduce the total number of cores necessary to run a workload. Reducing the total number of cores subsequently reduces your total cost of ownership (TCO) by reducing the number of licenses. One potential option available for running Microsoft workloads on AWS are EC2 instances, which use fourth generation processors.

The AWS Nitro EC2 instance families using fourth generation AMD EPYC processors are M7a, C7a, R7a, and Hpc7a. These fourth generation AMD EC2 instances use DDR5 memory to deliver 2.25x more memory bandwidth and up to 50% higher performance as compared with previous generation AMD EC2 instances. For performance-per-watt improvements across integer performance, floating point, and natural language processing (NLP) throughout, these fourth generation AMD EPYC processors offer up to 2.7x greater results than those of previous generation AMD EC2 instances.

AMD has publicly available performance testing comparing the General Purpose M7a instances with the previous generation M6a instances. You can find the information in this link. We wanted to expand their testing to Compute Optimized and Memory Optimized EC2 instances to observe if their results hold true for different instance families.

In the following section we dive into our performance testing methodologies, and we review our results.

Method 1: CPU calculation speed

The following is the configuration of the EC2 instances used for testing:

  • Instance Types: C6a.large and C7a.large (2 vCPUs, 4 GiB Memory, and 30 GiB (3000 IOPS, 125 MB/s) GP3 EBS volume)
  • Operating System: Microsoft Windows Server 2022 Datacenter (10.0.20348 N/A Build 20348)
  • Installed Software: AWS device drivers (NVMe 1.5.1 & ENA 2.7.0), Amazon EC2 Launch Agent v2 (2.0.1981.0), Amazon SSM Agent (3.3.551.0), and PowerShell 7.4.5 (all non-essential software has been removed)
  • AWS Region and AZ: us-west-2 / us-west-2a (usw2-az1)

We performed a direct, yet CPU-intensive math test by calculating prime numbers in a range of 2 through 10,000 using Windows PowerShell (version 7 needed). This runs in a loop ten times, which allows us to use the processing time over all the runs. The following is the code used for testing:

Function Start-PrimeNumberTest {
    [CmdletBinding()]
    param(
        [Parameter(Mandatory = $True)][Int32]$TestRunLimit, #The number of times the test will run in a loop
        [Parameter(Mandatory = $True)][Int32]$UpperNumberRange #The upper number of the range to find prime numbers in (larger the number the longer it takes to process)
    )
    $DoCount = 0
    $NumberRange = 2..$UpperNumberRange
    [System.Collections.ArrayList]$TimeArray = @()
    [System.Collections.ArrayList]$OutputArray = @()
    $vCPUCount = Get-CimInstance -ClassName 'Win32_Processor' | Select-Object -ExpandProperty 'NumberOfLogicalProcessors'
    Do {
        $Time = Measure-Command {
            $Range = $NumberRange
            $Count = 0
            $Range | ForEach-Object -Parallel {
                $Number = $_
                $Divisor = [Math]::Sqrt($Number)
                2..$Divisor | ForEach-Object {
                    If ($Number % $_ -eq 0) {
                        $Prime = $False
                    } Else {
                        $Prime = $True
                    }
                }
                If ($Prime) {
                    $Count++
                    If ($Count % 10 -eq 0) {
                        $Null
                    }
                }
            } -ThrottleLimit $vCPUCount
        }
        $DoCount++
        [void]$TimeArray.Add($Time.TotalSeconds)
        Start-Sleep -Seconds 5
    } Until ($DoCount -eq $TestRunLimit)
    $Output = $TimeArray | Measure-Object -Average -Maximum -Minimum | Select-Object -Property 'Count', 'Average', 'Maximum', 'Minimum'
    [void]$OutputArray.Add("Number of runs                     : $($Output.Count)")
    [void]$OutputArray.Add("Average time to complete (seconds) : $($Output.Average)")
    [void]$OutputArray.Add("Maximum time to complete (seconds) : $($Output.Maximum)")
    [void]$OutputArray.Add("Minimum time to complete (seconds) : $($Output.Minimum)")
    Write-Output $Output
}

To run the code, invoke the function and specify the Test Run Limit and Upper Number Range. For example, the following code mimics our test by finding prime numbers up to 10,000 and run the test 10 times:

Start-PrimeNumberTest -TestRunLimit 10 -UpperNumberRange 10000

Test results: CPU calculation speed

Figure 1. C7a.large and C6a.large performance results over ten tests

Figure 1. C7a.large and C6a.large performance results over ten tests

Although this is a direct CPU performance test, it demonstrates a clear performance advantage of using the latest generation of AMD powered instances as compared with previous generations:

  • Slowest test: The C7a.large was over seven seconds faster than the quickest run on the C6a.large. This is a delta of more than 25% faster in the worst-case scenario for the C7a.large.
  • Fastest test: The C7a.large completed over 13 seconds faster than the C6a.large, showing a 47% faster processing time.
  • Average: There is an 11 second difference in processing time between the two instances. The C7a.large is averaging over 38% faster than the C6a.large.

Price-performance

The latest generation of AMD instances is more expensive than the previous generation. However, when we consider the performance delta between the two instances, using the average test duration length and the on-demand price of both instances in us-west-2, the C7a.large cost $0.000957791 per run to process the workload while the C6a.large cost $0.001352344. The C6a.large costs approximately $0.0004 per second more to process the same workload. Although that might sound small, this cost delta is greater than $12,000 over a 1-year period. These results show the value using the latest generation of AMD powered instances, especially with CPU bound workloads.

Method 2: SQL Server performance

We wanted our second testing method to focus more on real-world applications related to Microsoft workloads. For this test, we wanted to measure SQL Server performance.

SQL Server can be tested with an open source load testing tool called HammerDB. SQL Server is primarily used for OLTP workloads, thus we used the TPROC-C benchmark from HammerDB because it is specifically tailored for OLTP database testing.

The following is the configuration of the EC2 instances used for testing:

  • Instance Types:8xlarge and R6a.8xlarge (32 vCPUs, 256 GiB Memory)
  • Storage: io2 EBS volumes w/ 40,000 IOPS (EC2 instance maximum)
  • SQL Server: Microsoft SQL Server 2022 (RTM-CU14) (KB5038325) – 16.0.4135.4 (X64) Jul 10 2024 14:09:09 Copyright (C) 2022 Microsoft Corporation Enterprise Edition: Core-based Licensing (64-bit) on Windows Server 2022 Datacenter 10.0 <X64> (Build 20348: ) (Hypervisor)
    • Maximum Server Memory: 240 GB
    • Database File Size: 220 GB
    • Database Data Size: 2000 warehouses (~200 GB)
    • MAXDOP: 1

HammerDB creates a test database based on “warehouses.” Each warehouse is approximately 100 MB of data. Our test server used 2000 warehouses, leaving approximately 20 GB for overhead in the 220 GB database file size. The total database size was also purposely sized smaller than the total memory allocated to our SQL Server. This allows SQL Server to cache as much of the database as possible in memory to avoid latency reading from disk.

When testing with Hammer DB, it uses “virtual users” as a method of applying load to the database. Our testing on each EC2 instance started with a small load of 32 virtual users to match the number of virtual users to vCPUs. Tests used a warmup time of five minutes and five minutes of processing. Then, the virtual users were increased by logarithmic scale to apply a larger performance load on the servers. Testing continued until we saw a decline of the of the total Transactions Per Minute (TPM). Three full runs were completed on each EC2 instance to create an average TPM at each level of virtual users.

Test results: SQL Server performance

Figure 2. R7a.8xlarge and R6a.8xlarge average TPM

Figure 2. R7a.8xlarge and R6a.8xlarge average TPM

Figure 3. R7a.8xlarge and R6a.8xlarge average TPM

Figure 3. R7a.8xlarge and R6a.8xlarge average TPM

The R7a.8xlarge consistently outperformed the R6a.8xlarge, even on tests with low load. The most notable difference was a 34% increase in TPM at peak performance. These results are similar to the 32% difference that AMD published when testing the M7a.8xlarge and M6a.8xlarge instances using another OLTP benchmark, TPROC-E.

Cost savings

Our test results are good news if you’re running SQL Server workloads. The ability to process more transactions with the same number of vCPUs translates into needing fewer vCPUs to run your current workloads, thereby lowering the total number of SQL Server licenses in your environment. With SQL Server Enterprise Edition licensing costing over $15,000 per 2-core pack as of this writing, being able to reduce your SQL Server licensing costs could save you hundreds of thousands of dollars for your total cost of ownership.

Conclusion

When evaluating the cost of CPU license-based workloads, such as those available with Microsoft workloads, the results show looking at the price alone isn’t optimal for selecting instances to use for your workloads. Commercial software such as Microsoft’s Windows Server or SQL Server are typically licensed at the vCPU level or the physical core level (BYOL). When dealing with CPU-bound workloads, choosing the instance with the highest performance to price ratio is the best evaluation method.

Author Bio

Jeremy Girven Jeremy Girven

Jeremy is a solutions architect specializing in Microsoft workloads on AWS. He has over 16 years’ experience with Microsoft Active Directory and over 25 years of industry experience. One of his fun projects is using SSM to automate the Active Directory build processes in AWS. To see more, check out the Active Directory AWS Partner Solution (https://aws.amazon.com/solutions/partners/active-directory-ds/).

Efficiently monitor your On Demand Capacity Reservations (ODCR) by Grouping on CloudWatch Dimensions

Post Syndicated from aostan original https://aws.amazon.com/blogs/compute/efficiently-monitor-your-on-demand-capacity-reservations-odcr-by-grouping-on-cloudwatch-dimensions/

This post is written by Ballu Singh, Principal Solutions Architect at AWS, Ankush Goyal, Enterprise Support Lead in AWS Enterprise Support, Hasan Tariq, Principal Solutions Architect with AWS and Ninad Joshi, Senior Solutions Architect at AWS.

The On-Demand Capacity Reservations (ODCR) allows you to reserve compute capacity for your Amazon Elastic Compute Cloud (Amazon EC2) instances in a specific Availability Zone (AZ) for any duration. It makes sure that you always have access to your Amazon EC2 capacity when you need it. This is ideal for users who need to make sure their instances are available during critical events, even when it is stopped and restarted. Users can create ODCR anytime, without the need for a one or three-year term commitment.

In the post Automate the Creation of On-Demand Capacity Reservations for running EC2 instances, we discussed a solution for automating ODCR operations for existing EC2 instances. The post included creating, modifying, and canceling Capacity Reservations. We also showed monitoring Capacity Reservation usage using the Amazon CloudWatch metric InstanceUtilization, which indicates the percentage of reserved capacity currently in use. This metric is essential for effectively monitoring and optimizing your ODCR consumption.

On August 1st, 2024, AWS introduced new CloudWatch dimensions for Amazon EC2 ODCR. Using these enhancements you can now group CloudWatch metrics for ODCR by dimensions, such as InstanceType, AvailabilityZone, InstanceMatchCriteria, InstancePlatform, Tenancy, CapacityReservationId, or across the Capacity Reservations within a selected AWS Region. With these new dimensions, you no longer need to create a new alarm each time a new Capacity Reservation ID (CRID) is added. Furthermore, there is no longer a need to poll ODCR metadata using the describe-capacity-reservations AWS CLI command or API, because this information is now readily available through CloudWatch metrics.

This post shows you how to create CloudWatch alarms for ODCR using these new dimensions. The setup methodology helps you get the information directly in the CloudWatch console instead of having to call the DescribeCapacityReservations API or invoking the describe-capacity-reservationsCLI command.

Summary

  • The Prerequisites section outlines the necessary prerequisites and assumptions that should be completed before implementing the technical steps described later in this post. This includes any accounts, services, permissions, or configurations that need to be set up in advance.
  • The Setup section describes the specific scenario and infrastructure environment assumed for demonstrating the CloudWatch dimensions and alarms discussed in this post.
  • In the Implementation details section, we do a deep dive into the technical implementation, such as code snippets and step-by-step configurations for creating CloudWatch alarms for metric InstanceUtilization grouped by six dimensions outlined earlier.
  • The Cleaning up section provides steps to prevent ongoing charges after experimenting with the infrastructure and alarms created here.
  • Finally, in the Conclusion section, we recap the key points explored around CloudWatch, dimensions, metrics, and alarms. This content can serve as a solid foundation for implementing more advanced monitoring, optimization, and architectural best practices going forward.

Prerequisites

This solution needs you to complete the following prerequisites:

  1. Create Capacity Reservations in your account by following the ODCR Workshop self-paced lab. The solution needs scripts from this lab. If you are using any other Capacity Reservations for this lab, then you must use parameters according to your environment setup (for example AWS Region, AZ, platform, and instance match criteria)
  2. All the code used in this post is publicly available in the accompanying GitHub repository. Refer to the json included in the GitHub repository for the AWS Identity and Access Management (IAM) role permissions for IAM users used in the solution.
  3. Refer to the preceding GitHub repository for the code, and save the txt file in the same directory with other Python scripts. You may want to run the requirements.txt file if you don’t have appropriate dependencies to run the rest of the Python scripts. You can run this using the following command:

pip3 install -r requirements.txt

Setup

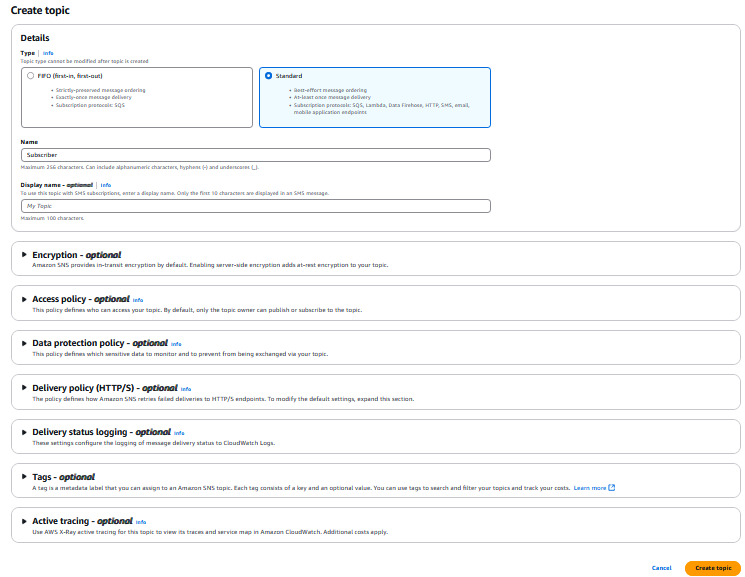
For this post, we have provided Python scripts to create CloudWatch alarms for Capacity Reservation usage metric for ODCR, for example InstanceUtilization. These alarms can be grouped using the new dimensions: InstanceType, AvailabilityZone, InstanceMatchCriteria, InstancePlatform, Tenancy, CapacityReservationId, or across the Capacity Reservations within a selected Region. We also created an Amazon Simple Notification Service (Amazon SNS) topic named ODCRAlarmTopic to notify you when there’s a breach with your CloudWatch alarm’s threshold.

To get started, download the scripts for creating a CloudWatch alarm using each aforementioned dimension from the GitHub repository in the Prerequisites section.

We envision a scenario where multiple Capacity Reservations exist across a Region in your AWS account. The goal is to identify any unused Capacity Reservations to optimize capacity usage and reduce unnecessary charges. Unused capacity can be identified by creating a CloudWatch alarm for the InstanceUtilization metric. The alarm can be grouped by one of six dimensions: AZ, Instance Match Criteria, Instance Type, InstancePlatform, Tenancy, or across the Capacity Reservations. You must set the alarm threshold that aligns to your usage optimization targets.

With Capacity Reservations, charges apply to any unused capacity. Users accept these charges because reservations provide capacity assurance. However, with improved reservation usage, users can make sure their reserved capacity is fully used. A triggered CloudWatch alarm signifies unused capacity. It can notify users to take near real-time action to optimize capacity and eliminate charges for unused reservations.

Implementation details

The following sections show the implementation details of alarms for each dimension.

For each alarm that we create in this section, you can set a threshold based on your usage optimization goals. For this post, we are setting the threshold to 75%. When these alarms are in place and the CloudWatch alarm breaches that threshold, the system enters an alarm state and sends an SNS notification to ODCRAlarmTopic. This process helps identify and address potential issues or opportunities for optimization related to the specific monitored dimension.

Creating CloudWatch alarm using AllCapacityReservations dimension

In this scenario, an organization is currently using the Capacity Reservations at 100% usage, but it needs to be notified when the total capacity usage drops to less than or equal to the threshold value. To do so, we use the InstanceUtilization metric for ODCR and group it with the AllCapacityReservations dimension. You can run the by_all_capacity_reservations.py script provided in the GitHub repository to create this CloudWatch alarm.

Prior to running the script, you must determine the following parameters:

Necessary input parameters

  • RegionName: The Region where the CloudWatch alarm should be created (for example us-east-1).
  • EmailAddress: The email address to receive notifications (for example [email protected]).

Optional input parameters

  • Dimension (default: AllCapacityReservations): The dimension for the CloudWatch alarm.
  • MetricName (default: InstanceUtilization): The metric name for the CloudWatch alarm.
  • ComparisonOperator (default: LessThanOrEqualToThreshold): The comparison operator for the CloudWatch alarm.
  • Threshold (default: 75.0): The threshold value for the CloudWatch alarm.
  • Protocol (default: email): The protocol for the SNS subscription.
  • TopicName (default: ODCRAlarmTopic): The name of the SNS topic.

After you’ve determined your input parameters, run the following Python script with your desired parameters to set up the alarm:

python3 by_all_capacity_reservations.py --RegionName <<Insert here the region where you have the Capacity Reservations>> --EmailAddress <<Insert here the email address subscribed to ODCRAlarmTopic>>

This creates a CloudWatch alarm that monitors InstanceUtilization for the Capacity Reservations in the Region you specified. You can confirm the alarm has been created by reviewing the by_all_capacity_reservations.log created in the same folder where you ran the script from. The following is an example log file content that confirms the creation of the alarm.

2024-10-17 19:32:34,922  __main__  INFO: Creating CloudWatch Alarm for the InstanceUtilization metric with AllCapacityReservations dimension in the us-east-1 region.

2024-10-17 19:32:35,514  __main__  INFO: The SNS topic 'ODCRAlarmTopic' already exists with ARN: arn:aws:sns:us-east-1:XXXXXXXXXXXX:ODCRAlarmTopic.

2024-10-17 19:32:35,516  __main__  INFO: Please ensure you have subscribed to the SNS Topic arn:aws:sns:us-east-1: XXXXXXXXXXXX:ODCRAlarmTopic.

2024-10-17 19:32:35,986  __main__  INFO: Successfully created CloudWatch Alarm for the InstanceUtilization metric with AllCapacityReservations dimension in the us-east-1 region.

You can also validate in the CloudWatch console. Choose All alarms and search for ODCRAlarm-InstanceUtilization-AllCapacityReservations.

Figure 1: Example AllCapacityReservations Alarm Setup validation using CloudWatch console

Figure 1: Example AllCapacityReservations Alarm Setup validation using CloudWatch console

Creating CloudWatch alarm using InstanceType dimension

After receiving an alert on total Capacity Reservations usage dropping below the threshold, you may want to view the usage drop by a specific instance type. To do so you can use the InstanceUtilization metric for ODCR and group it with the InstanceType dimension. You can use the by_instanceType.py script provided in the GitHub repository to create this CloudWatch alarm.

Prior to running the script, you must determine the following parameters:

Necessary input parameters

  • RegionName: The Region where the CloudWatch alarm should be created (for example us-east-1).
  • EmailAddress: The email address to receive notifications (for example [email protected]).
  • InstanceType: The instance type for the CloudWatch alarm (for example t2.micro).

Optional input parameters

  • Dimension (default: InstanceType): The dimension for the CloudWatch alarm.
  • MetricName (default: InstanceUtilization): The metric name for the CloudWatch alarm.
  • ComparisonOperator (default: LessThanOrEqualToThreshold): The comparison operator for the CloudWatch alarm.
  • Threshold (default: 75.0): The threshold value for the CloudWatch alarm.
  • Protocol (default: email): The protocol for the SNS subscription.
  • TopicName (default: ODCRAlarmTopic): The name of the SNS topic.

After you’ve determined your input parameters, run the following Python script with your desired parameters to set up the alarm:

python3 by_instanceType.py --RegionName <<Insert here the region where you have the Capacity Reservations>> --EmailAddress <<Insert here the email address subscribed to the ODCRAlarmTopic>> --InstanceType t2.micro

This should create the InstanceType dimension alarm. You can confirm this by reviewing the by_instanceType.log created in the same folder where you ran the script from. The following is an example log file content that confirms the creation of this alarm.

2024-10-17 19:46:07,288  __main__  INFO: Creating CloudWatch Alarm for the InstanceUtilization metric with InstanceType dimension in the us-east-1 region.

2024-10-17 19:46:07,804  __main__  INFO: The SNS topic 'ODCRAlarmTopic' already exists with ARN: arn:aws:sns:us-east-1:XXXXXXXXXXXX:ODCRAlarmTopic.

2024-10-17 19:46:07,804  __main__  INFO: Please ensure you have subscribed to the SNS Topic arn:aws:sns:us-east-1:XXXXXXXXXXXX:ODCRAlarmTopic.

2024-10-17 19:46:08,285  __main__  INFO: Successfully created CloudWatch Alarm for the InstanceUtilization metric with InstanceType dimension in the us-east-1 region.

You can also validate in the CloudWatch console. Choose All alarms and, for example, search for ODCRAlarm-InstanceUtilization-InstanceType-t2.micro.

Figure 2: Example InstanceType Alarm Setup validation using CloudWatch console

Figure 2: Example InstanceType Alarm Setup validation using CloudWatch console

Creating CloudWatch alarm using AvailabilityZone dimension

After receiving an alert on total Capacity Reservations usage at the instance level dropping below the threshold, you may want to view the usage drop by a specific AZ. You can do so by using the InstanceUtilization metric for ODCR and group it with the AvailabilityZone dimension. You can use the by_availabilityZone.py script provided in the GitHub repository to create this CloudWatch alarm.

Prior to running the script, you must determine the following parameters:

Necessary input parameters

  • RegionName: The Region where the CloudWatch alarm should be created (for example us-east-1).
  • EmailAddress: The email address to receive notifications (for example [email protected]).
  • AvailabilityZone: The AZ for the CloudWatch alarm (for example us-east-1a).

Optional input parameters

  • Dimension (default: AvailabilityZone): The dimension for the CloudWatch alarm.
  • MetricName (default: InstanceUtilization): The metric name for the CloudWatch alarm.
  • ComparisonOperator (default: LessThanOrEqualToThreshold): The comparison operator for the CloudWatch alarm.
  • Threshold (default: 75.0): The threshold value for the CloudWatch alarm.
  • Protocol (default: email): The protocol for the SNS subscription.
  • TopicName (default: ODCRAlarmTopic): The name of the SNS topic.

After you’ve determined your input parameters, run the following Python script with your desired parameters to set up the alarm:

python3 by_availabilityZone.py --RegionName <<Insert here the region where you have the Capacity Reservations>> --EmailAddress <<Insert here the email address subscribed to the ODCRAlarmTopic>> --AvailabilityZone us-east-1b

This should create the AvailabilityZone alarm. You can confirm this by reviewing the by_availabilityZone.log created in the same folder where you ran the script from. The following is an example log file content that confirms the creation of this alarm.

2024-10-17 19:38:39,141  __main__  INFO: Creating CloudWatch Alarm for the InstanceUtilization with AvailabilityZone dimension in the us-east-1 region.

2024-10-17 19:38:39,667  __main__  INFO: The SNS topic 'ODCRAlarmTopic' already exists with ARN: arn:aws:sns:us-east-1:XXXXXXXXXXXX:ODCRAlarmTopic.

2024-10-17 19:38:39,667  __main__  INFO: Please ensure you have subscribed to the SNS Topic arn:aws:sns:us-east-1:XXXXXXXXXXXX:ODCRAlarmTopic.

2024-10-17 19:38:40,172  __main__  INFO: Successfully created CloudWatch Alarm for the InstanceUtilization metric with AvailabilityZone dimension in the us-east-1 region.

You can also validate in the CloudWatch console. Choose All alarms, and search for ODCRAlarm-InstanceUtilization-AvailabilityZone-us-east-1b.

Figure 3: Example AvailabilityZone Alarm Setup validation using CloudWatch console

Figure 3: Example AvailabilityZone Alarm Setup validation using CloudWatch console

Create CloudWatch alarm using the InstancePlatform dimension

Based on workload requirements, organizations use different platforms such as Windows and Linux/UNIX for EC2 instances. They may want to be notified when the usage drops below threshold for a particular platform. To achieve this, we can use the InstanceUtilization metric for ODCR and group it with the InstancePlatform dimension. You can use the by_platform.py script provided in the GitHub repository to create the CloudWatch alarm.

Prior to running the script, you must determine the following parameters:

Necessary input parameters

  • RegionName: The Region where the CloudWatch alarm should be created (for example us-east-1).
  • EmailAddress: The email address to receive notifications (for example [email protected]).
  • InstancePlatform: The InstancePlatform for the CloudWatch alarm. For exampleE: ‘Linux/UNIX’. Supported InstancePlatform are’Linux/UNIX’,’Red Hat Enterprise Linux’,’SUSE Linux’,’Windows’,’Windows with SQL Server’,’Windows with SQL Server Enterprise’,’Windows with SQL Server Standard’,’Windows with SQL Server Web’,’Linux with SQL Server Standard’,’Linux with SQL Server Web’,’Linux with SQL Server Enterprise’,’RHEL with SQL Server Standard’,’RHEL with SQL Server Enterprise’,’RHEL with SQL Server Web’,’RHEL with HA’,’RHEL with HA and SQL Server Standard’,’RHEL with HA and SQL Server Enterprise’,’Ubuntu Pro’

Optional input parameters

  • Dimension (default: InstancePlatform): The dimension for the CloudWatch alarm.
  • MetricName (default: InstanceUtilization): The metric name for the CloudWatch alarm.
  • ComparisonOperator (default: LessThanOrEqualToThreshold): The comparison operator for the CloudWatch alarm.
  • Threshold (default: 75.0): The threshold value for the CloudWatch alarm.
  • Protocol (default: email): The protocol for the SNS subscription.
  • TopicName (default: ODCRAlarmTopic): The name of the SNS topic.

After you’ve determined your input parameters, run the following Python script with your desired parameters to set up the alarm:

python3 by_platform.py --RegionName <<Insert here the region where you have the Capacity Reservations>> --EmailAddress <<Insert here the email address subscribed to the ODCRAlarmTopic>> --InstancePlatform Linux/Unix

This should create the InstancePlatform alarm. You can confirm this by reviewing the by_platform.log created in the same folder where you ran the script from. The following log entry shows a confirmation the creation of this alarm.

2024-10-17 19:52:03,839  __main__  INFO: Creating CloudWatch Alarm for the InstanceUtilization with Platform dimension in the us-east-1 region.

2024-10-17 19:52:04,345  __main__  INFO: The SNS topic 'ODCRAlarmTopic' already exists with ARN: arn:aws:sns:us-east-1:XXXXXXXXXXXX:ODCRAlarmTopic.

2024-10-17 19:52:04,345  __main__  INFO: Please ensure you have subscribed to the SNS Topic arn:aws:sns:us-east-1:XXXXXXXXXXXX:ODCRAlarmTopic.

2024-10-17 19:52:04,854  __main__  INFO: Successfully created CloudWatch Alarm for the InstanceUtilization with Platform dimension in the us-east-1 region.

You can also validate in the CloudWatch console. Choose All alarms, and search for ODCRAlarm-InstanceUtilization-Platform-Linux/Unix.

Figure 4: Example AvailabilityZone Alarm Setup validation using CloudWatch console

Figure 4: Example AvailabilityZone Alarm Setup validation using CloudWatch console

Creating CloudWatch alarm using the InstanceMatchCriteria dimension

Capacity Reservations are configured as either open or targeted. If the Capacity Reservation is open, then the new and existing instances that have matching attributes automatically run in the capacity of the Capacity Reservation. If the Capacity Reservation is targeted, then instances must specifically target it to run in the reserved capacity. Organizations using these configurations may want to be notified when instance usage drops in either open or targeted Capacity Reservations. To achieve this, we use the InstanceUtilization metric for ODCR and group it with the InstanceMatchCriteria dimension. You can use the by_instanceMatchCriteria.py script provided in the GitHub repository to create the CloudWatch alarm.

Prior to running the script, you must determine the following parameters:

Necessary input parameters

  • RegionName: The Region where the CloudWatch alarm should be created (for example us-east-1).
  • EmailAddress: The email address to receive notifications (for example [email protected]).
  • InstanceMatchCriteria: The tenancy for the CloudWatch alarm. Supported values are ‘open’ and ‘targeted’.

Optional input parameters

  • Dimension (default: InstanceMatchCriteria): The dimension for the CloudWatch alarm.
  • MetricName (default: InstanceUtilization): The metric name for the CloudWatch alarm.
  • ComparisonOperator (default: LessThanOrEqualToThreshold): The comparison operator for the CloudWatch alarm.
  • Threshold (default: 75.0): The threshold value for the CloudWatch alarm.
  • Protocol (default: email): The protocol for the SNS subscription.
  • TopicName (default: ODCRAlarmTopic): The name of the SNS topic.

After you’ve determined your input parameters, run the following Python script with your desired parameters to set up the alarm:

python3 by_instanceMatchCriteria.py --RegionName <<Insert here the region where you have the Capacity Reservations>> --EmailAddress <<Insert here the email address subscribed to the ODCRAlarmTopic>> --InstanceMatchCriteria open

This should create the InstanceMatchCriteria alarm. You can confirm this by reviewing the by_instanceMatchCriteria.log created in the same folder where you ran the script from. The following log entry confirms the creation of such alarm.

2024-10-17 19:43:25,463  __main__  INFO: Creating CloudWatch Alarm for the InstanceUtilization with InstanceMatchCriteria dimension in the us-east-1 region.

2024-10-17 19:43:25,996  __main__  INFO: The SNS topic 'ODCRAlarmTopic' already exists with ARN: arn:aws:sns:us-east-1:XXXXXXXXXXXX:ODCRAlarmTopic.

2024-10-17 19:43:25,996  __main__  INFO: Please ensure you have subscribed to the SNS Topic arn:aws:sns:us-east-1:XXXXXXXXXXXX:ODCRAlarmTopic.

2024-10-17 19:43:26,552  __main__  INFO: Successfully created CloudWatch Alarm for the InstanceUtilization metric with InstanceMatchCriteria dimension in the us-east-1 region.

You can also validate in the CloudWatch console. Choose All alarms, and search for ODCRAlarm-InstanceUtilization-InstanceMatchCriteria-open.

Figure 5: Example InstanceMatchCriteria Alarm Setup validation using CloudWatch console

Figure 5: Example InstanceMatchCriteria Alarm Setup validation using CloudWatch console

Creating CloudWatch alarm using the Tenancy dimension

By default, EC2 instances run on shared tenancy hardware. However, if users want, they can also choose dedicated tenancy. Organizations using both types of tenancy for their workload may want to be notified when instance usage drops in either of these tenancies. To achieve this, we use the InstanceUtilization metric for ODCR and group it with the Tenancy dimension. You can run the by_tenancy.py script provided in the GitHub repository to create the CloudWatch alarm.

Prior to running the script, you must determine the following parameters:

Necessary input parameters

  • RegionName: The Region where the CloudWatch alarm should be created (for example us-east-1).
  • EmailAddress: The email address to receive notifications (for example [email protected]).
  • Tenancy: The tenancy for the CloudWatch alarm. Supported Tenancy are ‘default’ and ‘dedicated’.

Optional input parameters

  • Dimension (default: Tenancy): The dimension for the CloudWatch alarm.
  • MetricName (default: InstanceUtilization): The metric name for the CloudWatch alarm.
  • ComparisonOperator (default: LessThanOrEqualToThreshold): The comparison operator for the CloudWatch alarm.
  • Threshold (default: 75.0): The threshold value for the CloudWatch alarm.
  • Protocol (default: email): The protocol for the SNS subscription.
  • TopicName (default: ODCRAlarmTopic): The name of the SNS topic.

After you’ve determined your input parameters, run the following Python script with your desired parameters to set up the alarm:

python3 by_instanceMatchCriteria.py --RegionName <<Insert here the region where you have the Capacity Reservations>> --EmailAddress <<Insert here the email address subscribed to the ODCRAlarmTopic>> --Tenancy default

This should create the Tenancy dimension alarm successfully. You can confirm this by reviewing the by_tenancy.log created in the same folder where you ran the script from. The following entry confirms the creation of the alarm.

2024-10-17 19:56:14,331  __main__  INFO: Creating CloudWatch Alarm for the InstanceUtilization with Tenancy dimension in the us-east-1 region.

2024-10-17 19:56:14,809  __main__  INFO: The SNS topic 'ODCRAlarmTopic' already exists with ARN: arn:aws:sns:us-east-1:XXXXXXXXXXXX:ODCRAlarmTopic.

2024-10-17 19:56:14,810  __main__  INFO: Please ensure you have subscribed to the SNS Topic arn:aws:sns:us-east-1:XXXXXXXXXXXX:ODCRAlarmTopic.

2024-10-17 19:56:15,287  __main__  INFO: Successfully created CloudWatch Alarm for the InstanceUtilization with Tenancy dimension in the us-east-1 region.

You can also validate in the CloudWatch console. Choose All alarms and search for ODCRAlarm-InstanceUtilization-Tenancy-default.

Figure 6: Example Tenancy Dimension Alarm Setup validation using CloudWatch console

Figure 6: Example Tenancy Dimension Alarm Setup validation using CloudWatch console

Other options

As of this post’s publication, there is no native support to create a CloudWatch alarm on two dimensions. However, you can create a custom CloudWatch metric and create an alarm on that metric.

Cleaning up

If you used the ODCR workshop to create Capacity Reservations in your account, then follow the Clean-up step of the workshop to delete the Capacity Reservations and EC2 instances to stop incurring any charges. If you created any other EC2 instances or Capacity Reservations for this post, terminate those EC2 instances and cancel those Capacity Reservations.

To delete the alarms you created in this post, follow these steps given in the CloudWatch documentation.

Conclusion

In this post, we explored how to use the new Amazon CloudWatch dimensions for Amazon EC2 ODCR to efficiently monitor and maintain constant Capacity Reservations and achieve a higher level of usage, thereby saving costs associated with unused capacity. By automating the creation of CloudWatch alarms for Capacity Reservation usage metrics, specifically InstanceUtilization, you can gain more granular insights into your reserved capacity. This includes grouping metrics by Instance Type, Availability Zone, Platform, Instance Match Criteria, Tenancy, or across the Capacity Reservations in a Region.

We also used an Amazon SNS topic to receive near-real time alerts when thresholds are breached. These tools enable you to effectively monitor and optimize your ODCR usage, making sure that you maintain efficient and cost-effective capacity management during critical events.

For more details, refer to the updated Capacity Reservations documentation. If you have any questions or feedback, feel free to share them in the comments section or contact AWS Support.

Author Bios

Ballu Singh

Ballu Singh

Ballu Singh is a Principal Solutions Architect at AWS. He lives in the San Francisco Bay area and helps users architect and optimize applications on AWS. In his spare time, he enjoys reading and spending time with his family.

Ankush Goyal

Ankush Goyal

Ankush is an Enterprise Support Lead in AWS Enterprise Support who helps Enterprise Support users streamline their cloud operations on AWS. He enjoys working with users to help them design, implement, and support cloud infrastructure. He is a results-driven IT professional with over 20 years of experience.

Hasan Tariq

Hasan Tariq

Hasan Tariq is a Principal Solutions Architect with AWS. He helps Financial Services users accelerate their adoption of the AWS Cloud by providing architectural guidelines to design innovative and scalable solutions.

Ninad Joshi

Ninad Joshi

Ninad Joshi is a Senior Solutions Architect at AWS, helping global AWS users design secure, scalable, and cost-effective solutions in cloud to solve their complex real-world business challenges. Ninad specializes in AI/ML and Generative AI. Prior to joining AWS, Ninad worked as a software developer for 13+ years. Outside of his professional endeavors, Ninad enjoys playing chess and exploring different gambits.


Retaining Optimize CPUs configuration during Amazon EC2 scaling to save on licensing costs

Post Syndicated from aostan original https://aws.amazon.com/blogs/compute/retaining-optimize-cpus-configuration-during-amazon-ec2-scaling-to-save-on-licensing-costs/

Introduction

Amazon Elastic Compute Cloud (Amazon EC2) now lets you modify CPU configurations after an instance has launched. With this new feature, users can change instance CPU settings either by directly modifying the CPU configuration, or when changing instance size or type. You can now specify a custom number of CPUs and/or disable simultaneous multithreading (SMT) also known as hyper-threading (HT), for workloads where HT doesn’t provide performance improvement. These capabilities help Bring Your Own license (BYOL) users to optimize their CPU-based licensing costs. For more details on supported instance types, core count, and threads per core values available for each instance type, refer to the supported CPU options for Amazon EC2 instance type documentation.

Why CPU configuration matters for different workloads?

One of our users recently faced a significant challenge when their SQL Server licensing costs unexpectedly increased after scaling their EC2 instances to the next size up. This increase occurred because the Optimized CPUs feature, which can be configured to enable a custom number of CPUs to disable HT so that they can save on SQL Server BYOL licensing costs, was reset during scaling. As a result, this user quadrupled (as opposed to doubled) their licensing requirements when scaling from r7i.xlarge to r7i.2xlarge. Initially, we recommended creating a new Amazon Machine Image (AMI) and launching a new instance with the desired CPU configurations. But this approach introduced complications such as creating new AMIs, moving Amazon Elastic Block Store (Amazon EBS) volumes, and managing security groups. The user wanted a solution that would allow them to scale their workloads seamlessly without these complexities. After working backward from this and other user requirements, we are excited to bring the capability to retain the Optimized CPU configuration during scaling. This reassures you that your licensing costs are as you would expect (for example increase or decrease linearly with your instance size).

An Optimized CPU can reduce your per-CPU licensing costs by 50% by disabling HT, as long as doing so doesn’t affect application performance. You can save more by selectively disabling additional cores based on your specific workloads. Example workloads include, but are not limited to the following:

  • Compute-intensive workloads (for example scientific computing, simulations), which often perform better with one thread per core rather than two threads per core.
  • Database workloads (for example SQL Server) where reducing the thread count to one per core typically does not impact performance, because these workloads need more memory and storage but are less dependent on a high number of CPUs. For more details, refer to Optimize CPU best practices for SQL Server workloads.
  • High-performance computing (HPC) workloads, which sometimes perform better without HT because it can cause performance degradation because of context switching.

Three ways to set or modify CPU configurations

First, you can modify the EC2 instance configuration on an instance that is stopped after launch by modifying CPU Options:

  1. Go to the EC2 Dashboard: Log in to your AWS Management Console and go to the EC2 dashboard.
  2. Choose the Instance: Choose the EC2 instance that you want to modify from the list.
  3. Stop the Instance: In the Instance State dropdown, choose Stop Instance.
  4. Change CPU Options: In the Actions dropdown, choose Instance Settings, and choose Change CPU Options. You should observe the box shown in Figure 1.
  5. Configure CPU Settings:

a. Adjust the number of CPU cores (for example the dropdown box to the left of core(s))

b. Set the number of threads per core to 1 so that you disable HT (for example the dropdown box to the left of thread(s) per CPU core)

  1. Apply the Changes: When your desired CPU configuration is set, choose Apply to save the settings.

Changing CPU options after instance launch

Figure 1: Changing CPU options after instance launch

Second, you can also modify the CPU configuration during an instance size or type change:

  1. Select the Instance: From the EC2 dashboard, choose the instance to modify.
  2. Stop the Instance: In the Instance State dropdown, choose Stop Instance.
  3. Change Instance Type: In Actions, choose Instance Settings, then choose Change Instance Type. You should observe the box shown in Figure 2.
  4. Configure CPU Options: While changing the instance type, you can also:

a. Adjust the number of CPU cores (for example the dropdown box to the left of core(s))

b. Set the number of threads per core to 1 so that you disable HT (for example the dropdown box to the left of thread(s) per CPU core)

  1. Apply Changes: When configured, apply the changes.

Specifying CPU options during instance size or type change

Figure 2: Specifying CPU options during instance size or type change

Finally, you can use the CLI, API, or SDK method to configure the core count and threads per core for your instance using the new command modify-instance-cpu-options:

aws ec2 modify-instance-cpu-options --core-count "2" --threads-per-core "1" --instance-id "i-<your-instance-id>"

License tracking with optimized CPUs in AWS License Manager

You can effectively track your license usage by enabling the vCPU Optimization feature for self-managed license configuration within AWS License Manager. This feature integrates with Amazon EC2 CPU optimization, which lets you track the number of vCPUs on an instance. When the vCPU Optimization rule is set to True, License Manager counts vCPUs based on your customized core and thread count. Otherwise, it counts the default number of vCPUs for the instance type, which may not reflect your optimized CPU settings.

Conclusion

The ability to modify CPU configurations after an EC2 instance launch offers flexibility and efficiency for managing your workloads. You can adjust CPU cores, threads per core, and change instance types or sizes while retaining custom CPU settings without creating a new instance. This feature helps optimize performance, reduce licensing costs, and streamline operations.

Start using this new functionality today to improve the efficiency and scalability of your EC2 instances!

To learn more about CPU options on Amazon EC2, check out this guide, and Optimize CPU best practices for SQL Server workloads.

Author Bio

Rafet-Ducic

Rafet Ducic

Rafet Ducic is a Senior Solutions Architect at Amazon Web Services (AWS). He applies his more than 20 years of technical experience to help Global Industrial and Automotive users transition their workloads to the cloud cost-efficiently and with optimal performance. With domain expertise in Database Technologies and Microsoft licensing, Rafet is adept at guiding companies of all sizes toward reduced operational costs and top performance standards.

The attendee’s guide to the AWS re:Invent 2024 Compute track

Post Syndicated from aostan original https://aws.amazon.com/blogs/compute/the-attendees-guide-to-the-aws-reinvent-2024-compute-track/

From December 2nd to December 6th, AWS will hold its annual premier learning event: re:Invent. At this event, attendees can become stronger and more proficient in any area of AWS technology through a variety of experiences: large keynotes given by AWS leaders, smaller innovation talks and interactive working sessions given by AWS experts, and fun activities such as live music and games at re:Play.

There are over 2000+ learning sessions that focus on specific topics at various skill levels, and the compute team have created 72 unique sessions for you to choose. There are many sessions you can choose from, and we are here to help you choose the sessions that best fits your needs. Even if you are not able to join in person, you can catch-up with many of the sessions on-demand and even watch the keynote and innovation sessions live.

The Basic: Session types

If you’re able to join us, just a reminder that we offer several types of sessions which can help maximize your learning in a variety of AWS topics.

re:Invent attendees can also choose to attend chalk-talks, builder sessions, workshops, or code talk sessions. Each of these are live non-recorded interactive sessions.

  • Breakout sessions: Attendees will be in a lecture-style 60-minute informative sessions presented by AWS experts, customers, or partners. These sessions are recorded and uploaded a few days after to the AWS Events YouTube channel.
  • Chalk-talk sessions: Attendees will interact with presenters, asking questions and using a whiteboard in session.
  • Builder Sessions: Attendees participate in a one-hour session and build something.
  • Workshops sessions: Attendees join a two-hour interactive session where they work in a small team to solve a real problem using AWS services.
  • Code talk sessions: Attendees participate in engaging code-focused sessions where an expert leads a live coding session.
  • Lightning talk sessions: Attendees watch a 20-minute demo dedicated to either a specific service or customer story (located in the Expo Hall).

Getting started with Amazon EC2

The foundation of compute in AWS is Amazon Elastic Compute Cloud (Amazon EC2). Amazon EC2 offers the broadest and deepest compute platform, with over 800 instances and choice of the latest processor, storage, networking, operating system, and purchase model to help you best match the needs of your workload. We’ve created the following sessions to help you implement and manage your workloads in Amazon EC2.

  • CMP101 | What’s new with Amazon EC2
    Learn about the latest compute innovations from AWS. This session helps you better understand Amazon EC2 instances and how organizations like yours can use them to run any workload while meeting your cost, performance, and sustainability goals.
  • CMP343 | Select and launch the right instance for your workload and budget
    With more than 800 instances for various use cases, including instances best for common workloads and for workloads with specific requirements, how do you choose instances? Learn how to determine which instance is best for your specific use case and budget.
  • CMP319 | Managing Amazon EC2 capacity and availability
    Amazon EC2 offers a variety of capacity usage and reservation models, so you can choose the right combination for your workload and budget. Learn how to combine these models in a way that’s best for your business and manage your capacity to improve utilization and availability.
  • CMP207 | AWS-accelerated computing enables customer success with generative AI
    Discover how AWS provides the most performant, low-cost infrastructure for building and scaling large-scale generative AI models. Come learn what’s new in the accelerated computing portfolio including our GPU-based and AWS AI chips-powered instances.
  • CMP318 | Choose the optimal compute environment for your AI/ML workloads
    If you’re trying to decide between accelerators such as AWS Inferentia and AWS Trainium, GPUs from NVIDIA and AMD, processors such as AWS Graviton, or managed services such as Amazon Bedrock and Amazon SageMaker, this chalk covers the different options available on AWS.

Learn about AWS compute innovations

AWS has invested years designing custom silicon optimized for the cloud to deliver the best price performance for a wide range of applications and workloads using AWS services. Learn more about the AWS Nitro System, processors at AWS, and ML chips.

The AWS Nitro System is a rich collection of building block technologies that are powering the recent and future generations of Amazon EC2 instances. Dive deep into the Nitro System and see how it made the seemingly impossible possible.

Generative AI promises to revolutionize industries, but its immense computational demands and escalating costs pose significant challenges. To overcome these hurdles, AWS designed and purpose-built AI chips including AWS Trainium2 and AWS Inferentia2.

Optimize your compute costs

At AWS, we focus on delivering the best possible cost structure for our customers. Frugality is one of our founding leadership principles. Cost effective design continues to shape everything we do, from how we develop products to how we run our operations. Come learn of new ways to optimize your compute costs through AWS services, tools, and optimization strategies in the following sessions:

Maximize you workload’s performance

Your workload’s performance matters beyond just cost because it directly impacts the quality, efficiency, and effectiveness of your compute solution. It can significantly influence customer satisfaction, business growth, and overall productivity. Even if a cheaper option exists, a low-cost option with poor performance can lead to long-term financial losses due to issues such as lost customers, engineering rework, and negative reputation. We have a number of sessions that help you optimize your workload’s performance.

  • CMP411 | Everything you’ve wanted to know about performance on EC2 instances
    This session covers all the details you’ve always wanted to know to optimize your compute performance such as memory topology, accessing hardware counters, accounting for the side-effects of hyperthreading, properly running performance tests, and optimizing your latency.
  • CMP413 | Moving from naive benchmarking to application performance engineering
    Most of the time, benchmarks aren’t representative of their applications’ behaviors. In this session, learn the tools and best practices that will help you understand your applications’ performance behaviors on Amazon EC2 instances so that you can maximize your performance.
  • CMP405 | How to optimize latency and throughput
    The availability of processors with and without hyperthreading makes performance evaluation a tricky game. In this code talk, study a web application and evaluate its performance in various scenarios, and discover how to optimize throughput and latency along the way.

Customer experiences and applications with machine learning

Machine learning (ML) has been evolving for decades and has an inflection point with generative AI applications capturing widespread attention and imagination. More customers, across a diverse set of industries, choose AWS compared to any other major cloud provider to build, train, and deploy their ML applications. Learn about generative AI infrastructure at Amazon or get hands-on experience building ML applications through our ML focused sessions, such as the following:

Accelerate your AWS Graviton adoption journey

The AWS Graviton Processors are custom designed server processors designed by AWS. They deliver the best price performance for your cloud workloads running in AWS, and help you reduce your carbon footprint. Ready to realize up to 40% better price performance for your workloads? We have curated the following session to help you accelerate your Graviton adoption:

  • CMP305 | Learnings from developers adopting AWS Graviton at scale
    In this chalk talk, engage directly with AWS specialists that help customers on a daily basis with their adoption journey—from workload selection to running at scale in production. Explore AWS Graviton use cases, best practices, performance, and customer success stories.
  • CMP310 | Migrating applications to AWS Graviton on Amazon EKS
    During this hands-on workshop, walk through the steps for migrating a workload running on x86 to AWS Graviton-based instances including performing tests locally and modifying the CI/CD pipeline to build and deploy the application in Amazon EKS using Karpenter.
  • CMP316 | AWS Graviton GameDay: Optimize your Amazon EC2 workload with Graviton
    Ready to learn more about AWS Graviton in an immersive environment? In this team-based gamified learning setting, perform a live migration of your workload to Graviton. You learn how to unlock Graviton’s full price-performance potential and optimize the size of an Amazon EC2 fleet.
  • CMP404 | Exploring performance analysis with AWS Graviton instances
    In this session, AWS experts open a shell on an Amazon EC2 instance and dig into the system to see which tools and resources you can use, including the Amazon Aperf tool. Learn as they write some mini-applications to study their performance behavior and how to improve them.

Check out workload-specific sessions

Amazon EC2 offers the broadest and deepest compute platform to help you best match the needs of your workload. More SAP, high performance computing (HPC), ML, and Windows workloads run on AWS than any other cloud. Join sessions focused around your specific workload to learn about how you can leverage AWS solutions to accelerate your innovations.

Ready to unlock new possibilities?

The AWS Compute team looks forward to seeing you in Las Vegas. Come meet us at the Compute Booth in the Expo and check out our various Amazon EC2 demos. And if you’re looking for more session recommendations, check-out additional re:Invent attendee guides curated by experts.