We all know the panic when the print system goes down. As I’ve written about before, PaperCut NG is a fantastic tool for managing printing, but even the best software needs a watchful eye to prevent unexpected downtime.
That’s why I’m excited to share a Zabbix template I developed that keeps a close, proactive check on your PaperCut environment. This isn’t about diving into complicated server logs, it’s about making your IT life easier by giving you clear, actionable alerts when printers start to go sideways.
The power of proactive monitoring
Why monitor your print server? It boils down to a few key points:
Stop Downtime Before It Starts: Imagine getting an alert that your database connection is shaky before users start complaining they can’t print. That’s the power of proactive monitoring.
Ensure Service Availability: PaperCut is critical for tracking costs, enforcing policies, and keeping things running smoothly. This template ensures the core service is always running smoothly.
Peace of Mind: Instead of manually checking system status pages, Zabbix becomes your automated, tireless assistant, ready to notify you instantly if there’s an issue.
What does the template monitor?
We have designed this template to focus on the key components that keep PaperCut NG running smoothly, using its built-in HTTP health checks to gather simple ‘yes/no’ answers about the system’s state.
Think of it as an automated checklist that runs every few minutes, reporting back on the most crucial parts of the service:
Application health: Is the main PaperCut service actually running and responding? (The most critical check!)
Database connectivity: PaperCut relies entirely on its database. We monitor to make sure the connection is solid and ready to log print jobs.
Printer status checks: We keep an eye on the printers themselves to ensure they are online and ready to accept print jobs, preventing user frustration from offline devices.
If any of these essential checks fail, Zabbix immediately raises a problem, allowing you or your team to jump in and fix the issue before the print queues fill up or staff can’t release their documents. Of course these are only some of the checks we have added.
Getting started is simpler than you think
You don’t need to be a Zabbix expert to start using this. The entire setup is focused on leveraging Zabbix’s powerful HTTP Agent capabilities, meaning you don’t need to install any extra software on your PaperCut server – just configure the right settings.
Here’s the high-level, non-technical process, fully detailed in the provided documentation:
Import the template: Download the template-papercut-http.yaml file and import it directly into your Zabbix server.
Add your PaperCut server: Create a new host in Zabbix representing your PaperCut server.
Link the template: Attach the newly imported PaperCut template to your host.
Configure access: The final step involves setting a simple, secure URL and a few configuration macros in Zabbix to tell the template where to check the PaperCut health status.
This template is open source and ready for you to implement, starting from Zabbix 7.0. It’s a great example of how simple, focused monitoring can save significant time and stress in a busy IT environment.
This project is a contribution from me, developed and made available through OpenSource ICT Solutions (OICTS). We believe in sharing simple, effective solutions to common IT challenges.
You can find the template and documentation on GitHub: OpensourceICTSolutions/ZabbixPapercutNG. Download it, test it, and let us know how it helps keep your printing infrastructure running smoothly!
If you need assistance with the migration or want to ensure best practices for scaling and optimizing Zabbix, don’t hesitate to reach out to OICTS. We are a Zabbix Premium Partner operating globally, with offices in the USA, UK, theNetherlands, and Belgium, and we’re ready to help you every step of the way.
In most organizations, printing is an essential but often invisible service. When it works, nobody notices. When it fails, productivity stalls. That’s why monitoring your print environment is just as important as monitoring servers, databases, or network devices.
At Opensource ICT Solutions, we specialize in turning complex systems into observable services. One recent example is our integration of PaperCut NG with Zabbix. This allows IT teams to track the health of their print infrastructure in real-time — everything from server resources to individual printers and devices.
Why monitoring PaperCut matters
PaperCut NG does much more than queue print jobs. It enforces quotas, integrates with authentication systems, and manages fleets of devices. If the database runs out of connections, the disk fills up, or the license expires, users feel the impact instantly.
By integrating PaperCut with Zabbix, we make these risks visible long before they become business problems. The result is:
Proactive detection of printer errors, low toner, or license issues.
Capacity planning through trend analysis of disk usage, memory, and DB connections.
Unified visibility — PaperCut health checks appear right alongside servers, networks, and applications in Zabbix dashboards.
How the integration works
The magic happens through the PaperCut System Health API and Zabbix’s flexible data collection methods.
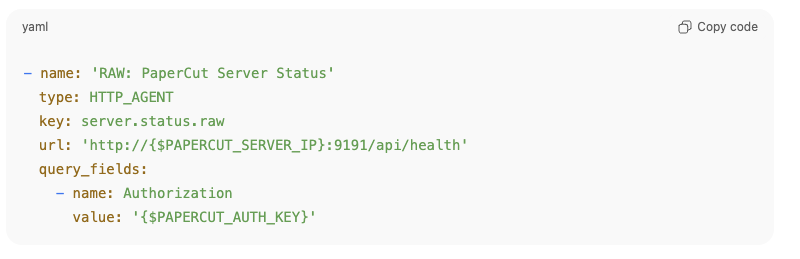
HTTP agent items
Zabbix fetches raw JSON data directly from PaperCut using an HTTP agent item, such as:
This single call provides a full snapshot of server health.
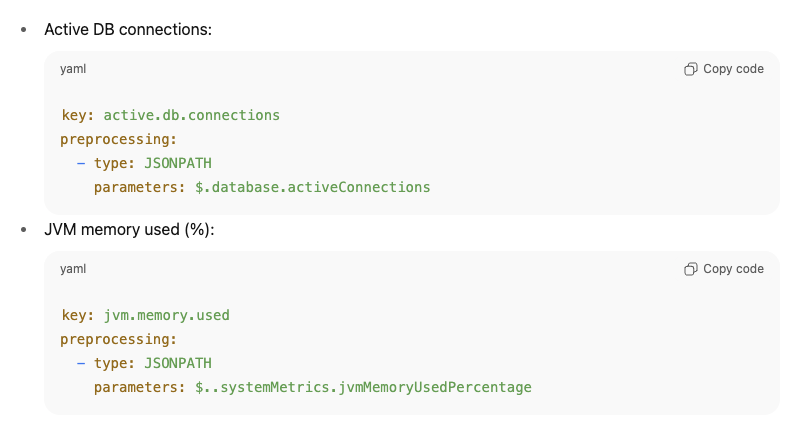
Dependent items + JSONPATH
Instead of hammering the API with multiple requests, we extract the needed fields using dependent items with JSONPATH preprocessing.
For example:
This design means one request can populate dozens of metrics, keeping monitoring both efficient and lightweight.
Calculated items
Some values aren’t directly available from PaperCut. In those cases, we create calculated items inside Zabbix.
For example, the percentage of active DB connections is derived as:
This allows us to set intelligent triggers like “DB connections > 90%” without requiring PaperCut to calculate it for us.
Low-level discovery (LLD) for devices and printers
Perhaps the most powerful part of this integration is automatic discovery.
Printer LLD → Queries /api/health/printers and creates items and triggers per printer. If a printer goes into Paper Jam or No Toner, Zabbix knows immediately.
Device LLD → Queries /api/health/devices and builds items dynamically for each discovered device, tracking states like OK, WARNING, or ERROR.
This ensures that new printers and devices are monitored automatically — no manual configuration required!
Why this matters
Bringing all of this together, the integration turns PaperCut NG into a fully observable service inside Zabbix.
Efficiency → One API call, dozens of metrics.
Scalability → Automatic discovery of printers and devices.
Robustness → Alerts and dashboards for licenses, resources, and print queues.
For IT teams, this means fewer surprises, faster troubleshooting, and more confidence in a service that often goes unnoticed until it fails.
Our expertise
This PaperCut integration is just one example of how we at Opensource ICT Solutions help organizations unlock the full potential of Zabbix. We don’t just install monitoring – we design intelligent, scalable integrations that make hidden systems visible. Whether it’s print management, databases, custom applications, or network devices, we know how to extend Zabbix to fit your environment and give you the insights that matter most.
Running a monitoring platform like Zabbix in a production environment demands reliability and resilience. When your monitoring solution is down, you’re flying blind – and for many organizations, that simply isn’t acceptable. This post introduces a robust high-availability (HA) architecture for Zabbix, using PostgreSQL, Patroni, etcd, HAProxy, keepalived and PgBackRest. Built on RHEL 9 or derrivates, this solution combines modern open-source tools to provide automatic failover, load balancing, and seamless monitoring, all while maintaining consistency and performance.
Architecture overview
The HA design consists of multiple layers working in tandem to maintain continuity even during node or service failures:
Database Cluster Layer
2 or more nodes form the PostgreSQL cluster, managed by Patroni and coordinated using etcd. At any given time, one node is the primary (read/write), and the others are hot standbys ready to take over automatically.
Consensus layer
etcd runs on the same nodes and acts as the distributed configuration store and coordination layer for Patroni. It ensures a consistent cluster state and enables safe failover decisions.
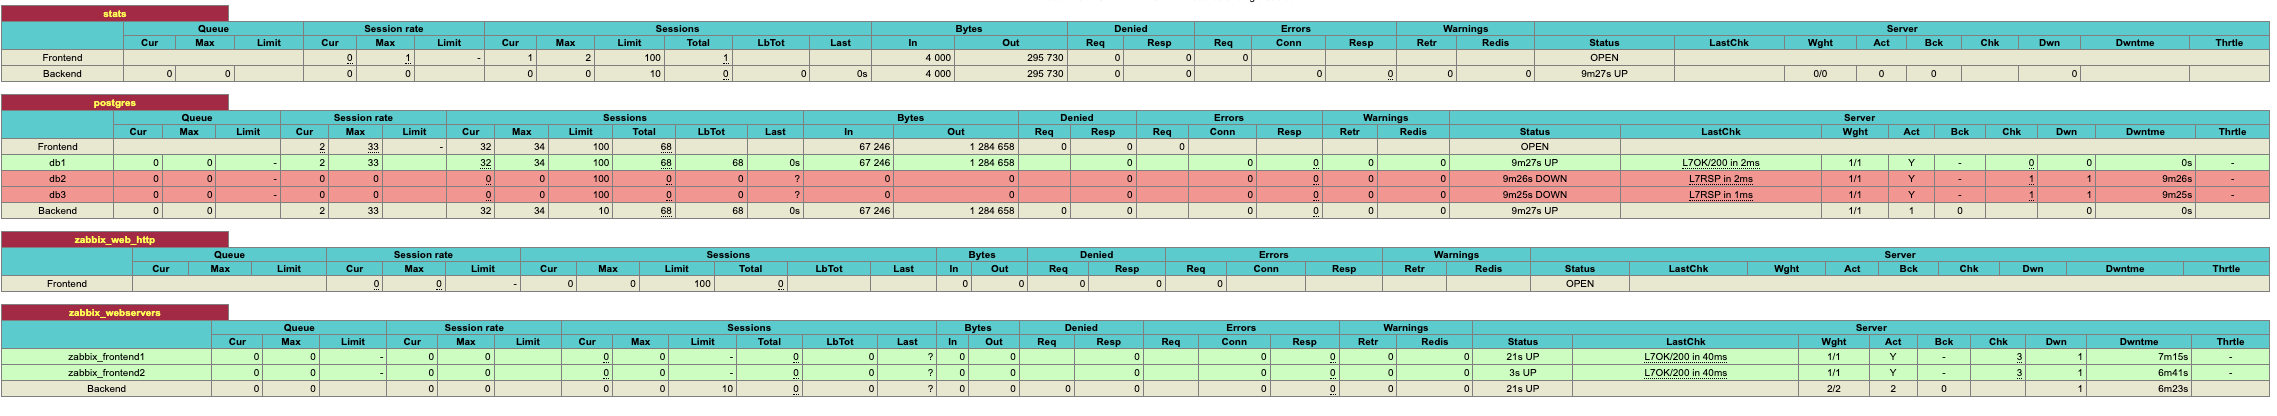
Load balancing layer
Two HAProxy nodes provide a single point of entry for all clients (including Zabbix), routing requests to the current PostgreSQL primary. These nodes are monitored and coordinated via Keepalived to maintain a floating Virtual IP (VIP), ensuring seamless failover at the connection layer.
Backup layer
A separate backup server is responsible for running PgBackRest, which handles full and incremental backups, WAL archiving, and Point-In-Time Recovery (PITR). This server communicates securely with all database nodes over SSH.
Monitoring layer
Two Zabbix servers, running in active-passive mode, continuously monitor all layers of this stack including the HAProxy health, Patroni cluster role, and etcd status by accessing the PostgreSQL VIP for backend connectivity.
This multi-tiered setup ensures that no single failure be it a database, load balancer, or monitoring server brings down the monitoring platform.
Why HA matters for Zabbix
Zabbix depends heavily on its PostgreSQL database backend. Every metric, trigger, event, and alert is stored there. If PostgreSQL becomes unavailable, even briefly, data loss or monitoring blind spots can occur. That’s why introducing HA at the database layer is a crucial step when scaling Zabbix for enterprise environments.
While Zabbix itself supports HA at the application level, this architecture ensures that the database backend is also fully fault-tolerant, using modern consensus-based clustering with automatic failover.
Component overview
To achieve HA, we bring together several specialized components, each fulfilling a critical role in the system:
PostgreSQL
The relational database engine used by Zabbix. In this example setup, it runs on three nodes, forming a cluster managed by Patroni.
Patroni
Patroni is the orchestrator for the PostgreSQL cluster. It monitors node health, manages replication, promotes standbys when needed, and ensures only one writable leader exists at any time. Patroni leverages a distributed consensus store in this case, etcd but other DCS’s are possible to coordinate decisions across the cluster.
etcd
etcd is a lightweight and highly available key-value store used by Patroni to maintain the cluster’s state. It stores leader election data, health statuses, and locks. We deploy it as a three-node cluster, co-located with the PostgreSQL nodes for convenience, though this setup can be scaled independently if needed as etcd is very latency prone.
HAProxy
To simplify application connectivity, HAProxy acts as a load balancer in front of the database cluster. It monitors the role of each node using Patroni’s REST API and routes connections to the active primary server. If the leader fails, HAProxy automatically reroutes traffic to the new primary.
Keepalived
Keepalived provides a floating virtual IP address (VIP) across the HAProxy nodes. This VIP allows client systems, such as the Zabbix frontend, to connect to a single stable IP even if one HAProxy node fails.
PgBackRest
To protect the data itself, we use PgBackRest for full and incremental backups, as well as Point-In-Time Recovery (PITR). A dedicated backup server is included to pull and store archive logs and backups securely via SSH.
Zabbix server
Finally, we run two Zabbix servers in active-passive mode. Both are configured to connect to the PostgreSQL cluster through the VIP exposed by HAProxy. The Zabbix frontend is deployed on both nodes as well, ensuring continued accessibility through the load-balanced setup.
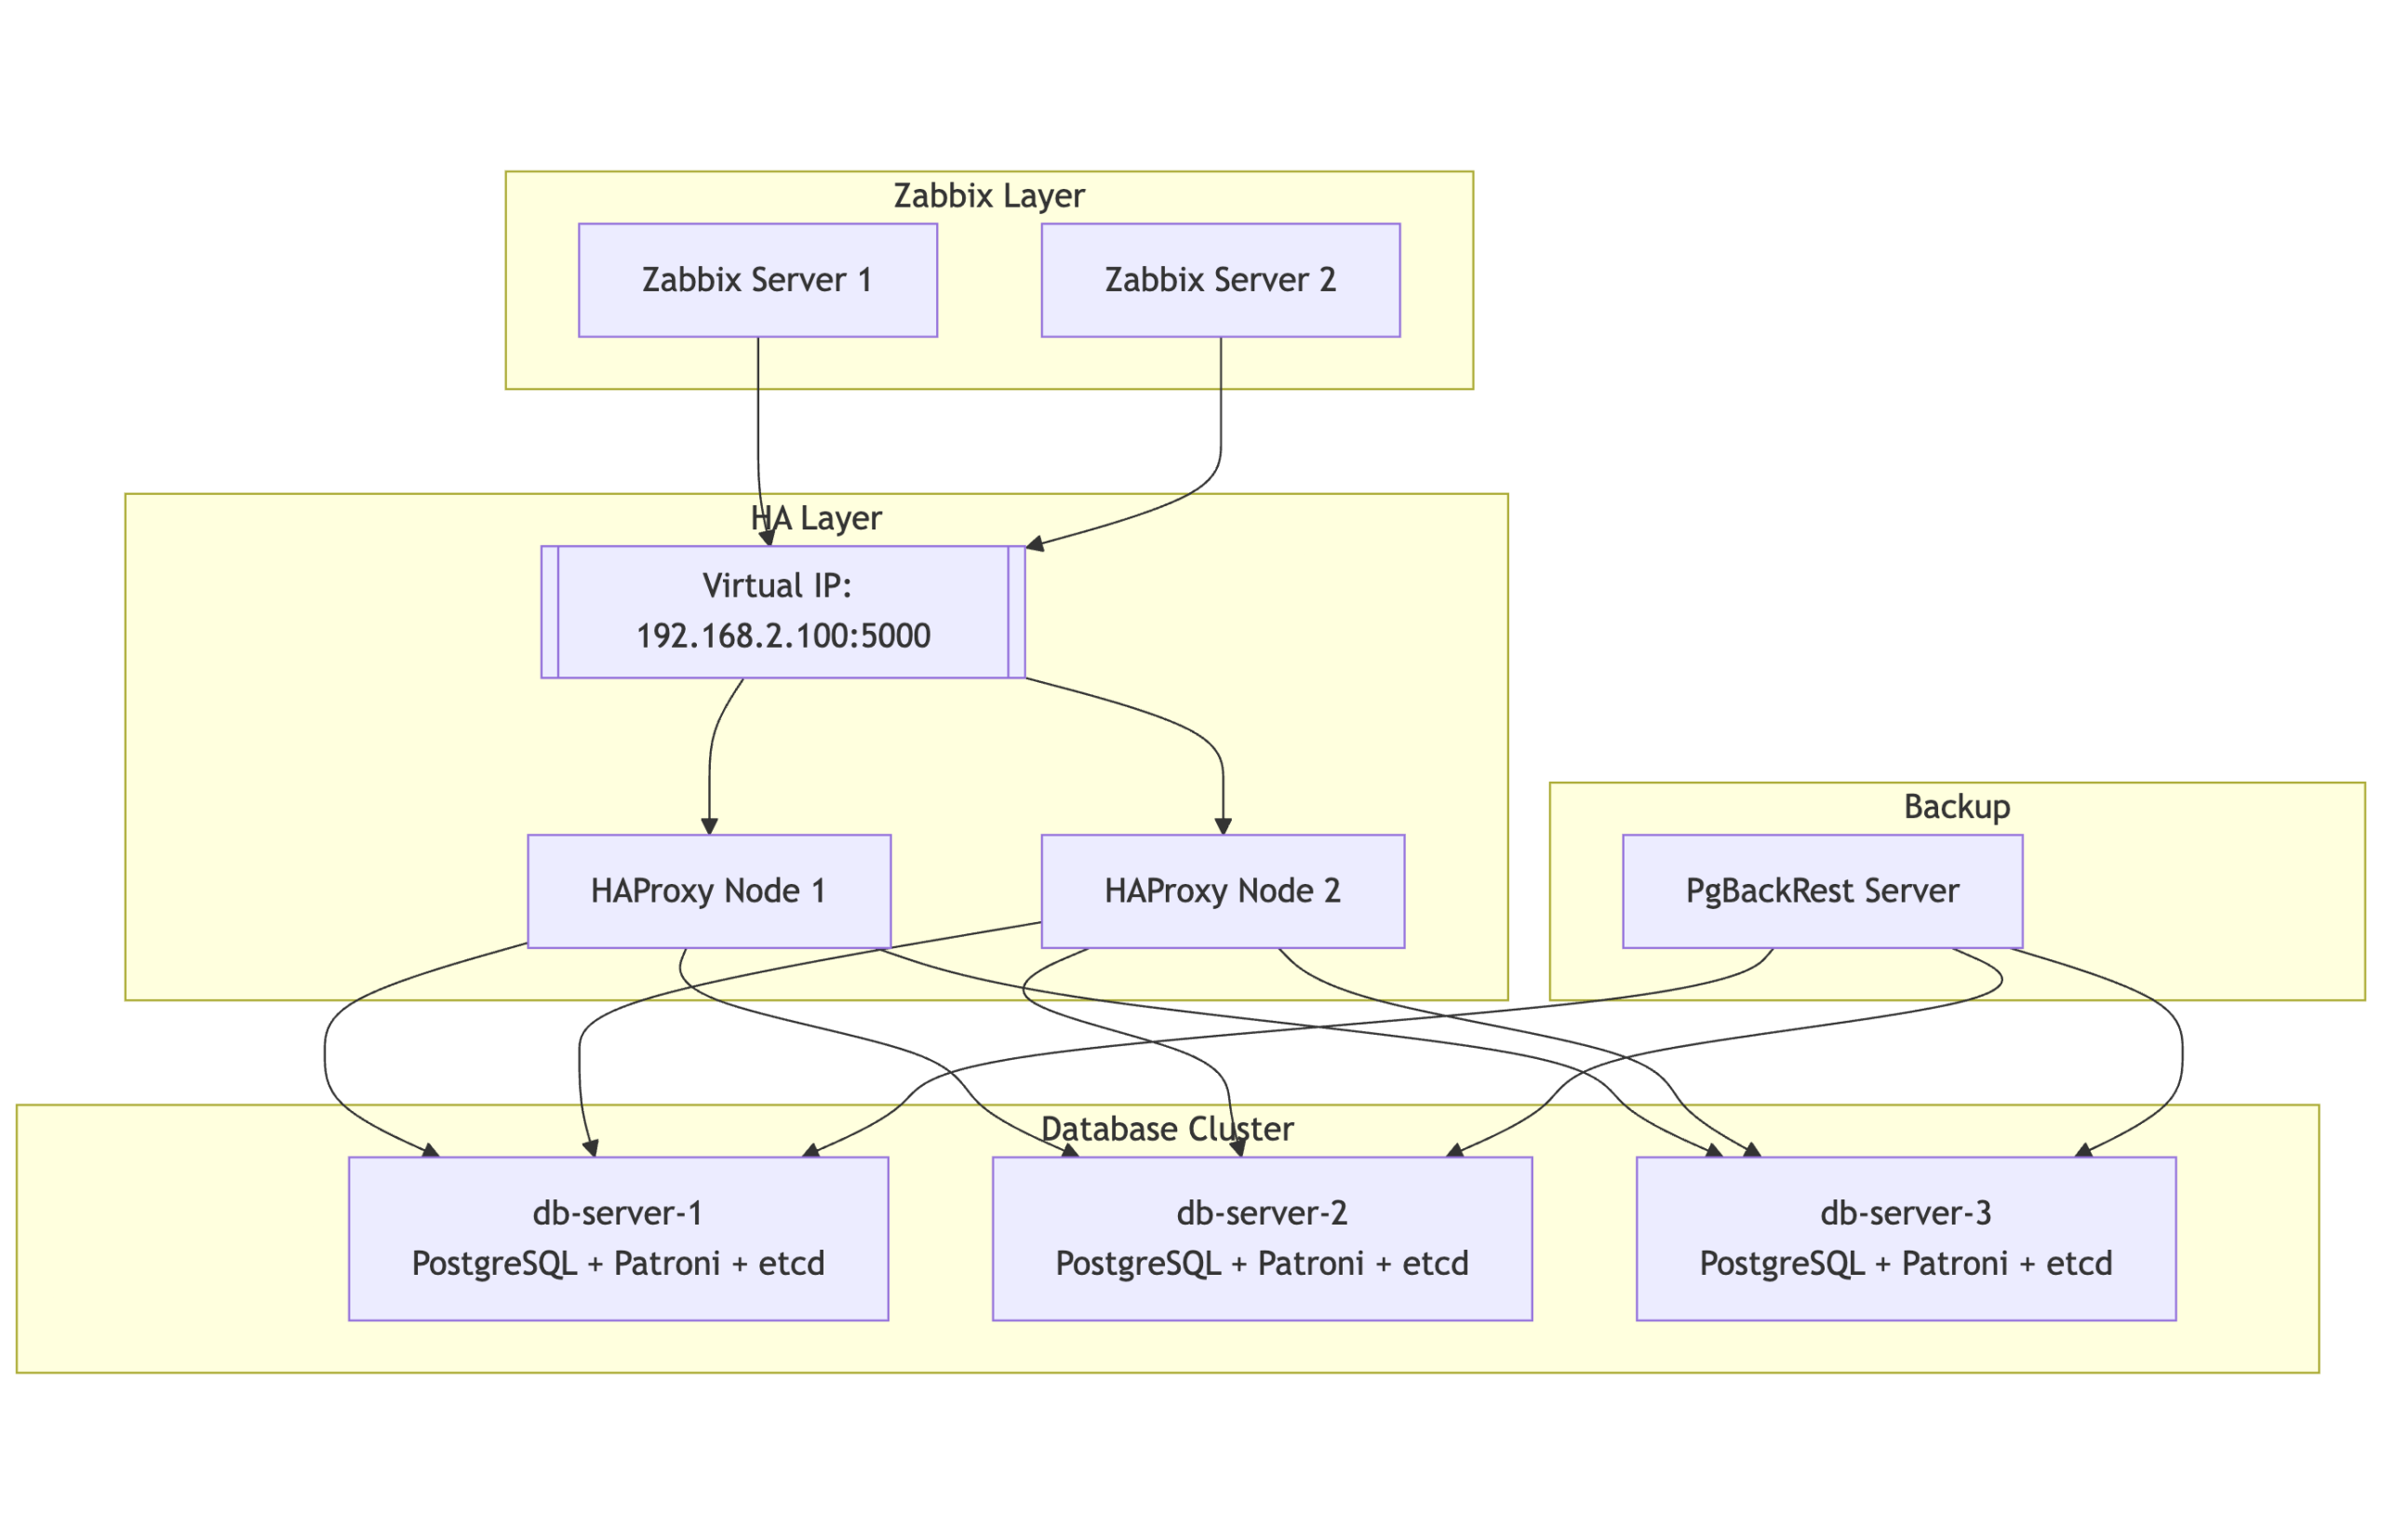
Topology at a glance
Here’s a simplified view of the architecture:
2 or more database nodes (PostgreSQL + Patroni + etcd)
Two HAProxy nodes, each configured with Keepalived to manage a floating virtual IP
One backup node for PgBackRest
Two Zabbix servers pointing to the PostgreSQL VIP
All systems are tied together with consistent hostname mappings, time synchronization (Chrony), and service monitoring.
Notes:
PgBackRest is directly connected to all three PostgreSQL nodes, allowing it to archive WAL segments and pull backups regardless of which node is primary.
This design enables full standby backups and supports Point-In-Time Recovery (PITR).
HAProxy ensures Zabbix always talks to the current primary node, while Patroni and etcd handle automatic failover and cluster state management.
Design rationale
This setup prioritizes resilience and self-healing. If any single component fails a database node, a load balancer, or even a monitoring server the system continues to function.
Using Patroni with etcd ensures that failovers are handled automatically, without human intervention. HAProxy ensures client traffic is always routed to the current primary, while Keepalived ensures that this routing layer itself is highly available.
We opted for PgBackRest over simple scripts or base backups because it provides not just efficient incremental backups, but also full WAL archiving and point-in-time recovery, which are invaluable for both disaster recovery and debugging.
Lastly, we chose to integrate Zabbix itself into this HA design, treating it not just as a application but as a fully resilient service able to monitor itself, so to speak.
Real-world considerations
Resource planning: While our nodes run comfortably, scaling this setup to heavy workloads requires careful tuning of memory, I/O, and PostgreSQL parameters.
etcd placement: Although we run etcd co-located with the database nodes in this example, separating etcd onto dedicated infrastructure is ideal for large-scale environments. This avoids resource contention and preserves quorum in extreme failure scenarios.
Monitoring the monitors: Zabbix itself must be monitored. In our setup, each component including etcd, Patroni, and PostgreSQL exposes health endpoints that can be used by Zabbix agents or scripts to generate alerts on replication lag, cluster health, and failover events.
Conclusion
This architecture provides a solid foundation for running Zabbix in a fault-tolerant, production-ready environment. It not only ensures high availability for the database layer but also offers flexibility, observability, and operational safety.
Whether you’re running internal infrastructure monitoring or offering Zabbix as a managed service, adopting this type of HA setup removes single points of failure and gives you peace of mind — all using open-source technologies that are battle-tested and widely supported.
If you need assistance with the migration or want to ensure best practices for scaling and optimizing Zabbix, don’t hesitate to reach out to OICTS. We are a Zabbix Premium Partner operating globally, with offices in the USA, UK, Netherlands, and Belgium, and we’re ready to help you every step of the way.
For companies looking to migrate from PRTG Network Monitor to Zabbix, one of the most critical aspects is making sure a smooth migration of monitored devices and configurations. While there is no official tool to directly migrate between the two platforms, creating a bridge using custom export/import scripts allows for an effective and large migation. This blog post outlines a practical approach to achieving that migration based on the export/import methodology we at Opensource ICT Solutions previously implemented for one of our clients.
Why migrate?
While PRTG offers an intuitive interface and is popular for its ease of use, Zabbix provides:
Greater flexibility and scalability
Full open-source licensing
More powerful automation and templating
A robust API for integrations
Lower costs, especially since Paessler was sold to an investor
These features make Zabbix an attractive choice for teams looking to scale or standardize on open-source infrastructure.
Migration overview
The migration involves two key steps:
Exporting PRTG device information
Importing data into Zabbix
Because the two systems are conceptually and structurally different, we focused our scripts on migrating what is most transferable: device names, IP addresses, and interface types. SNMP versions or PRTG-specific sensor details were excluded or simplified where not applicable to Zabbix. PRTG, for example, will only export probes that have an OID that was not built-in in PRTG but added later, making our export incomplete. This does not mean we did a partial migration, it just means we have not included it in the automated approach.
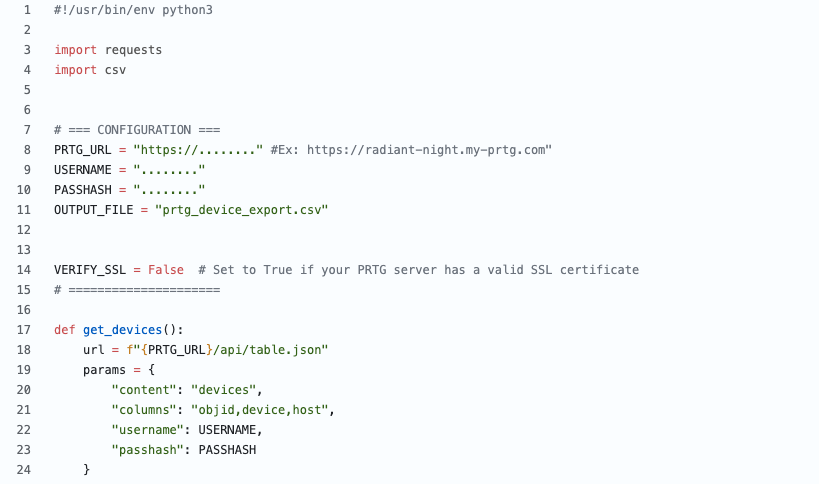
Step 1: Exporting from PRTG
We developed a Python-based script that interacts with the PRTG API to extract monitored device data and export it to a CSV file. The script filters out irrelevant objects and organizes the output for easy Zabbix processing.
This creates a clean CSV, like this:
Device Name, IP Address, Interface Type
zabbix-server,10.0.0.10,agent
ServerA,192.168.0.2,SNMP
ServerA,192.168.0.2,agent
core-switch,192.168.0.1,SNMP
This file serves as a clean, structured inventory of monitored devices.
Note: SNMP version fields were excluded in the final export, as Zabbix does not currently display or rely on an SNMP version in the same way PRTG does.
Step 2: Importing into Zabbix
Using Zabbix’s API, we created an import script that reads the CSV and:
Creates host entries
Assigns them to the appropriate host group
Adds relevant interfaces (e.g., Agent,ILO,SNMP or a combination of …)
Each host is configured based on its detected interface type in PRTG.
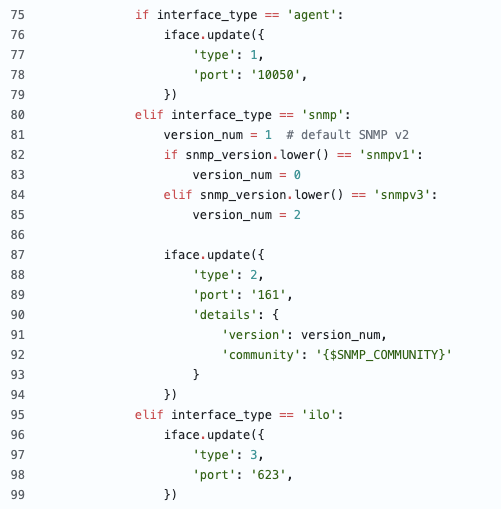
On the Zabbix side, we used the Zabbix API to automate the creation of hosts, interfaces, and template assignment. The import script reads the CSV line-by-line and takes action based on the interface type.
Considerations and “gotchas”
Templates: We didn’t add templates, as there is no 1:1 solution – PRTG has a different concept and adding a standard template would be possible but probably not the best solution.
Host Groups: For ease of use and the limited time we had, we added all hosts in a temporary host group made for the migration. Although we do have scripts that take it out from PRTG and create it in Zabbix, in this particular migration it was not needed.
Permissions: The API token used in the import script must have sufficient privileges to create hosts.
What is NOTmigrated
Because of fundamental differences between the platforms, the following are not directly migrated:
Historical data or sensor readings: Mainly because the customer had no hard requirement for it.
Custom PRTG notifications or dependencies: It was easier to manually re-create them.
Maps or dashboards: The Zabbix approach is so different that it was easier to recreate it manually (and improve).
Sensors: Zabbix is working with a different concept.
Post-migration tips
Validation: After the import, verify that each host is reachable and monitored correctly in Zabbix.
Discovery: Consider using Zabbix’s LLD (Low-Level Discovery) to dynamically find interfaces, disks, or other entities.
Housekeeping: Disable PRTG monitoring only after confirming Zabbix is fully operational.
Conclusion
Migrating from PRTG to Zabbix is not a one click operation, but with some scripting, planning, and experience from a partner like us, it can be done efficiently and with minimal disruption. The custom export/import scripts act as a reliable bridge between the two systems, allowing for a clean transfer of your monitoring inventory. From there, Zabbix’s automation and scalability features can help take your monitoring to the next level.
If you need assistance with the migration or want to ensure best practices for scaling and optimizing Zabbix, don’t hesitate to reach out to OICTS. We are a Zabbix Premium Partner operating globally, with offices in the USA, UK, Netherlands, and Belgium ready to help you every step of the way.
Running a monitoring platform like Zabbix in a production environment requires bulletproof availability at the database layer. Any downtime in PostgreSQL, even for seconds, can disrupt monitoring visibility, triggering blind spots in alerts and data collection.
This post introduces a streamlined High-Availability (HA) architecture for Zabbix using PostgreSQL, pg_auto_failover, HAProxy, and PgBackRest. Built on RHEL 9 or derivatives, this architecture removes single points of failure and automates failover using minimal external dependencies, making it a strong candidate for modern observability backends.
Architecture overview
This HA design simplifies deployment by using a dedicated monitor node to orchestrate automatic failover between two PostgreSQL database nodes. With pg_auto_failover, we avoid the need for complex consensus layers like etcd or Consul while still achieving fast, reliable failover and recovery.
Database layer
Two PostgreSQL nodes are deployed in a primary/secondary configuration. These nodes are registered with a dedicated pg_auto_failover monitor, which continuously checks node health and replication status. In the event of a failure, the monitor promotes the secondary to primary with no manual intervention.
Each node is securely configured using scram-sha-256 authentication and self-signed / or owned SSL certificates to ensure encrypted communication within the cluster.
Monitor node (Arbiter)
The monitor node is a lightweight PostgreSQL instance that runs the pgautofailover extension. It holds state information about all participating nodes and acts as the arbiter during failover events. It requires only one node, reducing complexity compared to consensus-based DCS (Distributed Configuration Store) systems like etcd or ZooKeeper.
Load balancing layer
Two HAProxy nodes route all client (Zabbix) connections to the current PostgreSQL primary. A lightweight HTTP service on each DB node reports its current role (primary or not) and allows HAProxy to determine which node is writable. These proxies are kept highly available using Keepalived, which manages a shared Virtual IP (VIP) across both proxy servers.
This way, applications like Zabbix always connect to a stable endpoint, even during failover events.
Backup layer
Backups are handled using PgBackRest, deployed on a dedicated backup server. This server connects to both PostgreSQL nodes over SSH and performs the following:
Full and incremental backups
WAL archiving
Point-In-Time Recovery (PITR)
Passwordless SSH and proper pgbackrest.conf mappings are set up to support seamless interaction regardless of which node is currently primary.
Component overview
Component
Role
PostgreSQL
Relational backend storing all Zabbix metrics, alerts, events
pg_auto_failover
Ensures continuous availability by promoting replicas automatically
Monitor Node
Decides failover based on health checks and cluster state
HAProxy
Routes client traffic to the current primary
Keepalived
Provides VIP failover between HAProxy nodes
PgBackRest
Performs PITR-capable backups from any node
Zabbix Server
Connects to PostgreSQL via VIP to ensure continuity
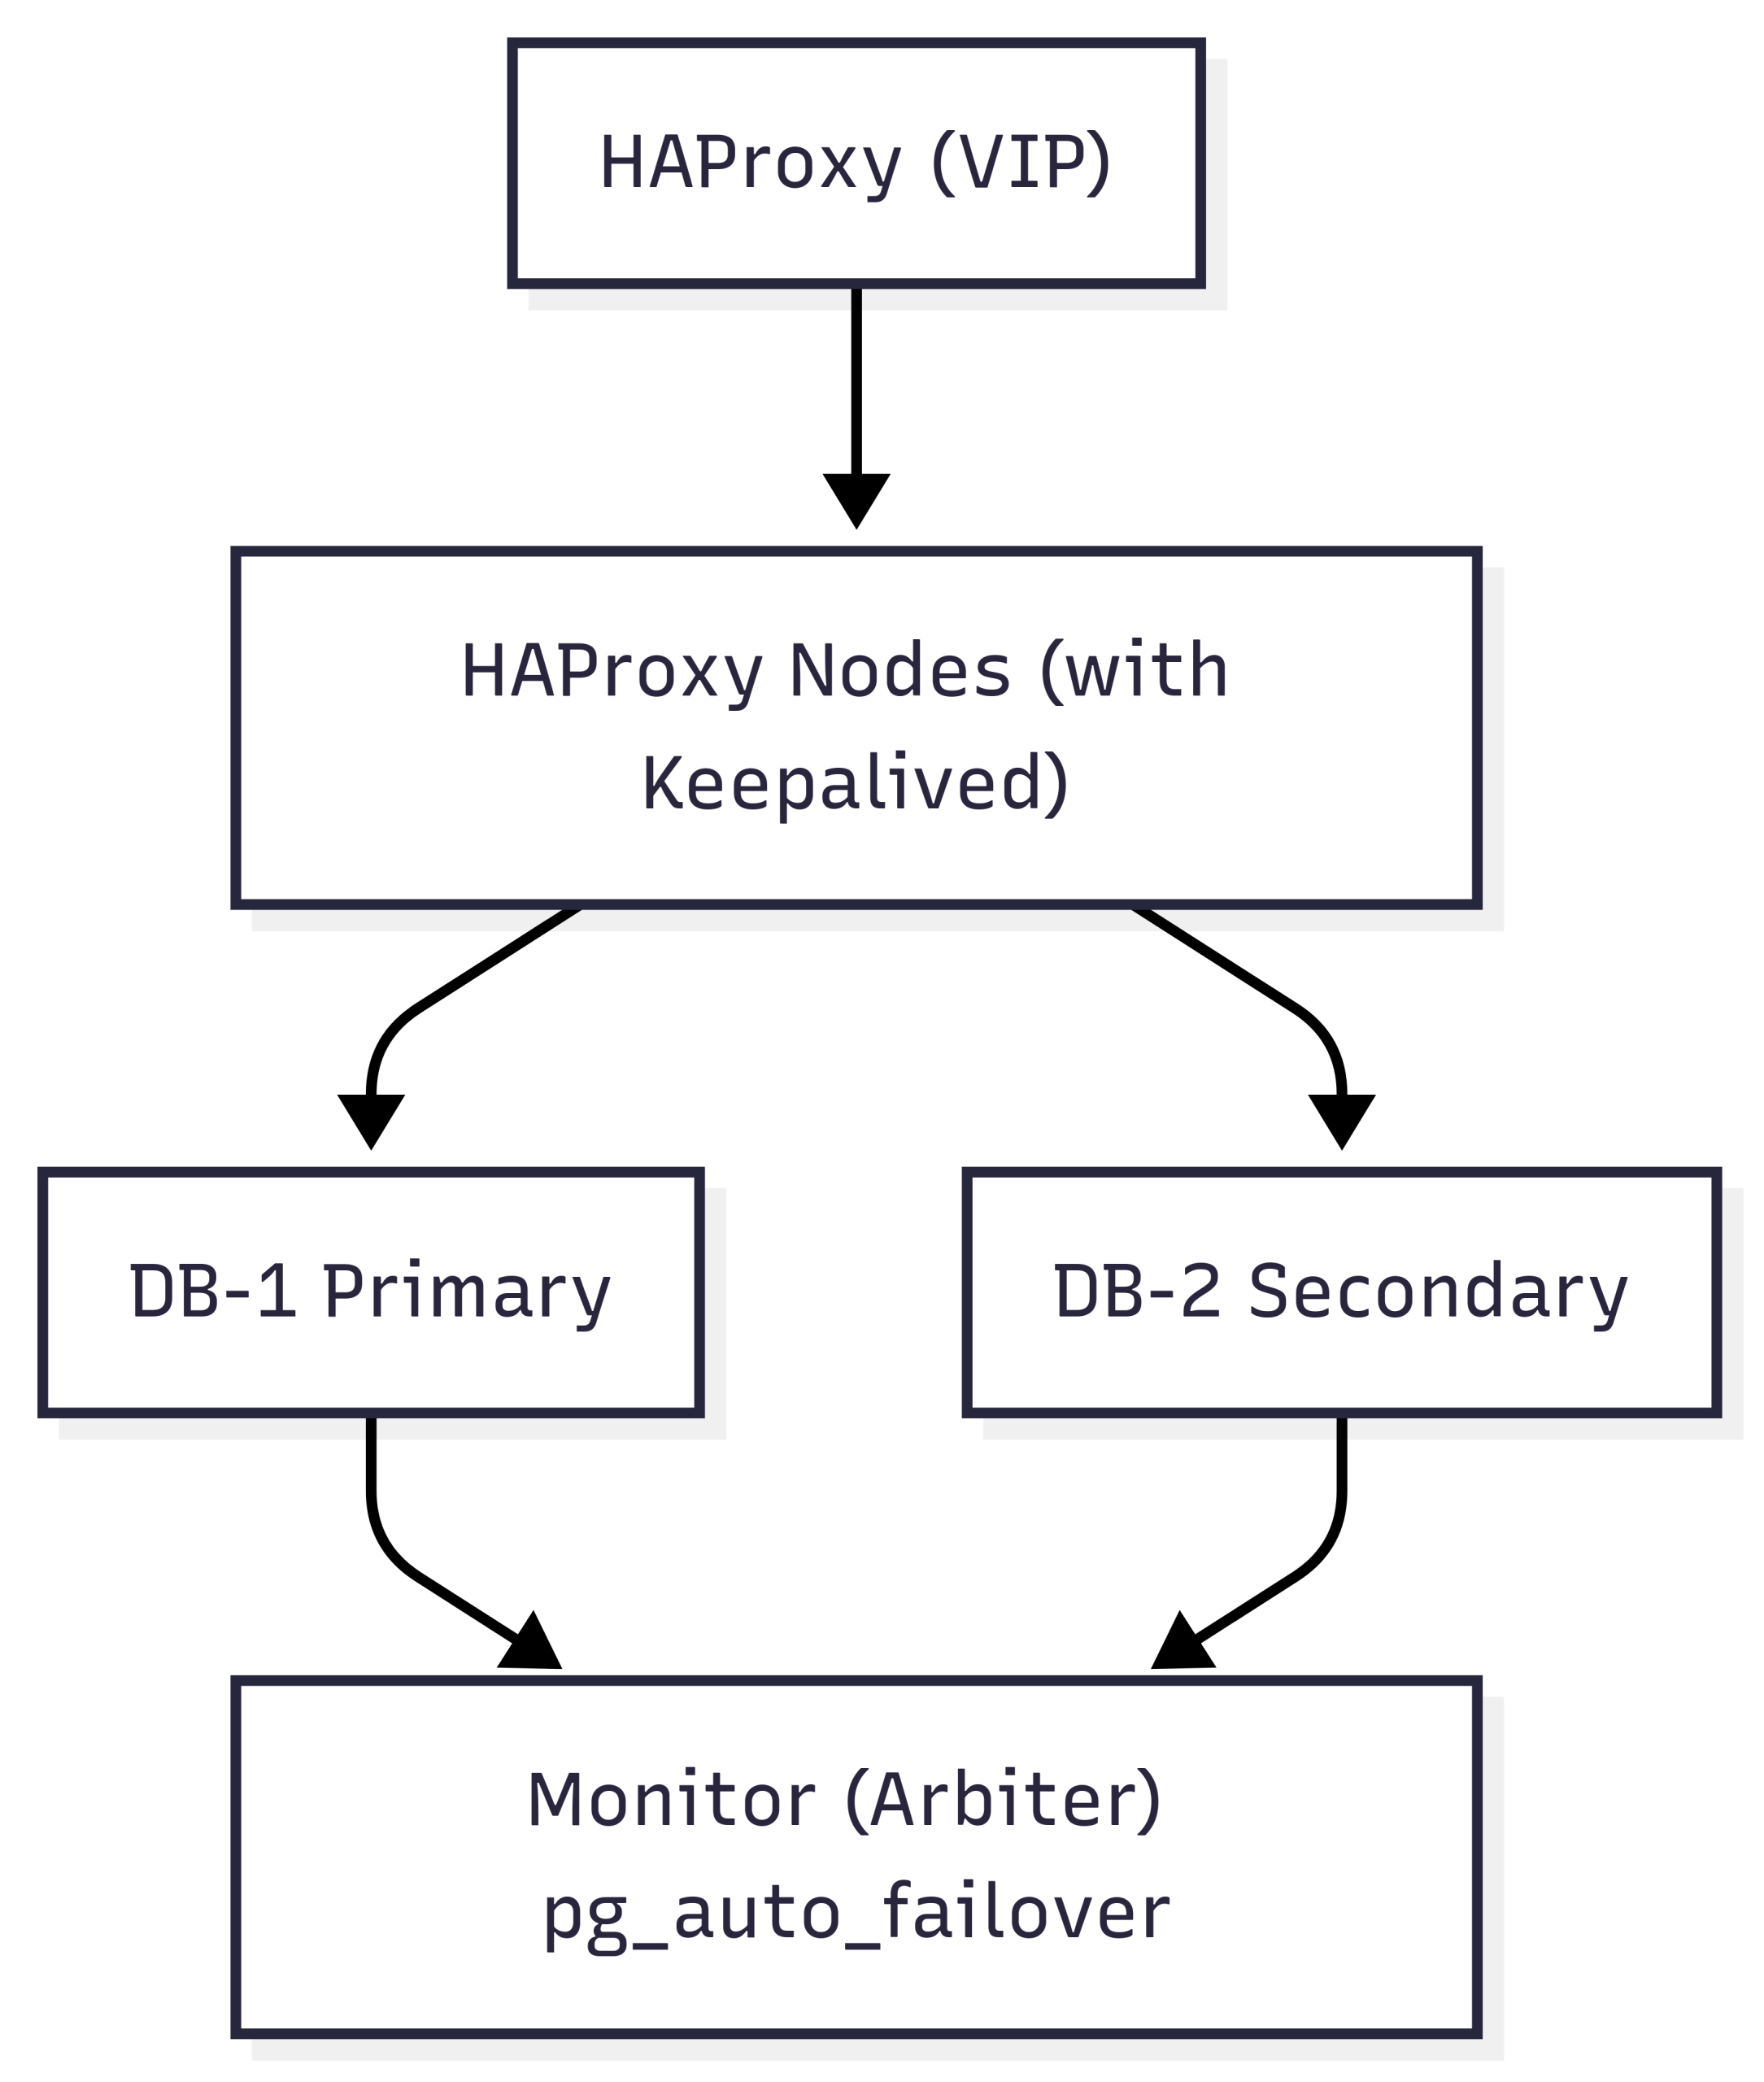
Topology at a glance
Design
Unlike Patroni, which requires a distributed configuration store like etcd, pg_auto_failover uses a dedicated monitor node that simplifies orchestration. This setup reduces the operational burden while still delivering robust failover, automatic reconfiguration, and synchronization safeguards, including:
Synchronous_standby_names to enforce replication integrity
Service integration with systemd for reliable restarts
Failover detection with minimal latency
This design also ensures SSL-enabled encrypted communication, self-healing role changes, and full observability using Zabbix itself, which can be configured to monitor the PostgreSQL cluster through exposed health endpoints.
Real-world considerations
Upgrade Planning: The pg_auto_failover version in RPM repos may lag behind the latest upstream features like set_monitor_setting. Pin the package version if consistency is required.
Network Security: Only HAProxy nodes are allowed to query the internal role-check API on the DB nodes using custom firewall rules.
Cluster Hygiene: Always clean up config folders (~postgres/.config/pg_autoctl/…) if a node is misconfigured or needs to rejoin.
SELinux: Configure SELinux, use semanage and audit2allow to fix custom ports (e.g., 9877 for health checks).
Hybrid Logging: Setup PostgreSQL to log to both journald and traditional log files via stderr + logging_collector.
Conclusion
This architecture strikes a balance between simplicity and resilience. While Patroni is great for large-scale, multi-region setups requiring distributed consensus, pg_auto_failover offers a lighter-weight solution that covers most enterprise needs without complex dependencies.
By layering the following…
PostgreSQL 17
Pg_auto_failover with a single monitor
HAProxy + Keepalived for VIP failover
PgBackRest for backups
…you can then confidently run Zabbix in a highly available and secure fashion with minimal operational overhead.
If you’re considering implementing this setup or migrating from a single-node database backend, reach out to Opensource ICT Solutions, a Zabbix Premium Partner with global presence in the USA, the UK, the Netherlands, and Belgium. We can help you architect, deploy, and monitor Zabbix environments that scale with your needs.
Monitoring backup solutions can be an arduous task – especially since many backup tools don’t provide APIs and simply are not easy to work with. One such solution – NetBackup – provides its own set of challenges, but fortunately we have Zabbix, with its low-level discovery (LLD) features and the possibility to leverage user parameters to extend Zabbix agent.
Table of Contents
How does LLD work ?
For those not familiar with LLD, Zabbix is able to create items, triggers, graphs, and other entities based on LLD rules. JSON is used to detect those entities by Zabbix.
If we create a script that returns this information to Zabbix, then we can automatically create items based on the received low-level discovery macros and their values. In this example from the Zabbix website, Zabbix will map {#FSNAME} to one of the detected logical volumes.
Zabbix can automatically create items with this information. If we then create another script where we sent the values for each of the volumes, then we can return for example the free space for the “/” volume as a value and do this for all other volumes as well.
With this knowledge, we can create a solution to monitor our backups. We will further optimize this approach because we don’t want to rely on multiple scripts, such as a script that sends us a list of failed backups, another script that returns the status codes, etc. We will use the dependent item feature, which allows us to simply create one master item to collect all the values and then process them further in Zabbix.
Monitoring with Python and user parameters
To format our data in JSON, we need to extract it first from the API. For this, we can create a script with the user parameters in our Zabbix agent. The Python script we will use for this can be copied to “/etc/zabbix” or another place that is accessible by the Zabbix user on our system.
Don’t forget to adapt the script and update settings like user name, password, URL, and page limit!
# NetBackup API configuration
BASE_URL = "https://<netbackup-url>:1556/netbackup"
USERNAME = ""
PASSWORD = ""
PAGELIMIT = "100" # adapt to your needs

The page limit will limit the search to the last 100 lines

If you want you can also adapt how many days we have to look back in history standard is 7 days

# Set the time range for job retrieval (last 7 days)
end_time = datetime.utcnow()
start_time = end_time - timedelta(hours=168)
The script will collect errors in backups and the resulting output will display a list of failed backups over the last 100 jobs:
This data is perfect for our LLD rules in Zabbix. Once we have copied our script to the server, we have to define our Zabbix user parameter. You can download an example here:
Copy this file to your Zabbix agent in the config folder, usually somewhere in:
“/etc/zabbix/zabbix_agent2.d/” or “/etc/zabbix/zabbix_agentd.d/” depending if you use Zabbix agent or Zabbix agent 2.
Don’t forgot to modify the file permissions so that only the agent can read it, and restart Zabbix agent. Also, make sure that the user parameter points are at the correct location of the Python script. The last thing we have to do now is create or import our Zabbix template:
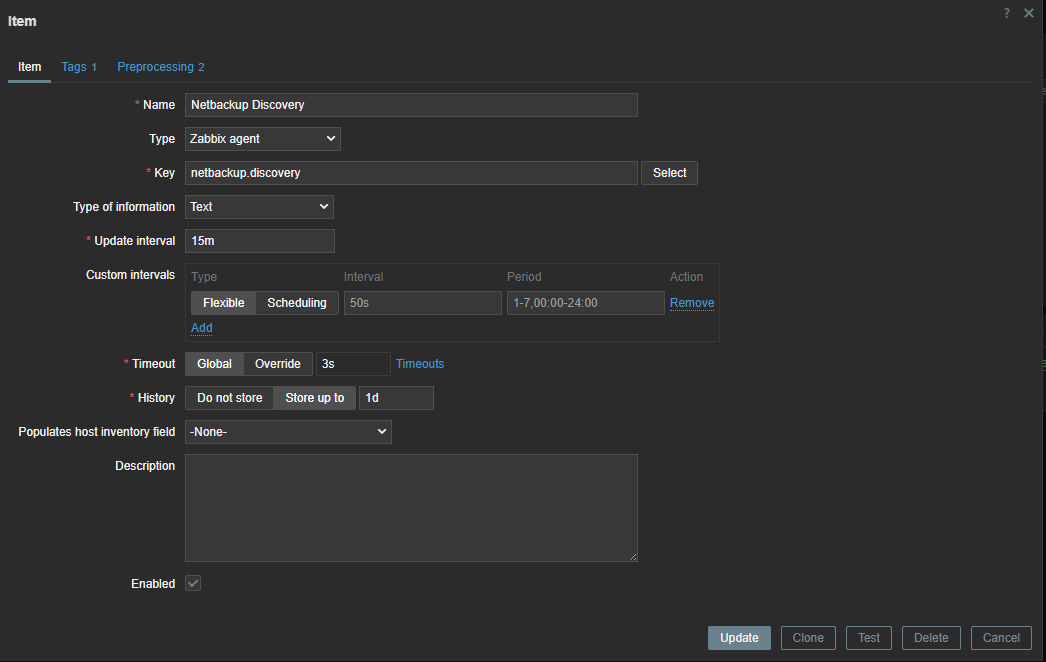
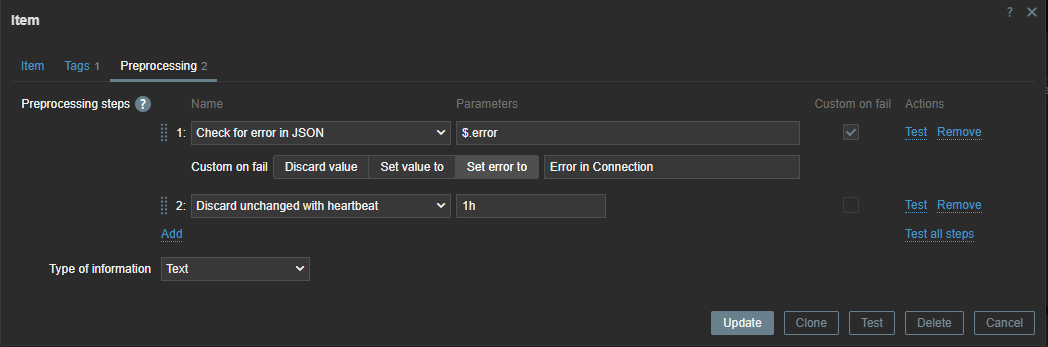
The first thing we have to do is create a master item that collects the data from our script.
Since the error check is executed every 15 minutes, we can use throttling pre-processing to discard duplicate data, since most of the time there will be no errors in our backups.
Also, if our script fails to connect to the API, our data collection will fail. Therefore, we can use custom on fail pre-processing and set a custom, more human-readable error message.
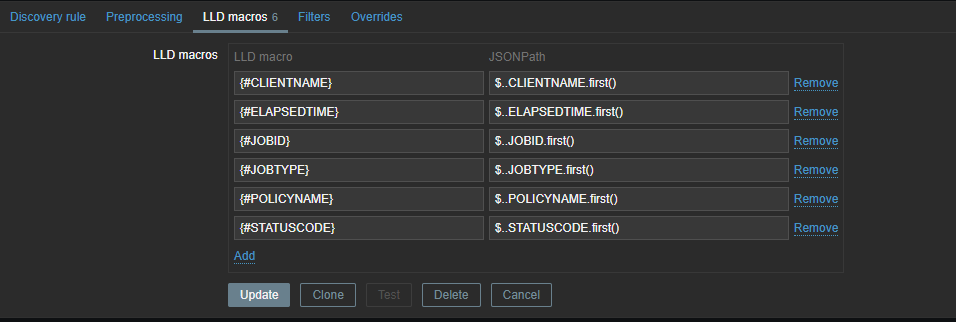
Now we have to create a discovery rule in Zabbix based on this data. In this discovery rule we will extract the required data and map it to custom LLD macros.
Those macros can be used later in our items. As you can see, we use .first() at the end of our JSONPATH expression – otherwise, we would get all our matching data between the [ ], as our data comes in a list. By making use of .first() we filter out all other data we don’t need.
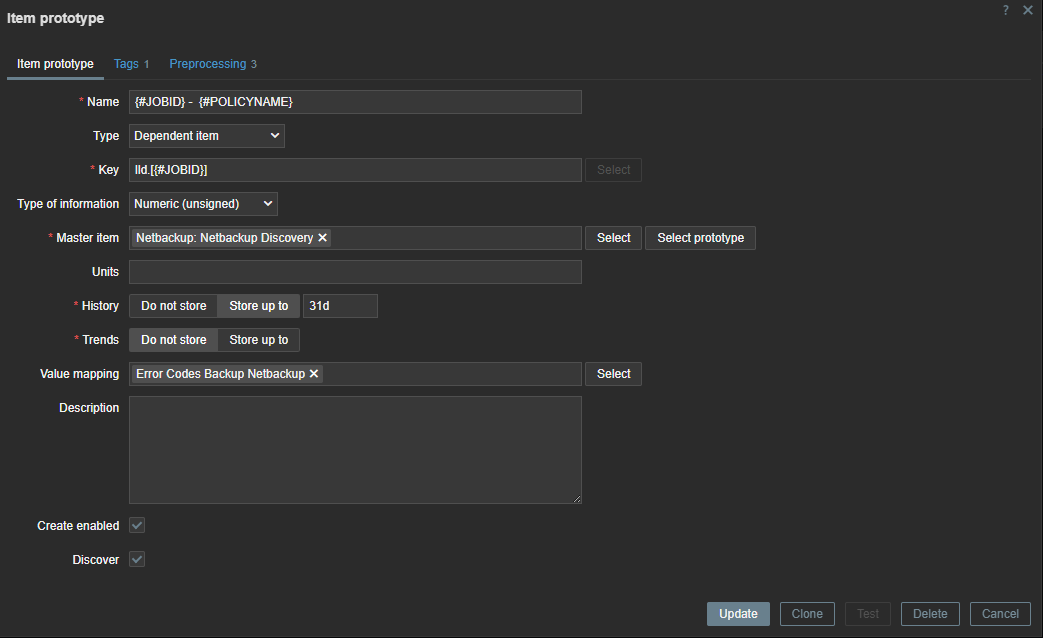
To create our LLD items, we need to create an item prototype so that items can be generated when they are detected. Our item will be a dependent item, so it will get its data from the master item.
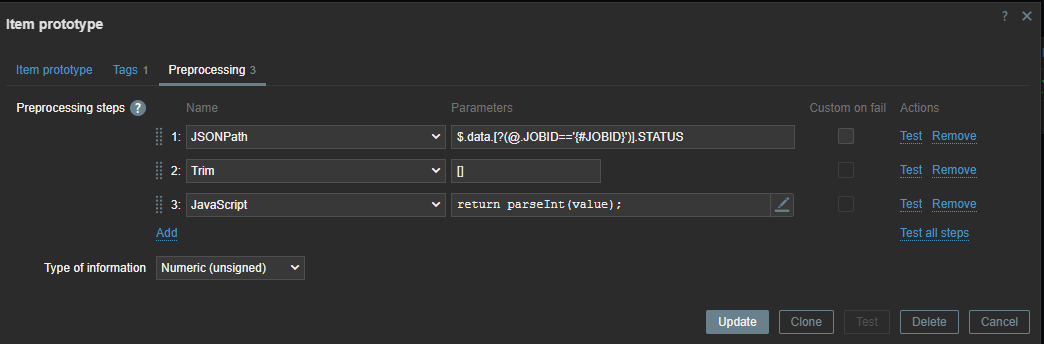
In our item prototype we can make use of the Zabbix LLD macros we created before. To extract the data we need, we have to add a preprocessing rule first to extract the data we want from our master item.
First line will look for the “JOBID” and will use the LLD macro we created before. Remember we used .last() ? If we had not done this our ID here would have been a list [ ] instead of just the ID number. We also have to remove the [ ] – this we can do with trim. Since our data is returned as text we also add some JS to convert our data to an Integer. This allows us to create triggers based on the error code we have received.
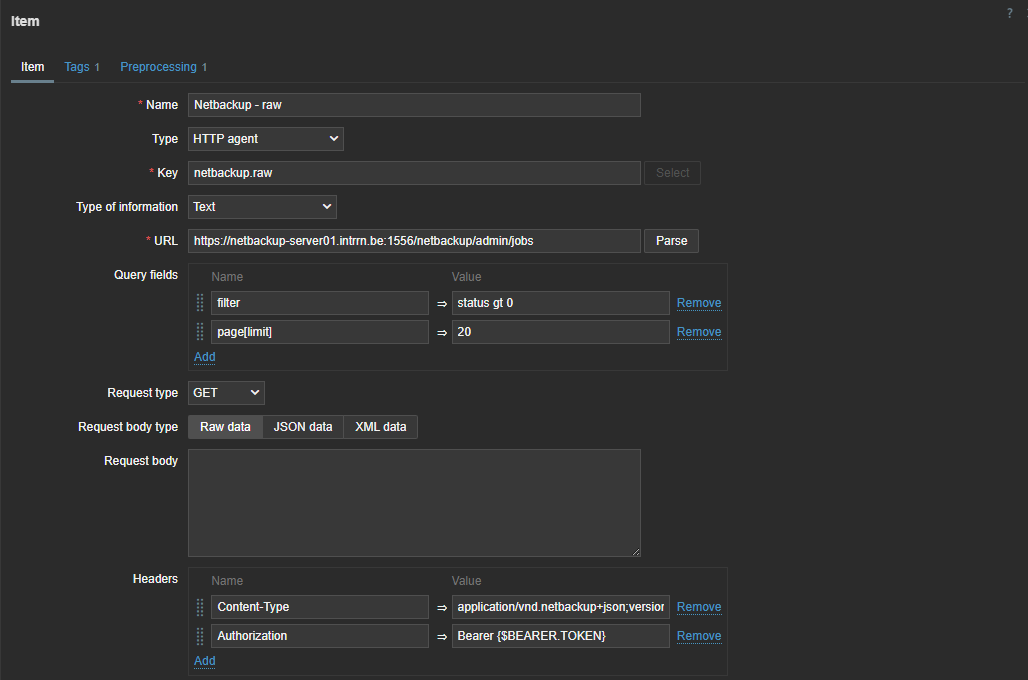
Monitoring with an http item
There is another way to do the same thing in Zabbix without writing those complex python scripts. Since Zabbix 4.0 we have “HTTP agent” item type. This allows us to connect to the API and retrieve the required data from the API. Combined with LLD and dependent items this becomes a very powerful way to collect metrics.
First thing we have to do is create a master item to retrieve the data from the API. This item is of the type “HTTP agent” and we have to fill in the URL of the API endpoint. To authenticate we have to pass information like the authentication token in the headers. For this you need to create a token first in NetBackup. As you can see I used a macro {$BEARER.TOKEN} – this is so we can make it secret.
So next step is to add our secret token. Let’s create our macro in the template under the Macros section. Here we can choose to keep it hidden for everyone. An even more secure way to store sensitive information like authentication tokens would be using a secret vault.
The data we get back from our API is a bit different from what we have seen in the output of the Python script we defined previously, but not by much.
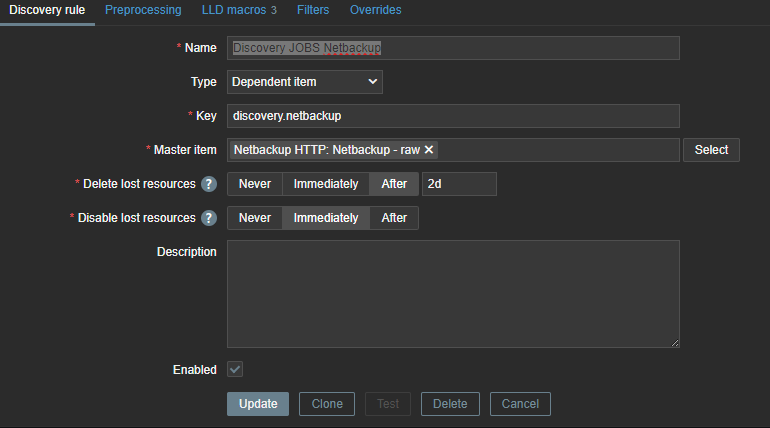
With this knowledge and what we know from our first try with Python, we can now make a dependent discovery rule.
The same logic applies again – we need to map our data to LLD macros so that we can use them later in our LLD items and triggers.
These LLD macros can later be used in our item prototypes and triggers. We only need JOBID and STATE, but you can create some extra mappings in case you like to use the extra information later. With our JSON path we will once again extract the data from our master item.
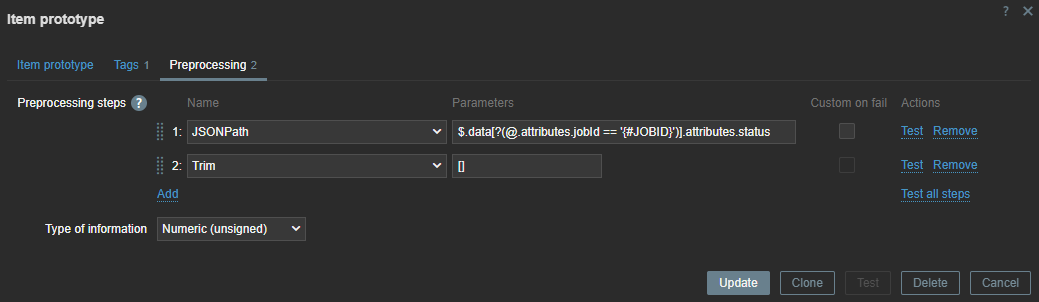
The next step is to create the LLD item prototype. Here we can use the macros we extracted earlier.
The item is dependent on our master item, so without any pre-processing the data will be exactly the same as in our master item. Therefore, we can add some rules to get the data we need.
Here, we use the JSON path to extract the data. With our LLD macros we can extract the data dynamically for every item we have discovered. With Trim, we remove the [ ] that comes around our data.
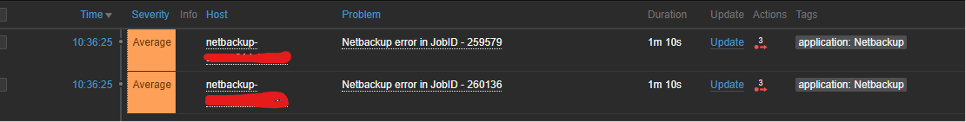
If there are backup errors, the end result will look something like this:
The steps can look a bit abstract, so the best thing to do is to try and perform everything step-by-step and use the Test button in Zabbix to test every step before you continue.
That’s it! If you’ve set up everything correctly, you should now get a list of failed jobs collected from NetBackup. Once the failed jobs are gone, Zabbix will disable the related entities and clean them up after some time.
If you need help optimizing your Zabbix environment, or you need a support contract, some consultancy, or training, feel free to contact [email protected] or visit us at https://www.open-future.be.
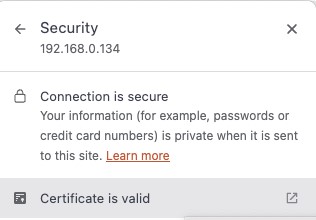
The frontend is what we use to login into our system. The Zabbix frontend will connect to our Zabbix server and our database. But we also send information from our laptop to the frontend. It’s important that when we enter our credentials that we can do this in a safe way. So it makes sense to make use of certificates and one way to do this is by making use of self-signed certificates.
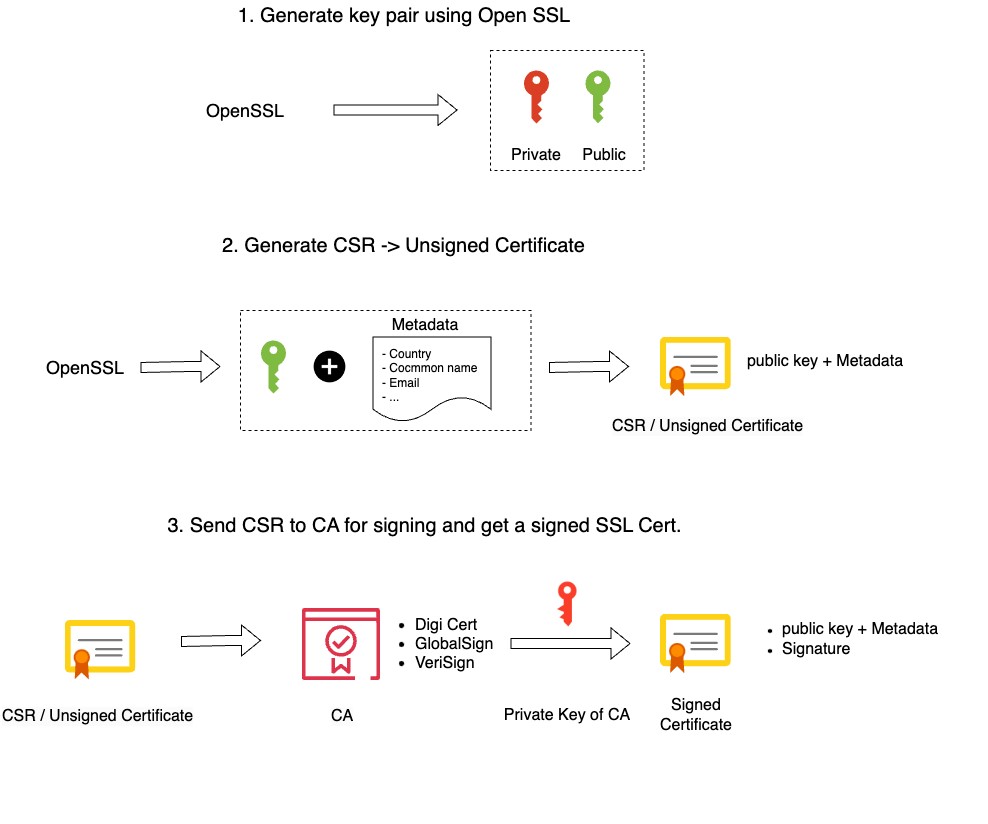
To give you a better understanding of why your browser will warn you when using self-signed certificates, we have to know that when we request an SSL certificate from an official Certificate Authority (CA) that you submit a Certificate Signing Request (CSR) to them. They in return provide you with a Signed SSL certificate. For this, they make use of their root certificate and private key.
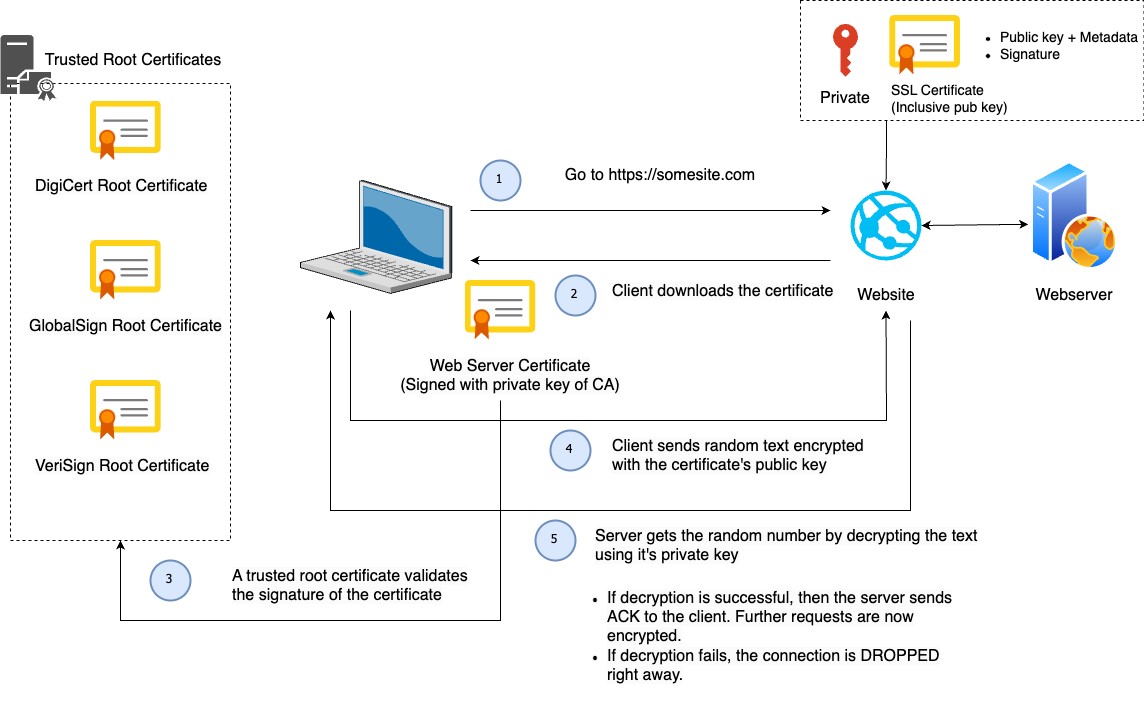
Our browser comes with a copy of the root certificate (CA) from various authorities, or it can access it from the OS. This is why our self-signed certificates are not trusted by our browser – we don’t have any CA validation. Our only workaround is to create our own root certificate and private key.
Table of Contents
Understanding the concepts
How to create an SSL certificate:
How SSL works – Client – Server flow:
NOTE: I have borrowed the designs from this video, which does a good job of explaining how SSL works.
Securing the Frontend with self signed SSL on Nginx
In order to configure this, there are a few steps that we need to follow:
Generate a private key for the CA ( Certificate Authority )
Generate a root certificate
Generate CA-Authenticated Certificates
Generate a Certificate Signing Request (CSR)
Generate an X509 V3 certificate extension configuration file
Generate the certificate using our CSR, the CA private key, the CA certificate, and the config file
Copy the SSL certificates to your Virtual Host
Adapt your Nginx Zabbix config
Generate a private key for the CA
The first step is to make a folder named “SSL” so we can create our certificates and save them:
req: This command is used for X.509 certificate signing request (CSR) management
x509: This option specifies that a self-signed certificate should be created
new: This option is used to generate a new certificate
nodes: This option indicates that the private key should not be encrypted. It will generates a private key without a passphrase, making it more
convenient but potentially less secure
key myCA.key: This specifies the private key file (myCA.key) to be used in generating the certificate
sha256: This option specifies the hash algorithm to be used for the certificate. In this case, SHA-256 is chosen for stronger security
days 1825: This sets the validity period of the certificate in days. Here, it’s set to 1825 days (5 years)
out myCA.pem: This specifies the output file name for the generated certificate. In this case, “myCA.pem”
The information you enter is not so important, but it’s best to fill it in as comprehensively as possible. Just make sure you enter for CN your IP or DNS.
You are about to be asked to enter information that will be incorporated into your certificate request. What you are about to enter is what is called a Distinguished Name or a DN. There are quite a few fields but you can leave some blank For some fields there will be a default value, If you enter '.', the field will be left blank. ----- Country Name (2 letter code) [XX]:BE State or Province Name (full name) []:vlaams-brabant Locality Name (eg, city) [Default City]:leuven Organization Name (eg, company) [Default Company Ltd]: Organizational Unit Name (eg, section) []: Common Name (eg, your name or your server's hostname) []:192.168.0.134 Email Address []:
Generate CA-Authenticated Certificates
It’s probably good practice to use the dns name of your webiste in the name for the private key. As we use in this case an IP address rather than a dns, I will use the fictive dns zabbix.mycompany.internal.
You will be asked the same set of questions as above. Once again, your answers hold minimal significance and in our case no one will inspect the certificate, so they matter even less.
You are about to be asked to enter information that will be incorporated into your certificate request. What you are about to enter is what is called a Distinguished Name or a DN. There are quite a few fields but you can leave some blank For some fields there will be a default value, If you enter '.', the field will be left blank. ----- Country Name (2 letter code) [XX]:BE State or Province Name (full name) []:vlaams-brabant Locality Name (eg, city) [Default City]:leuven Organization Name (eg, company) [Default Company Ltd]: Organizational Unit Name (eg, section) []: Common Name (eg, your name or your server's hostname) []:192.168.0.134 Email Address []:
Please enter the following 'extra' attributes to be sent with your certificate request A challenge password []: An optional company name []:
Generate an X509 V3 certificate extension configuration file
# vi zabbix.mycompany.internal.ext
Add the following lines in your certificate extension file. Replace IP or DNS with your own values.
Modify the “When using this certificate:” dropdown to “Always Trust”
Close the certificate window
Import the CA in Windows
Open the “Microsoft Management Console” by pressing Windows + R, typing mmc, and clicking Open
Navigate to File > Add/Remove Snap-in
Select Certificates and click Add
Choose Computer Account and proceed by clicking Next
Select Local Computer and click Finish
Click OK to return to the MMC window
Expand the view by double-clicking Certificates (local computer)
Right-click on Certificates under “Object Type” in the middle column, select All Tasks, and then Import
Click Next, followed by Browse. Change the certificate extension dropdown next to the filename field to All Files (.) and locate the myCA.pem file
Click Open, then Next
Choose “Place all certificates in the following store.” with “Trusted Root Certification Authorities store” as the default. Proceed by clicking Next, then Finish, to finalize the wizard
If all went well you should find your certificate under Trusted Root Certification Authorities > Certificates
Warning! You also need to import the myCA.crt file in your OS. We are not an official CA, so we have to import it in our OS and tell it to trust this Certificate. This action depends on the OS you use.
As you are using OpenSSL, you should also create a strong Diffie-Hellman group, which is used in negotiating Perfect Forward Secrecy with clients. You can do this by typing:
Add the following lines to your Nginx configuration, modifying the file paths as needed. Replace the existing lines with port 80 with this configuration. This will enable SSL and HTTP2.
To provide the best experiences, we use technologies like cookies to store and/or access device information. Consenting to these technologies will allow us to process data such as browsing behavior or unique IDs on this site. Not consenting or withdrawing consent, may adversely affect certain features and functions.
Functional
Always active
The technical storage or access is strictly necessary for the legitimate purpose of enabling the use of a specific service explicitly requested by the subscriber or user, or for the sole purpose of carrying out the transmission of a communication over an electronic communications network.
Preferences
The technical storage or access is necessary for the legitimate purpose of storing preferences that are not requested by the subscriber or user.
Statistics
The technical storage or access that is used exclusively for statistical purposes.The technical storage or access that is used exclusively for anonymous statistical purposes. Without a subpoena, voluntary compliance on the part of your Internet Service Provider, or additional records from a third party, information stored or retrieved for this purpose alone cannot usually be used to identify you.
Marketing
The technical storage or access is required to create user profiles to send advertising, or to track the user on a website or across several websites for similar marketing purposes.