Tag Archives: data collection

Surveillance by the New Microsoft Outlook App

Post Syndicated from Bruce Schneier original https://www.schneier.com/blog/archives/2024/04/surveillance-by-the-new-microsoft-outlook-app.html

The ProtonMail people are accusing Microsoft’s new Outlook for Windows app of conducting extensive surveillance on its users. It shares data with advertisers, a lot of data:

The window informs users that Microsoft and those 801 third parties use their data for a number of purposes, including to:

  • Store and/or access information on the user’s device
  • Develop and improve products
  • Personalize ads and content
  • Measure ads and content
  • Derive audience insights
  • Obtain precise geolocation data
  • Identify users through device scanning

Commentary.

Class-Action Lawsuit against Google’s Incognito Mode

Post Syndicated from Bruce Schneier original https://www.schneier.com/blog/archives/2024/04/class-action-lawsuit-against-googles-incognito-mode.html

The lawsuit has been settled:

Google has agreed to delete “billions of data records” the company collected while users browsed the web using Incognito mode, according to documents filed in federal court in San Francisco on Monday. The agreement, part of a settlement in a class action lawsuit filed in 2020, caps off years of disclosures about Google’s practices that shed light on how much data the tech giant siphons from its users­—even when they’re in private-browsing mode.

Under the terms of the settlement, Google must further update the Incognito mode “splash page” that appears anytime you open an Incognito mode Chrome window after previously updating it in January. The Incognito splash page will explicitly state that Google collects data from third-party websites “regardless of which browsing or browser mode you use,” and stipulate that “third-party sites and apps that integrate our services may still share information with Google,” among other changes. Details about Google’s private-browsing data collection must also appear in the company’s privacy policy.

I was an expert witness for the prosecution (that’s the class, against Google). I don’t know if my declarations and deposition will become public.

Extending Zabbix: the power of scripting

Post Syndicated from Giedrius Stasiulionis original https://blog.zabbix.com/extending-zabbix-the-power-of-scripting/27401/

Scripts can extend Zabbix in various different aspects. If you know your ways around a CLI, you will be able to extend your monitoring capabilities and streamline workflows related to most Zabbix components.

What I like about Zabbix is that it is very flexible and powerful tool right out of the box. It has many different ways to collect, evaluate and visualize data, all implemented natively and ready to use.

However, in more complex environments or custom use cases, you will inevitably face situations when something can’t be collected (or displayed) in a way that you want. Luckily enough, Zabbix is flexible even here! It provides you with ways to apply your knowledge and imagination so that even most custom monitoring scenarios would be covered. Even though Zabbix is an open-source tool, in this article I will talk about extending it without changing its code, but rather by applying something on top, with the help of scripting. I will guide you through some examples, which will hopefully pique your curiosity and maybe you will find them interesting enough to experiment and create something similar for yourself.

Although first idea which comes to ones mind when talking about scripts in Zabbix is most likely data collection, it is not the only place where scripts can help. So I will divide those examples / ideas into three sub categories:

  • Data collection
  • Zabbix internals
  • Visualization

Data collection

First things first. Data collection is a starting point for any kind of monitoring. There are multiple ways how to collect data in “custom” ways, but the easiest one is to use UserParameter capabilities. Basics of it are very nicely covered by official documentation or in other sources, e.g. in this video by Dmitry Lambert, so I will skip the “Hello World” part and provide some more advanced ideas which might be useful to consider. Also, the provided examples use common scripting themes/scenarios and you can find many similar solutions in the community, so maybe this will serve better as a reminder or a showcase for someone who has never created any custom items before.

Data collection: DB checks

There is a lot of good information on how to setup DB checks for Zabbix, so this is just a reminder, that one of the ways to do it is via custom scripts. I personally have done it for various different databases: MySQL, Oracle, PostgreSQL, OpenEdge Progress. Thing is ODBC is not always a great or permitted way to go, since some security restrictions might be in place and you can’t get direct access to DB from just anywhere you want. Or you want to transform your retrieved data in a ways that are complex and could hardly be covered by preprocessing. Then you have to rely on Zabbix agent running those queries either from localhost where DB resides or from some other place which is allowed to connect to your DB. Here is an example how you can do it for PostgreSQL

#!/bin/bash

my_dir="$(dirname ${0})"
conf_file="${my_dir}/sms_queue.conf"

[[ ! -f $conf_file ]] && echo -1 && exit 1

. ${conf_file}

export PGPASSWORD="${db_pass}"

query="SELECT COUNT(*) FROM sms WHERE sms.status IN ('retriable', 'validated');"

psql -h "${db_host}" -p "${db_port}" -U "${db_user}" -d "${db}" -c "${query}" -At 2>/dev/null

[[ $? -ne 0 ]] && echo -1 && exit 1

exit 0

Now what’s left is to feed the output of this script into Zabbix via UserParameter. Similar approach can be applied to Oracle (via sqlplus) or MySQL.

Data collection: log delay statistics

I once faced a situation when some graphs which are based on log data started having gaps. It meant something was wrong either with data collection (Zabbix agent) or with data not being there at the moment of collection (so nothing to collect). Quick check suggested it was the second one, but I needed to prove it somehow.

Since these log lines had timestamps of creation, it was a logical step to try to measure, how much do they differ from “current time” of reading. And this is how I came up with the following custom script to implement such idea.

First of all, we need to read the file, say once each minute. We are talking about log with several hundreds of thousands lines per minute, so this script should be made efficient. It should read the file in portions created between two script runs. I have explained such reading in details here so now we will not focus on it.

Next what this script does is it greps timestamps only from each line and counts immediately number of unique lines with the same timestamp (degree of seconds). That is where it becomes fast – it doesn’t need to analyze each and every line individually but it can analyze already grouped content!

Finally, delay is calculated based on the difference between “now” and collected timestamps, and those counters are exactly what is then passed to Zabbix.

#!/bin/bash

my_log="${1}"

my_project="${my_log##*\/}"
my_project="${my_project%%.log}"

me="$(basename ${0})"
my_dir="/tmp/log_delays/${my_project}"

[[ ! -d ${my_dir} ]] && mkdir -p ${my_dir}

# only one instance of this script at single point of time
# this makes sure you don't damage temp files

me_running="${my_dir}/${me}.running"

# allow only one process
# but make it more sophisticated:
# script is being run each minute
# if .running file is here for more than 10 minutes, something is wrong
# delete .running and try to run once again

[[ -f $me_running && $(($(date +%s)-$(stat -c %Y $me_running))) -lt 600 ]] && exit 1

touch $me_running

[[ "${my_log}" == "" || ! -f "${my_log}" ]] && exit 1

log_read="${my_dir}/${me}.read"

# get current file size in bytes

current_size=$(wc -c < "${my_log}")

# remember how many bytes you have now for next read
# when run for first time, you don't know the previous

[[ ! -f "${log_read}" ]] && echo "${current_size}" > "${log_read}"

bytes_read=$(cat "${log_read}")
echo "${current_size}" > "${log_read}"

# if rotated, let's read from the beginning

if [[ ${bytes_read} -gt ${current_size} ]]; then
  bytes_read=0
fi


# get the portion

now=$(date +%s)

delay_1_min=0
delay_5_min=0
delay_10_min=0
delay_30_min=0
delay_45_min=0
delay_60_min=0
delay_rest=0

while read line; do

  [[ ${line} == "" ]] && continue

  line=(${line})

  ts=$(date -d "${line[1]}+00:00" +%s)

  delay=$((now-ts))

  if [[ ${delay} -lt 60 ]]; then
    delay_1_min=$((${delay_1_min}+${line[0]}))
  elif [[ ${delay} -lt 300 ]]; then
    delay_5_min=$((${delay_5_min}+${line[0]}))
  elif [[ ${delay} -lt 600 ]]; then
    delay_10_min=$((${delay_10_min}+${line[0]}))
  elif [[ ${delay} -lt 1800 ]]; then
    delay_30_min=$((${delay_30_min}+${line[0]}))
  elif [[ ${delay} -lt 2700 ]]; then
    delay_45_min=$((${delay_45_min}+${line[0]}))
  elif [[ ${delay} -lt 3600 ]]; then
    delay_60_min=$((${delay_60_min}+${line[0]}))
  else
    delay_rest=$((${delay_rest}+${line[0]}))
  fi

done <<< "$(tail -c +$((bytes_read+1)) "${my_log}" | head -c $((current_size-bytes_read)) | grep -Po "(?<=timestamp\":\")(\d{4}-\d{2}-\d{2}T\d{2}:\d{2}:\d{2})(?=\.)" | sort | uniq -c | sort -k1nr)"

echo "delay_1_min=${delay_1_min}
delay_5_min=${delay_5_min}
delay_10_min=${delay_10_min}
delay_30_min=${delay_30_min}
delay_45_min=${delay_45_min}
delay_60_min=${delay_60_min}
delay_rest=${delay_rest}"


rm -f "${me_running}"

exit 0

Now on Zabbix side, there is an item running this script and 7 dependent items, representing the degree of delay. Since there are many logs for which this data is collected, it is all put into LLD based on contents of specific directory:

vfs.dir.get[/var/log/logs,".*log$",,,,,1000]

This LLD then provides two macros:

And item prototypes will look like:

Those dependent items have one simple preprocessing step which takes needed number out of the script output:

So the final result is the nice graph in dashboard, showing exactly when and what degree delays do appear:

So as you see, it is relatively easy to collect just about any data you wish, once you know how. As you can see from these examples, it might be something more complex but it can also be just a simple one-liner – in any case it should be obvious that possibilities are endless when talking about scripts in data collection. If something is executable from the CLI and has a valuable output, go ahead and collect it!

Zabbix internals

Another area where scripts can be really useful is adjusting how Zabbix behaves or controlling this behavior automatically. And in this case, we will employ Zabbix API, since it’s designed exactly for such or similar purposes.

Zabbix internals: automatically disabling problematic item

In our environment, we have many logs to be analyzed. And some of them sometimes go crazy – something that we intend to catch starts appearing there too often and requires attention – typically we would have to adjust the regexp, temporarily suppress some patterns and inform responsible teams about too extensive logging. If you don’t (or can’t) pay attention quick, it might kill Zabbix – history write cache starts filling up. So what we do is automatically detect such an item with most values received during some most recent short period of time and automatically disable it.

First of all there are two items – the one measuring history write cache and the other one extracting top item in the given table

[root@linux ~]# zabbix_agentd -t zabbix.db.max[history_log,30] 2>/dev/null
zabbix.db.max[history_log,30] [t|463 1997050]
[root@linux ~]#

First number here is values gathered during provided period, second one is item id. The script behind this item looks like this

[root@linux ~]# grep zabbix.db.max /etc/zabbix/zabbix_agentd.d/userparameter_mysql.conf
UserParameter=zabbix.db.max[*],HOME=/etc/zabbix mysql -BN -e "USE zabbix; SELECT count(*), itemid FROM $1 WHERE clock >= unix_timestamp(NOW() - INTERVAL $2 MINUTE) GROUP BY itemid ORDER BY count(*) DESC LIMIT 1;"
[root@linux ~]#

And now relying on the history write cache item values showing us drop, we construct a trigger:

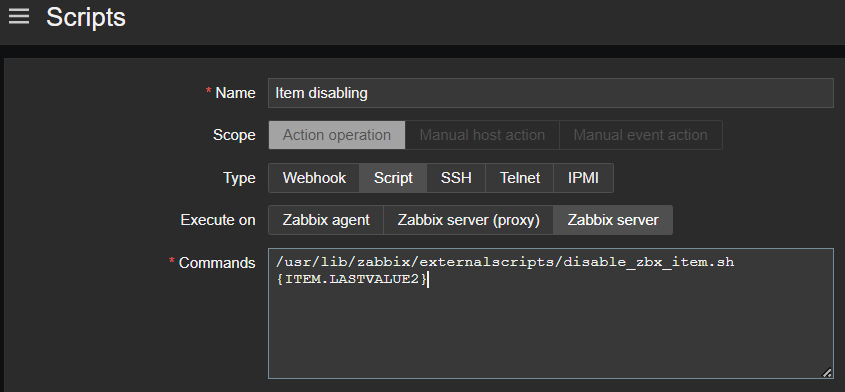
And as a last step, such trigger invokes action, which is running the script that disables the item with given ID with the help of Zabbix API, method “item.update”

Now we are able to avoid unexpected behavior of our data sources affecting Zabbix performance, all done automatically – thanks to the scripts!

Zabbix internals: add host to group via frontend scripts

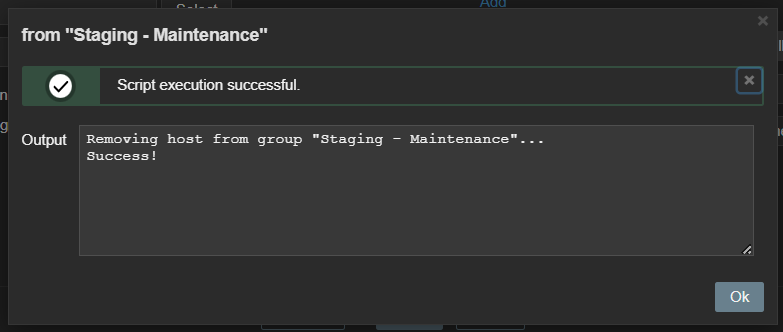
Zabbix maintenance mode is a great feature allowing us to reduce noise or avoid some false positive alerts once specific host is known to have issues. At some point we found it would be convenient to be able to add (or remove) specific host into (from) maintenance directly from “Problems” window. And that is possible and achieved via a frontend script, again with the help of Zabbix API, this time methods “host.get”, “hostgroup.get”, “hostgroup.massadd” and “hostgroup.massremove”

Data visualization

Zabbix has many different widgets that are able to cover various different ways of displaying your collected data. But in some cases, you might find yourself missing some small type of “something” which would allow your dashboards to shine even more – at least I constantly face it. Starting From version 6.4 Zabbix allows you to create your own widgets but it might be not such a straightforward procedure if you have little or no programming experience. However, you can employ two already existing widgets in order to customize your dashboard look in pretty easy way.

Data visualization: URL widget

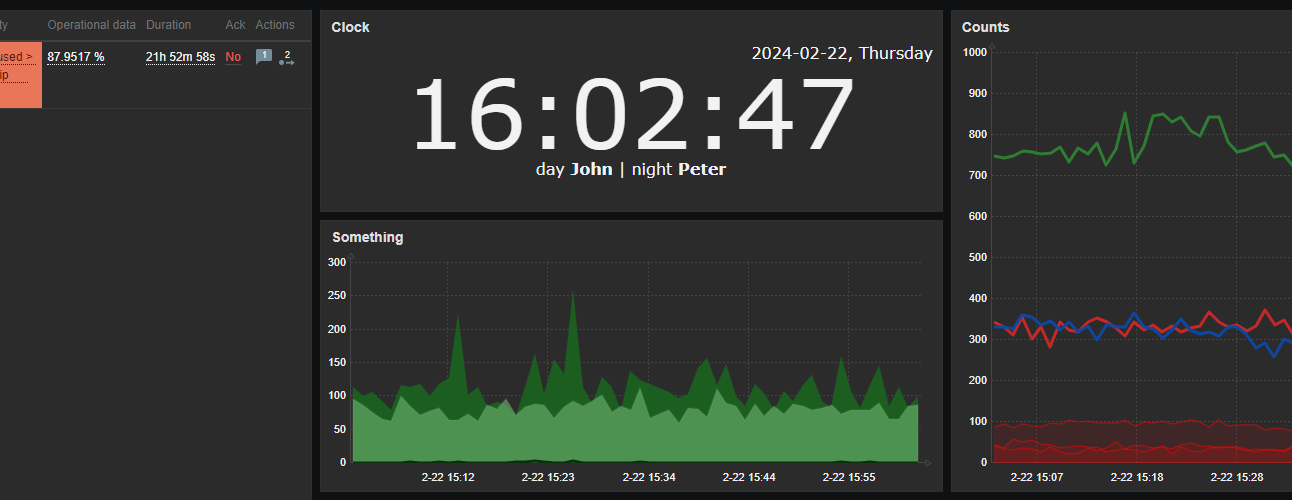
First one example is done using the URL widget. You might feed just about any content there, so if you have any web development skills, you can easily create something which would look like custom widget. Here is an example. I need a clock but not the one already provided by Zabbix as a separate clock widget – I want to have a digital clock and I also want this clock to have a section, which would display the employee on duty now and in an upcoming shift. So with a little bit of HTML, CSS and JavaScript / AJAX, I have this

With styles properly chosen, such content can be smoothly integrated into dashboards, along with other widgets.

Data visualization: plain text widget with HTML formatting

Another useful widget which is often overlooked is the “Plain text” widget – in combination with the following parameters:

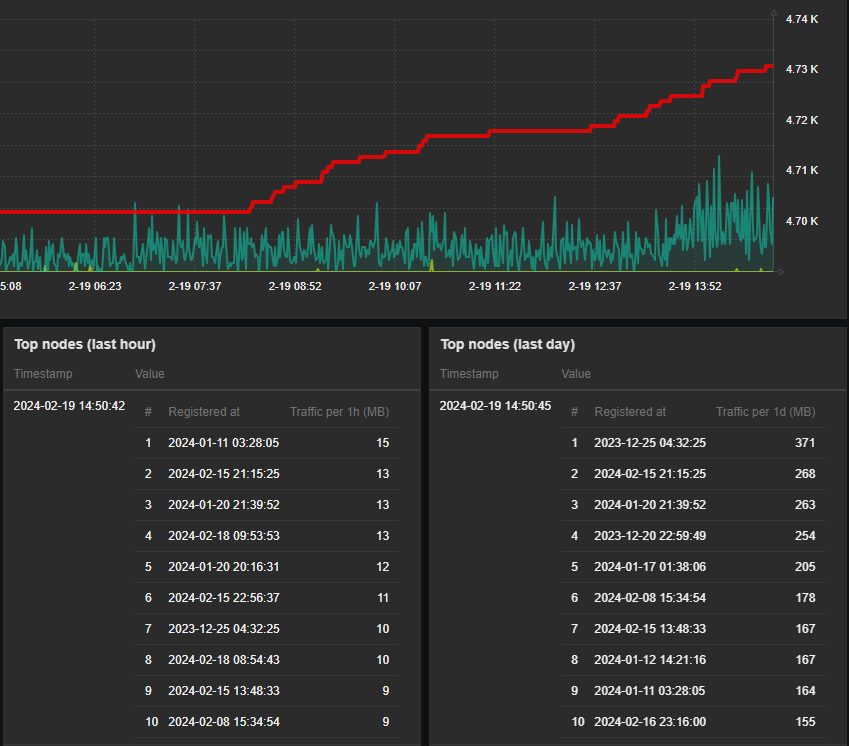
It becomes a very powerful tool to display nicely formatted data snapshots. Simple yet very good example here would be to display some content, which requires human readable structure – a table.

So again, integration with other dashboard widgets is so smooth – with just some custom HTML / CSS around your data you wrap it into something that looks like brand new “table” widget. Isn’t it awesome? And you are of course not limited to tables… Just use your imagination!

Conclusion

Although I personally prefer bash as the first option to solve things, there is no big difference regarding which scripting or programming languages to choose when extending Zabbix in these ways. Just try anything you feel most comfortable with.

I hope that examples shown here inspired you in some ways. Happy scripting!

The post Extending Zabbix: the power of scripting appeared first on Zabbix Blog.

OpenAI Is Not Training on Your Dropbox Documents—Today

Post Syndicated from Bruce Schneier original https://www.schneier.com/blog/archives/2023/12/openai-is-not-training-on-your-dropbox-documents-today.html

There’s a rumor flying around the Internet that OpenAI is training foundation models on your Dropbox documents.

Here’s CNBC. Here’s Boing Boing. Some articles are more nuanced, but there’s still a lot of confusion.

It seems not to be true. Dropbox isn’t sharing all of your documents with OpenAI. But here’s the problem: we don’t trust OpenAI. We don’t trust tech corporations. And—to be fair—corporations in general. We have no reason to.

Simon Willison nails it in a tweet:

“OpenAI are training on every piece of data they see, even when they say they aren’t” is the new “Facebook are showing you ads based on overhearing everything you say through your phone’s microphone.”

Willison expands this in a blog post, which I strongly recommend reading in its entirety. His point is that these companies have lost our trust:

Trust is really important. Companies lying about what they do with your privacy is a very serious allegation.

A society where big companies tell blatant lies about how they are handling our data—­and get away with it without consequences­—is a very unhealthy society.

A key role of government is to prevent this from happening. If OpenAI are training on data that they said they wouldn’t train on, or if Facebook are spying on us through our phone’s microphones, they should be hauled in front of regulators and/or sued into the ground.

If we believe that they are doing this without consequence, and have been getting away with it for years, our intolerance for corporate misbehavior becomes a victim as well. We risk letting companies get away with real misconduct because we incorrectly believed in conspiracy theories.

Privacy is important, and very easily misunderstood. People both overestimate and underestimate what companies are doing, and what’s possible. This isn’t helped by the fact that AI technology means the scope of what’s possible is changing at a rate that’s hard to appreciate even if you’re deeply aware of the space.

If we want to protect our privacy, we need to understand what’s going on. More importantly, we need to be able to trust companies to honestly and clearly explain what they are doing with our data.

On a personal level we risk losing out on useful tools. How many people cancelled their Dropbox accounts in the last 48 hours? How many more turned off that AI toggle, ruling out ever evaluating if those features were useful for them or not?

And while Dropbox is not sending your data to OpenAI today, it could do so tomorrow with a simple change of its terms of service. So could your bank, or credit card company, your phone company, or any other company that owns your data. Any of the tens of thousands of data brokers could be sending your data to train AI models right now, without your knowledge or consent. (At least, in the US. Hooray for the EU and GDPR.)

Or, as Thomas Claburn wrote:

“Your info won’t be harvested for training” is the new “Your private chatter won’t be used for ads.”

These foundation models want our data. The corporations that have our data want the money. It’s only a matter of time, unless we get serious government privacy regulation.

The Zabbix Advantage for Business

Post Syndicated from Michael Kammer original https://blog.zabbix.com/the-zabbix-advantage-for-business/26497/

CIOs and CITOs know all too well that a smoothly functioning network is the backbone of any business. Your network has to guarantee reliability, performance, and security. An unreliable network, by contrast, means damaged productivity, negative customer perceptions, and haphazard security. The solution is network monitoring, and in this post we’ll explore the reasons why Zabbix is the ideal monitoring solution for any business.

What is network monitoring?

Network monitoring is a critical IT process where all networking components (as well as key performance indicators like CPU utilization and network bandwidth) are constantly monitored to improve performance and eliminate bottlenecks. It provides real-time information that network administrators need to determine whether a network is running optimally.

Why Zabbix?

At Zabbix, we’re here to help you deliver for your customers, flawlessly and without interruptions. Our monitoring solution is 100% open source, available in over 20 languages, and able to collect an unlimited amount of data. Designed with enterprise requirements in mind, Zabbix provides a comprehensive, “single pane of glass” view of any size environment. Put simply, Zabbix allows you to monitor anything – from physical and virtual servers or containers to network infrastructure, applications, and cloud services.

What’s more, we offer a wide variety of additional professional services to go along with our solution, including:

  • Multiple technical support subscriptions that are tailored to the needs of your business
  • Certified training programs that are designed to help you master Zabbix under the guidance of top experts
  • A wide range of professional services, including template building, upgrades, consulting, and more

Keep reading to find out more about the difference Zabbix can make for your business.

The Zabbix advantage

IT teams are under enormous pressure to have their networks functioning perfectly 100% of the time, and with good reason. It’s simply not possible to run a business with a malfunctioning network. Here are 5 key reasons why you need to make network monitoring a top priority, and why Zabbix is the right answer for all of them.

Reliability

A network monitoring solution’s main reason for being is to show whether a device is working or not. Taking a proactive approach to maintaining a healthy network will keep tech support requests and downtime to an absolute minimum. Zabbix makes it easy to do so by automatically detecting problem states in your metric flow. Not only that, but our automated predictive functions can also help you react proactively. They do this by forecasting a value for early alerting and predicting the time left until you reach a problem threshold. Automation then allows you to remove additional inefficiencies.

Visibility

Having complete visibility of all your hardware and software assets allows you to easily monitor the health of your network. Zabbix lets businesses access metrics, issues, reports, and maps with a single click, allowing you to:

  • Analyze and correlate your metrics with easy-to-read graphs
  • Track your monitoring targets on an interactive geo-map
  • Display the statuses of your elements together with real-time data to get a detailed overview of your infrastructure on a Zabbix map
  • Generate scheduled PDF reports from any Zabbix dashboard
  • Extend the native Zabbix frontend functionality by developing your own frontend widgets and modules

Performance

By making it easy to monitor anything, Zabbix lets you know which parts of your network are being properly used, overused, or underused. This can help you uncover unnecessary costs that can be eliminated or identify a network component that needs upgrading.

Compliance

Today’s IT teams need to meet strict regulatory and protection standards in increasingly complex networks. Zabbix can spot changes in normal system behavior and unusual data flow. It can then either leverage multiple messaging channels to notify your team about anomalies or simply resolve any issues automatically.

Profitability

Zabbix has an extensive track record of making businesses more productive by saving network management time and lowering operating costs. Servers, for example, are machines that inevitably break down from time to time. Being able to quickly re-launch after a failure has occurred and minimizing the server downtime are vital. By making sure your team is aware of any and all current and impending issues, Zabbix can reduce downtime and increase the productivity and efficiency of your business.

Zabbix across industries

Whatever field you’re in, there’s no substitute for consistent, problem-free service when it comes to gaining the trust and loyalty of customers. Zabbix has an extensive track record of helping clients in multiple industries achieve their goals.

Zabbix for healthcare

A typical hospital relies on tens of thousands of connected devices. Manually checking each one for anomalies simply isn’t practical. Establishing a stable service level is a vital issue in most industries, but in healthcare it’s literally a matter of life and death. With Zabbix, hospital IT teams receive potentially life-saving alerts if anything is out of the ordinary.

What’s more, Zabbix can monitor progress toward expected outcomes, providing up-to-the-minute statistics on data errors or IT system failures. Issues, response times, and potential bottlenecks are displayed in easy-to-read graphs and charts. This allows hospital staff to follow up on the presence or absence of problems.

Zabbix for banking and finance

Financial institutions of all sizes rely on their networks to maintain connectivity and productivity. By processing millions of checks per minute and considering very complex dependencies between different elements of infrastructure, Zabbix allows banks to proactively detect and resolve network problems before they turn into major business disruptions.

Zabbix is also designed to seamlessly connect distributed architecture, including remote offices, branches, and even individual ATMs. Some of our financial industry clients previously used up to 20 different monitoring tools. Each alert sent hundreds of emails to different people, making it impossible to effectively monitor the environment. Naturally, they found Zabbix’s ability to monitor many thousands of devices and “single pane of glass” view to be a significant upgrade.

Zabbix for education

In an age of digital course materials and resources, schools and universities can’t operate without functioning IT infrastructures. Our clients in education typically have heterogeneous infrastructures with thousands of servers and clients. They also possess all kinds of connected devices, dozens of different operating systems, multiple locations, and hundreds of IT staff.

Zabbix has proven itself to be a simple, cost-effective method of monitoring geographically distributed campuses and educational sites. We’ve done this by:

  • Providing early notification of possible viruses, worms, Trojan horses, and other transmitters of system infection
  • Monitoring IT systems for intellectual property (IP) protection purposes
  • Saving human resources by reducing manual work

Zabbix for government

Network monitoring is critical for government agencies, as downtime can bring a halt to vital public services. Our public-sector clients range from city-wide public transportation companies all the way up to entire prefectures. They use Zabbix to monitor the availability of utilities, transport, lighting, and many other public services.

In the process, Zabbix increases the effectiveness of budget expenditures by providing precise and accountable data on how public resources are used. This makes it easier to justify further expenditures. In most business software, agents are required for each monitored host and costs increase in proportion to the number of monitored hosts. By contrast, Zabbix is open source and the software itself is free of charge, resulting in anticipated cost reductions of up to 25% in many cases.

Zabbix for retail

Retail environments increasingly depend on network-connected equipment, particularly when it comes to warehouse monitoring and tracking SKUs (stock keeping units). Zabbix delivers an all-in-one tool to monitor different applications, metrics, processes, and equipment while providing a complete picture about the availability and performance of all the components that make a retail business successful. This makes it possible for retailers to easily automate store openings and closings, monitor cash machines, and keep track of access system log entries.

Not only that, the quantity and quality of information that Zabbix collects makes it easy for retailers to conduct a more accurate analysis of what is happening (or what may happen) and take preventive measures. Our retail clients find that having this level of control over their resources and services increases the confidence of their teams as well as their customers.

Zabbix for telecom

Internet, telephony, and television verticals require availability and consistency. The key to success is providing your services 24/7/365.

Zabbix makes this possible by providing full visibility of all network and customer devices, allowing operators to know of any outage before customers do and take necessary actions. Some of our telecommunications clients are able to effortlessly monitor well over 100,000 devices with a single Zabbix server. This helps them improve the customer experience and driving growth in the process.

Zabbix for aerospace

In the aerospace industry, timely data delivery and issue notification are the keys to safe operations. Aircraft depend on complex electronic systems that can diagnose the slightest deviations and make malfunctions known. Unfortunately, this is often in the form of either an indicator light on an instrument panel or a log message that is accessible only with specialized software or tools.

With Zabbix, all data transfers from the aircraft’s diagnostic system to the responsible employees can happen automatically. Error prioritization and escalation to further levels can also happen automatically if any aircraft has an ongoing issue that remains active for multiple days.

Conclusion

At Zabbix, our goal is a world without interruptions, powered by a world-class universal monitoring solution that’s available and affordable to any business. Our open-source software allows you to monitor your entire IT stack, no matter what size your infrastructure is or where it’s hosted.

That’s why government institutions across the globe as well as some of the world’s largest companies trust us with their network monitoring needs.

Get in touch with us to learn more and get started on the path to maximum efficiency and uptime today!


The post The Zabbix Advantage for Business appeared first on Zabbix Blog.

What is Network Monitoring? Everything You Need to Know

Post Syndicated from Michael Kammer original https://blog.zabbix.com/what-is-network-monitoring-everything-you-need-to-know/26539/

Your company’s network is the glue that bonds your enterprise together. The technology of networking is growing more stable and reliable all the time, but it doesn’t mean you can leave your network unattended – quality network monitoring is an absolute must-have.

What are network monitoring systems?

At its most basic, network monitoring is a critical IT process where all networking components (as well as key performance indicators like network hardware CPU utilization and network bandwidth) are continuously and proactively monitored to improve performance, eliminate bottlenecks, and prevent network congestion and downtime.

Put more simply, it’s the act of keeping an eye on all the connected elements that are relevant to your business. That means all your hardware and software resources, including routers, switches, firewalls, servers, PCs, printers, phones, and tablets.

A network monitoring system is a set of software tools that lets you program this action. It allows you to constantly monitor your network infrastructure by doing systematic tests to look for issues and notifying you if any are found. A good system makes monitoring your network easy by:

  • Allowing you to see all information in dashboards
  • Generating reports on demand
  • Sending alerts
  • Displaying the monitoring data you need in easy-to-read graphs

What are some key benefits of network monitoring?

A quality network monitoring solution allows you to:

Benchmark standard performance

Monitoring gives you the visibility to benchmark your network’s everyday performance. It also makes it easy to spot any fluctuations in performance, which in turn allows you to identify any unwanted changes.

Effectively allocate resources

IT teams need a clear understanding of the source of problems. They also need the ability to minimize tedious troubleshooting and put in place proactive measures to stay ahead of IT outages. To use a plumbing analogy, monitoring lets them fix cracks before a leak happens.

Identify security threats

Preventing security breaches is a major challenge for any organization. As attacks become increasingly more sophisticated and difficult to trace, detecting and mitigating any form of network threat before it escalates is critical. Network monitoring makes it easier to protect data and systems by providing early warning of any suspicious anomalies.

Manage a changing IT environment

New technologies like internet-enabled sensors, wireless devices, and cloud technologies make it harder for IT teams to track performance fluctuations or suspicious activity. A network monitoring solution can:

  • Give IT teams a comprehensive inventory of wired and wireless devices
  • Make it easy to analyze long-term trends
  • Help you get the most out of your available assets

Proactively detect and resolve issues before they affect users

Monitoring a network closely allows an organization to quickly resolve issues and prevent major disruptions. This means fewer interruptions to operations and better utilization of IT resources.

Deploy new technology and system upgrades successfully

Thanks to monitoring, IT teams can learn how equipment has performed over time and use trend analysis to see whether current technology can scale to meet business needs. This can:

  • Give a clear picture of whether a network is able to support the launch of a new technology
  • Mitigate any risks associated with a major change
  • Easily demonstrate ROI by providing comprehensive metrics

What are some different types of network monitoring?

Different types of monitoring exist depending on what exactly needs to be monitored. Some of the most common include fault monitoring, log monitoring, network performance monitoring, configuration monitoring, and availability monitoring.

Fault monitoring

As the name suggests, fault monitoring involves finding and reporting faults in a computer network. It is crucial for maintaining uninterrupted network uptime and is essential to keeping all programs and services running smoothly.

Log monitoring

Resources such as servers, applications, and websites continuously generate logs, which can:

  • Provide valuable insights into user activity
  • Help a business comply with regulations
  • Promptly resolve incidents
  • Boost network security

Network performance monitoring (NPM)

NPM tracks monitoring parameters like latency, network traffic, bandwidth usage, and throughput, with the goal of optimizing user experience. NPM tools provide valuable information that can be used to minimize downtime and troubleshoot network issues.

Configuration monitoring

Monitoring network configuration involves keeping track of the software and firmware in use on the network and making sure that any inconsistencies are identified and addressed. This prevents any gaps in visibility or security.

Network availability monitoring

Availability monitoring is the monitoring of all IT infrastructure to determine the uptime of devices. By consistently monitoring devices and servers, organizations can receive alerts when there is a network crash or when a device becomes unavailable. ICMP, SNMP, and Syslogs are the most commonly used availability monitoring techniques.

How does it work?

Network monitoring uses multiple techniques to test the availability and functionality of a network. Here are a few of the most common techniques used to collect data for monitoring software:

Ping

A ping is the simplest technique that monitoring software uses to test hosts within a network. The monitoring system sends out a signal and records:

  • Whether the signal was received,
  • How long it took the host to receive the signal
  • Whether any signal data was lost

That data is then used to determine:

  • Whether the host is active
  • How efficient the host is
  • The transmission time and packet loss experienced when communicating with the host
  • Any other vital information

Simple network management protocol (SNMP)

SNMP is the most widely used protocol for modern network management systems. It uses monitoring software to monitor individual devices in a network. In this system, each monitored device has SNMP agent monitoring software that sends information about the device’s performance to the monitoring solution, which collects this information in a database and then analyzes it for errors.

Syslog

Syslog is an automated messaging system that sends messages when an event affects a network device. Technicians can set up devices to send out messages when the device encounters an error, shuts down unexpectedly, encounters a configuration failure, and more. These messages often contain information that can be used for system management as well as security systems.

Scripts

Scripts are simple programs that collect basic information and instruct the network to perform an action within certain conditions. They can fill gaps in monitoring software functionality, performing scheduled tasks such as resetting and reconfiguring a public access computer every night.

Scripts can also be used to collect data, sending out an alert if results don’t fall within certain thresholds. Network managers will usually set these thresholds, programming the network software to send out an alert if data indicates issues, including:

  • Slow throughput
  • High error rates
  • Unavailable devices
  • Slower-than-usual response times

How can businesses benefit from network monitoring?

Here are 5 ways that quality network monitoring can benefit any business:

Increased reliability

The main function of any monitoring solution is to show whether a device is working or not. A proactive approach to maintaining a healthy network will keep tech support requests and downtime to an absolute minimum.

Improved visibility

Having complete visibility of all your hardware and software assets allows you to easily monitor the health of your network. Monitoring tracks the data moving along cables and through servers, switches, connections, and routers. In the event of a problem, your IT team can identify the root cause and fix the issue quickly.

Enhanced performance

Network monitoring software lets you know which parts of your network are being properly used, overused, or underused. You can also uncover unnecessary costs that can be eliminated or identify a network component that needs upgrading.

Stricter compliance

Today’s IT teams need to meet strict regulatory and protection standards in increasingly complex networks. The latest compliance guidelines recommend actively watching for changes in normal system behavior and unusual data flow. The data provided by monitoring tools makes it easy to assess your entire system and deliver a service that meets all required standards.

Greater profitability

Network monitoring makes businesses more productive by saving network management time and lowering operating costs. If your team is aware of current and impending issues, you can reduce downtime and increase productivity and efficiency.

The Zabbix advantage

At Zabbix, we’ve perfected an enterprise IT infrastructure monitoring software that can deploy anywhere and monitor any device, system, or app in any environment while providing comprehensive data protection, easy integration, and unlimited visualization options.

You can also count on complete transparency, a predictable release cycle, a vibrant and active user community, and an outstanding user experience.

Everything we do scales easily, so we’re able to grow right along with you. What’s more, we offer a comprehensive range of professional services, including implementation, integration, custom development, consulting services, technical support, and a full suite of training programs.

The best part? Because Zabbix is open-source, it’s not just affordable – it’s free. Get in touch with us to find out more and get started on the path to maximum network efficiency today.

FAQ

What is an example of basic network monitoring?

An example of basic network monitoring is a network engineer collecting real-time data from a data center and setting up alerts when a problem (such as a device failure, a temperature spike, a power outage, or a network capacity issue) appears.

What is network monitoring used for?

Network monitoring can:

• Determine whether a network is running optimally in real time
• Proactively identify deficiencies and optimize efficiency
• Catch and repair problems before they impact operations
• Reduce downtime and make sure employees have access to the resources they need
• Boost the availability of APIs and webpages
• Optimize network performance and availability

What is the most popular network monitoring program?

Some of the most popular network monitoring programs available on the market include:

• Zabbix
• SolarWinds Network Performance Monitor
• Auvik
• Datadog
• ManageEngine OpManager
• Site24x7
• Checkmk
• Progress WhatsUp Gold
• Microsoft Resource Monitor
• Wireshark
• Nagios
• Ntop
• Cacti
• FreeNATS
• Icinga

What are the key steps in network monitoring?

A network monitoring process includes all phases involved in executing efficient network monitoring. These phases include:

  • Locating all key network components
  • Actively monitoring the components
  • Creating alerts for component health and metrics
  • Making a plan for managing issues
  • Analyzing generated reports
  • Adjusting the process as necessary

The post What is Network Monitoring? Everything You Need to Know appeared first on Zabbix Blog.

The Hacker Tool to Get Personal Data from Credit Bureaus

Post Syndicated from Bruce Schneier original https://www.schneier.com/blog/archives/2023/09/the-hacker-tool-to-get-personal-data-from-credit-bureaus.html

The new site 404 Media has a good article on how hackers are cheaply getting personal information from credit bureaus:

This is the result of a secret weapon criminals are selling access to online that appears to tap into an especially powerful set of data: the target’s credit header. This is personal information that the credit bureaus Experian, Equifax, and TransUnion have on most adults in America via their credit cards. Through a complex web of agreements and purchases, that data trickles down from the credit bureaus to other companies who offer it to debt collectors, insurance companies, and law enforcement.

A 404 Media investigation has found that criminals have managed to tap into that data supply chain, in some cases by stealing former law enforcement officer’s identities, and are selling unfettered access to their criminal cohorts online. The tool 404 Media tested has also been used to gather information on high profile targets such as Elon Musk, Joe Rogan, and even President Joe Biden, seemingly without restriction. 404 Media verified that although not always sensitive, at least some of that data is accurate.

Google Is Using Its Vast Data Stores to Train AI

Post Syndicated from Bruce Schneier original https://www.schneier.com/blog/archives/2023/07/google-is-using-its-vast-data-stores-to-train-ai.html

No surprise, but Google just changed its privacy policy to reflect broader uses of all the surveillance data it has captured over the years:

Research and development: Google uses information to improve our services and to develop new products, features and technologies that benefit our users and the public. For example, we use publicly available information to help train Google’s AI models and build products and features like Google Translate, Bard, and Cloud AI capabilities.

(I quote the privacy policy as of today. The Mastodon link quotes the privacy policy from ten days ago. So things are changing fast.)

Privacy of Printing Services

Post Syndicated from Bruce Schneier original https://www.schneier.com/blog/archives/2023/07/privacy-of-printing-services.html

The Washington Post has an article about popular printing services, and whether or not they read your documents and mine the data when you use them for printing:

Ideally, printing services should avoid storing the content of your files, or at least delete daily. Print services should also communicate clearly upfront what information they’re collecting and why. Some services, like the New York Public Library and PrintWithMe, do both.

Others dodged our questions about what data they collect, how long they store it and whom they share it with. Some—including Canon, FedEx and Staples—declined to answer basic questions about their privacy practices.

Zabbix 6.4 is out now!

Post Syndicated from Arturs Lontons original https://blog.zabbix.com/zabbix-6-4-is-out-now/25444/

Zabbix team is pleased to announce the release of the latest Zabbix major version – Zabbix 6.4. The release delivers many long-awaited improvements, such as Just-in-time LDAP and SAML user provisioning; support of older Zabbix proxy versions for simplified proxy management and zerodowntime Zabbix upgrades; near-instant configuration sync across Zabbix agents and proxies, and much more! 

New features and improvements

Just-in-time (JIT) user provisioning 

Zabbix 6.4 adds support of JIT user provisioning for LDAP and SAML authentication.

JIT user provisioning can be enabled in LDAP/SAML authentication settings

Zabbix administrators can now configure user provisioning by selecting the LDAP group pattern for matching and automatically assign User groups and User roles to the discovered users. Media types can also be mapped based on LDAP/SAML attributes.

A media can be assigned to the provisioned users based on their LDAP/SAML attributes
A group and role is assigned to the provisioned users

Cause and symptom events 

Zabbix 6.4 adds the ability to mark events as Cause or Symptom events. This allows us to filter events in a way, where we can see only root cause problems instead of being overwhelmed by symptom events. It is also possible to pause action operations for symptom events as to avoid unnecessary noise.

Multiple symptom events can be linked to a single cause event
Any event can be marked as a symptom or converted to a cause event
Action operations can be paused for symptom problems

Instant propagation of configuration changes 

Continuing to build on changes introduced in Zabbix 6.2 (Collecting only configuration change deltas), Zabbix 6.4 introduces instant configuration synchronization across passive and active agents and proxies.

  • Instead of receiving the full configuration copy every 2 minutes (old behavior), in Zabbix 6.4 active agent receives the configuration copy only when changes have been performed
  • RefreshActiveChecks parameter now supports a range 1-86400 (old range: 60-3600)
  • The ProxyConfigFrequency parameter is now used in both Zabbix server (for passive mode) and Zabbix proxy (for active mode) configuration files
  • ConfigFrequency parameter in Zabbix proxy configuration is now deprecated
  • Default ProxyConfigFrequency parameter is 10 seconds (down from 1 hour)

This also improves the performance of Zabbix servers and proxies, since only configuration deltas are synced. As for active agents – the active agent receives a full configuration copy only when any changes are detected in the configuration instead of receiving it every RefreshActiveChecks interval (old behavior)

New SNMP walk item for bulk collection and discovery of SNMP metrics 

A new SNMP agent walk item has been introduced. The item looks at a specified OID or OIDs and polls their indexes by suing the SNMP GetBulk requests. An SNMP GetBulk request can provide better performance and more rapid metric collection and discovery from enterprise-tier SNMP devices.

For example:

walk[1.3.6.1.1,1.3.6.2]

Result:

1.3.6.1.2.1.1 = STRING: "<value1>"
1.3.6.1.2.1.2 = STRING: "<value2>"
1.3.6.1.2.1.3 = STRING: "<value3>"
1.3.6.2.1 = INTEGER: 10
1.3.6.2.2 = INTEGER: 20

Textual values can then be transformed to JSON, which can serve as a master item for low-level discovery rules:

SNMP walk to JSON transforms the obtained data to JSON

Resulting values:

[
{"{#SNMPINDEX}":"7","{#IFALIAS}":"Uplink PT","{#IFTYPE}":"6"},
{"{#SNMPINDEX}": "8","{#IFALIAS}": "Uplink FB","{#IFTYPE}":"6"},
{"{#SNMPINDEX}": "473","{#IFALIAS}":"lag","{#IFTYPE}":"161"}
]

Once the data is converted to JSON, we can use SNMP walk value preprocessing step together with LLD macros, to create dependent item prototypes:

SNMP walk value preprocessing step can be used to specify value for extraction in item prototypes

Support of data collection for outdated proxies

To improve the Zabbix component upgrade workflows (especially for large environments), outdated proxies can still perform data collection with a newer Zabbix server version:

  • Proxy is fully supported if it has the same major version as the Zabbix server
  • Proxy is marked as outdated if its major version is older than the Zabbix server but not older than the previous LTS release
  • Outdated proxies still support data collection and remote command execution
  • In other scenarios, the proxy becomes not supported
Deployed proxy compatibility can be seen in Zabbix frontend
Server version Current proxy version Outdated proxy version Unsupported proxy version
6.4 6.4 6.0, 6.2 Older than 6.0; newer than 6.4
7.0 7.0 6.0, 6.2, 6.4 Older than 6.0; newer than 7.0
7.2 7.2 7.0 Older than 7.0; newer than 7.2

New menu layout 

Zabbix menu layout has been redesigned. The goal of the new menu layout is to provide logical and consistent access to main Zabbix features.

The new menu provides a more consistent and logical layout to Zabbix features

Real-time streaming of metrics and events over HTTP

In addition to streaming collected metrics and events to files, Zabbix 6.4 adds the option to stream metrics and events over HTTP. Zabbix administrators have the option to filter the data for streaming by using tag filters. A new Connectors section has been introduced under Administration – General. Here Zabbix administrators can define an external system where item values and events should be pushed to.

Define a new connector to stream metrics and events over HTTP

Zabbix 6.4 can be used as a source of information for other applications, analytics reports, and AI engines by streaming metrics and events over HTTP in real time. Metrics and events can be streamed to message brokers like Kafka, RabbitMQ, or Amazon Kinesis to adapt the behavior of external systems in real time. 

Template versioning 

Template versioning has been introduced to improve template management and ease of use. Templates are now marked with vendor ar version fields, which are visible in Zabbix frontend; these fields can also be added when writing a custom template.

Template version and vendor fields are visible in the frontend

Development framework for Zabbix widget creation 

Zabbix has a large developer community creating their own custom frontend modules, widgets and Go plugins. In Zabbix 6.4, our goal was to streamline this process by creating a development framework for widget creation. To achieve this, the following changes have been introduced:

  • Widgets have been converted to modules
  • Modules are now fully self-contained and modular
  • Built-in widgets reside in ui/widgets
  • Custom widgets reside in ui/modules/<widget>
  • Adding new widgets is as simple as adding new files without changing the existing files

In addition to these changes, we have also added a new Developer Center section to our documentation. The section contains guides, tutorials and code examples to guide our community in developing Frontend modules and widgets, as well as help with Zabbix agent 2 custom Go plugin development.

The Developer Center section contains guides, tutorials, and code examples for extending Zabbix

Other features and improvements 

The release includes many other changes:

  • Simple check, External check, SSH agent, Telnet agent item types now do not require an interface to be present on the host 
  • Pre-configured email media type settings for Gmail and O365 email providers 
  • Dynamic item value widget thresholds
  • Option to define custom labeled links for hosts and events
  • Ability to label trigger URLs
  • Improved preprocessing performance and thread-based preprocessing workers
  • Ability to label aggregated datasets in Graph widget
  • SQLite3 Zabbix proxies now automatically recreate the SQLite3 database file during an upgrade
  • A host status filter (enabled/disabled) has been added under Data collection – Hosts
  • Additional filtering options have been added to the Action log
  • Action log now supports import to CSV
  • Multiple context menu improvements to Host, Item and Event context menus
  • Old password verification is now required when changing your internal Zabbix user password
  • Value cache performance improvements when working with metrics that get updated less frequently than once per day
  • Added commands to enable profiling of rwlocks/mutexes (for debugging)

The full list of changes, bug fixes, and new features can be found in the Zabbix 6.4 release notes

New templates and integrations

Zabbix 6.4 comes pre-packaged with many new templates and integrations for the most popular vendors and cloud providers. Multiple existing templates have also received improvements:

  • Microsoft Azure MySQL servers 
  • Microsoft Azure PostgreSQL servers 
  • Microsoft Azure virtual machines 
  • Low-level discovery improvements in AWS by HTTP template 
  • Veeam Backup Enterprise Manager 
  • Veeam Backup and Replication 
  • Cisco Nexus 9000 Series 
  • BMC Control-M 
  • Cisco Meraki dashboard 
  • OS processes by Zabbix agent 
  • Improvements to filesystem discovery in official Zabbix OS templates 

Zabbix 6.4 introduces a webhook integration for the Line messaging app, allowing Zabbix events to be forwarded to the Line messenger. 

Zabbix 6.4 adds a variety of new templates and integrations

Zabbix 6.4 packages and images

Official Zabbix packages and images are available for: 

  • Linux distributions for different hardware platforms on RHEL, CentOS, Oracle Linux, Debian, SUSE, Ubuntu, Raspbian 
  • Virtualization platforms based on VMWare, VirtualBox, Hyper-V, XEN 
  • Docker 
  • Packages and pre-compiled agents for the most popular platforms, including macOS and MSI packages for Microsoft Windows 

You can find the download instructions and download the new version on the Download page.

One-click deployments for the following cloud platforms are coming soon: 

  • AWS, Azure, Google Cloud Platform, Digital Ocean 

Upgrading to Zabbix 6.4

In order to upgrade to Zabbix 6.4 you need to upgrade your repository package and download and install the new Zabbix component packages (Zabbix server, proxy, frontend, and other Zabbix components). When you start the Zabbix server, an automatic database schema upgrade will be performed. Zabbix agents are backward compatible; therefore, it is not required to install the new agent versions. You can perform the agent upgrade at a later time. 

If you’re using the official Docker container images – simply deploy a new set of containers for your Zabbix components. Once the Zabbix server container connects to the backend database, the database upgrade will be performed automatically.

You can find detailed step-by-step upgrade instructions on our Upgrade procedure page. 

Join the webinar

If you wish to learn more about the Zabbix 6.4 features and improvements, we invite you to join our What’s new in Zabbix 6.4 public webinar.

During the webinar, you will get the opportunity to:

  • Learn about Zabbix 6.4 features and improvements
  • See the latest Zabbix templates and integrations
  • Participate in a Q&A session with Zabbix founder and CEO Alexei Vladishev
  • Discuss the latest Zabbix version with Zabbix community and Zabbix team members

This is a public webinar – anyone can sign up, attend and have their questions answered by the Zabbix team!

Handy Tips #40: Simplify metric pattern matching by creating global regular expressions

Post Syndicated from Arturs Lontons original https://blog.zabbix.com/simplify-metric-pattern-matching-by-creating-global-regular-expressions/24225/

Streamline your data collection, problem detection and low-level discovery by defining global regular expressions. 

Pattern matching within unstructured data is mostly done by using regular expressions. Defining a regular expression can be a lengthy task, that can be simplified by predefining a set of regular expressions which can be quickly referenced down the line.  

Simplify pattern matching by defining global regular expressions:

  • Reference global regular expressions in log monitoring and snmp trap items
  • Simplify pattern matching in trigger functions and calculated items
  • Global regular expressions can be referenced in low-level discovery filters
  •  Combine multiple subexpressions into a single global regular expression
Check out the video to learn how to define and use global regular expressions.
Define and use global regular expressions: 
  1. Navigate to Administration General Regular expressions
  2. Type in your global regular expression name
  3. Select the regular expression type and provide subexpressions
  4. Press Add and provide multiple subexpressions
  5. Navigate to the Test tab and enter the test string
  6. Click on Test expressions and observe the result
  7. Press Add to save and add the global regular expression
  8. Navigate to Configuration Hosts
  9. Find the host on which you will test the global regular expression
  10. Click on either the Items, Triggers or Discovery button to open the corresponding section
  11. Find your item, trigger or LLD rule and open it
  12. Insert the global regular expression
  13. Use the @ symbol to reference a global regular expression by its name
  14. Update the element to save the changes
Tips and best practices
  • Each subexpressions and the total combined result can be tested in Zabbix frontend 
  • Zabbix uses AND logic if several subexpressions are defined 
  • Global regular expressions can be referenced by referring to their name, prefixed with the @ symbol 
  • Zabbix documentation contains the list of locations supporting the usage of global regular expression. 

Sign up for the official Zabbix Certified Specialist course and learn how to optimize your data collection, enrich your alerts with useful information, and minimize the amount of noise and false alarms. During the course, you will perform a variety of practical tasks under the guidance of a Zabbix certified trainer, where you will get the chance to discuss how the current use cases apply to your own unique infrastructure. 

The post Handy Tips #40: Simplify metric pattern matching by creating global regular expressions appeared first on Zabbix Blog.

Differences in App Security/Privacy Based on Country

Post Syndicated from Bruce Schneier original https://www.schneier.com/blog/archives/2022/09/differences-in-app-security-privacy-based-on-country.html

Depending on where you are when you download your Android apps, it might collect more or less data about you.

The apps we downloaded from Google Play also showed differences based on country in their security and privacy capabilities. One hundred twenty-seven apps varied in what the apps were allowed to access on users’ mobile phones, 49 of which had additional permissions deemed “dangerous” by Google. Apps in Bahrain, Tunisia and Canada requested the most additional dangerous permissions.

Three VPN apps enable clear text communication in some countries, which allows unauthorized access to users’ communications. One hundred and eighteen apps varied in the number of ad trackers included in an app in some countries, with the categories Games, Entertainment and Social, with Iran and Ukraine having the most increases in the number of ad trackers compared to the baseline number common to all countries.

One hundred and three apps have differences based on country in their privacy policies. Users in countries not covered by data protection regulations, such as GDPR in the EU and the California Consumer Privacy Act in the U.S., are at higher privacy risk. For instance, 71 apps available from Google Play have clauses to comply with GDPR only in the EU and CCPA only in the U.S. Twenty-eight apps that use dangerous permissions make no mention of it, despite Google’s policy requiring them to do so.

Research paper: “A Large-scale Investigation into Geodifferences in Mobile Apps“:

Abstract: Recent studies on the web ecosystem have been raising alarms on the increasing geodifferences in access to Internet content and services due to Internet censorship and geoblocking. However, geodifferences in the mobile app ecosystem have received limited attention, even though apps are central to how mobile users communicate and consume Internet content. We present the first large-scale measurement study of geodifferences in the mobile app ecosystem. We design a semi-automatic, parallel measurement testbed that we use to collect 5,684 popular apps from Google Play in 26 countries. In all, we collected 117,233 apk files and 112,607 privacy policies for those apps. Our results show high amounts of geoblocking with 3,672 apps geoblocked in at least one of our countries. While our data corroborates anecdotal evidence of takedowns due to government requests, unlike common perception, we find that blocking by developers is significantly higher than takedowns in all our countries, and has the most influence on geoblocking in the mobile app ecosystem. We also find instances of developers releasing different app versions to different countries, some with weaker security settings or privacy disclosures that expose users to higher security and privacy risks. We provide recommendations for app market proprietors to address the issues discovered.

Facebook Has No Idea What Data It Has

Post Syndicated from Bruce Schneier original https://www.schneier.com/blog/archives/2022/09/facebook-has-no-idea-what-data-it-has.html

This is from a court deposition:

Facebook’s stonewalling has been revealing on its own, providing variations on the same theme: It has amassed so much data on so many billions of people and organized it so confusingly that full transparency is impossible on a technical level. In the March 2022 hearing, Zarashaw and Steven Elia, a software engineering manager, described Facebook as a data-processing apparatus so complex that it defies understanding from within. The hearing amounted to two high-ranking engineers at one of the most powerful and resource-flush engineering outfits in history describing their product as an unknowable machine.

The special master at times seemed in disbelief, as when he questioned the engineers over whether any documentation existed for a particular Facebook subsystem. “Someone must have a diagram that says this is where this data is stored,” he said, according to the transcript. Zarashaw responded: “We have a somewhat strange engineering culture compared to most where we don’t generate a lot of artifacts during the engineering process. Effectively the code is its own design document often.” He quickly added, “For what it’s worth, this is terrifying to me when I first joined as well.”

[…]

Facebook’s inability to comprehend its own functioning took the hearing up to the edge of the metaphysical. At one point, the court-appointed special master noted that the “Download Your Information” file provided to the suit’s plaintiffs must not have included everything the company had stored on those individuals because it appears to have no idea what it truly stores on anyone. Can it be that Facebook’s designated tool for comprehensively downloading your information might not actually download all your information? This, again, is outside the boundaries of knowledge.

“The solution to this is unfortunately exactly the work that was done to create the DYI file itself,” noted Zarashaw. “And the thing I struggle with here is in order to find gaps in what may not be in DYI file, you would by definition need to do even more work than was done to generate the DYI files in the first place.”

The systemic fogginess of Facebook’s data storage made answering even the most basic question futile. At another point, the special master asked how one could find out which systems actually contain user data that was created through machine inference.

“I don’t know,” answered Zarashaw. “It’s a rather difficult conundrum.”

I’m not surprised. These systems are so complex that no humans understand them anymore. That allows us to do things we couldn’t do otherwise, but it’s also a problem.

EDITED TO ADD: Another article.

Surveillance of Your Car

Post Syndicated from Bruce Schneier original https://www.schneier.com/blog/archives/2022/08/surveillance-of-your-car.html

TheMarkup has an extensive analysis of connected vehicle data and the companies that are collecting it.

The Markup has identified 37 companies that are part of the rapidly growing connected vehicle data industry that seeks to monetize such data in an environment with few regulations governing its sale or use.

While many of these companies stress they are using aggregated or anonymized data, the unique nature of location and movement data increases the potential for violations of user privacy.

Websites that Collect Your Data as You Type

Post Syndicated from Bruce Schneier original https://www.schneier.com/blog/archives/2022/05/websites-that-collect-your-data-as-you-type.html

A surprising number of websites include JavaScript keyloggers that collect everything you type as you type it, not just when you submit a form.

Researchers from KU Leuven, Radboud University, and University of Lausanne crawled and analyzed the top 100,000 websites, looking at scenarios in which a user is visiting a site while in the European Union and visiting a site from the United States. They found that 1,844 websites gathered an EU user’s email address without their consent, and a staggering 2,950 logged a US user’s email in some form. Many of the sites seemingly do not intend to conduct the data-logging but incorporate third-party marketing and analytics services that cause the behavior.

After specifically crawling sites for password leaks in May 2021, the researchers also found 52 websites in which third parties, including the Russian tech giant Yandex, were incidentally collecting password data before submission. The group disclosed their findings to these sites, and all 52 instances have since been resolved.

“If there’s a Submit button on a form, the reasonable expectation is that it does something — that it will submit your data when you click it,” says Güneş Acar, a professor and researcher in Radboud University’s digital security group and one of the leaders of the study. “We were super surprised by these results. We thought maybe we were going to find a few hundred websites where your email is collected before you submit, but this exceeded our expectations by far.”

Research paper.

Interview with the Head of the NSA’s Research Directorate

Post Syndicated from Bruce Schneier original https://www.schneier.com/blog/archives/2022/02/interview-with-the-head-of-the-nsas-research-directorate.html

MIT Technology Review published an interview with Gil Herrera, the new head of the NSA’s Research Directorate. There’s a lot of talk about quantum computing, monitoring 5G networks, and the problems of big data:

The math department, often in conjunction with the computer science department, helps tackle one of NSA’s most interesting problems: big data. Despite public reckoning over mass surveillance, NSA famously faces the challenge of collecting such extreme quantities of data that, on top of legal and ethical problems, it can be nearly impossible to sift through all of it to find everything of value. NSA views the kind of “vast access and collection” that it talks about internally as both an achievement and its own set of problems. The field of data science aims to solve them.

“Everyone thinks their data is the messiest in the world, and mine maybe is because it’s taken from people who don’t want us to have it, frankly,” said Herrera’s immediate predecessor at the NSA, the computer scientist Deborah Frincke, during a 2017 talk at Stanford. “The adversary does not speak clearly in English with nice statements into a mic and, if we can’t understand it, send us a clearer statement.”

Making sense of vast stores of unclear, often stolen data in hundreds of languages and even more technical formats remains one of the directorate’s enduring tasks.

China’s Olympics App Is Horribly Insecure

Post Syndicated from Bruce Schneier original https://www.schneier.com/blog/archives/2022/01/chinas-olympics-app-is-horribly-insecure.html

China is mandating that athletes download and use a health and travel app when they attend the Winter Olympics next month. Citizen Lab examined the app and found it riddled with security holes.

Key Findings:

  • MY2022, an app mandated for use by all attendees of the 2022 Olympic Games in Beijing, has a simple but devastating flaw where encryption protecting users’ voice audio and file transfers can be trivially sidestepped. Health customs forms which transmit passport details, demographic information, and medical and travel history are also vulnerable. Server responses can also be spoofed, allowing an attacker to display fake instructions to users.
  • MY2022 is fairly straightforward about the types of data it collects from users in its public-facing documents. However, as the app collects a range of highly sensitive medical information, it is unclear with whom or which organization(s) it shares this information.
  • MY2022 includes features that allow users to report “politically sensitive” content. The app also includes a censorship keyword list, which, while presently inactive, targets a variety of political topics including domestic issues such as Xinjiang and Tibet as well as references to Chinese government agencies.
  • While the vendor did not respond to our security disclosure, we find that the app’s security deficits may not only violate Google’s Unwanted Software Policy and Apple’s App Store guidelines but also China’s own laws and national standards pertaining to privacy protection, providing potential avenues for future redress.

News article:

It’s not clear whether the security flaws were intentional or not, but the report speculated that proper encryption might interfere with some of China’s ubiquitous online surveillance tools, especially systems that allow local authorities to snoop on phones using public wireless networks or internet cafes. Still, the researchers added that the flaws were probably unintentional, because the government will already be receiving data from the app, so there wouldn’t be a need to intercept the data as it was being transferred.

[…]

The app also included a list of 2,422 political keywords, described within the code as “illegalwords.txt,” that worked as a keyword censorship list, according to Citizen Lab. The researchers said the list appeared to be a latent function that the app’s chat and file transfer function was not actively using.

The US government has already advised athletes to leave their personal phones and laptops home and bring burners.