Post Syndicated from Zhiyuan Zheng original https://blog.cloudflare.com/cloudflare-security-posture-management/
In today’s fast-paced digital landscape, companies are managing an increasingly complex mix of environments — from SaaS applications and public cloud platforms to on-prem data centers and hybrid setups. This diverse infrastructure offers flexibility and scalability, but also opens up new attack surfaces.
To support both business continuity and security needs, “security must evolve from being reactive to predictive”. Maintaining a healthy security posture entails monitoring and strengthening your security defenses to identify risks, ensure compliance, and protect against evolving threats. With our newest capabilities, you can now use Cloudflare to achieve a healthy posture across your SaaS and web applications. This addresses any security team’s ultimate (daily) question: How well are our assets and documents protected?
A predictive security posture relies on the following key components:
-
Real-time discovery and inventory of all your assets and documents
-
Continuous asset-aware threat detection and risk assessment
-
Prioritised remediation suggestions to increase your protection
Today, we are sharing how we have built these key components across SaaS and web applications, and how you can use them to manage your business’s security posture.
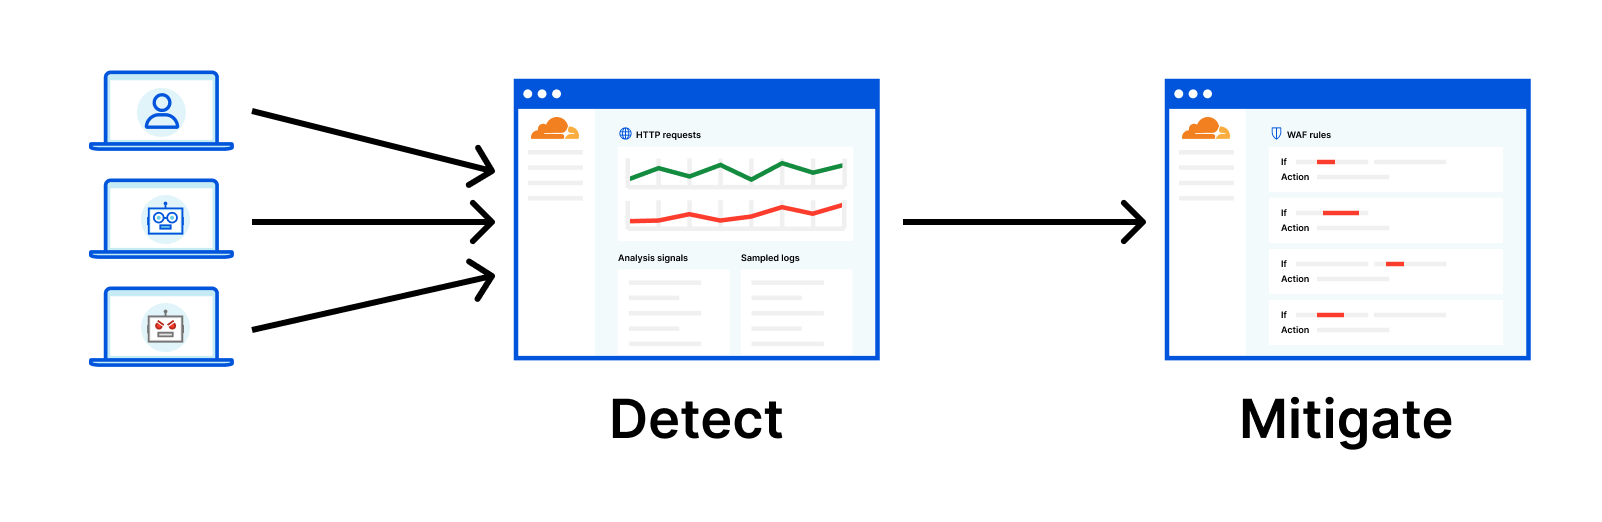
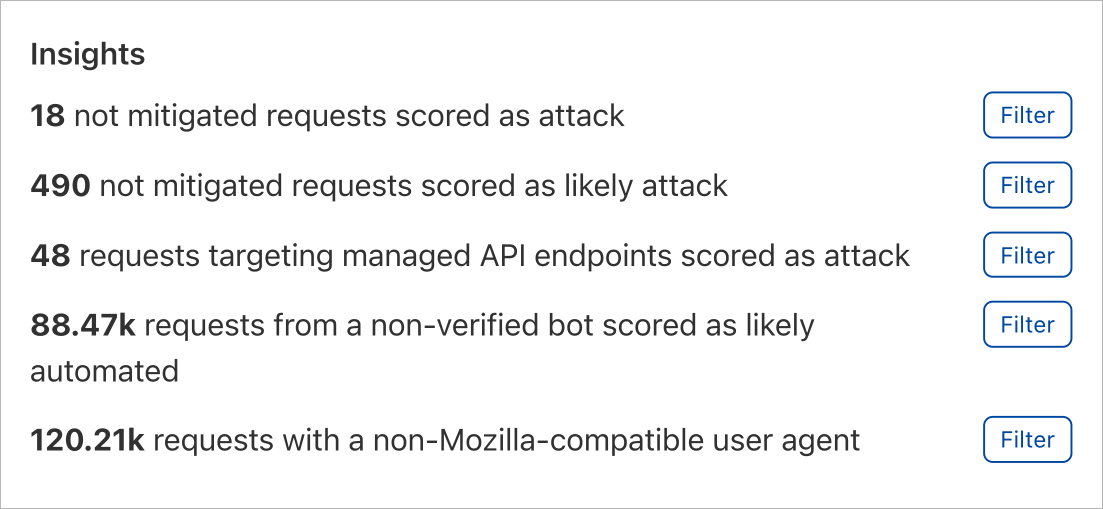
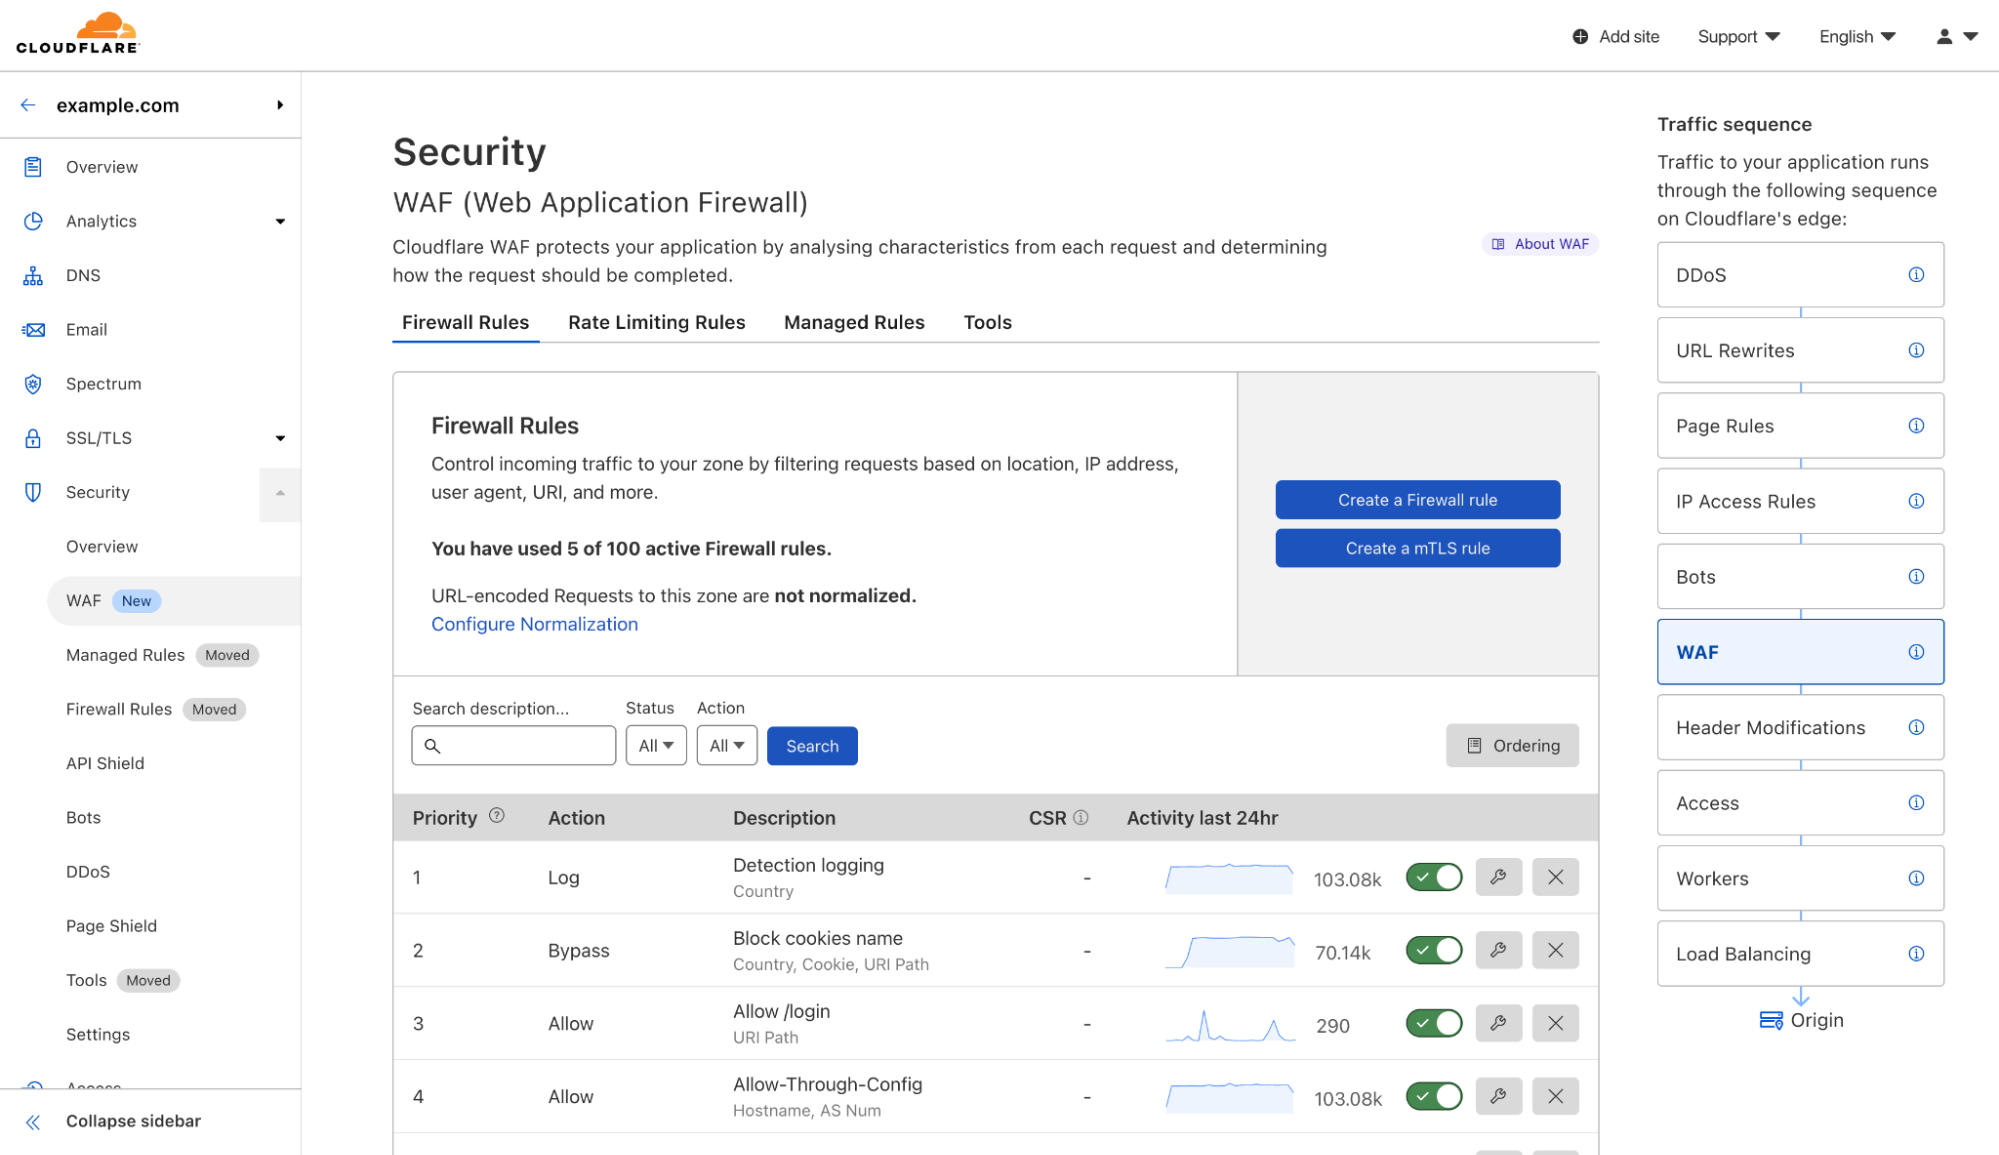
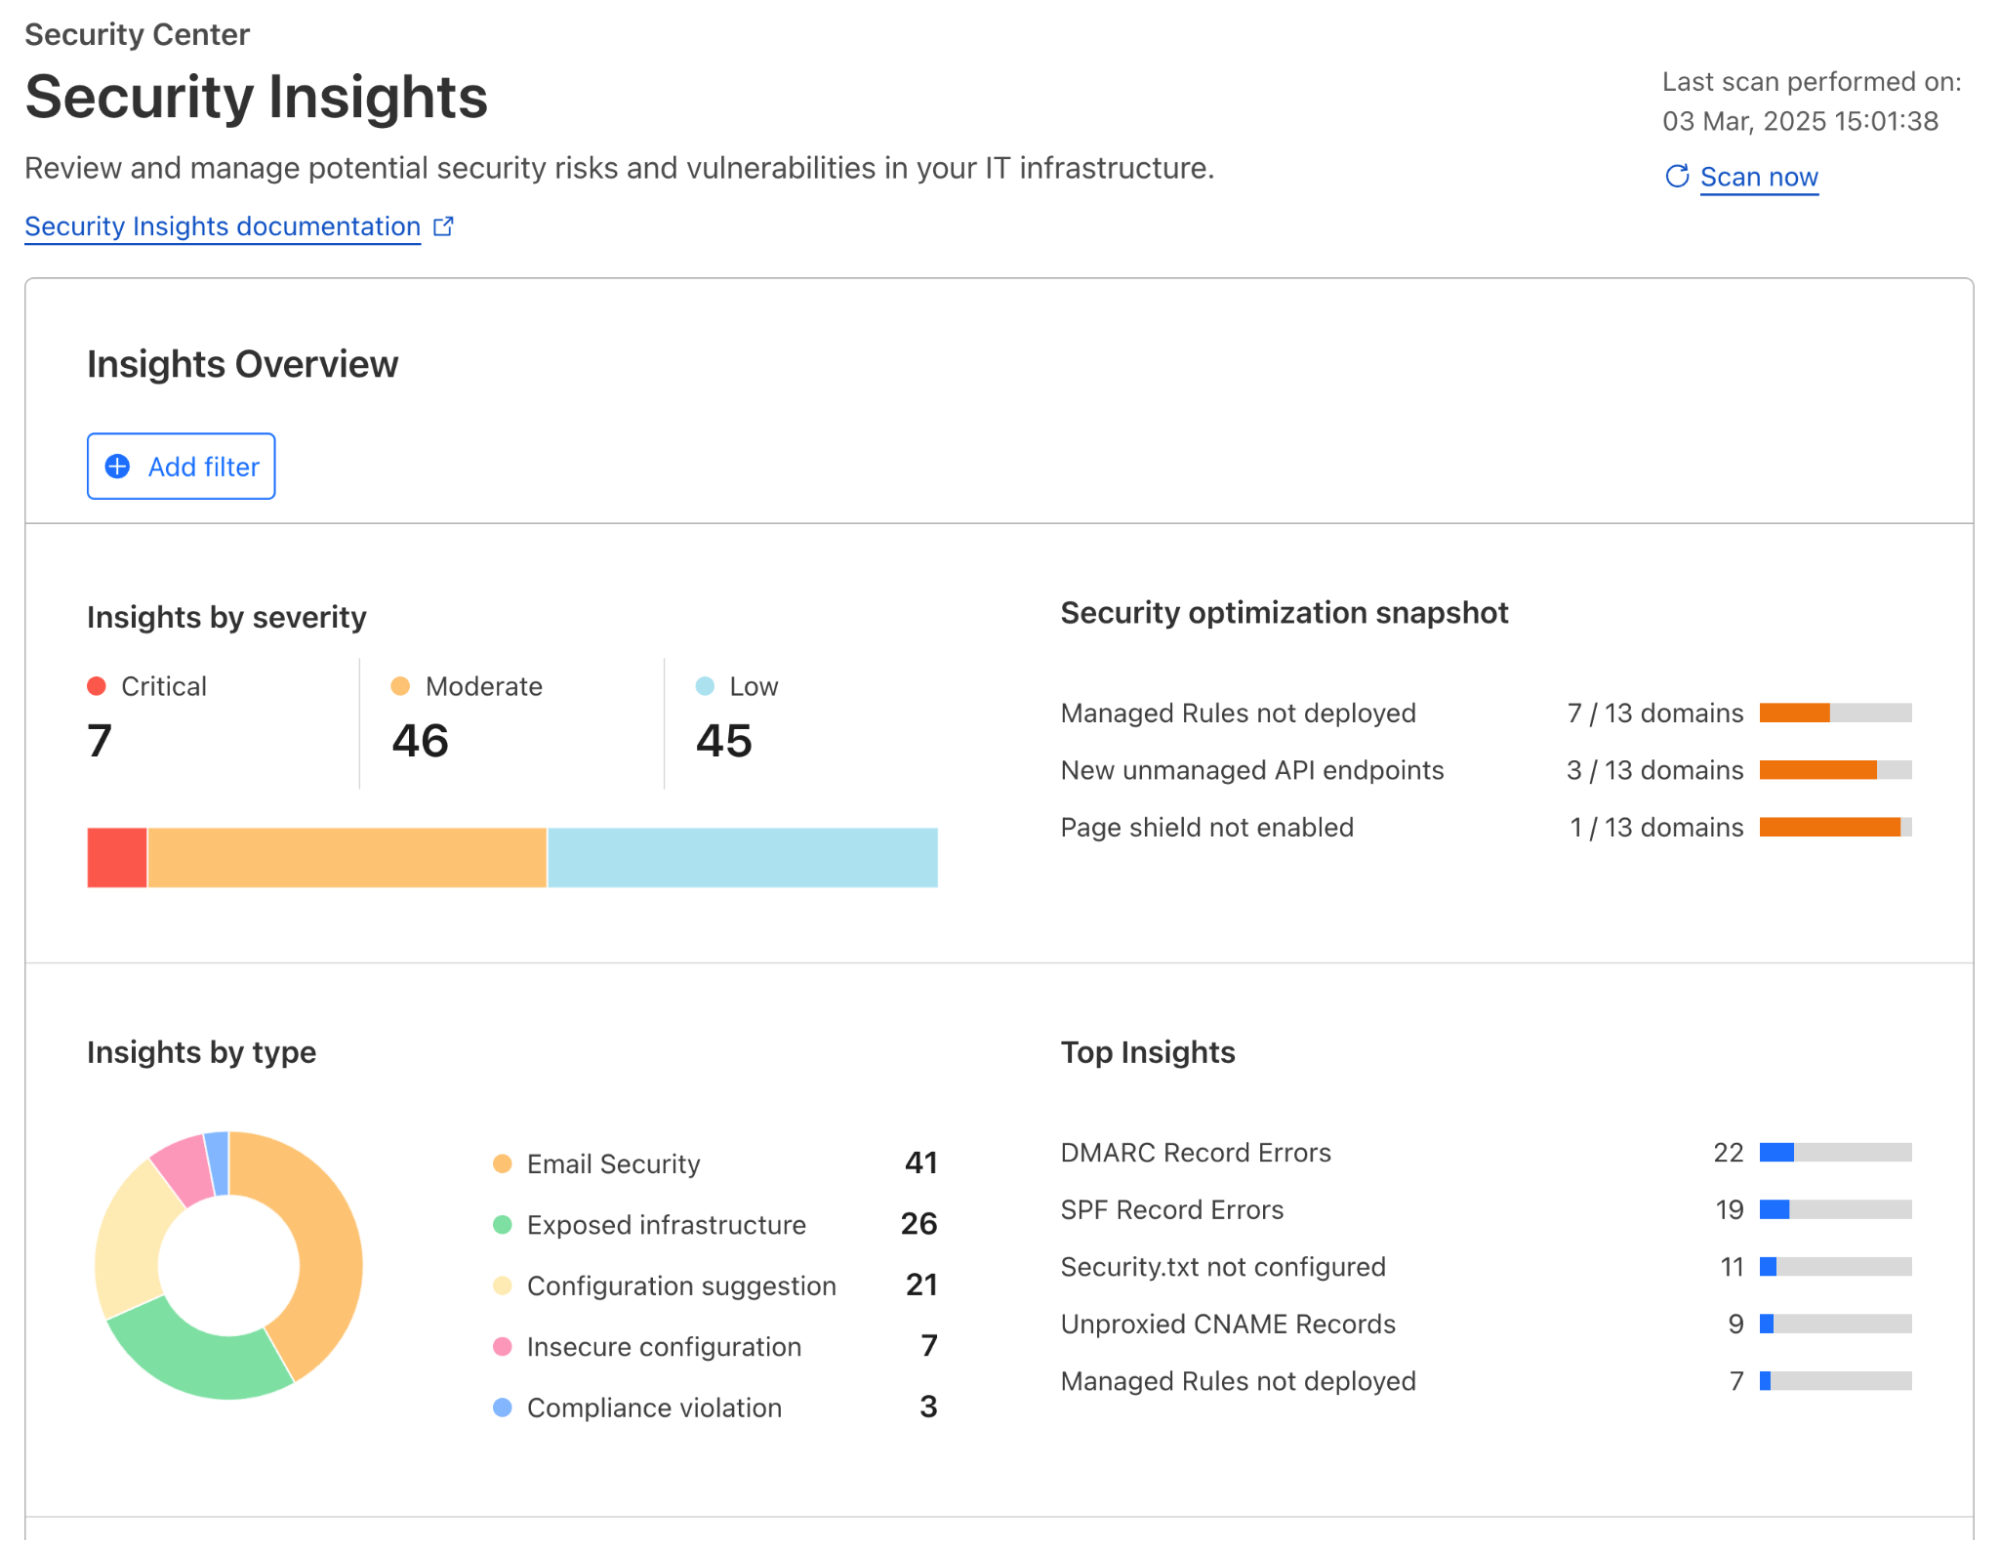
Regardless of the applications you have connected to Cloudflare’s global network, Cloudflare actively scans for risks and misconfigurations associated with each one of them on a regular cadence. Identified risks and misconfigurations are surfaced in the dashboard under Security Center as insights.
Insights are grouped by their severity, type of risks, and corresponding Cloudflare solution, providing various angles for you to zoom in to what you want to focus on. When applicable, a one-click resolution is provided for selected insight types, such as setting minimum TLS version to 1.2 which is recommended by PCI DSS. This simplicity is highly appreciated by customers that are managing a growing set of assets being deployed across the organization.
To help shorten the time to resolution even further, we have recently added role-based access control (RBAC) to Security Insights in the Cloudflare dashboard. Now for individual security practitioners, they have access to a distilled view of the insights that are relevant for their role. A user with an administrator role (a CSO, for example) has access to, and visibility into, all insights.
In addition to account-wide Security Insights, we also provide posture overviews that are closer to the corresponding security configurations of your SaaS and web applications. Let’s dive into each of them.
Without centralized posture management, SaaS applications can feel like the security wild west. They contain a wealth of sensitive information – files, databases, workspaces, designs, invoices, or anything your company needs to operate, but control is limited to the vendor’s settings, leaving you with less visibility and fewer customization options. Moreover, team members are constantly creating, updating, and deleting content that can cause configuration drift and data exposure, such as sharing files publicly, adding PII to non-compliant databases, or giving access to third party integrations. With Cloudflare, you have visibility across your SaaS application fleet in one dashboard.
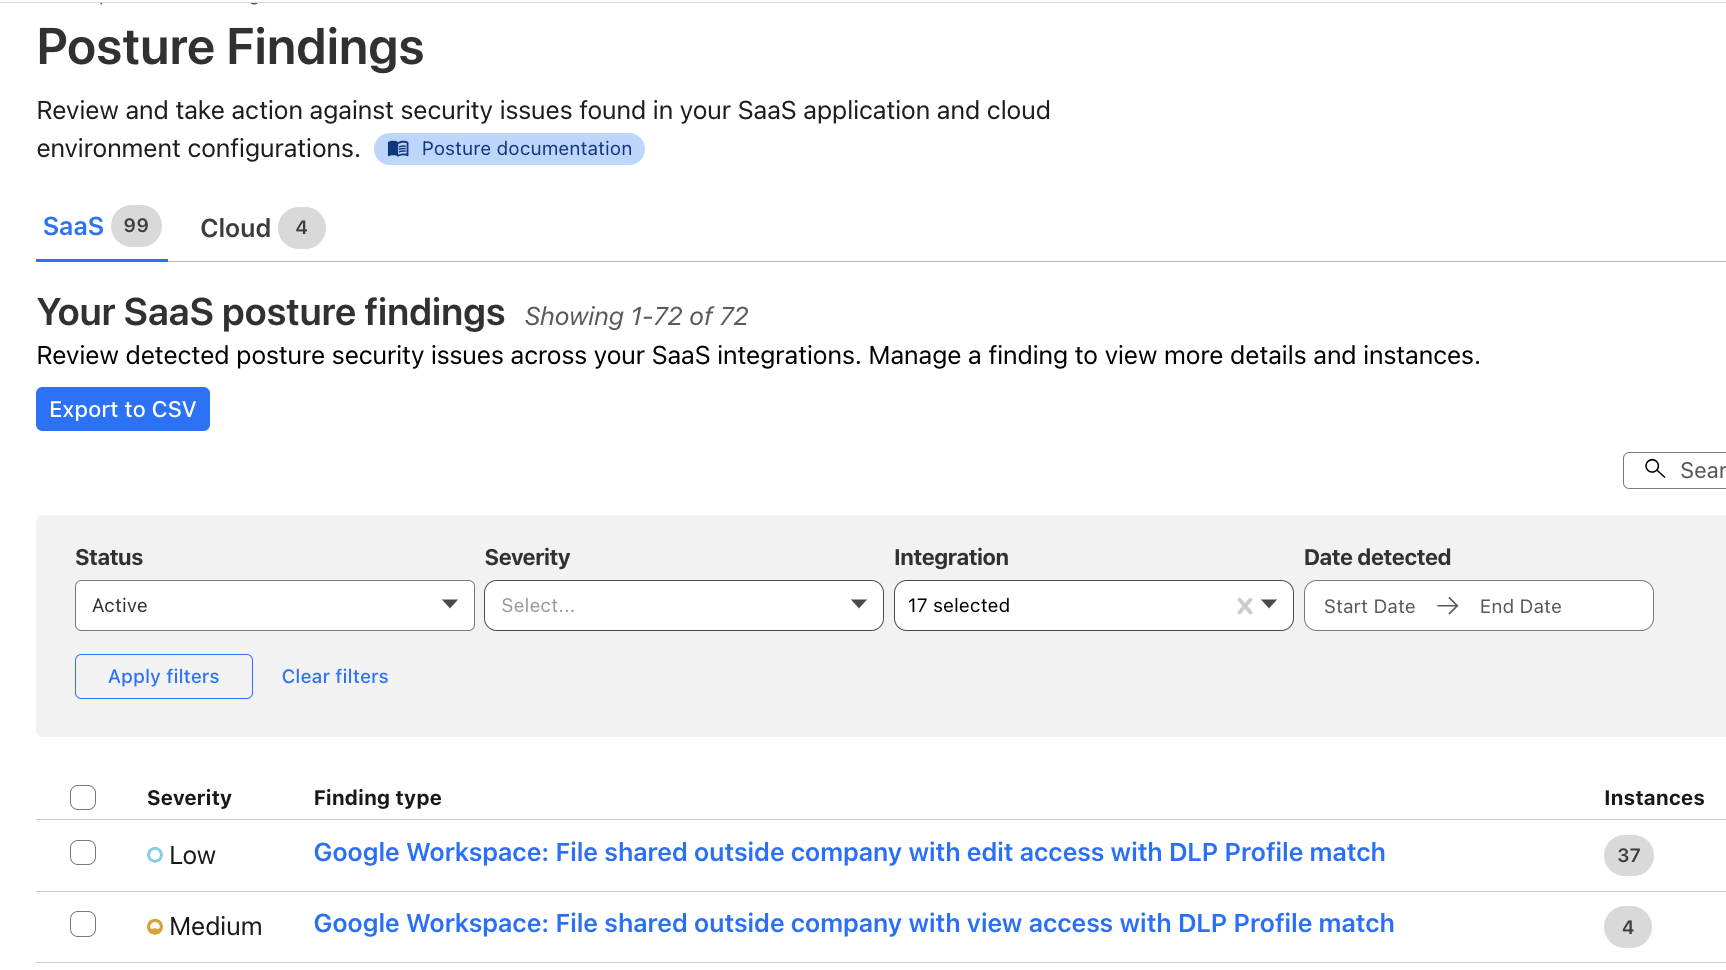
Posture findings across your SaaS fleet
From the account-wide Security Insights, you can review insights for potential SaaS security issues:
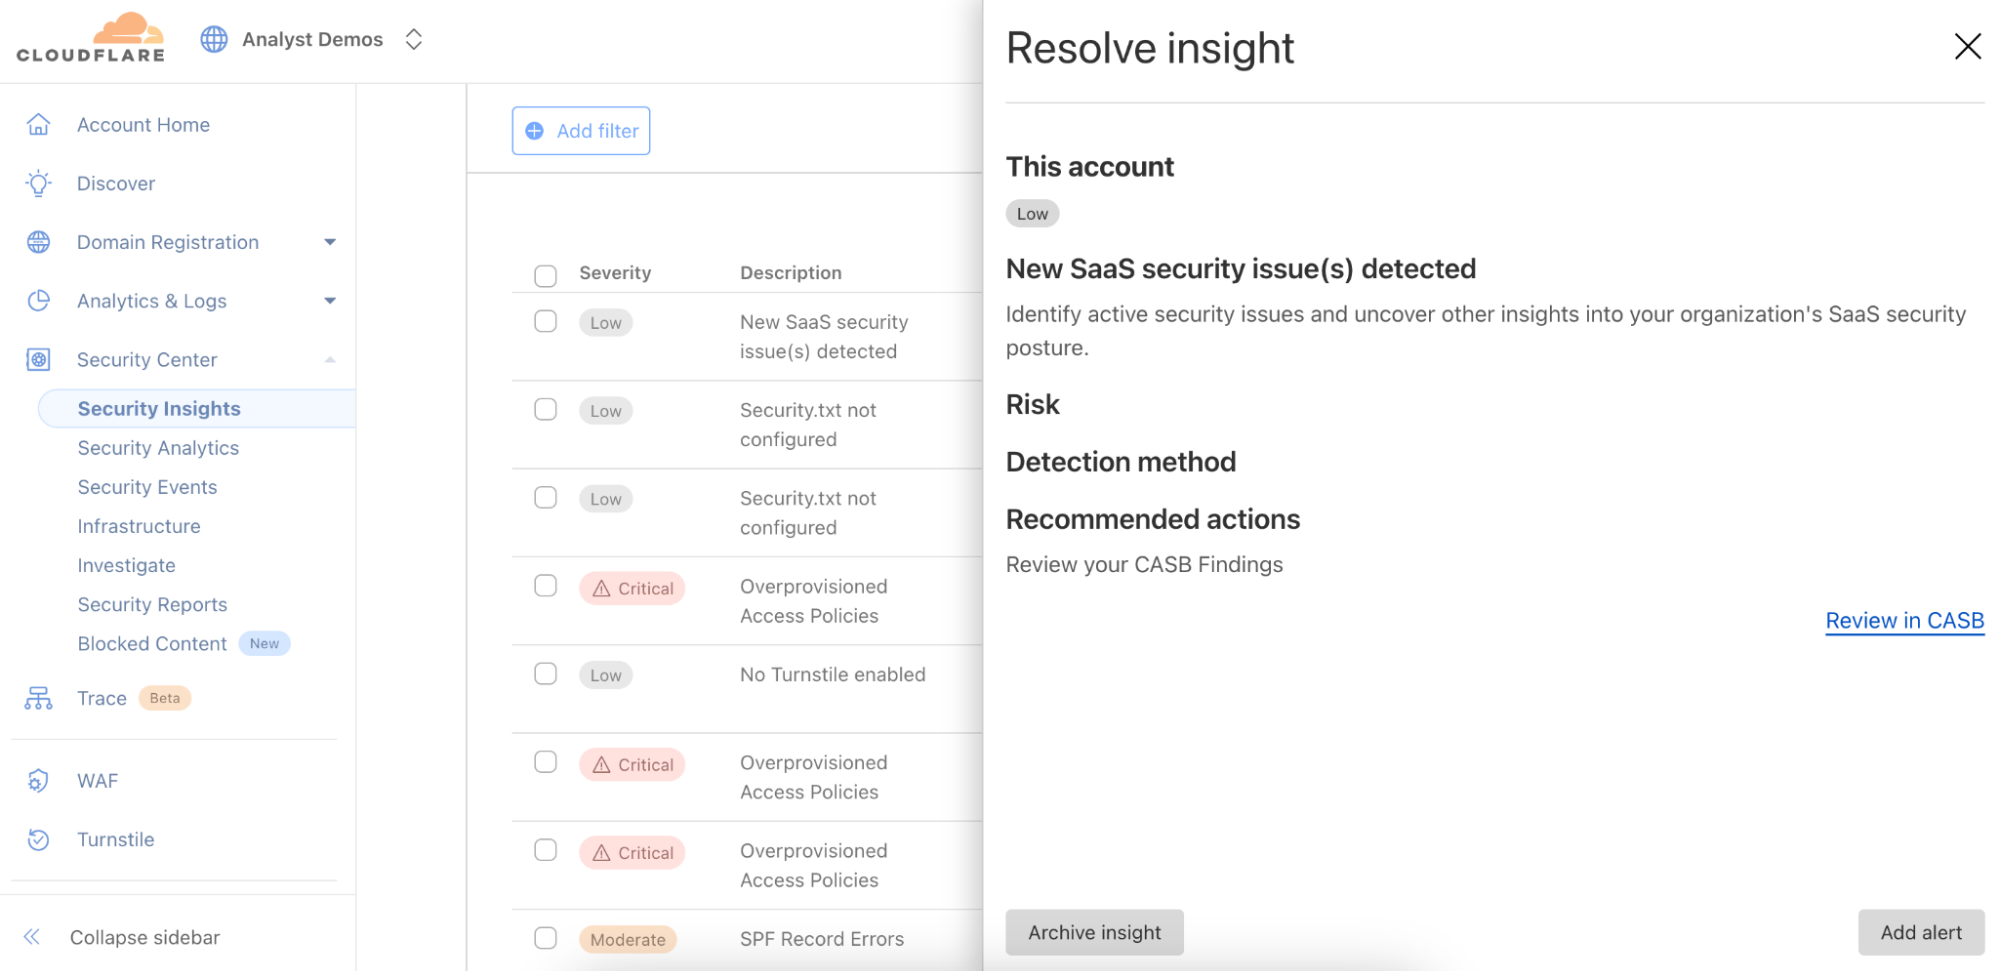
You can choose to dig further with Cloud Access Security Broker (CASB) for a thorough review of the misconfigurations, risks, and failures to meet best practices across your SaaS fleet. You can identify a wealth of security information including, but not limited to:
-
Publicly available or externally shared files
-
Third-party applications with read or edit access
-
Unknown or anonymous user access
-
Databases with exposed credentials
-
Users without two-factor authentication
-
Inactive user accounts
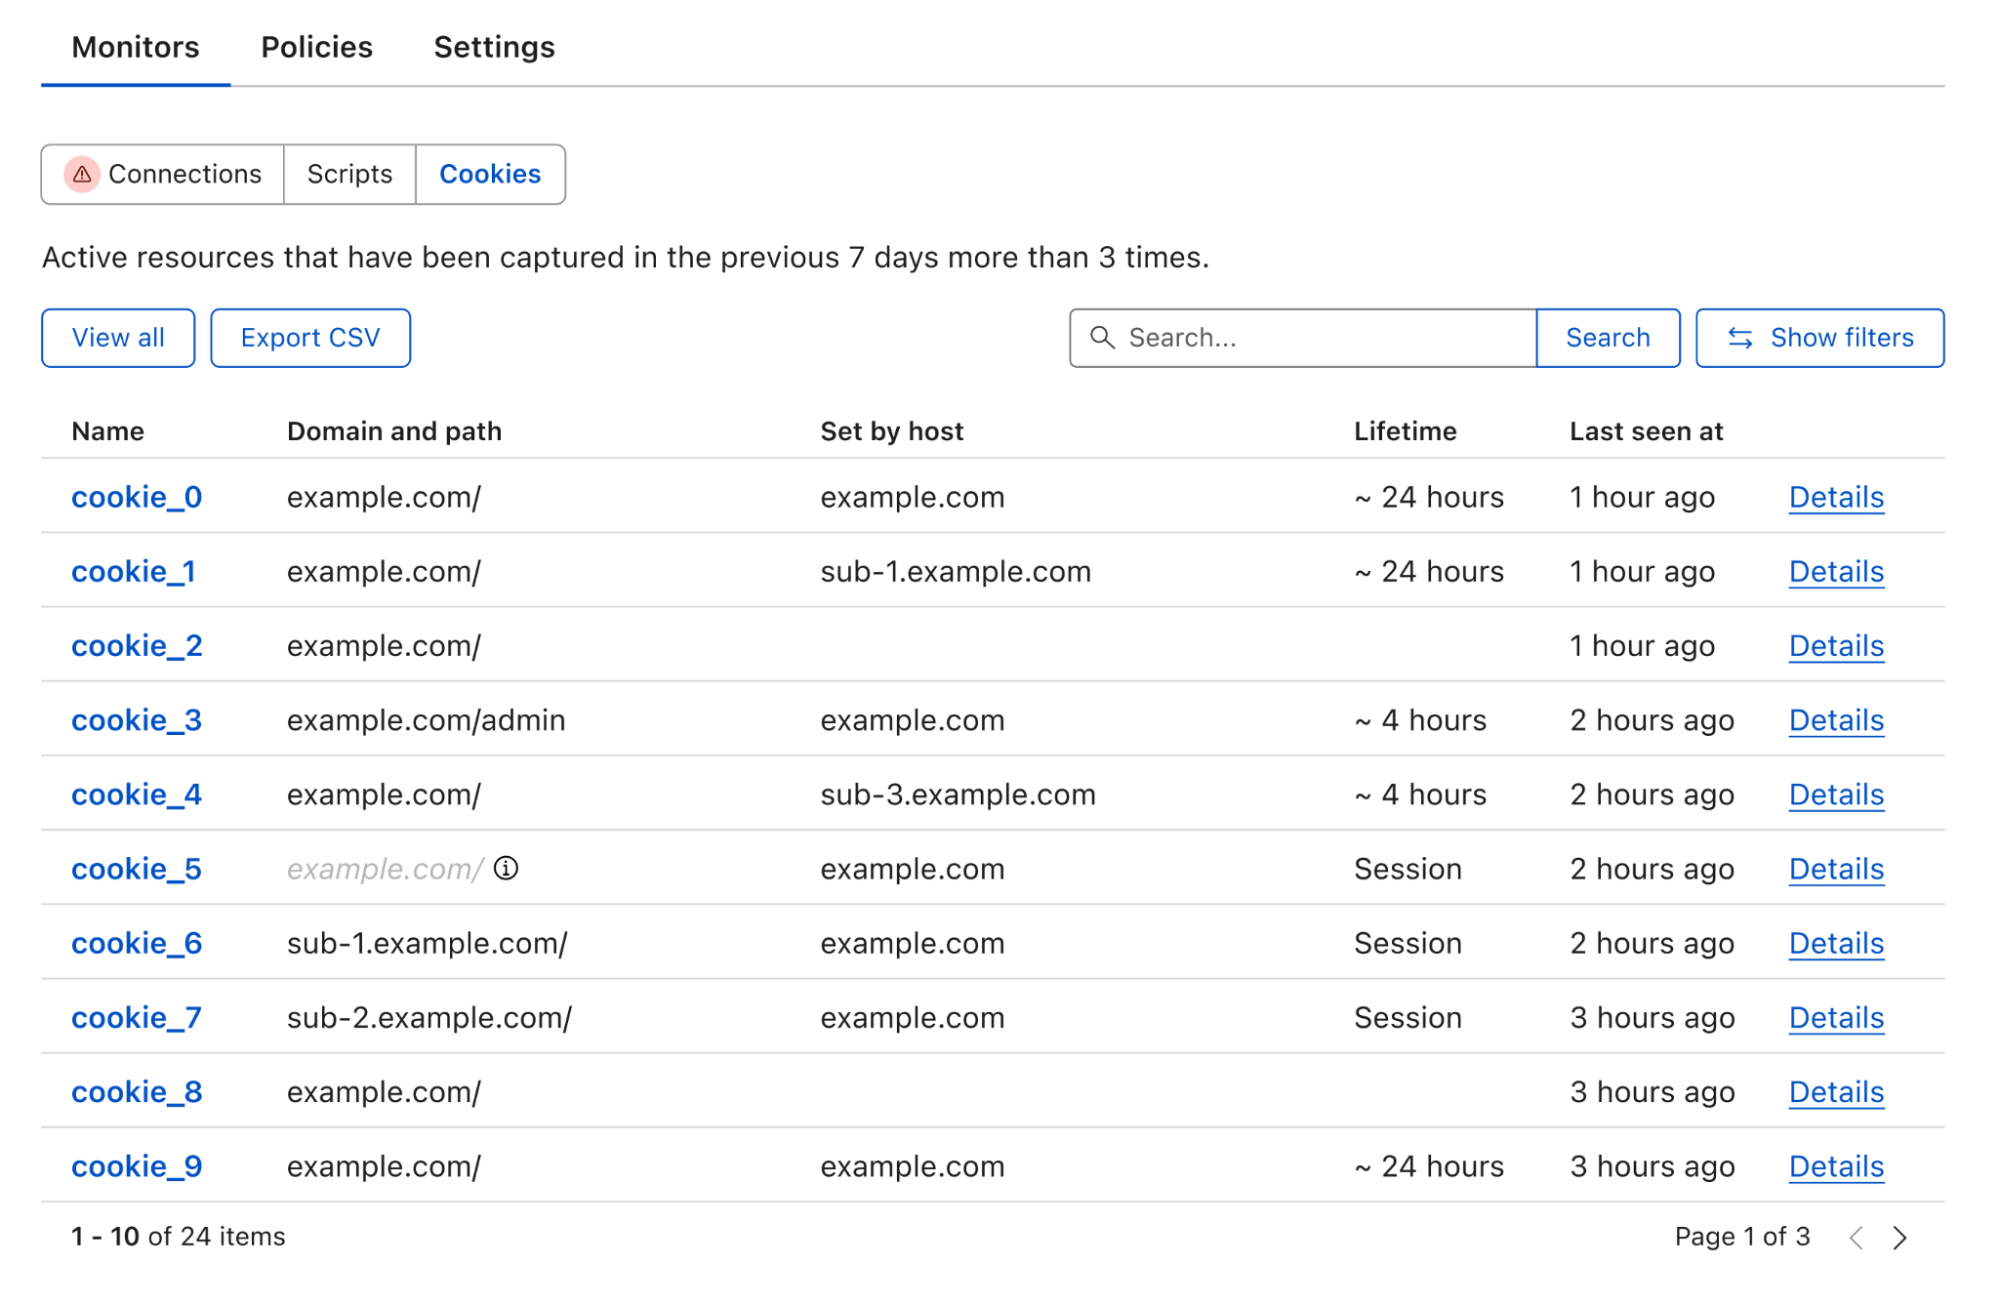
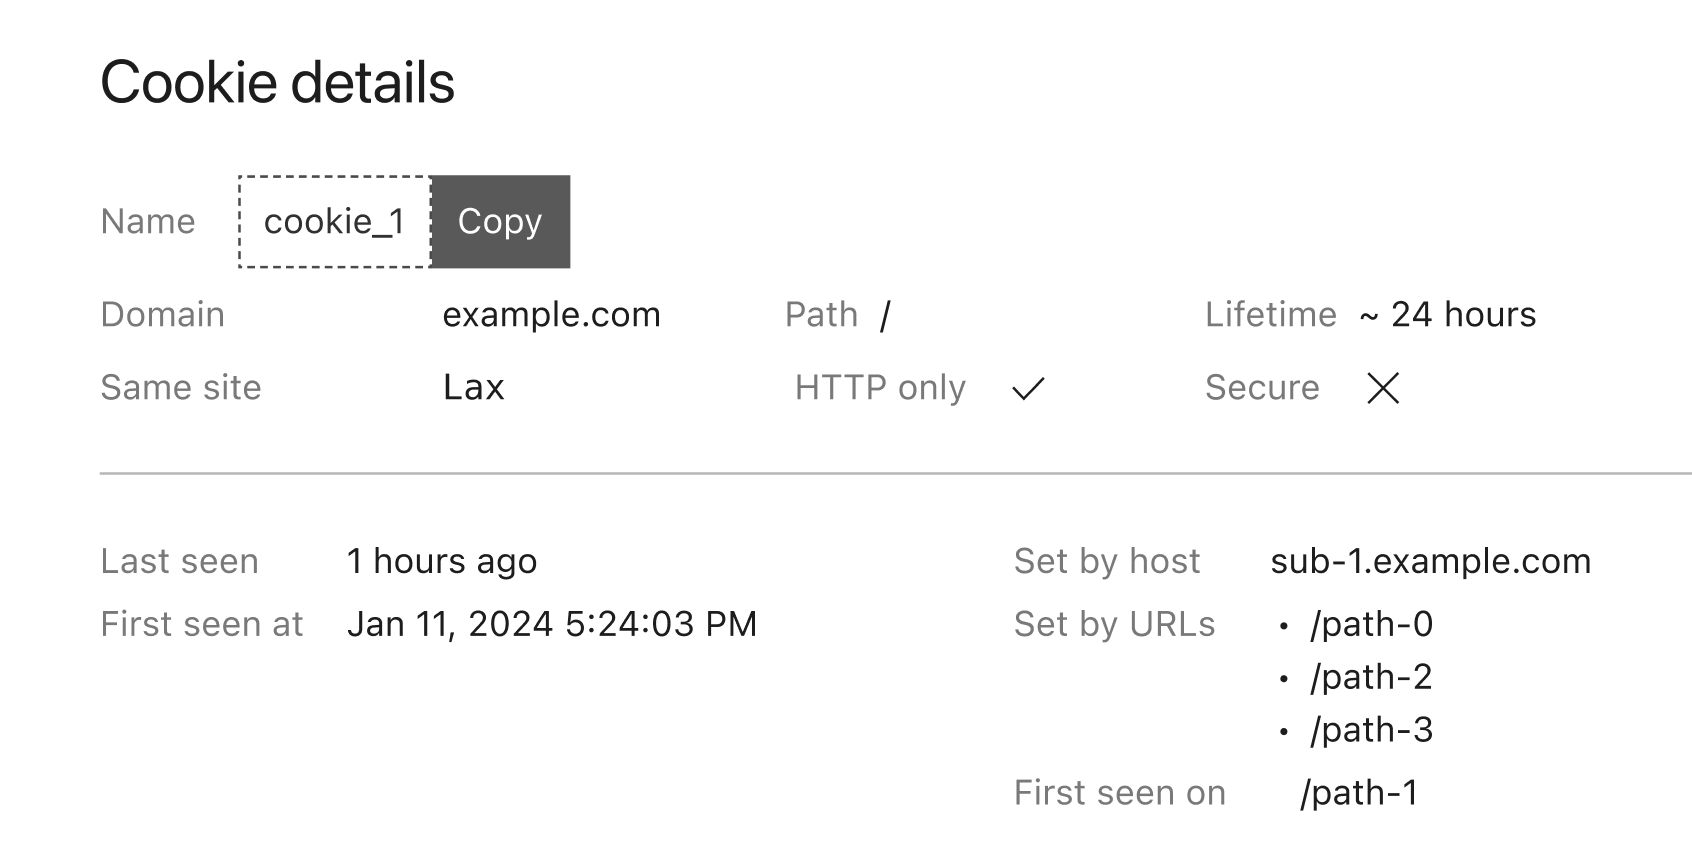
You can also explore the Posture Findings page, which provides easy searching and navigation across documents that are stored within the SaaS applications.
Additionally, you can create policies to prevent configuration drift in your environment. Prevention-based policies help maintain a secure configuration and compliance standards, while reducing alert fatigue for Security Operations teams, and these policies can prevent the inappropriate movement or exfiltration of sensitive data. Unifying controls and visibility across environments makes it easier to lock down regulated data classes, maintain detailed audit trails via logs, and improve your security posture to reduce the risk of breaches.
How it works: new, real-time SaaS documents discovery
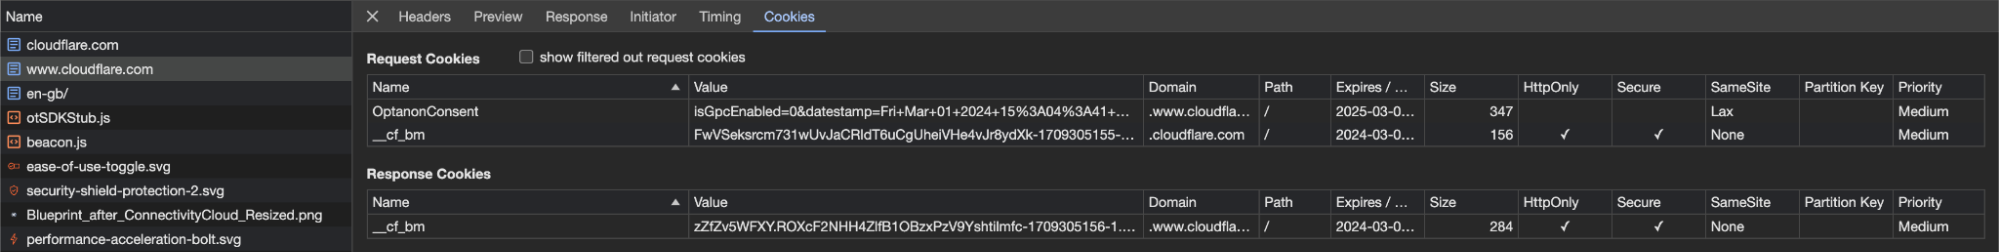
Delivering SaaS security posture information to our customers requires collecting vast amounts of data from a wide range of platforms. In order to ensure that all the documents living in your SaaS apps (files, designs, etc.) are secure, we need to collect information about their configuration — are they publicly shared, do third-party apps have access, is multi-factor authentication (MFA) enabled?
We previously did this with crawlers, which would pull data from the SaaS APIs. However, we were plagued with rate limits from the SaaS vendors when working with larger datasets. This forced us to work in batches and ramp scanning up and down as the vendors permitted. This led to stale findings and would make remediation cumbersome and unclear – for example, Cloudflare would be reporting that a file is still shared publicly for a short period after the permissions were removed, leading to customer confusion.
To fix this, we upgraded our data collection pipeline to be dynamic and real-time, reacting to changes in your environment as they occur, whether it’s a new security finding, an updated asset, or a critical alert from a vendor. We started with our Microsoft asset discovery and posture findings, providing you real-time insight into your Microsoft Admin Center, OneDrive, Outlook, and SharePoint configurations. We will be rapidly expanding support to additional SaaS vendors going forward.
Listening for update events from Cloudflare Workers
Cloudflare Workers serve as the entry point for vendor webhooks, handling asset change notifications from external services. The workflow unfolds as follows:
-
Webhook listener: An initial Worker acts as the webhook listener, receiving asset change messages from vendors.
-
Data storage & queuing: Upon receiving a message, the Worker uploads the raw payload of the change notification to Cloudflare R2 for persistence, and publishes it to a Cloudflare Queue dedicated to raw asset changes.
-
Transformation Worker: A second Worker, bound as a consumer to the raw asset change queue, processes the incoming messages. This Worker transforms the raw vendor-specific data into a generic format suitable for CASB. The transformed data is then:
-
Stored in Cloudflare R2 for future reference.
-
Published on another Cloudflare Queue, designated for transformed messages.
-
CASB Processing: Consumers & Crawlers
Once the transformed messages reach the CASB layer, they undergo further processing:
-
Polling consumer: CASB has a consumer that polls the transformed message queue. Upon receiving a message, it determines the relevant handler required for processing.
-
Crawler execution: The handler then maps the message to an appropriate crawler, which interacts with the vendor API to fetch the most up-to-date asset details.
-
Data storage: The retrieved asset data is stored in the CASB database, ensuring it is accessible for security and compliance checks.
With this improvement, we are now processing 10 to 20 Microsoft updates per second, or 864,000 to 1.72 million updates daily, giving customers incredibly fast visibility into their environment. Look out for expansion to other SaaS vendors in the coming months.
A unique challenge of securing web applications is that no one size fits all. An asset-aware posture management bridges the gap between a universal security solution and unique business needs, offering tailored recommendations for security teams to protect what matters.
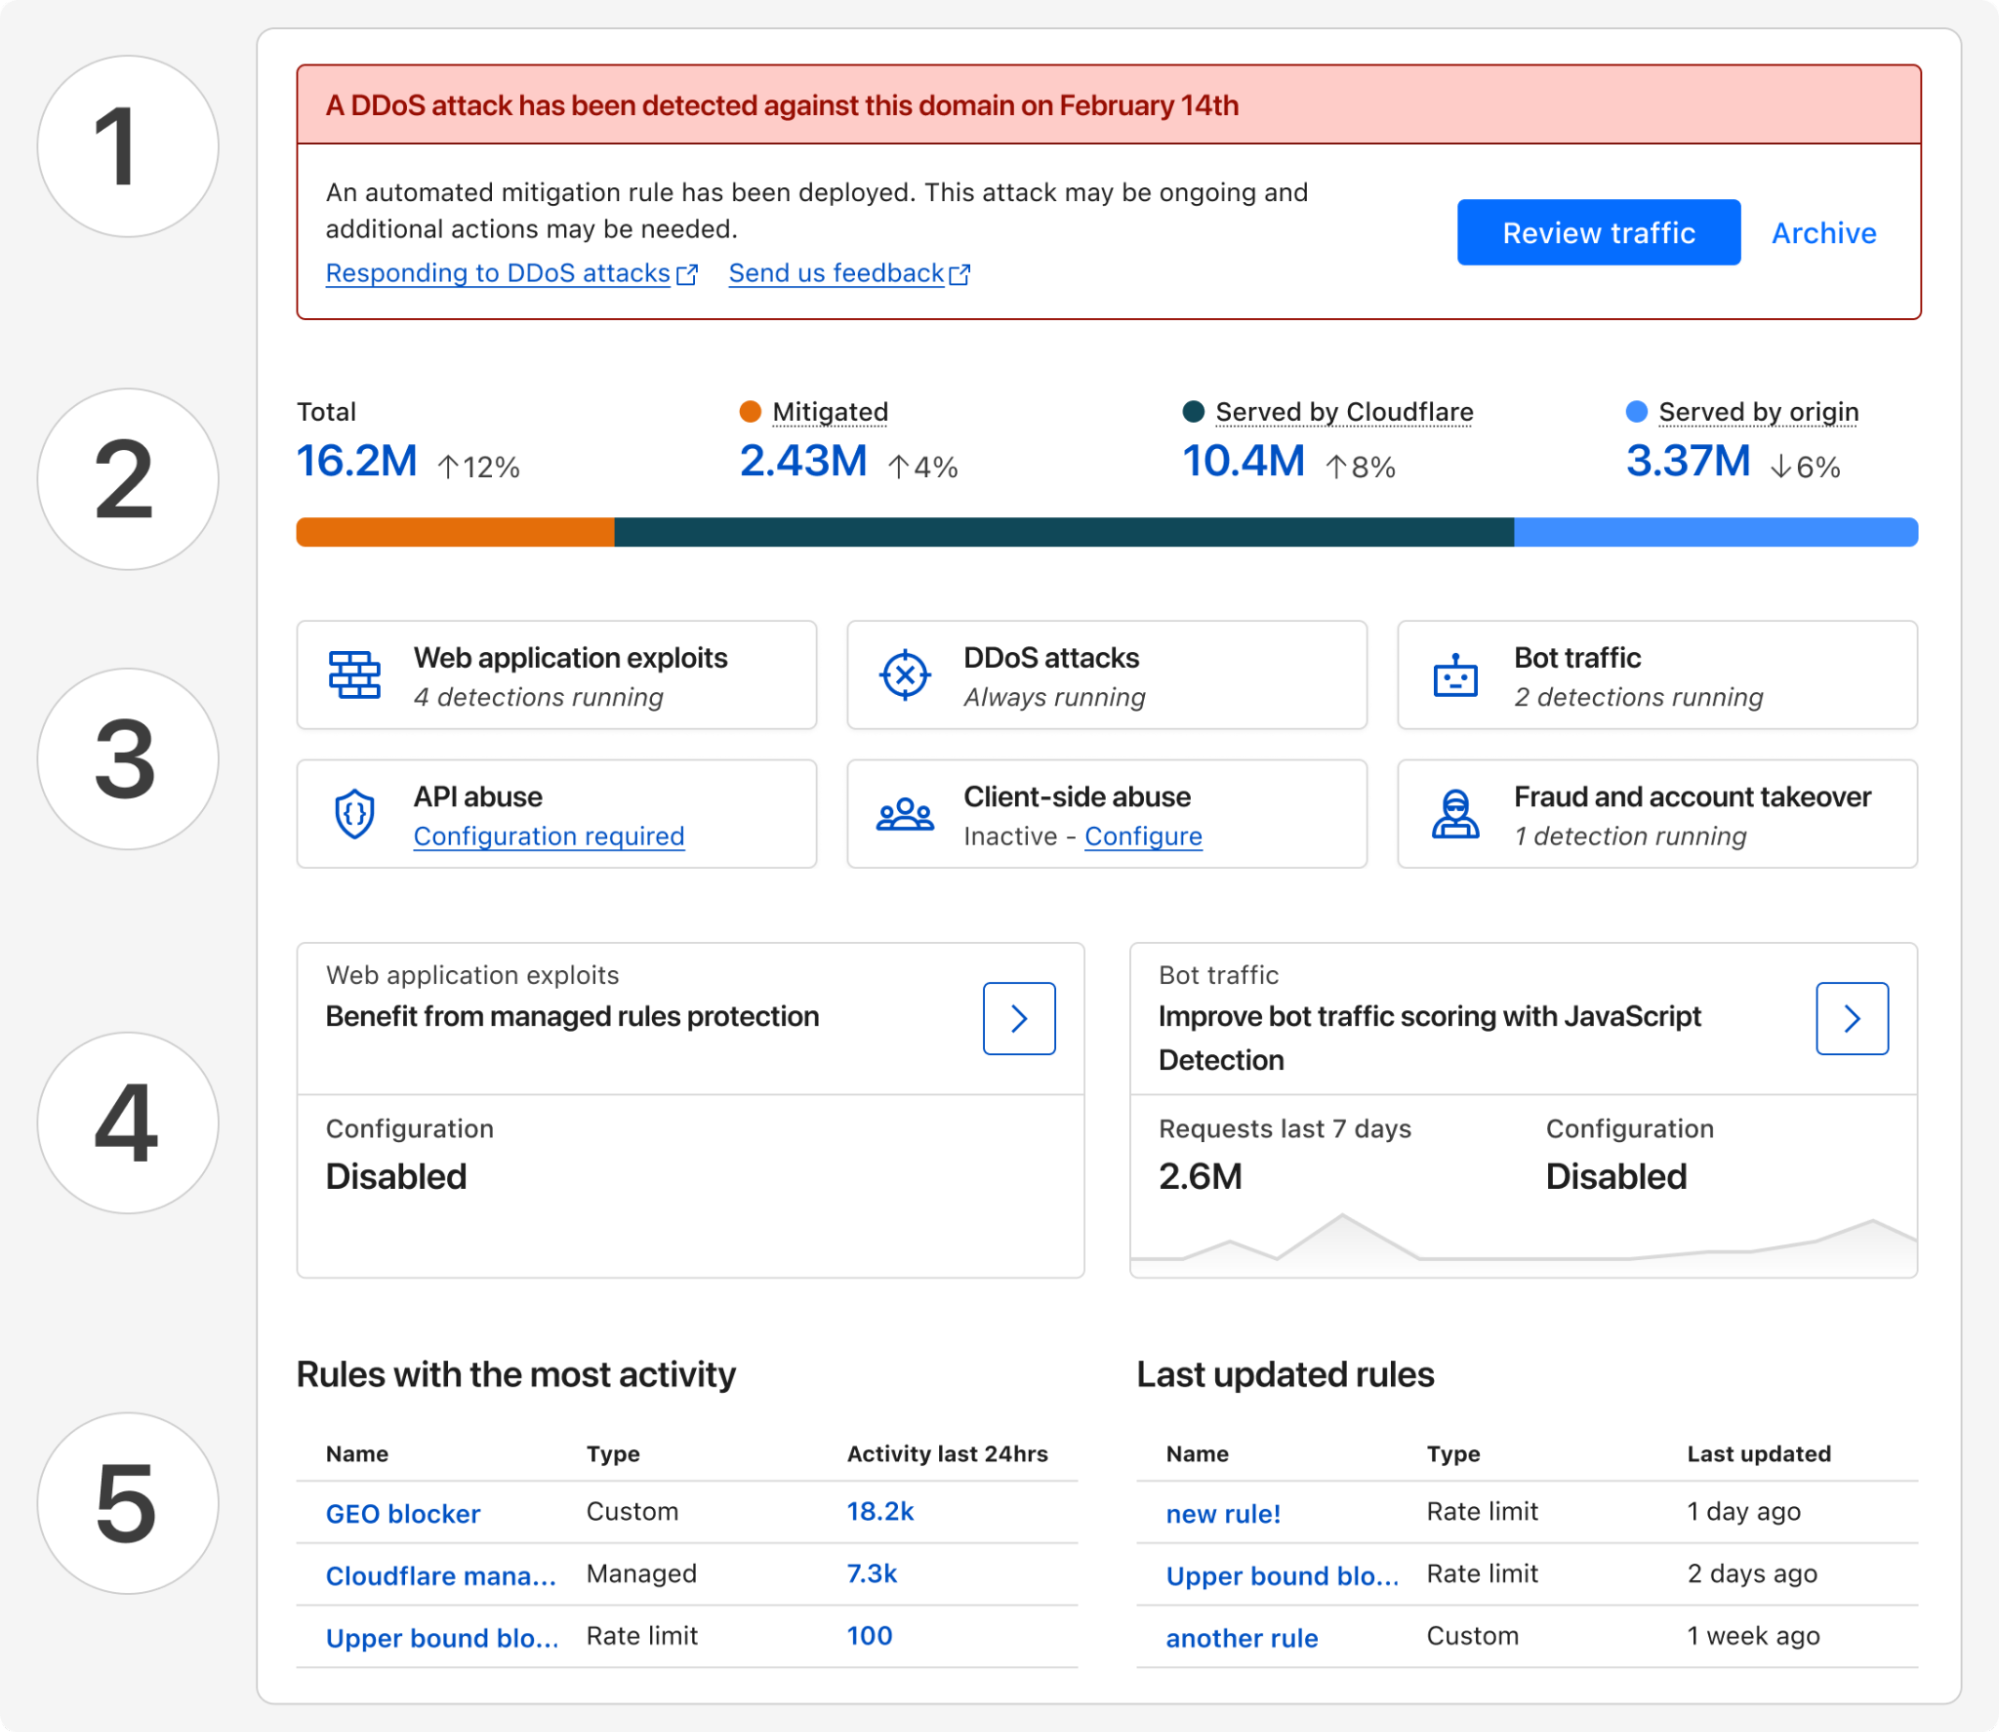
Posture overview from attacks to threats and risks
Starting today, all Cloudflare customers have access to Security Overview, a new landing page customized for each of your onboarded domains. This page aggregates and prioritizes security suggestions across all your web applications:
-
Any (ongoing) attacks detected that require immediate attention
-
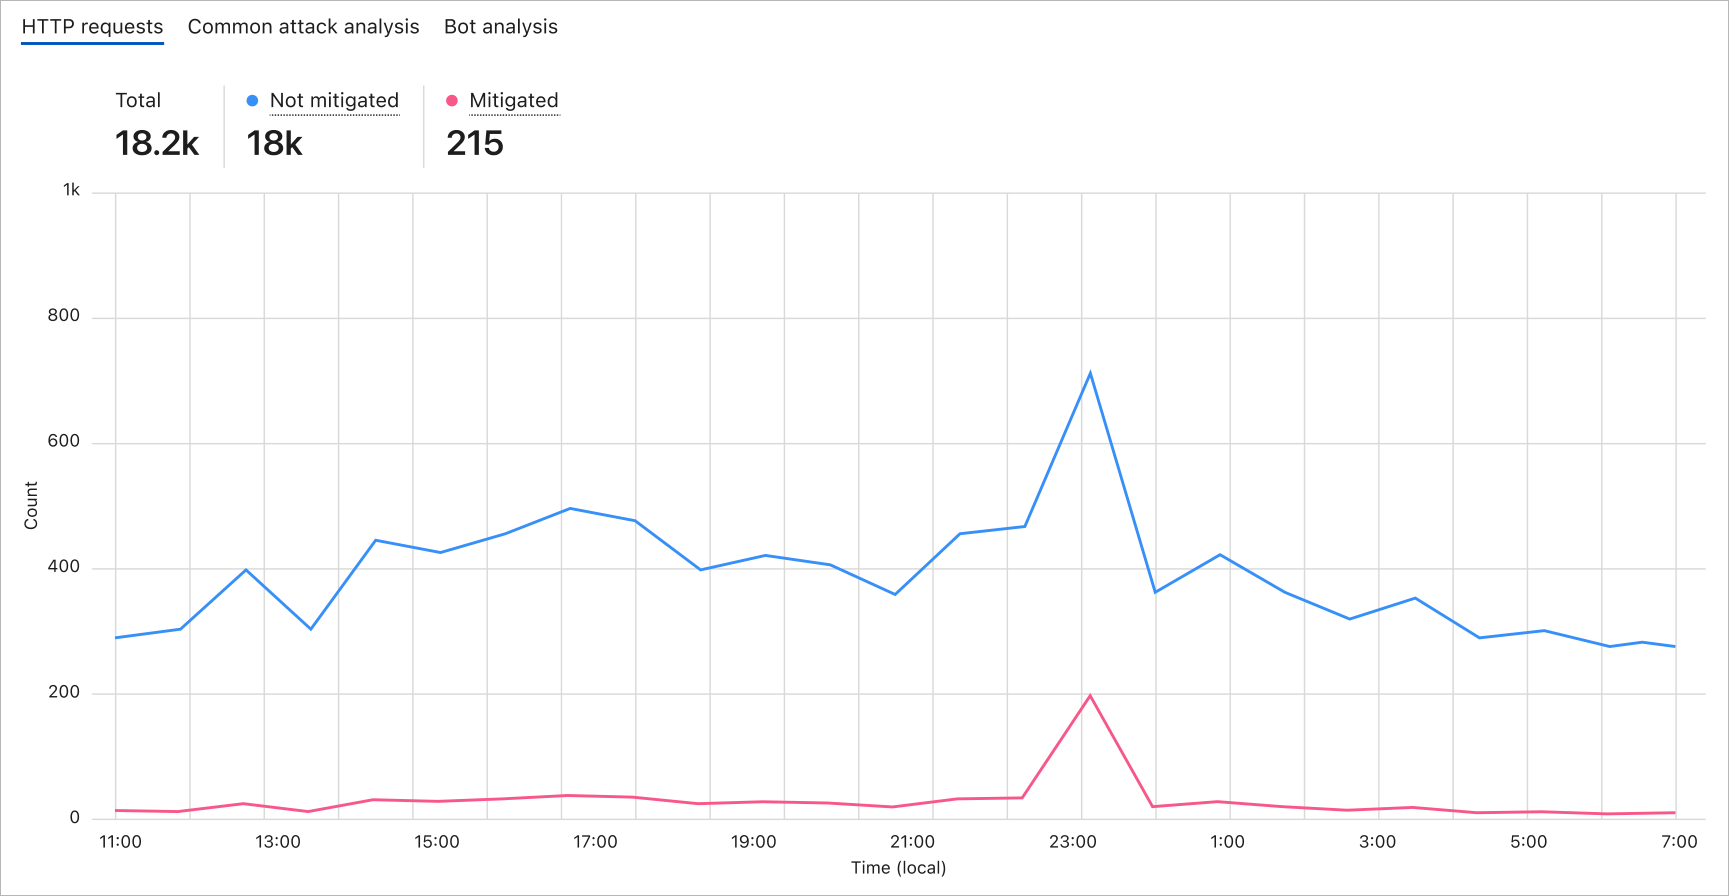
Disposition (mitigated, served by Cloudflare, served by origin) of all proxied traffic over the last 7 days
-
Summary of currently active security modules that are detecting threats
-
Suggestions of how to improve your security posture with a step-by-step guide
-
And a glimpse of your most active and lately updated security rules
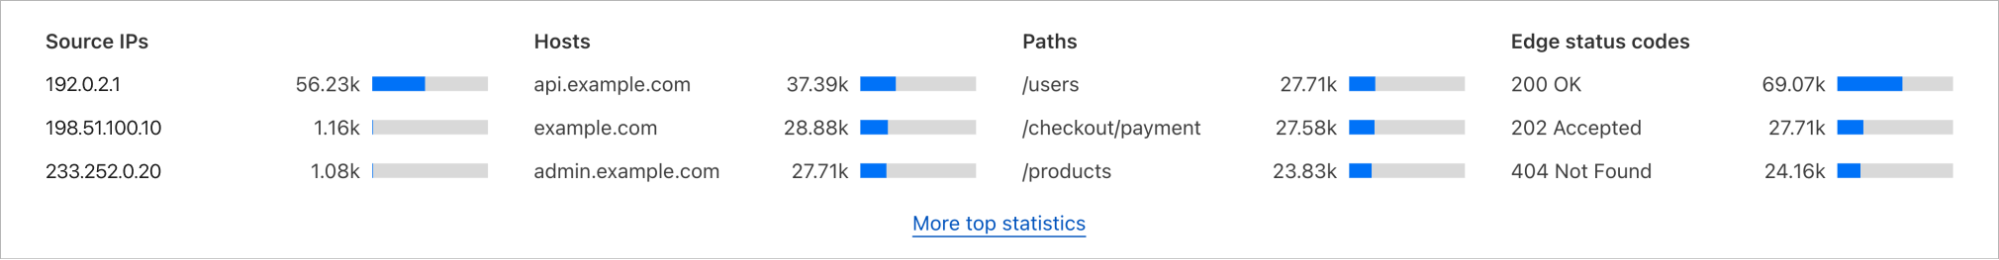
These tailored security suggestions are surfaced based on your traffic profile and business needs, which is made possible by discovering your proxied web assets.
Discovery of web assets
Many web applications, regardless of their industry or use case, require similar functionality: user identification, accepting payment information, etc. By discovering the assets serving this functionality, we can build and run targeted threat detection to protect them in depth.
As an example, bot traffic towards marketing pages versus login pages have different business impacts. Content scraping may be happening targeting your marketing materials, which you may or may not want to allow, while credential stuffing on your login page deserves immediate attention.
Web assets are described by a list of endpoints; and labelling each of them defines their business goals. A simple example can be POST requests to path /portal/login, which likely describes an API for user authentication. While the GET requests to path /portal/login denote the actual login webpage.
To describe business goals of endpoints, labels come into play. POST requests to the /portal/login endpoint serving end users and to the /api/admin/login endpoint used by employees can both can be labelled using the same cf-log-in managed label, letting Cloudflare know that usernames and passwords would be expected to be sent to these endpoints.
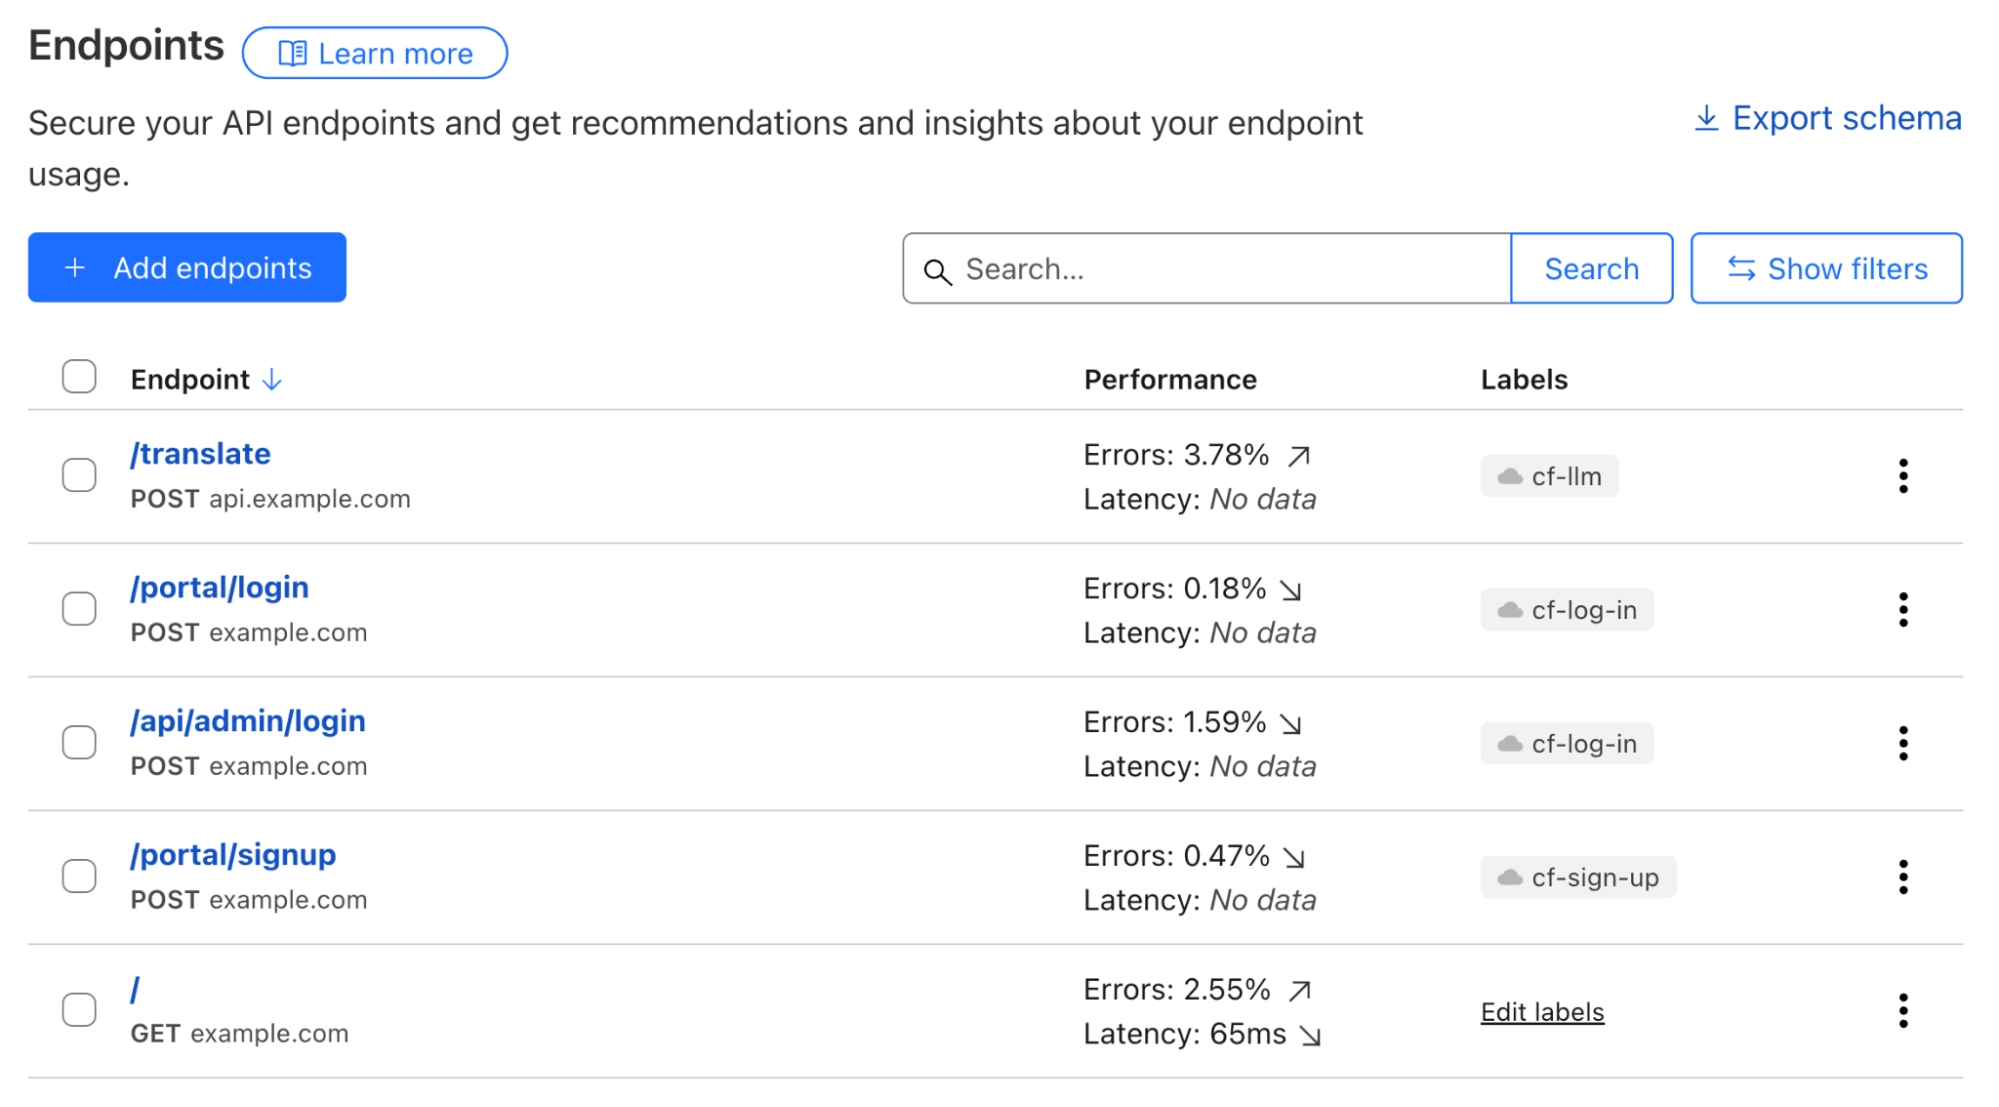
API Shield customers can already make use of endpoint labelling. In early Q2 2025, we are adding label discovery and suggestion capabilities, starting with three labels, cf-log-in, cf-sign-up, and cf-rss-feed. All other customers can manually add these labels to the saved endpoints. One example, explained below, is preventing disposable emails from being used during sign-ups.
Always-on threat detection and risk assessment
Use-case driven threat detection
Customers told us that, with the growing excitement around generative AI, they need support to secure this new technology while not hindering innovation. Being able to discover LLM-powered services allows fine-tuning security controls that are relevant for this particular technology, such as inspecting prompts, limit prompting rates based on token usage, etc. In a separate Security Week blog post, we will share how we build Cloudflare Firewall for AI, and how you can easily protect your generative AI workloads.
Account fraud detection, which encompasses multiple attack vectors, is another key area that we are focusing on in 2025.
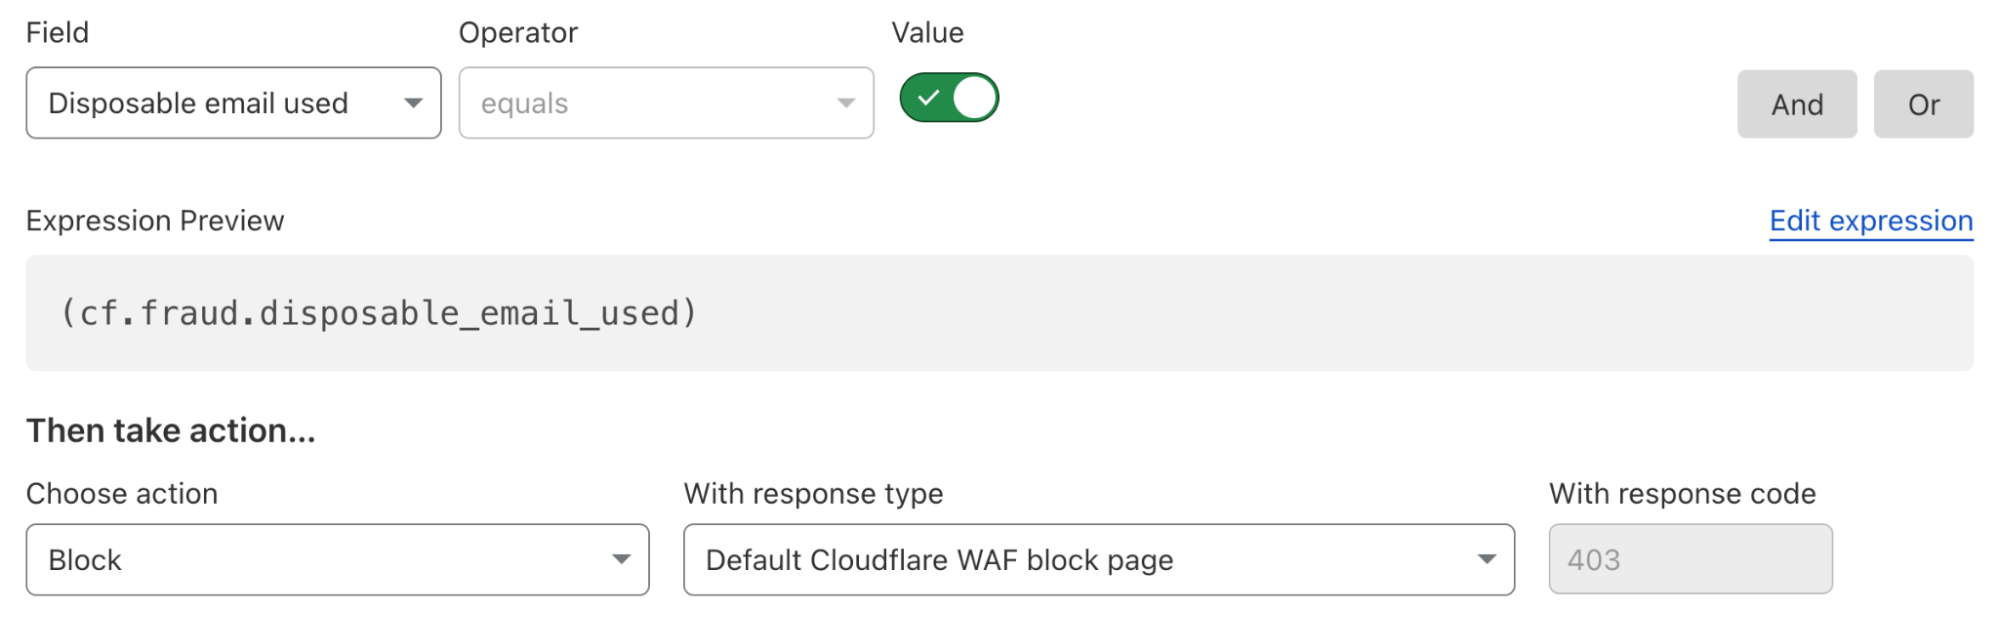
On many login and signup pages, a CAPTCHA solution is commonly used to only allow human beings through, assuming only bots perform undesirable actions. Put aside that most visual CAPTCHA puzzles can be easily solved by AI nowadays, such an approach cannot effectively solve the root cause of most account fraud vectors. For example, human beings using disposable emails to sign up single-use accounts to take advantage of signup promotions.
To solve this fraudulent sign up issue, a security rule currently under development could be deployed as below to block all attempts that use disposable emails as a user identifier, regardless of whether the requester was automated or not. All existing or future cf-log-in and cf-sign-up labelled endpoints are protected by this single rule, as they both require user identification.
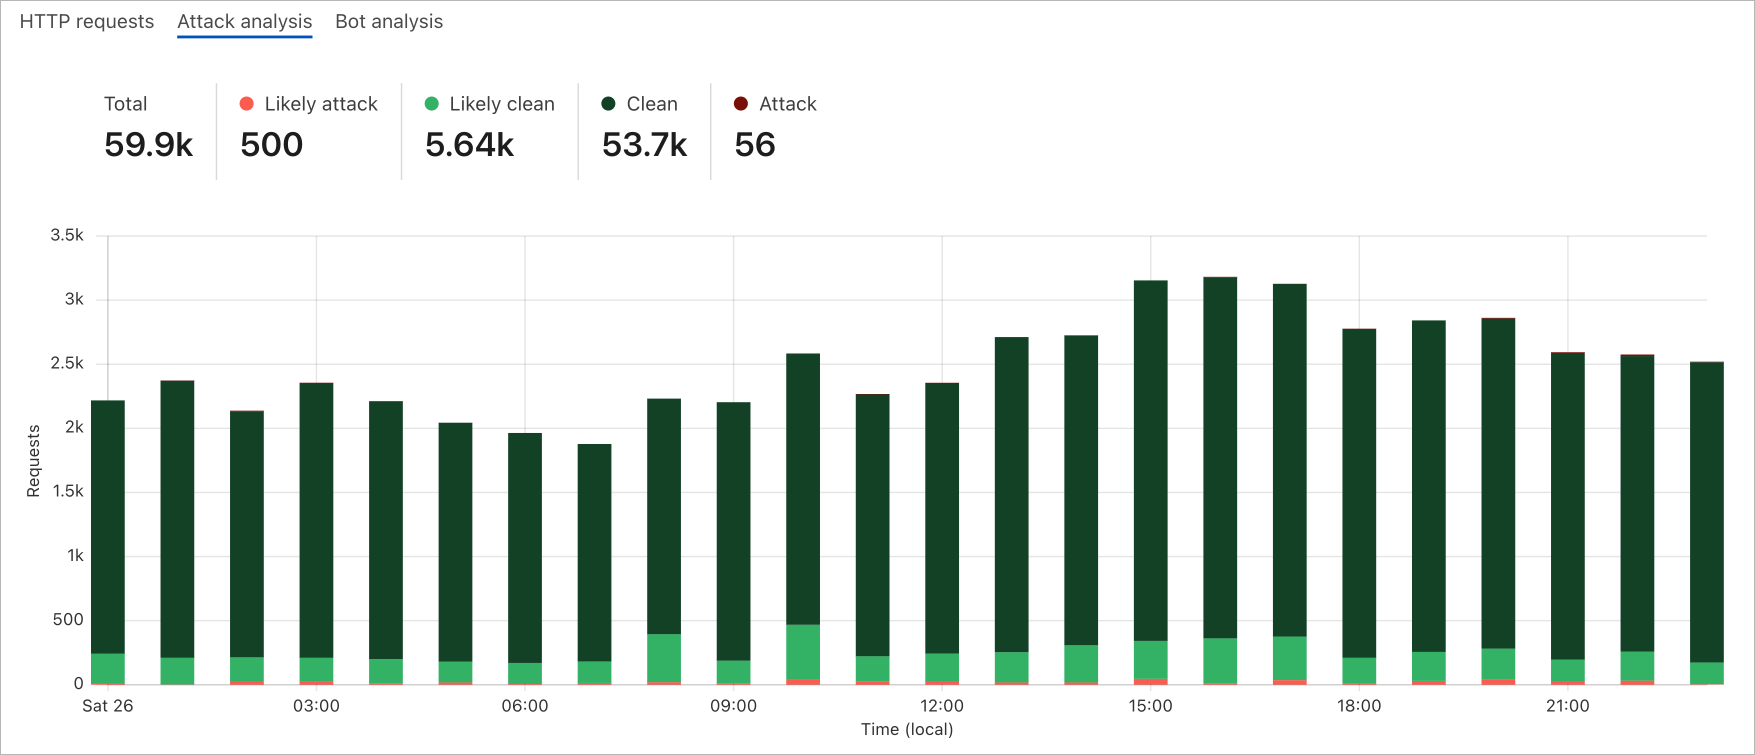
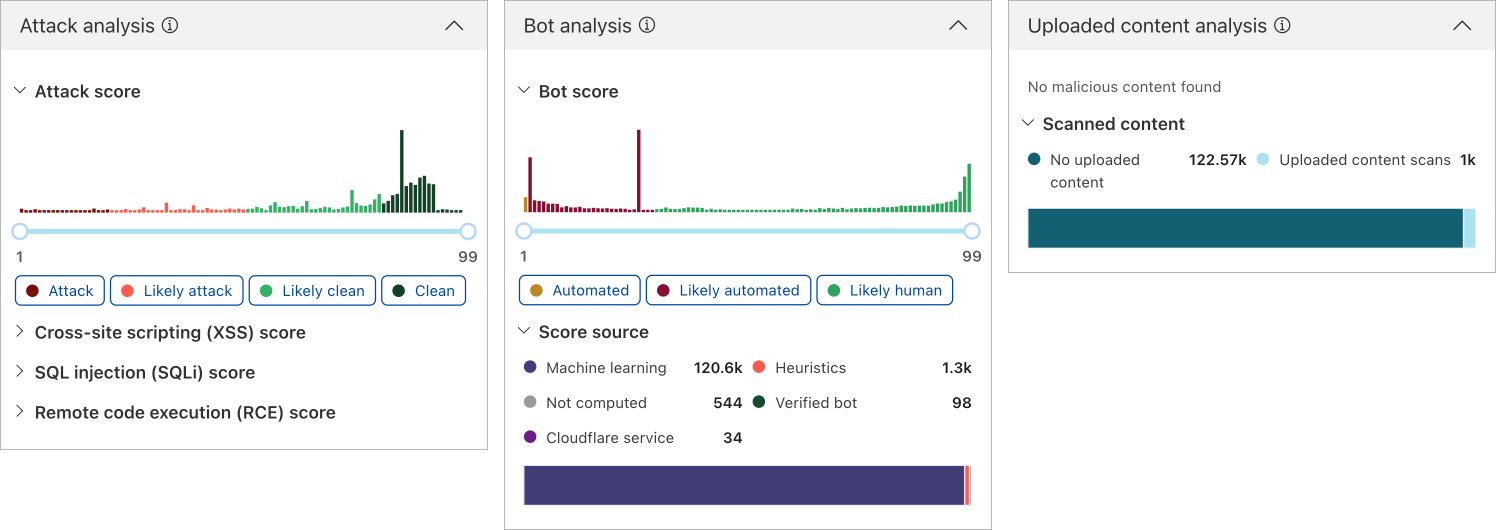
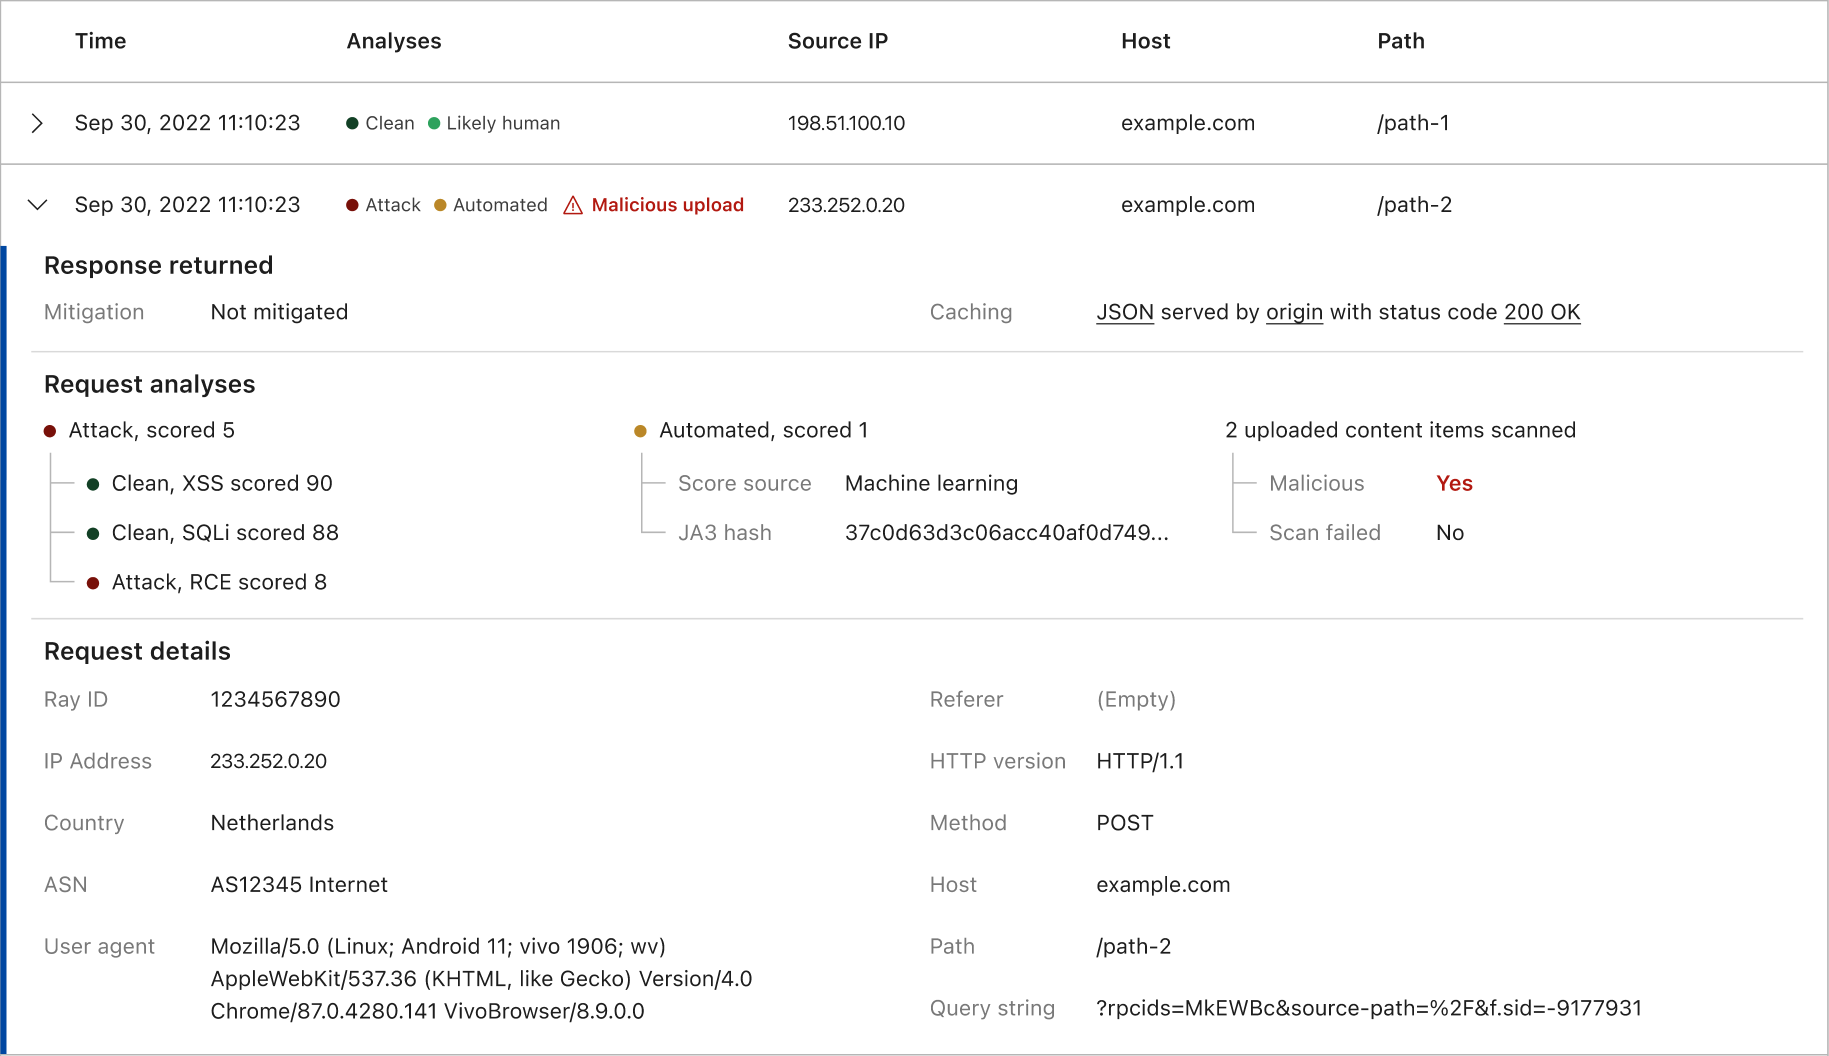
Our fast expanding use-case driven threat detections are all running by default, from the first moment you onboarded your traffic to Cloudflare. The instant available detection results can be reviewed through security analytics, helping you make swift informed decisions.
API endpoint risk assessment
APIs have their own set of risks and vulnerabilities, and today Cloudflare is delivering seven new risk scans through API Posture Management. This new capability of API Shield helps reduce risk by identifying security issues and fixing them early, before APIs are attacked. Because APIs are typically made up of many different backend services, security teams need to pinpoint which backend service is vulnerable so that development teams may remediate the identified issues.
Our new API posture management risk scans do exactly that: users can quickly identify which API endpoints are at risk to a number of vulnerabilities, including sensitive data exposure, authentication status, Broken Object Level Authorization (BOLA) attacks, and more.
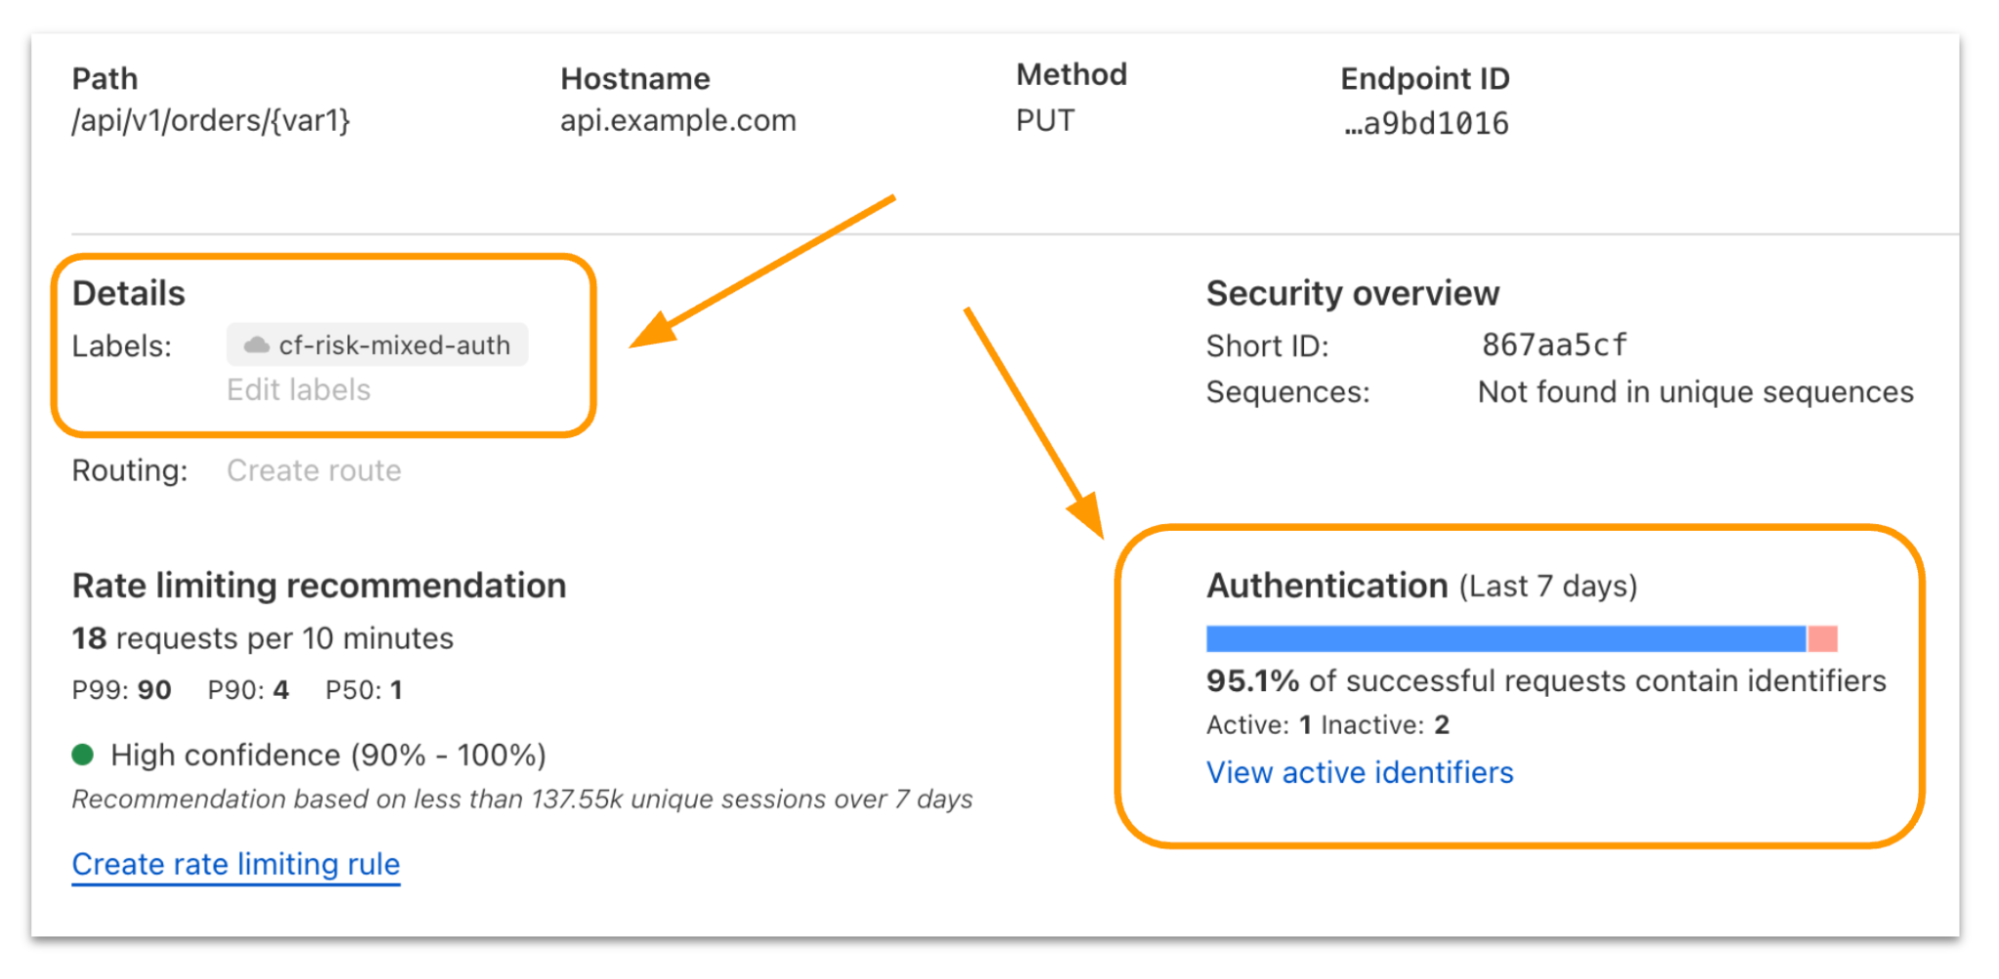
Authentication Posture is one risk scan you’ll see in the new system. We focused on it to start with because sensitive data is at risk when API authentication is assumed to be enforced but is actually broken. Authentication Posture helps customers identify authentication misconfigurations for APIs and alerts of their presence. This is achieved by scanning for successful requests against the API and noting their authentication status. API Shield scans traffic daily and labels API endpoints that have missing and mixed authentication for further review.
For customers that have configured session IDs in API Shield, you can find the new risk scan labels and authentication details per endpoint in API Shield. Security teams can take this detail to their development teams to fix the broken authentication.
We’re launching today with scans for authentication posture, sensitive data, underprotected APIs, BOLA attacks, and anomaly scanning for API performance across errors, latency, and response size.
Achieving a good security posture in a fast-moving environment requires innovative solutions that can transform complexity into simplicity. Bringing together the ability to continuously assess threats and risks across both public and private IT environments through a single platform is our first step in supporting our customers’ efforts to maintain a healthy security posture.
To further enhance the relevance of security insights and suggestions provided and help you better prioritize your actions, we are looking into integrating Cloudflare’s global view of threat landscapes. With this, you gain additional perspectives, such as what the biggest threats to your industry are, and what attackers are targeting at the current moment. Stay tuned for more updates later this year.
If you haven’t done so yet, onboard your SaaS and web applications to Cloudflare today to gain instant insights into how to improve your business’s security posture.