Cloudflare has deployed a new protection to address a vulnerability in React Server Components (RSC). All Cloudflare customers are automatically protected, including those on free and paid plans, as long as their React application traffic is proxied through the Cloudflare Web Application Firewall (WAF).
Cloudflare Workers are inherently immune to this exploit. React-based applications and frameworks deployed on Workers are not affected by this vulnerability.
We strongly recommend that customers immediately update their systems to the most recent version of React, despite our WAF being designed to detect and prevent this exploit.
What you need to know
Cloudflare has been alerted by its security partners to a Remote Code Execution (RCE) vulnerability impacting Next.js, React Router, and other React frameworks (security advisory CVE-2025-55182, rated CVSS 10.0). Specifically, React version 19.0, 19.1, and 19.2, and Next.js from version 15 through 16 were found to insecurely deserialize malicious requests, leading to RCE.
In response, Cloudflare has deployed new rules across its network, with the default action set to Block. These new protections are included in both the Cloudflare Free Managed Ruleset (available to all Free customers) and the standard Cloudflare Managed Ruleset (available to all paying customers). More information about the different rulesets can be found in our documentation.
The rule ID is as follows:
Ruleset
Rule ID
Default action
Managed Ruleset
33aa8a8a948b48b28d40450c5fb92fba
Block
Free Ruleset
2b5d06e34a814a889bee9a0699702280
Block
Customers on Professional, Business, or Enterprise plans should ensure that Managed Rules are enabled — follow these steps to turn it on. Customers on a Free plan have these rules enabled by default.
We recommend that customers update to the latest version of React 19.2.1 and the latest versions of Next.js (16.0.7, 15.5.7, 15.4.8).
The rules were deployed at 5:00 PM GMT on Tuesday, December 2, 2025. Since their release until the publication of this blog and the official CVE announcement, we have not observed any attempted exploit.
Looking forward
The Cloudflare security team has collaborated with partners to identify various attack patterns and ensure the new rules effectively prevent any bypasses. Over the coming hours and days, the team will maintain continuous monitoring for potential attack variations, updating our protections as necessary to secure all traffic proxied via Cloudflare.
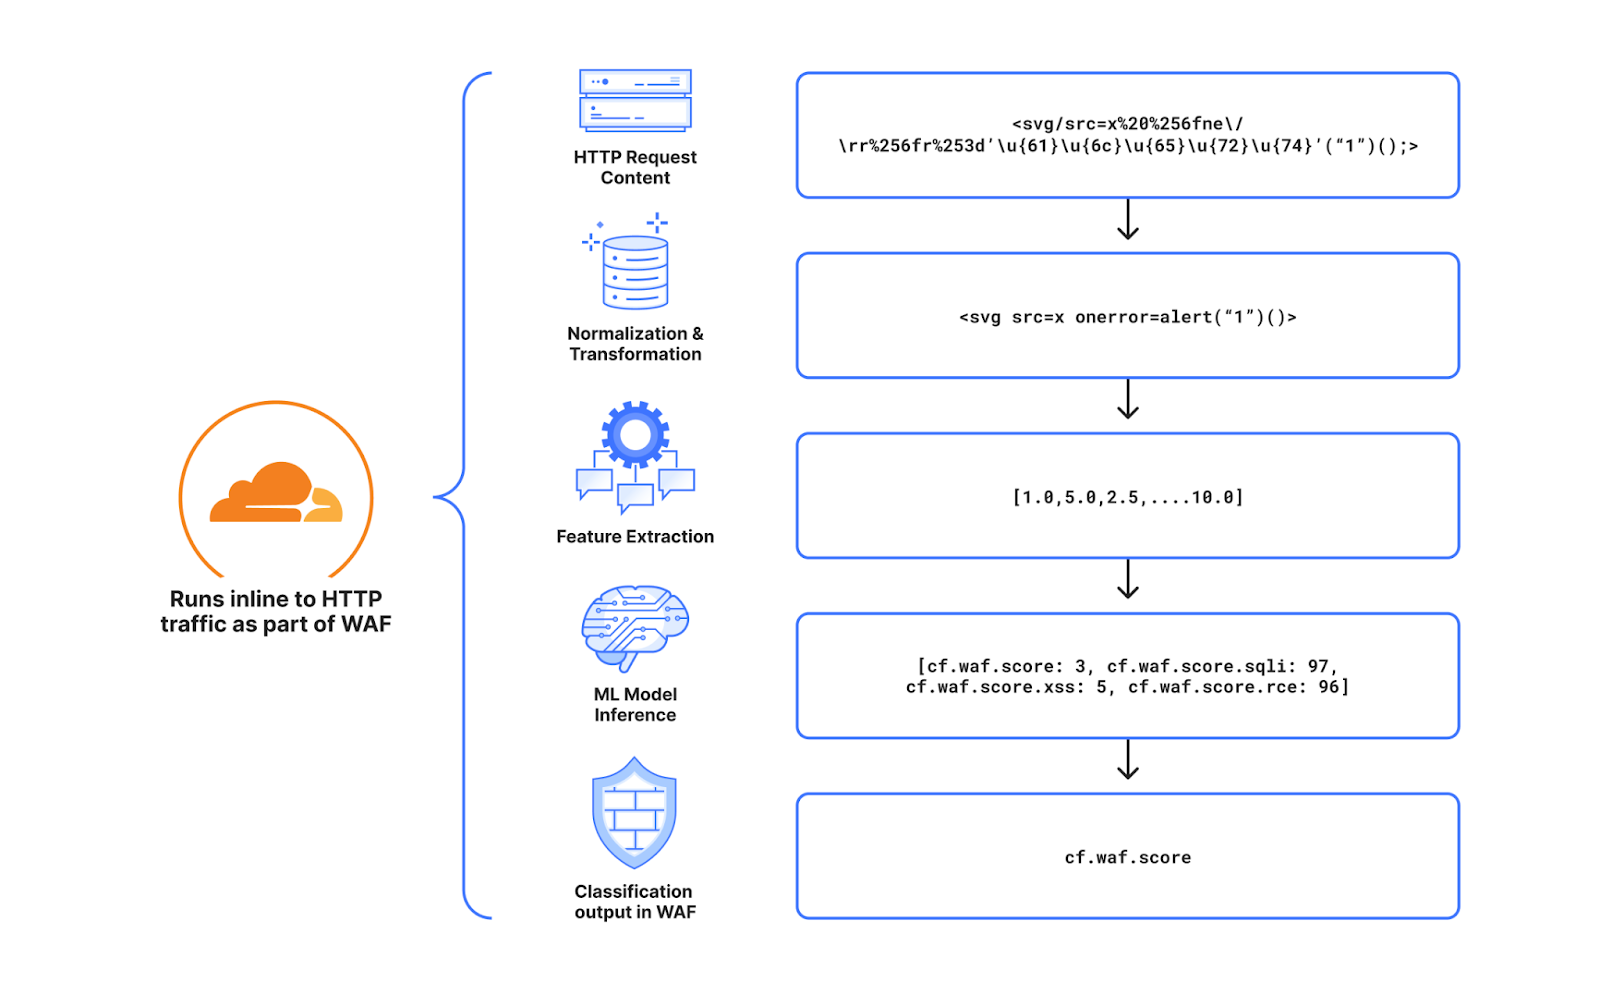
As the surface area for attacks on the web increases, Cloudflare’s Web Application Firewall (WAF) provides a myriad of solutions to mitigate these attacks. This is great for our customers, but the cardinality in the workloads of the millions of requests we service means that generating false positives is inevitable. This means that the default configuration we have for our customers has to be fine-tuned.
Fine-tuning isn’t an opaque process: customers have to get some data points and then decide what works for them. This post explains the technologies we offer to enable customers to see why the WAF takes certain actions — and the improvements that have been made to reduce noise and increase signal.
The Log action is great — can we do more?
Cloudflare’s WAF protects origin servers from different kinds of layer 7 attacks, which are attacks that target the application layer. Protection is provided with various tools like:
The Log action is used to simulate the behaviour of rules. This action proves that a rule expression is matched by the engine and emits a log event which can be accessed via Security Analytics, Security Events, Logpush or Edge Log Delivery.
Logs are great at validating a rule works as expected on the traffic it was expected to match, but showing that the rule matches isn’t sufficient, especially when a rule expression can take many code paths.
In pseudocode, an expression can look like:
If any of the http request headers contains an “authorization” key OR the lowercased representation of the http host header starts with “cloudflare” THEN log
The rules language syntax will be:
any(http.request.headers[*] contains "authorization") or starts_with(lower(http.host), "cloudflare")
Debugging this expression poses a couple of problems. Is it the left-hand side (LHS) or right-hand side (RHS) of the OR expression above that matches? Functions such as Base64 decoding, URL decoding, and in this case lowercasing can apply transformations to the original representation of these fields, which leads to further ambiguity as to which characteristics of the request led to a match.
To further complicate this, many rules in a ruleset can register matches. Rulesets like Cloudflare OWASP use a cumulative score of different rules to trigger an action when the score crosses a set threshold.
Additionally, the expressions of the Cloudflare Managed and OWASP rules are private. This increases our security posture – but it also means that customers can only guess what these rules do from their titles, tags and descriptions. For instance, one might be labeled “SonicWall SMA – Remote Code Execution – CVE:CVE-2025-32819.”
Which raises questions: What part of my request led to a match in the Rulesets engine? Are these false positives?
This is where payload logging shines. It can help us drill down to the specific fields and their respective values, post-transformation, in the rule that led to a match.
Payload logging
Payload logging is a feature that logs which fields in the request are associated with a rule that led to the WAF taking an action. This reduces ambiguity and provides useful information that can help spot check false positives, guarantee correctness, and aid in fine-tuning of these rules for better performance.
From the example above, a payload log entry will contain either the LHS or RHS of the expression, but not both.
How does payload logging work ?
The payload logging and Rulesets engines are built on Wirefilter, which has been explained extensively.
Fundamentally, these engines are objects written in Rust which implement a compiler trait. This trait drives the compilation of the abstract syntax trees (ASTs) derived from these expressions.
struct PayloadLoggingCompiler {
     regex_cache HashMap<String, Arc<Regex>>
}

impl wirefilter::Compiler for PayloadLoggingCompiler {
	type U = PayloadLoggingUserData

	fn compile_logical_expr(&mut self, node: LogicalExpr) -> CompiledExpr<Self::U> {
		// ...
		let regex = self.regex_cache.entry(regex_pattern)
		.or_insert_with(|| Arc::new(regex))
		// ...
	}

}
The Rulesets Engine executes an expression and if it evaluates to true, the expression and its execution context are sent to the payload logging compiler for re-evaluation. The execution context provides all the runtime values needed to evaluate the expression.
After re-evaluation is done, the fields involved in branches of the expression that evaluate to true are logged.
The structure of the log is a map of wirefilter fields and their values Map<Field, Value>
These logs go through our logging pipeline and can be read in different ways. Customers can configure a Logpush job to write to a custom Worker we built that uses the customer’s private key to automatically decrypt these logs. The Payload logging CLI tool, Worker, or the Cloudflare dashboard can also be used for decryption.
What improvements have been shipped?
In wirefilter, some fields are array types. The field http.request.headers.names is an array of all the header names in a request. For example:
An expression that reads any(http.request.headers.names[*] contains “c”) will evaluate to true because at least one of the headers contains the letter “c”. With the previous version of the payload logging compiler, all the headers in the “http.request.headers.names” field will be logged since it’s a part of the expression that evaluates to true.
Now, we partially evaluate the array fields and log the indexes that match the expressions constraint. In this case, it’ll be just the headers that contain a “c”!
This brings us to operators in wirefilter. Some operators like “eq” result in exact matches, e.g. http.host eq “a.com”. There are other operators that result in “partial” matches – like “in”, “contains”, “matches” – that work alongside regexes.
The expression in this example: `any(http.request.headers[*] contains “c”)` uses a “contains” operator which produces a partial match. It also uses the “any” function which we can say produces a partial match, because if at least one of the headers contains a “c”, then we should log that header – not all the headers as we did in the previous version.
With the improvements to the payload logging compiler, when these expressions are evaluated, we log just the partial matches. In this case, the new payload logging compiler handles the “contains” operator similarly to the “find” method for bytes in the Rust standard library. This improves our payload log to:
http.request.headers.names[0,1] = [“c”, “c”]
This makes things a lot clearer. It also saves our logging pipeline from processing millions of bytes. For example, a field that is analyzed a lot is the request body — http.request.body.raw — which can be tens of kilobytes in size. Sometimes the expressions are checking for a regex pattern that should match three characters. In this case we’ll be logging 3 bytes instead of kilobytes!
Context
I know, I know, [“c”, “c”] doesn’t really mean much. Even if we’ve provided the exact reason for the match and are significantly saving on the volume of bytes written to our customers storage destinations, the key goal is to provide useful debugging information to the customer. As part of the payload logging improvements, the compiler now also logs a “before” and “after” (if applicable) for partial matches. The size for these buffers are currently 15 bytes each. This means our payload log now looks like:
http.request.headers[0,1] = [
    {
        before: null, // isnt included in the final log
        content: “c”,
        after: “ontent-length”
    },
    {
        before: null, // isnt included in the final log
        content: “c”,
        after:”ontent-type”
    }
]
Example of payload log (previous)
Example of payload log (new)
In the previous log, we have all the header values. In the new log, we have the 8th index which is a malicious script in a HTTP header. The match is on the “<script>” tag and the rest is the context which is the text in gray.
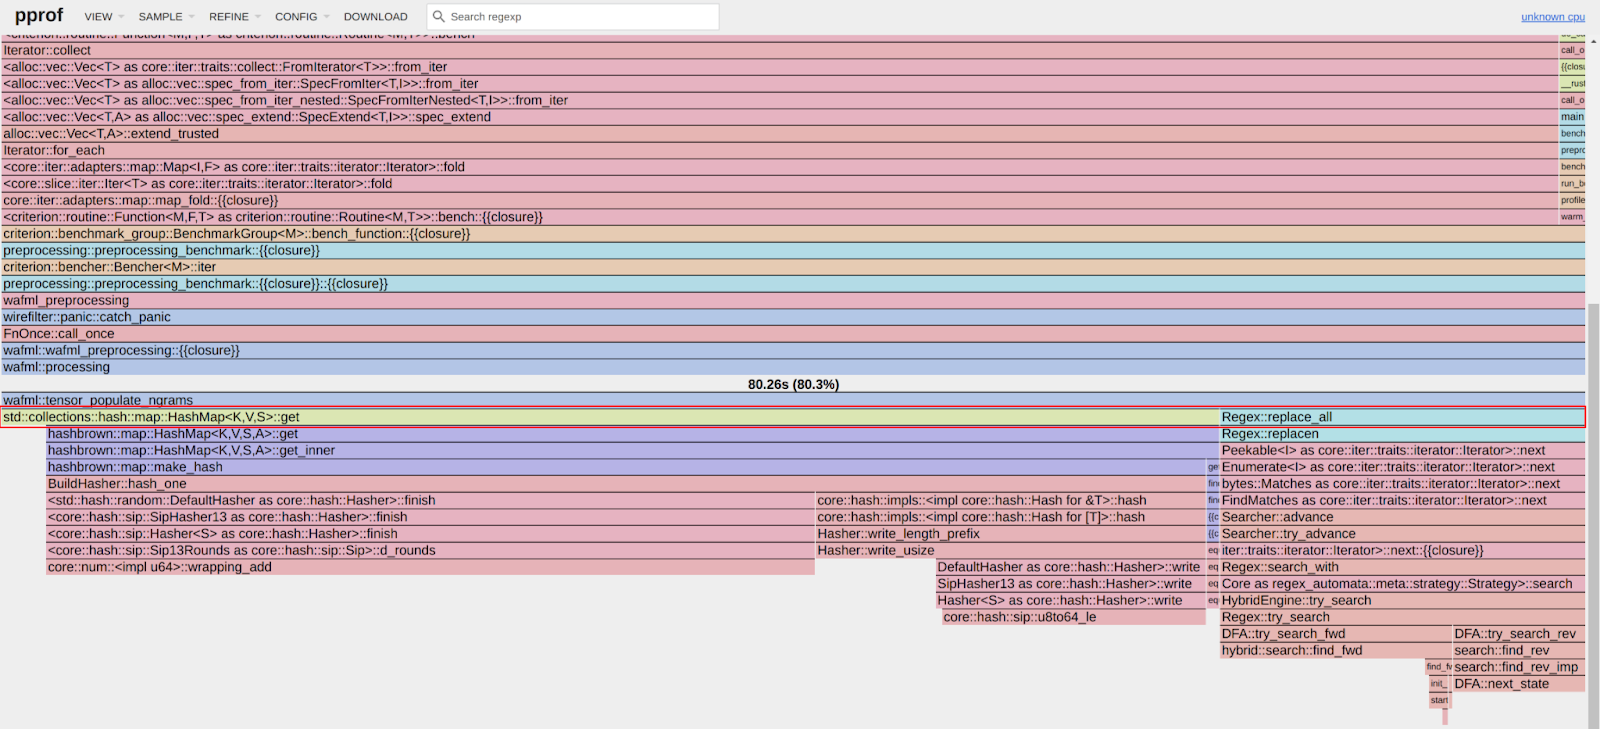
Optimizations
Managed rules rely heavily on regular expressions to fingerprint malicious requests. Parsing and compiling these expressions are CPU-intensive tasks. As managed rules are written once and deployed across millions of zones, we benefit from compiling these regexes and caching them in memory. This saves us CPU cycles as we don’t have to re-compile these until the process restarts.
The Payload logging compiler uses a lot of dynamically sized arrays or vectors to store the intermediate state for these logs. Crates like smallvec are also used to reduce heap allocations.
The infamous “TRUNCATED” value
Sometimes, customers see “truncated” in their payload logs. This is because every firewall event has a size limit in bytes. When this limit is exceeded, the payload log is truncated.
Payload log (previous)
Payload log (new)
We have seen the p50 byte size of the payload logs shrink from 1.5 Kilobytes to 500 bytes – a 67% reduction! That means way fewer truncated payload logs.
What’s next?
We’re currently using a lossy representation of utf-8 strings to represent values. This means that non-valid utf-8 strings like multimedia are represented as U+FFFD unicode replacement characters. For rules that will work on binary data, the integrity of these values should be preserved with byte arrays or with a different serialization format.
The storage format for payload logging is JSON. We’ll be benchmarking this alongside other binary formats like CBOR, Cap’n Proto, Protobuf, etc., to see how much processing time this saves our pipeline. This will help us deliver logs to our customers faster, with the added advantage that binary formats can also help with maintaining a defined schema that will be backward compatible.
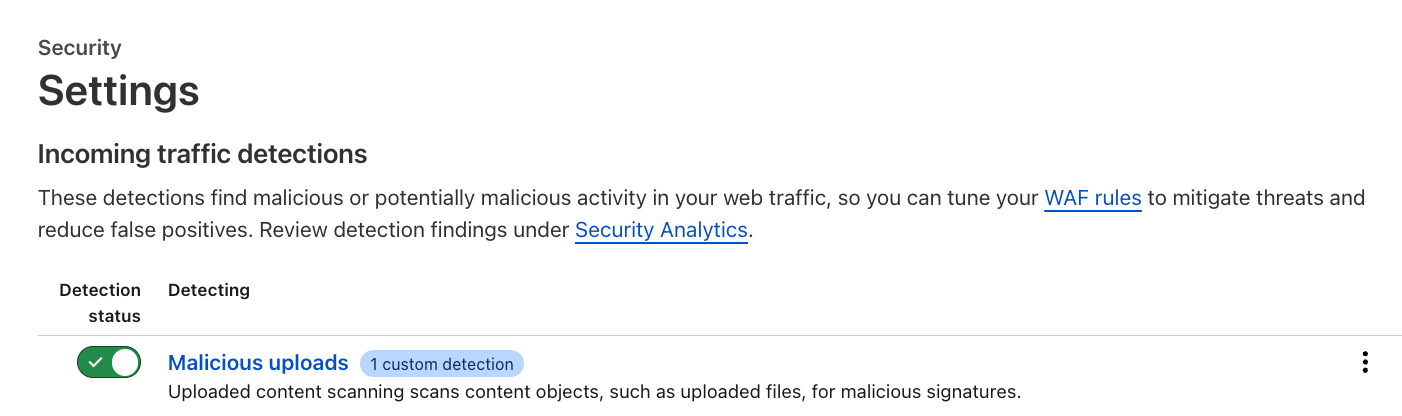
Finally, payload logging only works with Managed rules. It will be rolled out to other Cloudflare WAF products like custom rules, WAF attack score, content scanning, Firewall for AI, and more.
An example of payload logging showing prompts containing PII, detected by Firewall for AI:
Why should I be excited?
Visibility into the actions taken by the WAF will give customers assurance that their rules or configurations are doing exactly what they expect. Improvements to the specificity of payload logging is a step in this direction — and in the pipeline are further improvements to reliability, latency, and expansion to more WAF products.
As this was a breaking change to the JSON schema, we’ve rolled this out slowly to customers with adequate documentation.
IP addresses have historically been treated as stable identifiers for non-routing purposes such as for geolocation and security operations. Many operational and security mechanisms, such as blocklists, rate-limiting, and anomaly detection, rely on the assumption that a single IP address represents a cohesive, accountableentity or even, possibly, a specific user or device.
But the structure of the Internet has changed, and those assumptions can no longer be made. Today, a single IPv4 address may represent hundreds or even thousands of users due to widespread use of Carrier-Grade Network Address Translation (CGNAT), VPNs, and proxymiddleboxes. This concentration of traffic can result in significant collateral damage – especially to users in developing regions of the world – when security mechanisms are applied without taking into account the multi-user nature of IPs.
This blog post presents our approach to detecting large-scale IP sharing globally. We describe how we build reliable training data, and how detection can help avoid unintentional bias affecting users in regions where IP sharing is most prevalent. Arguably it’s those regional variations that motivate our efforts more than any other.
Why this matters: Potential socioeconomic bias
Our work was initially motivated by a simple observation: CGNAT is a likely unseen source of bias on the Internet. Those biases would be more pronounced wherever there are more users and few addresses, such as in developing regions. And these biases can have profound implications for user experience, network operations, and digital equity.
The reasons are understandable for many reasons, not least because of necessity. Countries in the developing world often have significantly fewer available IPs, and more users. The disparity is a historical artifact of how the Internet grew: the largest blocks of IPv4 addresses were allocated decades ago, primarily to organizations in North America and Europe, leaving a much smaller pool for regions where Internet adoption expanded later.
To visualize the IPv4 allocation gap, we plot country-level ratios of users to IP addresses in the figure below. We take online user estimates from the World Bank Group and the number of IP addresses in a country from Regional Internet Registry (RIR) records. The colour-coded map that emerges shows that the usage of each IP address is more concentrated in regions that generally have poor Internet penetration. For example, large portions of Africa and South Asia appear with the highest user-to-IP ratios. Conversely, the lowest user-to-IP ratios appear in Australia, Canada, Europe, and the USA — the very countries that otherwise have the highest Internet user penetration numbers.
The scarcity of IPv4 address space means that regional differences can only worsen as Internet penetration rates increase. A natural consequence of increased demand in developing regions is that ISPs would rely even more heavily on CGNAT, and is compounded by the fact that CGNAT is common in mobile networks that users in developing regions so heavily depend on. All of this means that actions known to be based on IP reputation or behaviour would disproportionately affect developing economies.
Cloudflare is a global network in a global Internet. We are sharing our methodology so that others might benefit from our experience and help to mitigate unintended effects. First, let’s better understand CGNAT.
When one IP address serves multiple users
Large-scale IP address sharing is primarily achieved through two distinct methods. The first, and more familiar, involves services like VPNs and proxies. These tools emerge from a need to secure corporate networks or improve users’ privacy, but can be used to circumvent censorship or even improve performance. Their deployment also tends to concentrate traffic from many users onto a small set of exit IPs. Typically, individuals are aware they are using such a service, whether for personal use or as part of a corporate network.
Separately, another form of large-scale IP sharing often goes unnoticed by users: Carrier-Grade NAT (CGNAT). One way to explain CGNAT is to start with a much smaller version of network address translation (NAT) that very likely exists in your home broadband router, formally called a Customer Premises Equipment (or CPE), which translates unseen private addresses in the home to visible and routable addresses in the ISP. Once traffic leaves the home, an ISP may add an additional enterprise-level address translation that causes many households or unrelated devices to appear behind a single IP address.
The crucial difference between large-scale IP sharing is user choice: carrier-grade address sharing is not a user choice, but is configured directly by Internet Service Providers (ISPs) within their access networks. Users are not aware that CGNATs are in use.
The primary driver for this technology, understandably, is the exhaustion of the IPv4 address space. IPv4’s 32-bit architecture supports only 4.3 billion unique addresses — a capacity that, while once seemingly vast, has been completely outpaced by the Internet’s explosive growth. By the early 2010s, Regional Internet Registries (RIRs) had depleted their pools of unallocated IPv4 addresses. This left ISPs unable to easily acquire new address blocks, forcing them to maximize the use of their existing allocations.
While the long-term solution is the transition to IPv6, CGNAT emerged as the immediate, practical workaround. Instead of assigning a unique public IP address to each customer, ISPs use CGNAT to place multiple subscribers behind a single, shared IP address. This practice solves the problem of IP address scarcity. Since translated addresses are not publicly routable, CGNATs have also had the positive side effect of protecting many home devices that might be vulnerable to compromise.
CGNATs also create significant operational fallout stemming from the fact that hundreds or even thousands of clients can appear to originate from a single IP address. This means an IP-based security system may inadvertently block or throttle large groups of users as a result of a single user behind the CGNAT engaging in malicious activity.
This isn’t a new or niche issue. It has been recognized for years by the Internet Engineering Task Force (IETF), the organization that develops the core technical standards for the Internet. These standards, known as Requests for Comments (RFCs), act as the official blueprints for how the Internet should operate. RFC 6269, for example, discusses the challenges of IP address sharing, while RFC 7021 examines the impact of CGNAT on network applications. Both explain that traditional abuse-mitigation techniques, such as blocklisting or rate-limiting, assume a one-to-one relationship between IP addresses and users: when malicious activity is detected, the offending IP address can be blocked to prevent further abuse.
In shared IPv4 environments, such as those using CGNAT or other address-sharing techniques, this assumption breaks down because multiple subscribers can appear under the same public IP. Blocking the shared IP therefore penalizes many innocent users along with the abuser. In 2015 Ofcom, the UK’s telecommunications regulator, reiterated these concerns in a report on the implications of CGNAT where they noted that, “In the event that an IPv4 address is blocked or blacklisted as a source of spam, the impact on a CGNAT would be greater, potentially affecting an entire subscriber base.”
While the hope was that CGNAT was only a temporary solution until the eventual switch to IPv6, as the old proverb says, nothing is more permanent than a temporary solution. While IPv6 deployment continues to lag, CGNAT deployments have become increasingly common, and so do the related problems.
CGNAT detection at Cloudflare
To enable a fairer treatment of users behind CGNAT IPs by security techniques that rely on IP reputation, our goal is to identify large-scale IP sharing. This allows traffic filtering to be better calibrated and collateral damage minimized. Additionally, we want to distinguish CGNAT IPs from other large-scale sharing (LSS) IP technologies, such as VPNs and proxies, because we may need to take different approaches to different kinds of IP-sharing technologies.
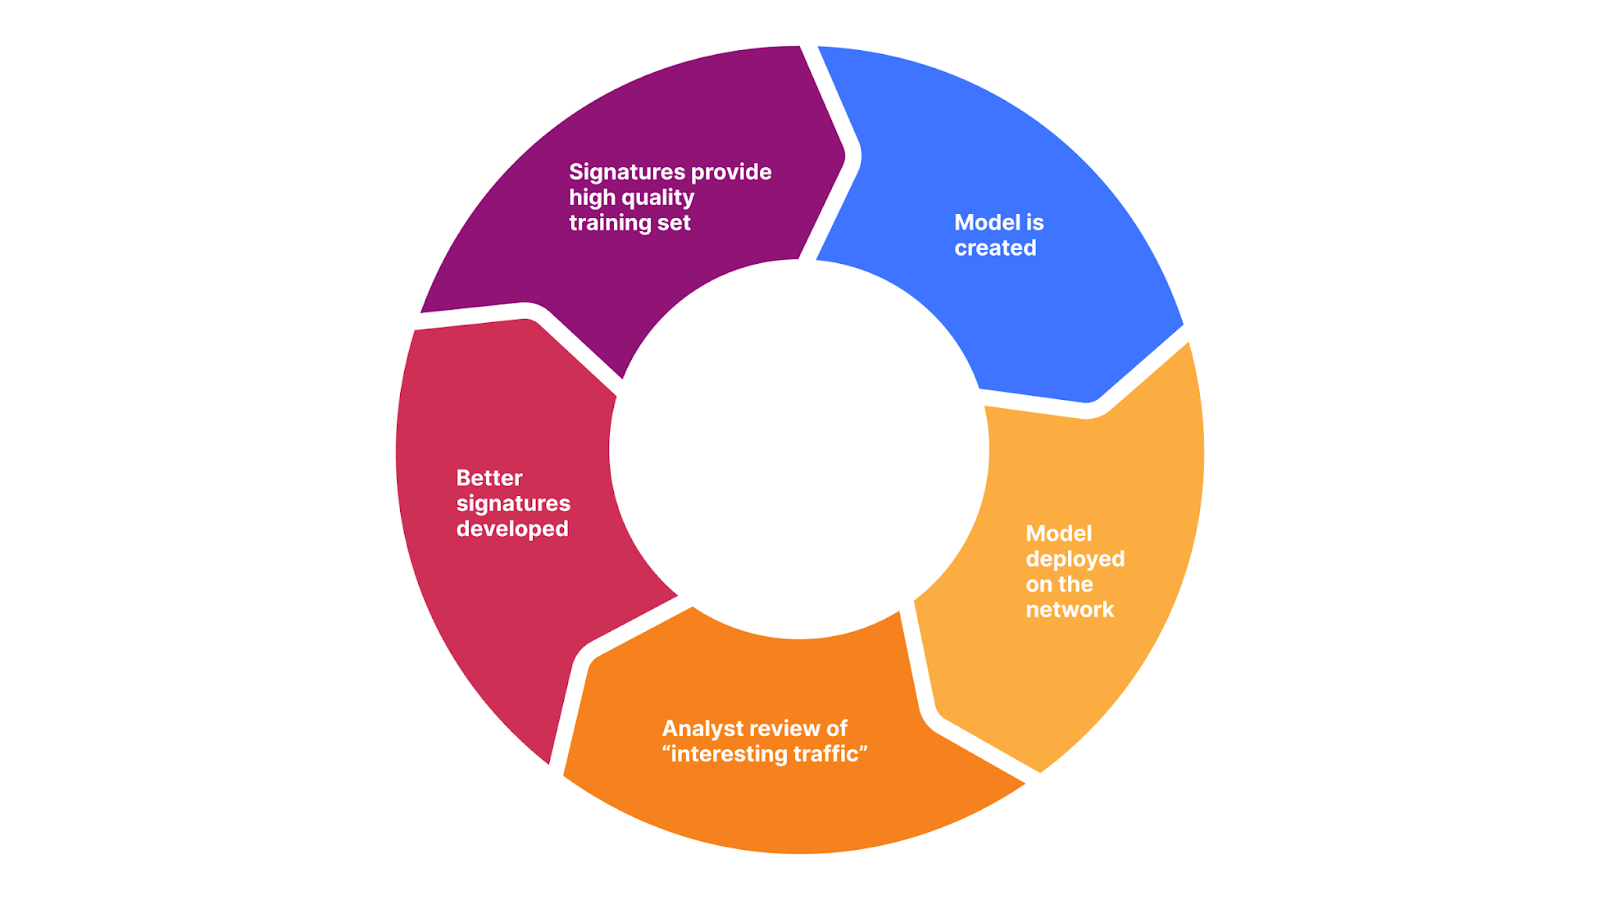
To do this, we decided to take advantage of Cloudflare’s extensive view of the active IP clients, and build a supervised learning classifier that would distinguish CGNAT and VPN/proxy IPs from IPs that are allocated to a single subscriber (non-LSS IPs), based on behavioural characteristics. The figure below shows an overview of our supervised classifier:
While our classification approach is straightforward, a significant challenge is the lack of a reliable, comprehensive, and labeled dataset of CGNAT IPs for our training dataset.
Detecting CGNAT using public data sources
Detection begins by building an initial dataset of IPs believed to be associated with CGNAT. Cloudflare has vast HTTP and traffic logs. Unfortunately there is no signal or label in any request to indicate what is or is not a CGNAT.
To build an extensive labelled dataset to train our ML classifier, we employ a combination of network measurement techniques, as described below. We rely on public data sources to help disambiguate an initial set of large-scale shared IP addresses from others in Cloudflare’s logs.
Distributed Traceroutes
The presence of a client behind CGNAT can often be inferred through traceroute analysis. CGNAT requires ISPs to insert a NAT step that typically uses the Shared Address Space (RFC 6598) after the customer premises equipment (CPE). By running a traceroute from the client to its own public IP and examining the hop sequence, the appearance of an address within 100.64.0.0/10 between the first private hop (e.g., 192.168.1.1) and the public IP is a strong indicator of CGNAT.
Traceroute can also reveal multi-level NAT, which CGNAT requires, as shown in the diagram below. If the ISP assigns the CPE a private RFC 1918 address that appears right after the local hop, this indicates at least two NAT layers. While ISPs sometimes use private addresses internally without CGNAT, observing private or shared ranges immediately downstream combined with multiple hops before the public IP strongly suggests CGNAT or equivalent multi-layer NAT.
Although traceroute accuracy depends on router configurations, detecting private and shared IP ranges is a reliable way to identify large-scale IP sharing. We apply this method to distributed traceroutes from over 9,000 RIPE Atlas probes to classify hosts as behind CGNAT, single-layer NAT, or no NAT.
Scraping WHOIS and PTR records
Many operators encode metadata about their IPs in the corresponding reverse DNS pointer (PTR) record that can signal administrative attributes and geographic information. We first query the DNS for PTR records for the full IPv4 space and then filter for a set of known keywords from the responses that indicate a CGNAT deployment. For example, each of the following three records matches a keyword (cgnat, cgn or lsn) used to detect CGNAT address space:
WHOIS and Internet Routing Registry (IRR) records may also contain organizational names, remarks, or allocation details that reveal whether a block is used for CGNAT pools or residential assignments.
Given that both PTR and WHOIS records may be manually maintained and therefore may be stale, we try to sanitize the extracted data by validating the fact that the corresponding ISPs indeed use CGNAT based on customer and market reports.
Collecting VPN and proxy IPs
Compiling a list of VPN and proxy IPs is more straightforward, as we can directly find such IPs in public service directories for anonymizers. We also subscribe to multiple VPN providers, and we collect the IPs allocated to our clients by connecting to a unique HTTP endpoint under our control.
Modeling CGNAT with machine learning
By combining the above techniques, we accumulated a dataset of labeled IPs for more than 200K CGNAT IPs, 180K VPNs & proxies and close to 900K IPs allocated that are not LSS IPs. These were the entry points to modeling with machine learning.
Feature selection
Our hypothesis was that aggregated activity from CGNAT IPs is distinguishable from activity generated from other non-CGNAT IP addresses. Our feature extraction is an evaluation of that hypothesis — since networks do not disclose CGNAT and other uses of IPs, the quality of our inference is strictly dependent on our confidence in the training data. We claim the key discriminator is diversity, not just volume. For example, VM-hosted scanners may generate high numbers of requests, but with low information diversity. Similarly, globally routable CPEs may have individually unique characteristics, but with volumes that are less likely to be caught at lower sampling rates.
In our feature extraction, we parse a 1% sampled HTTP requests log for distinguishing features of IPs compiled in our reference set, and the same features for the corresponding /24 prefix (namely IPs with the same first 24 bits in common). We analyse the features for each of the VPNs, proxies, CGNAT, or non LSS IP. We find that features from the following broad categories are key discriminators for the different types of IPs in our training dataset:
Client-side signals: We analyze the aggregate properties of clients connecting from an IP. A large, diverse user base (like on a CGNAT) naturally presents a much wider statistical variety of client behaviors and connection parameters than a single-tenant server or a small business proxy.
Network and transport-level behaviors: We examine traffic at the network and transport layers. The way a large-scale network appliance (like a CGNAT) manages and routes connections often leaves subtle, measurable artifacts in its traffic patterns, such as in port allocation and observed network timing.
Traffic volume and destination diversity: We also model the volume and “shape” of the traffic. An IP representing thousands of independent users will, on average, generate a higher volume of requests and target a much wider, less correlated set of destinations than an IP representing a single user.
Crucially, to distinguish CGNAT from VPNs and proxies (which is absolutely necessary for calibrated security filtering), we had to aggregate these features at two different scopes: per-IP and per /24 prefixes. CGNAT IPs are typically allocated large blocks of IPs, whereas VPNs IPs are more scattered across different IP prefixes.
Classification results
We compute the above features from HTTP logs over 24-hour intervals to increase data volume and reduce noise due to DHCP IP reallocation. The dataset is split into 70% training and 30% testing sets with disjoint /24 prefixes, and VPN and proxy labels are merged due to their similarity and lower operational importance compared to CGNAT detection.
Then we train a multi-class XGBoost model with class weighting to address imbalance, assigning each IP to the class with the highest predicted probability. XGBoost is well-suited for this task because it efficiently handles large feature sets, offers strong regularization to prevent overfitting, and delivers high accuracy with limited parameter tuning. The classifier achieves 0.98 accuracy, 0.97 weighted F1, and 0.04 log loss. The figure below shows the confusion matrix of the classification.
Our model is accurate for all three labels. The errors observed are mainly misclassifications of VPN/proxy IPs as CGNATs, mostly for VPN/proxy IPs that are within a /24 prefix that is also shared by broadband users outside of the proxy service. We also evaluate the prediction accuracy using k-fold cross validation, which provides a more reliable estimate of performance by training and validating on multiple data splits, reducing variance and overfitting compared to a single train–test split. We select 10 folds and we evaluate the Area Under the ROC Curve (AUC) and the multi-class logloss. We achieve a macro-average AUC of 0.9946 (σ=0.0069) and log loss of 0.0429 (σ=0.0115). Prefix-level features are the most important contributors to classification performance.
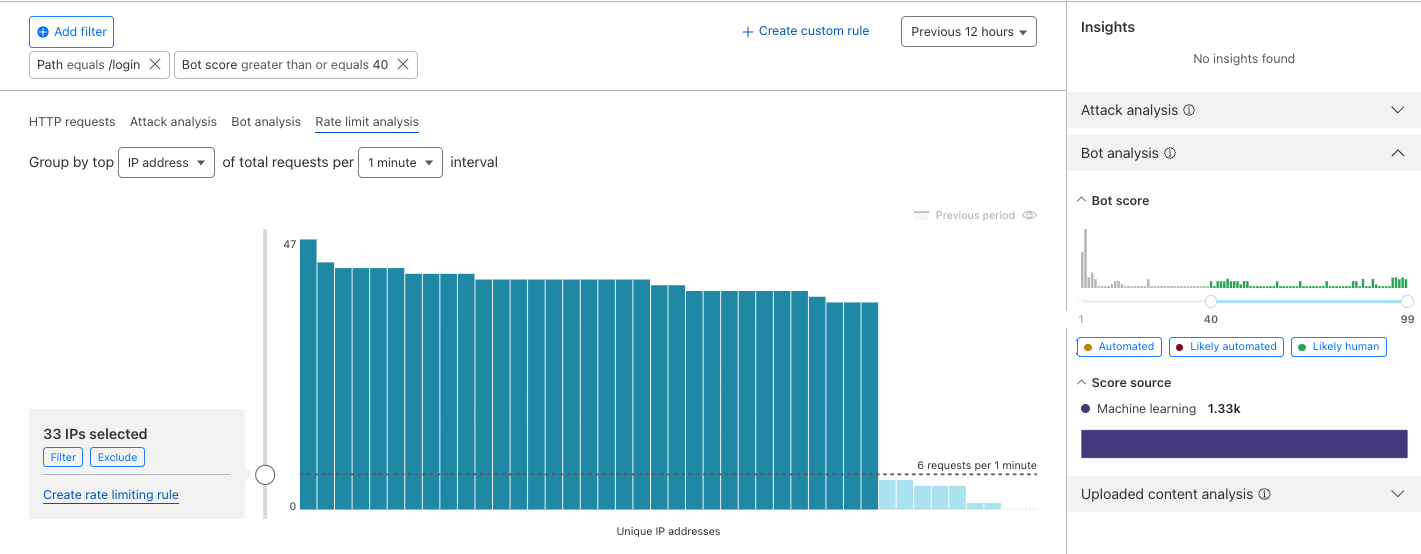
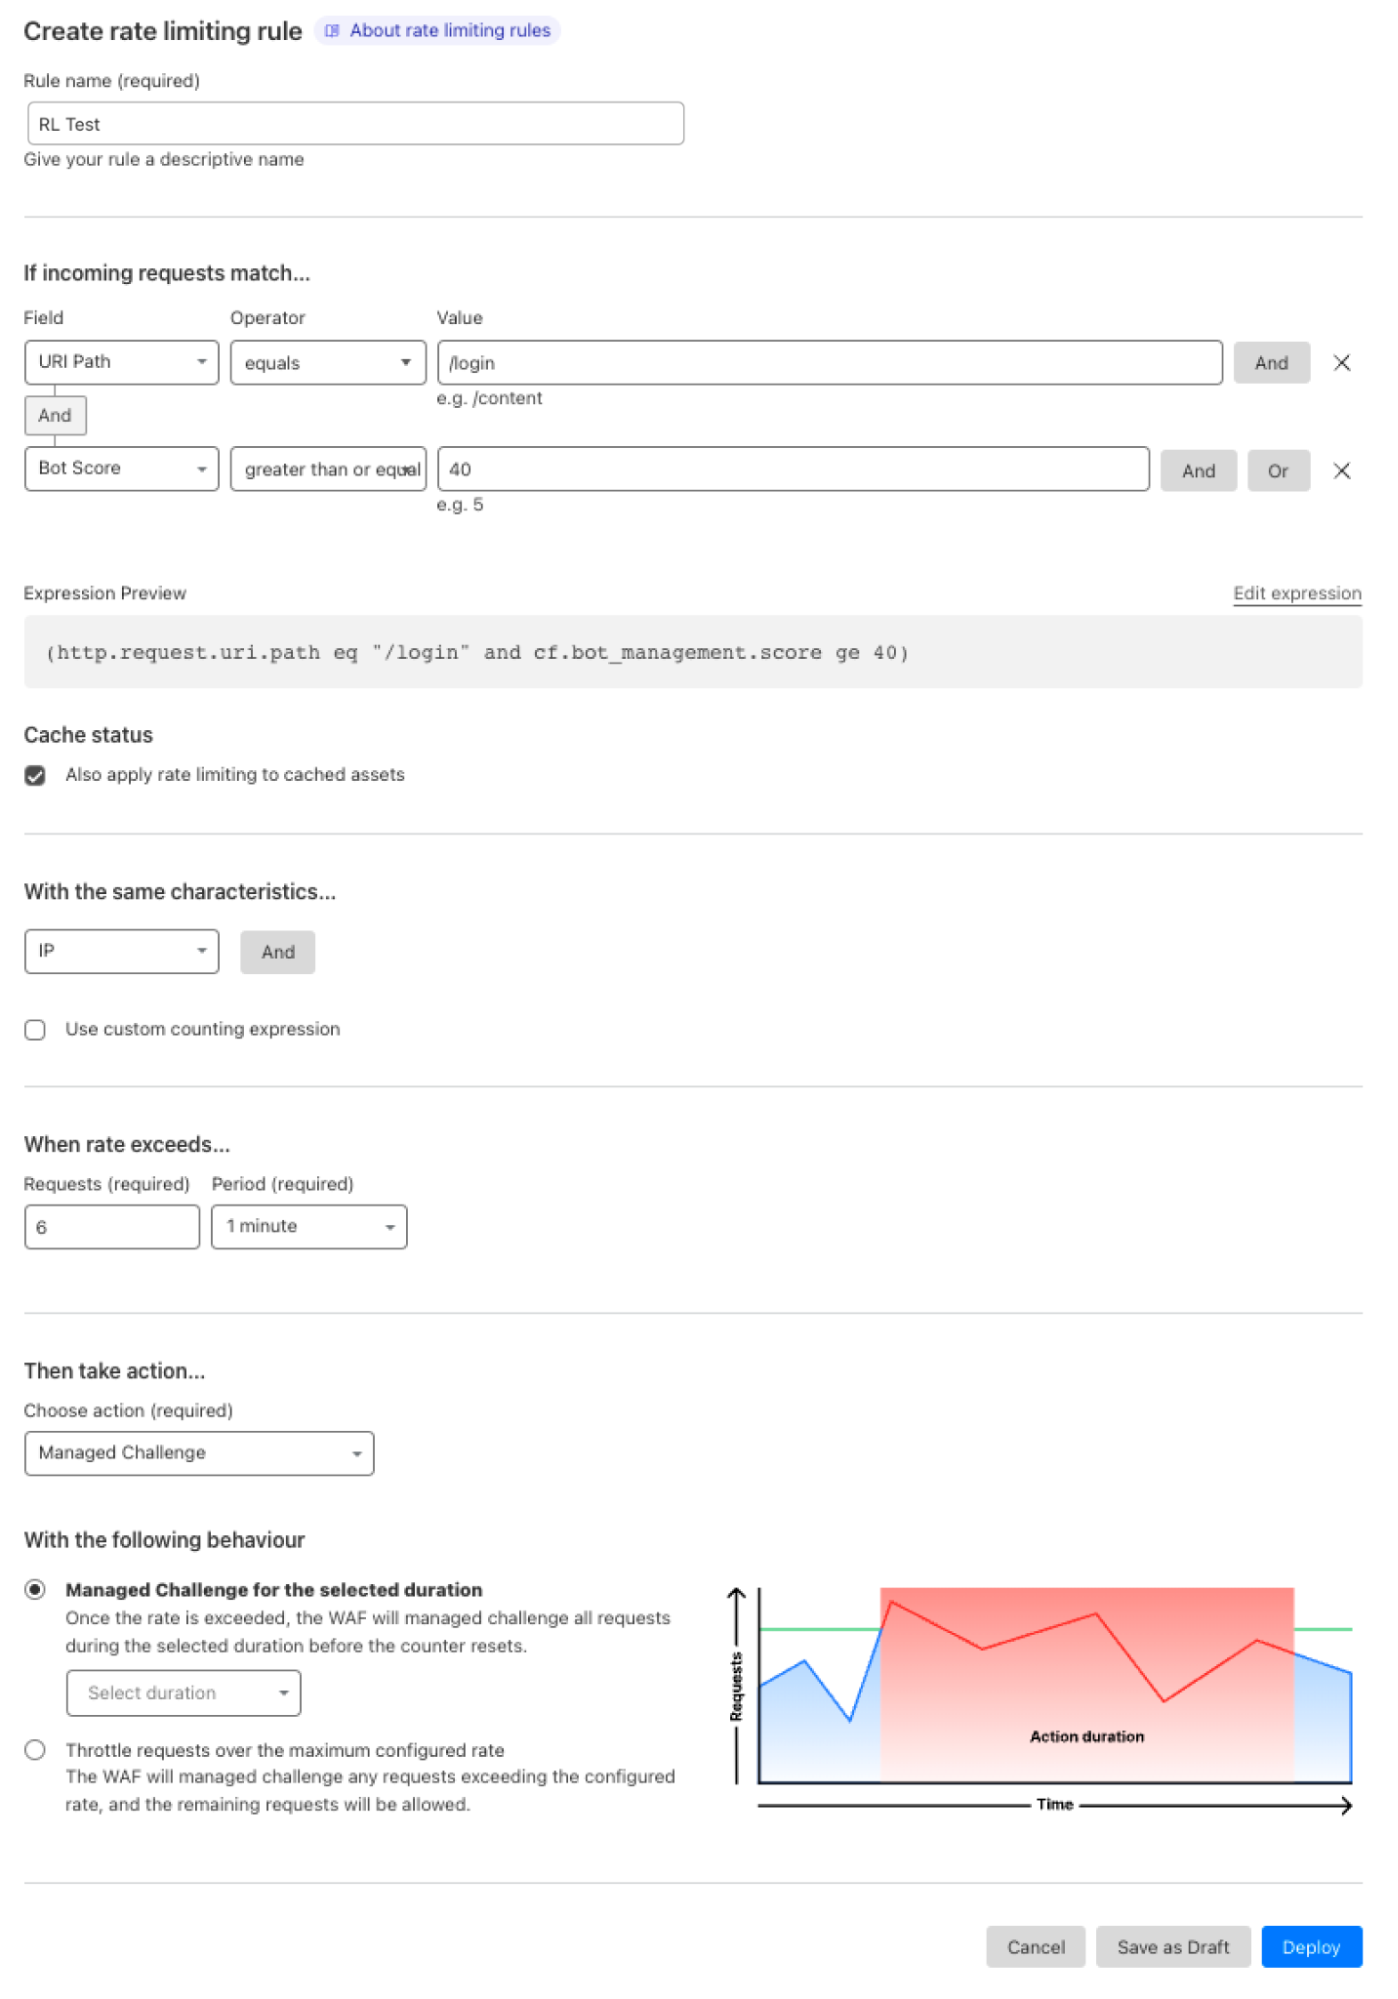
Users behind CGNAT are more likely to be rate limited
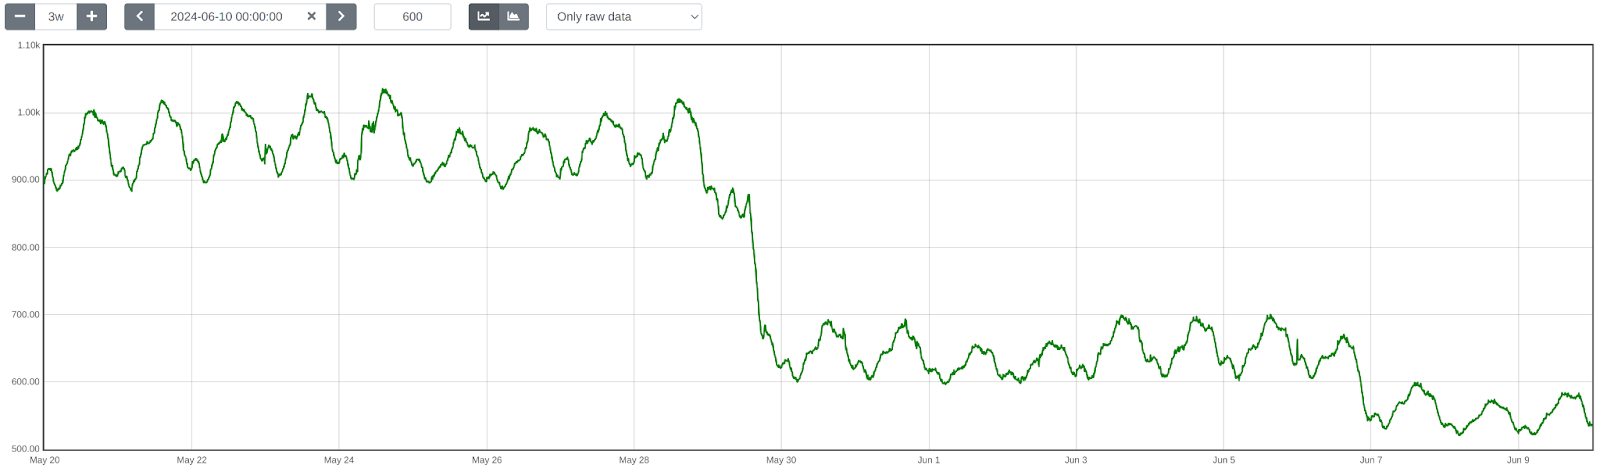
The figure below shows the daily number of CGNAT IP inferences generated by our CDN-deployed detection service between December 17, 2024 and January 9, 2025. The number of inferences remains largely stable, with noticeable dips during weekends and holidays such as Christmas and New Year’s Day. This pattern reflects expected seasonal variations, as lower traffic volumes during these periods lead to fewer active IP ranges and reduced request activity.
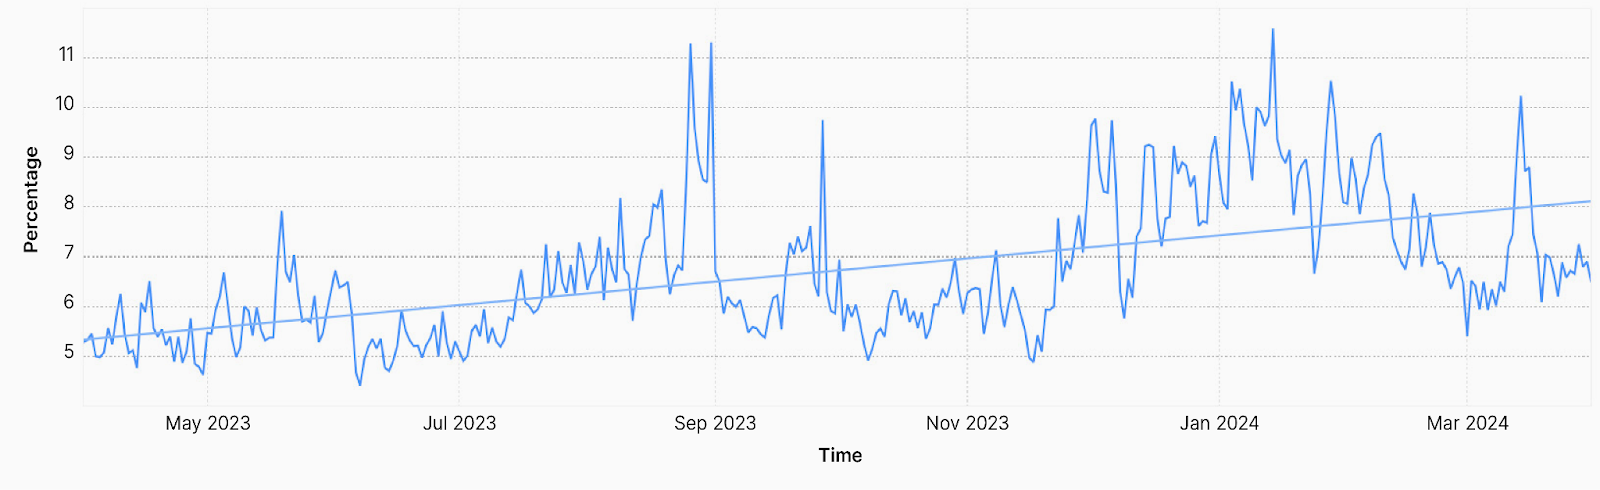
Next, recall that actions that rely on IP reputation or behaviour may be unduly influenced by CGNATs. One such example is bot detection. In an evaluation of our systems, we find that bot detection is resilient to those biases. However, we also learned that customers are more likely to rate limit IPs that we find are CGNATs.
We analyze bot labels by analyzing how often requests from CGNAT and non-CGNAT IPs are labeled as bots. Cloudflare assigns a bot score to each HTTP request using CatBoost models trained on various request features, and these scores are then exposed through the Web Application Firewall (WAF), allowing customers to apply filtering rules. The median bot rate is nearly identical for CGNAT (4.8%) and non-CGNAT (4.7%) IPs. However, the mean bot rate is notably lower for CGNATs (7%) than for non-CGNATs (13.1%), indicating different underlying distributions. Non-CGNAT IPs show a much wider spread, with some reaching 100% bot rates, while CGNAT IPs cluster mostly below 15%. This suggests that non-CGNAT IPs tend to be dominated by either human or bot activity, whereas CGNAT IPs reflect mixed behavior from many end users, with human traffic prevailing.
Interestingly, despite bot scores that indicate traffic is more likely to be from human users, CGNAT IPs are subject to rate limiting three times more often than non-CGNAT IPs. This is likely because multiple users share the same public IP, increasing the chances that legitimate traffic gets caught by customers’ bot mitigation and firewall rules.
This tells us that users behind CGNAT IPs are indeed susceptible to collateral effects, and identifying those IPs allows us to tune mitigation strategies to disrupt malicious traffic quickly while reducing collateral impact on benign users behind the same address.
A global view of the CGNAT ecosystem
One of the early motivations of this work was to understand if our knowledge about IP addresses might hide a bias along socio-economic boundaries—and in particular if an action on an IP address may disproportionately affect populations in developing nations, often referred to as the Global South. Identifying where different IPs exist is a necessary first step.
The map below shows the fraction of a country’s inferred CGNAT IPs over all IPs observed in the country. Regions with a greater reliance on CGNAT appear darker on the map. This view highlights the geodiversity of CGNATs in terms of importance; for example, much of Africa and Central and Southeast Asia rely on CGNATs.
As further evidence of continental differences, the boxplot below shows the distribution of distinct user agents per IP across /24 prefixes inferred to be part of a CGNAT deployment in each continent.
Notably, Africa has a much higher ratio of user agents to IP addresses than other regions, suggesting more clients share the same IP in African ASNs. So, not only do African ISPs rely more extensively on CGNAT, but the number of clients behind each CGNAT IP is higher.
While the deployment rate of CGNAT per country is consistent with the users-per-IP ratio per country, it is not sufficient by itself to confirm deployment. The scatterplot below shows the number of users (according to APNIC user estimates) and the number of IPs per ASN for ASNs where we detect CGNAT. ASNs that have fewer available IP addresses than their user base appear below the diagonal. Interestingly the scatterplot indicates that many ASNs with more addresses than users still choose to deploy CGNAT. Presumably, these ASNs provide additional services beyond broadband, preventing them from dedicating their entire address pool to subscribers.
What this means for everyday Internet users
Accurate detection of CGNAT IPs is crucial for minimizing collateral effects in network operations and for ensuring fair and effective application of security measures. Our findings underscore the potential socio-economic and geographical variations in the use of CGNATs, revealing significant disparities in how IP addresses are shared across different regions.
At Cloudflare we are going beyond just using these insights to evaluate policies and practices. We are using the detection systems to improve our systems across our application security suite of features, and working with customers to understand how they might use these insights to improve the protections they configure.
Our work is ongoing and we’ll share details as we go. In the meantime, if you’re an ISP or network operator that operates CGNAT and want to help, get in touch at [email protected]. Sharing knowledge and working together helps make better and equitable user experience for subscribers, while preserving web service safety and security.
Security teams are racing to secure a new attack surface: AI-powered applications. From chatbots to search assistants, LLMs are already shaping customer experience, but they also open the door to new risks. A single malicious prompt can exfiltrate sensitive data, poison a model, or inject toxic content into customer-facing interactions, undermining user trust. Without guardrails, even the best-trained model can be turned against the business.
Today, as part of AI Week, we’re expanding our AI security offerings by introducing unsafe content moderation, now integrated directly into Cloudflare Firewall for AI. Built with Llama, this new feature allows customers to leverage their existing Firewall for AI engine for unified detection, analytics, and topic enforcement, providing real-time protection for Large Language Models (LLMs) at the network level. Now with just a few clicks, security and application teams can detect and block harmful prompts or topics at the edge — eliminating the need to modify application code or infrastructure.
This feature is immediately available to current Firewall for AI users. Those not yet onboarded can contact their account team to participate in the beta program.
AI protection in application security
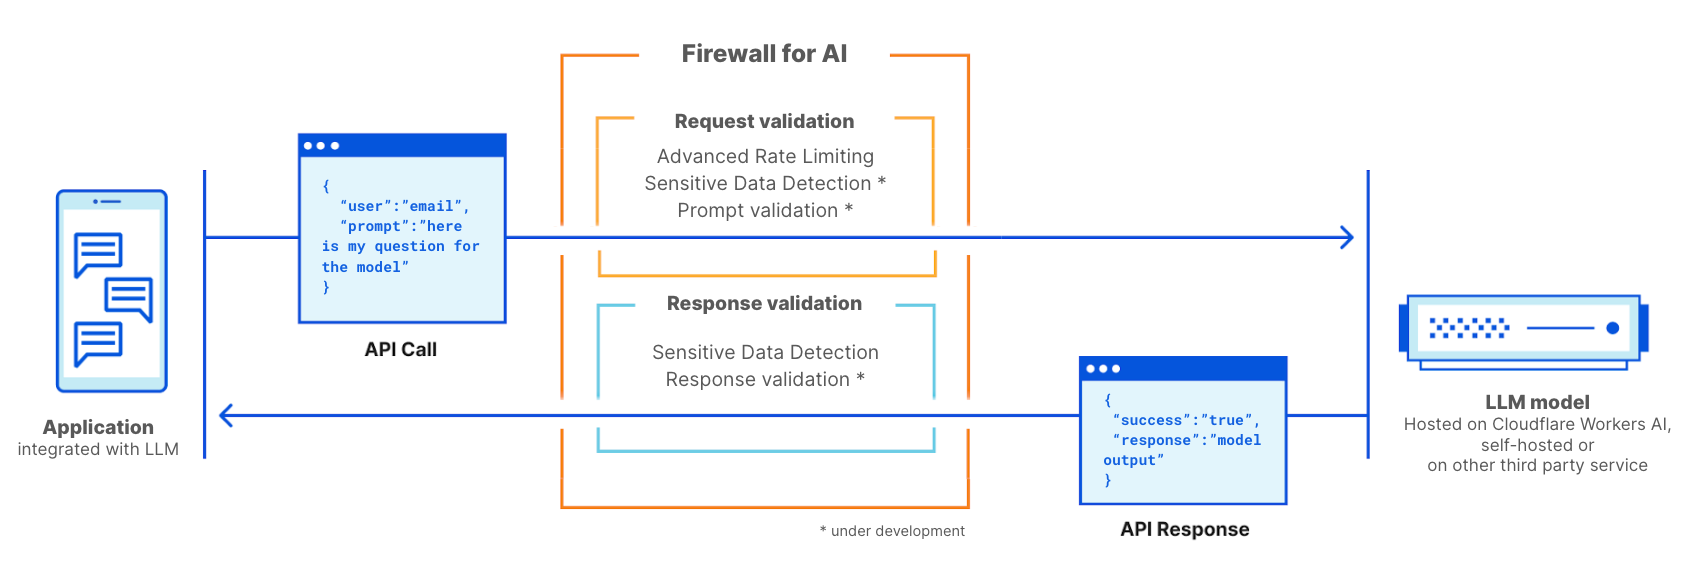
Cloudflare’s Firewall for AI protects user-facing LLM applications from abuse and data leaks, addressing several of the OWASP Top 10 LLM risks such as prompt injection, PII disclosure, and unbound consumption. It also extends protection to other risks such as unsafe or harmful content.
Unlike built-in controls that vary between model providers, Firewall for AI is model-agnostic. It sits in front of any model you choose, whether it’s from a third party like OpenAI or Gemini, one you run in-house, or a custom model you have built, and applies the same consistent protections.
Just like our origin-agnostic Application Security suite, Firewall for AI enforces policies at scale across all your models, creating a unified security layer. That means you can define guardrails once and apply them everywhere. For example, a financial services company might require its LLM to only respond to finance-related questions, while blocking prompts about unrelated or sensitive topics, enforced consistently across every model in use.
Unsafe content moderation protects businesses and users
Effective AI moderation is more than blocking “bad words”, it’s about setting boundaries that protect users, meeting legal obligations, and preserving brand integrity, without over-moderating in ways that silence important voices.
Because LLMs cannot be fully scripted, their interactions are inherently unpredictable. This flexibility enables rich user experiences but also opens the door to abuse.
Key risks from unsafe prompts include misinformation, biased or offensive content, and model poisoning, where repeated harmful prompts degrade the quality and safety of future outputs. Blocking these prompts aligns with the OWASP Top 10 for LLMs, preventing both immediate misuse and long-term degradation.
One example of this isMicrosoft’s Tay chatbot. Trolls deliberately submitted toxic, racist, and offensive prompts, which Tay quickly began repeating. The failure was not only in Tay’s responses; it was in the lack of moderation on the inputs it accepted.
Detecting unsafe prompts before reaching the model
Cloudflare has integrated Llama Guard directly into Firewall for AI. This brings AI input moderation into the same rules engine our customers already use to protect their applications. It uses the same approach that we created for developers building with AI in our AI Gateway product.
Llama Guard analyzes prompts in real time and flags them across multiple safety categories, including hate, violence, sexual content, criminal planning, self-harm, and more.
With this integration, Firewall for AI not only discovers LLM traffic endpoints automatically, but also enables security and AI teams to take immediate action. Unsafe prompts can be blocked before they reach the model, while flagged content can be logged or reviewed for oversight and tuning. Content safety checks can also be combined with other Application Security protections, such as Bot Managementand Rate Limiting, to create layered defenses when protecting your model.
The result is a single, edge-native policy layer that enforces guardrails before unsafe prompts ever reach your infrastructure — without needing complex integrations.
How it works under the hood
Before diving into the architecture of Firewall for AI engine and how it fits within our previously mentioned module to detect PII in the prompts, let’s start with how we detect unsafe topics.
Detection of unsafe topics
A key challenge in building safety guardrails is balancing a good detection with model helpfulness. If detection is too broad, it can prevent a model from answering legitimate user questions, hurting its utility. This is especially difficult for topic detection because of the ambiguity and dynamic nature of human language, where context is fundamental to meaning.
Simple approaches like keyword blocklists are interesting for precise subjects — but insufficient. They are easily bypassed and fail to understand the context in which words are used, leading to poor recall. Older probabilistic models such as Latent Dirichlet Allocation (LDA) were an improvement, but did not properly account for word ordering and other contextual nuances.
Recent advancements in LLMs introduced a new paradigm. Their ability to perform zero-shot or few-shot classification is uniquely suited for the task of topic detection. For this reason, we chose Llama Guard 3, an open-source model based on the Llama architecture that is specifically fine-tuned for content safety classification. When it analyzes a prompt, it answers whether the text is safe or unsafe, and provides a specific category. We are showing the default categories, as listed here. Because Llama 3 has a fixed knowledge cutoff, certain categories — like defamation or elections — are time-sensitive. As a result, the model may not fully capture events or context that emerged after it was trained, and that’s important to keep in mind when relying on it.
For now, we cover the 13 default categories. We plan to expand coverage in the future, leveraging the model’s zero-shot capabilities.
A scalable architecture for future detections
We designed Firewall for AI to scale without adding noticeable latency, including Llama Guard, and this remains true even as we add new detection models.
To achieve this, we built a new asynchronous architecture. When a request is sent to an application protected by Firewall for AI, a Cloudflare Worker makes parallel, non-blocking requests to our different detection modules — one for PII, one for unsafe topics, and others as we add them.
Thanks to the Cloudflare network, this design scales to handle high request volumes out of the box, and latency does not increase as we add new detections. It will only be bounded by the slowest model used.
We optimize to keep the model utility at its maximum while keeping the guardrail detection broad enough.
Llama Guard is a rather large model, so running it at scale with minimal latency is a challenge. We deploy it on Workers AI, leveraging our large fleet of high performance GPUs. This infrastructure ensures we can offer fast, reliable inference throughout our network.
To ensure the system remains fast and reliable as adoption grows, we ran extensive load tests simulating the requests per second (RPS) we anticipate, using a wide range of prompt sizes to prepare for real-world traffic. To handle this, the number of model instances deployed on our network scales automatically with the load. We employ concurrency to minimize latency and optimize for hardware utilization. We also enforce a hard 2-second threshold for each analysis; if this time limit is reached, we fall back to any detections already completed, ensuring your application’s requests latency is never further impacted.
From detection to security rules enforcement
Firewall for AI follows the same familiar pattern as other Application Security features like Bot Management and WAF Attack Score, making it easy to adopt.
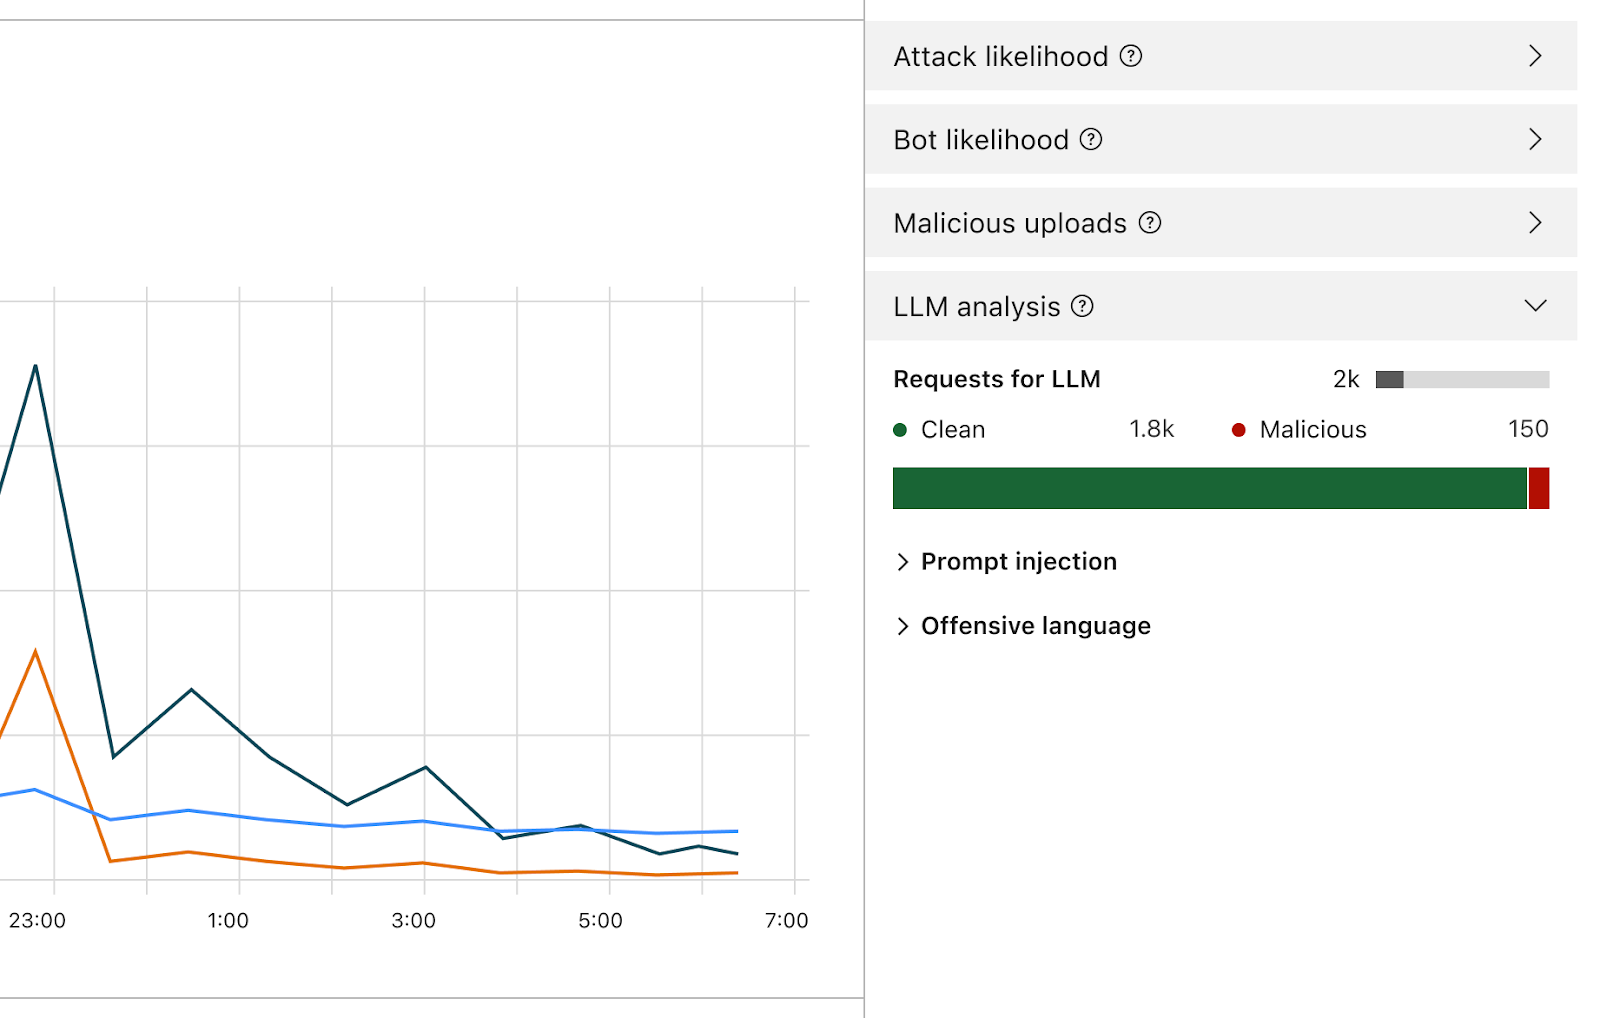
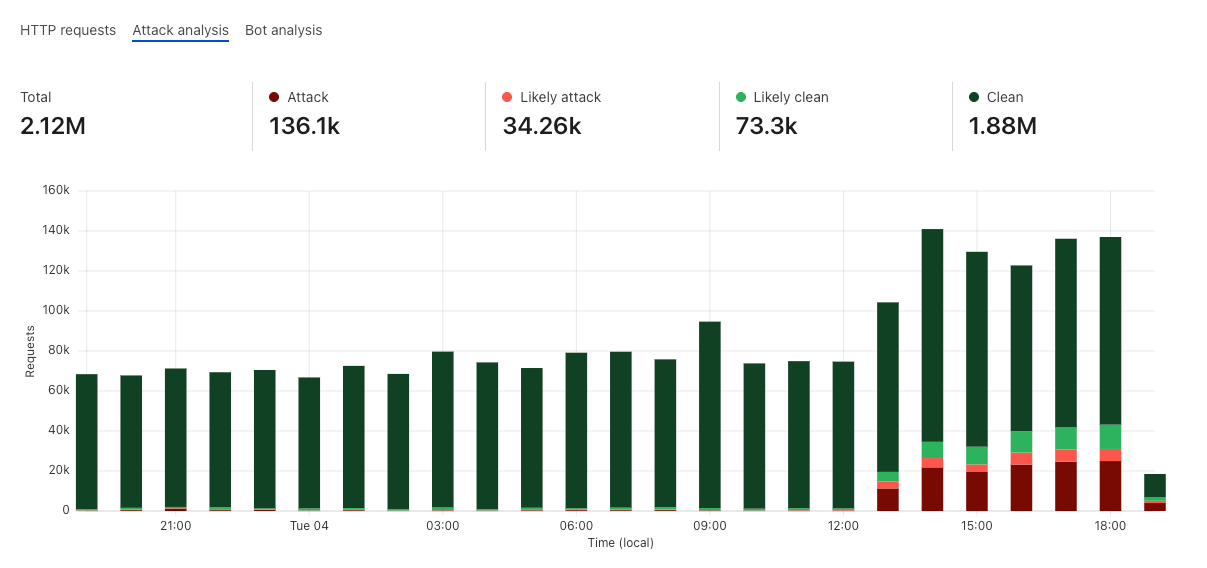
Once enabled, the new fields appear in Security Analytics and expanded logs. From there, you can filter by unsafe topics, track trends over time, and drill into the results of individual requests to see all detection outcomes, for example: did we detect unsafe topics, and what are the categories. The request body itself (the prompt text) is not stored or exposed; only the results of the analysis are logged.
After reviewing the analytics, you can enforce unsafe topic moderation by creating rules to log or block based on prompt categories in Custom rules.
For example, you might log prompts flagged as sexual content or hate speech for review.
You can use this expression: If (any(cf.llm.prompt.unsafe_topic_categories[*] in {"S10" "S12"})) then Log
Or deploy the rule with the categories field in the dashboard as in the below screenshot.
You can also take a broader approach by blocking all unsafe prompts outright: If (cf.llm.prompt.unsafe_topic_detected)then Block
These rules are applied automatically to all discovered HTTP requests containing prompts, ensuring guardrails are enforced consistently across your AI traffic.
What’s Next
In the coming weeks, Firewall for AI will expand to detect prompt injection and jailbreak attempts. We are also exploring how to add more visibility in the analytics and logs, so teams can better validate detection results. A major part of our roadmap is adding model response handling, giving you control over not only what goes into the LLM but also what comes out. Additional abuse controls, such as rate limiting on tokens and support for more safety categories, are also on the way.
Firewall for AI is available in beta today. If you’re new to Cloudflare and want to explore how to implement these AI protections, reach out for a consultation. If you’re already with Cloudflare, contact your account team to get access and start testing with real traffic.
Cloudflare is also opening up a user research program focused on AI security. If you are curious about previews of new functionality or want to help shape our roadmap, express your interest here.
On July 19, 2025,Microsoft disclosed CVE-2025-53770, a critical zero-day Remote Code Execution (RCE) vulnerability. Assigned a CVSS 3.1 base score of 9.8 (Critical), the vulnerability affects SharePoint Server 2016, 2019, and the Subscription Edition, along with unsupported 2010 and 2013 versions. Cloudflare’s WAF Managed Rules now includes 2 emergency releases that mitigate these vulnerabilities for WAF customers.
Unpacking CVE-2025-53770
The vulnerability’s root cause is improper deserialization of untrusted data, which allows a remote, unauthenticated attacker to execute arbitrary code over the network without any user interaction. Moreover, what makes CVE-2025-53770 uniquely threatening is its methodology – the exploit chain, labeled “ToolShell.” ToolShell is engineered to play the long-game: attackers are not only gaining temporary access, but also taking the server’s cryptographic machine keys, specifically the ValidationKey and DecryptionKey. Possessing these keys allows threat actors to independently forge authentication tokens and __VIEWSTATE payloads, granting them persistent access that can survive standard mitigation strategies such as a server reboot or removing web shells.
In response to the active nature of these attacks, the U.S. Cybersecurity and Infrastructure Security Agency (CISA) added CVE-2025-53770 to itsKnown Exploited Vulnerabilities (KEV) catalog with an emergency remediation deadline. The security community’s consensus is clear: any organization with an on-premise SharePoint server on the Internet should assume it has been compromised and take immediate action to fully address this vulnerability.
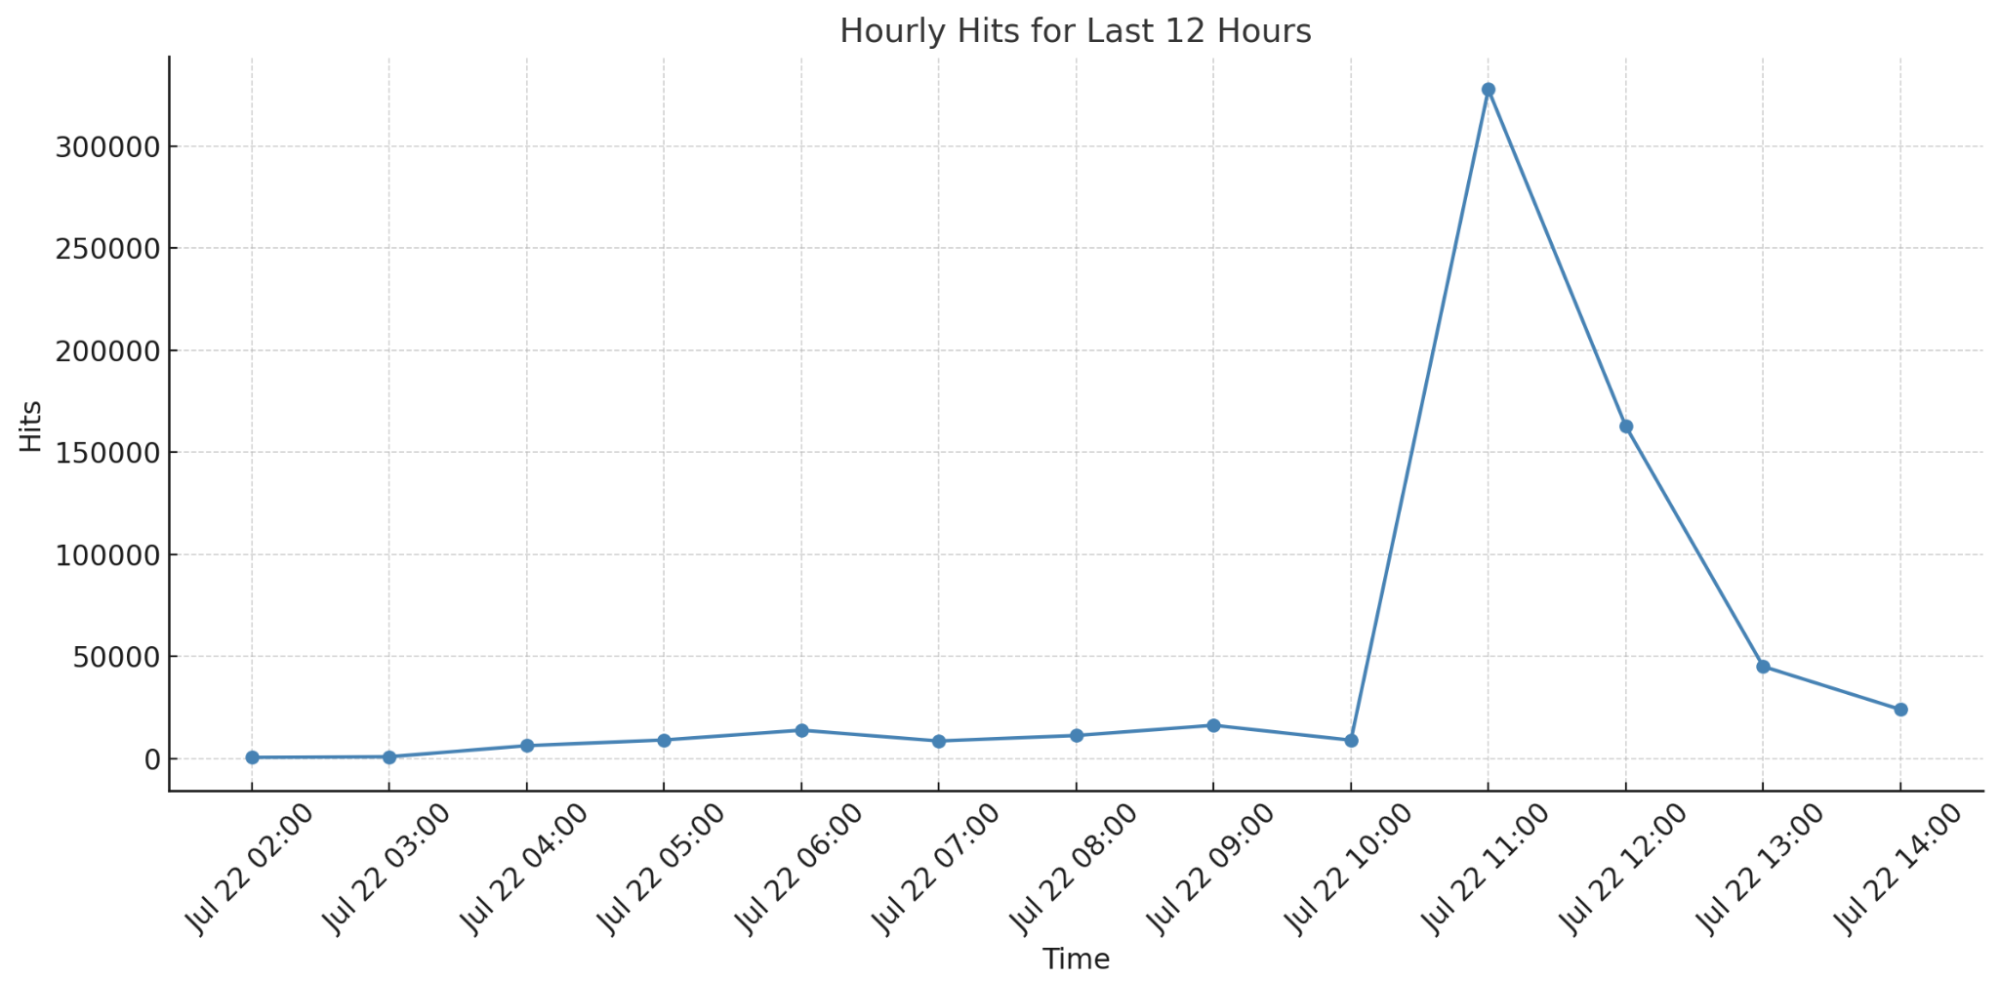
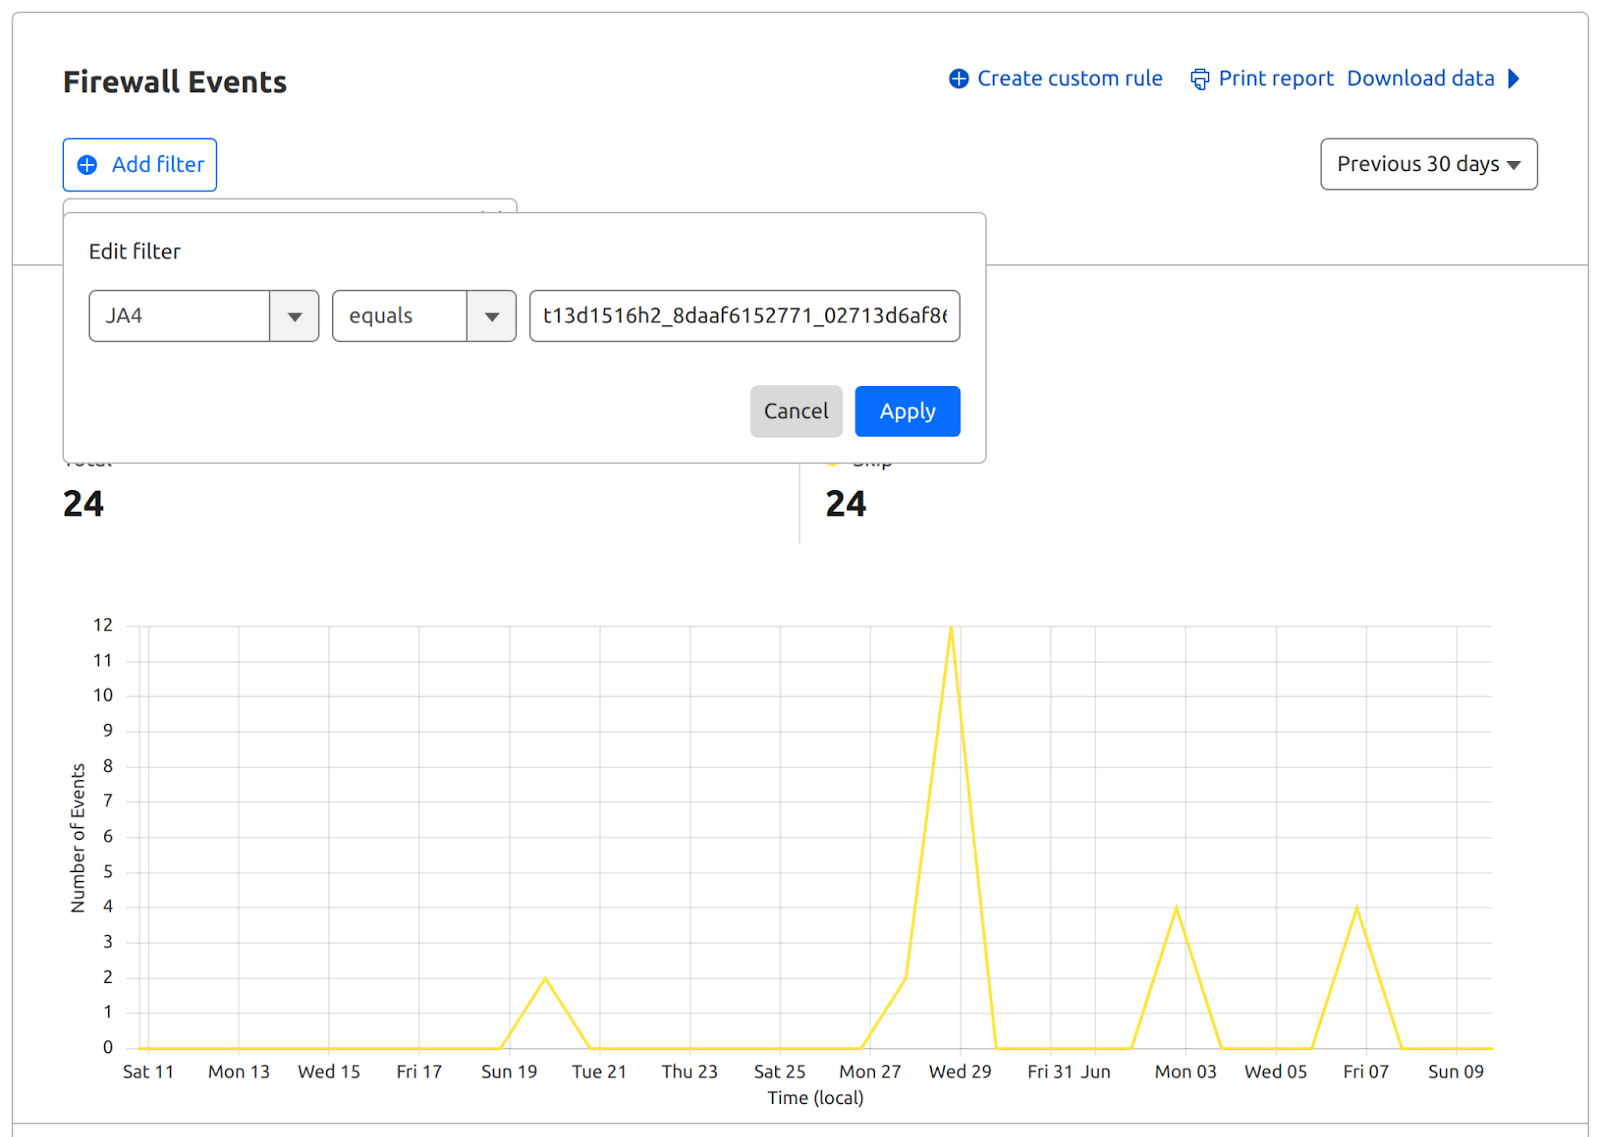
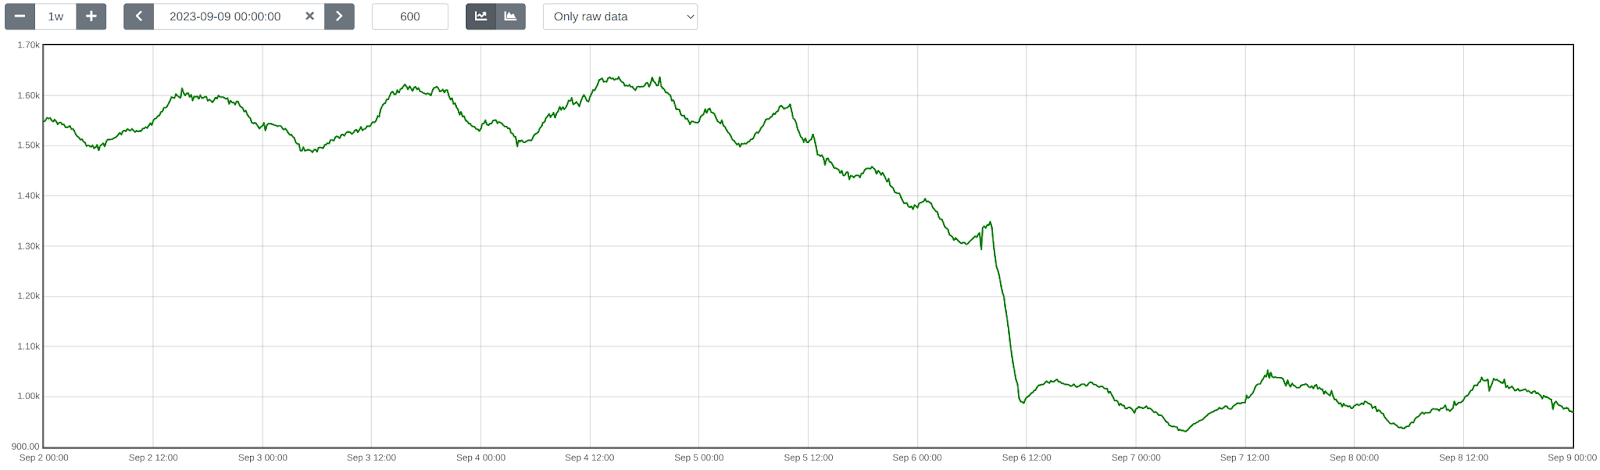
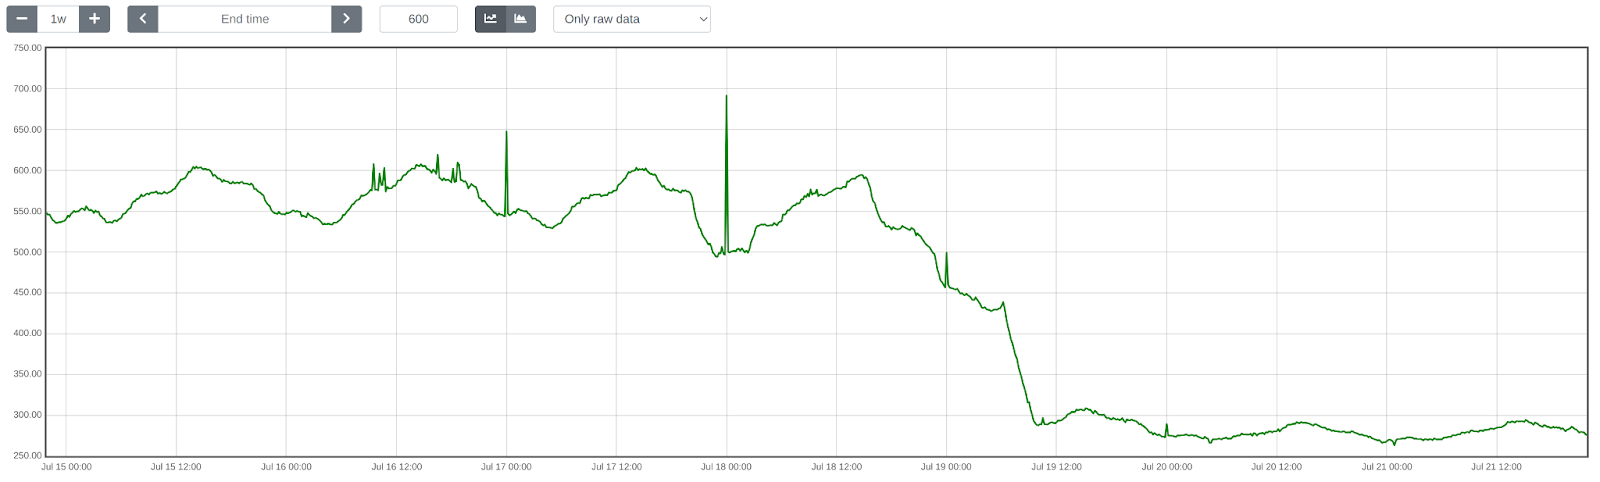
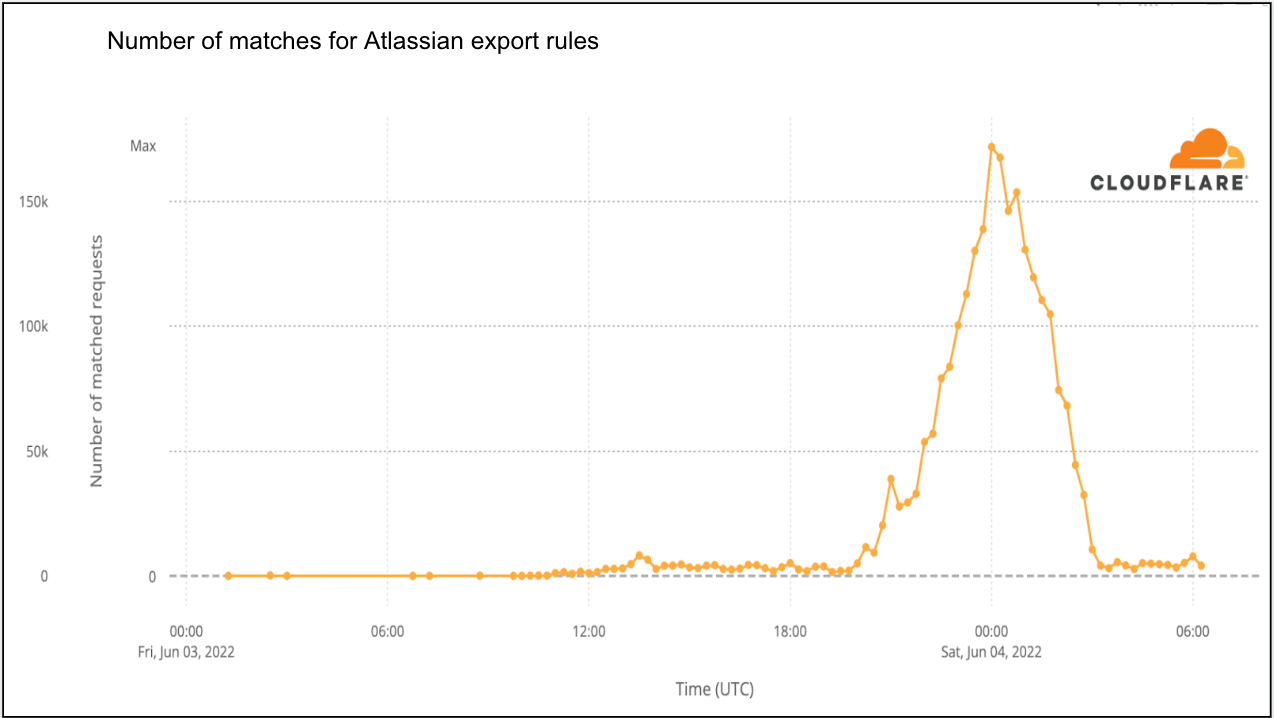
Since releasing our vulnerability patch in Cloudflare’s WAF Managed Ruleset, we’ve tracked the number of HTTP request matches for the vulnerability, which you can see in the graph below. Notably, we observed a significant peak around 11AM UTC, the morning of July 22, at around 300,000 hits at one point in time.
How does the ToolShell exploit chain work?
The ToolShell exploit chain was first demonstrated at the Pwn2Own hacking competition in May 2025, where researchers chained an authentication bypass (CVE-2025-49706) with a deserialization RCE (CVE-2025-49704). Unfortunately, this was not the end of ToolShell’s lifespan. Threat actors evidently analyzed the patches to find weaknesses and exploit them in the wild, forcing Microsoft to assign new identifiers and call out CVE-2025-53771 for the authentication bypass. This rapid exploit → patch → bypass cycle shows that threat actors are not merely discovering vulnerabilities, but also systematically reverse-engineering patches to weaponize bypasses. For responders, this closes the window – or hides it altogether – to respond and put up defenses, highlighting the need for evolving, proactive security postures.
The ToolShell exploit works in 3 stages:
Authentication Bypass, leveraging CVE-2025-53771: The attack begins with a POST request sent to the /_layouts/15/ToolPane.aspx endpoint, a legacy component of SharePoint. The crutch of this authentication bypass happens by setting the Referer header to /_layouts/SignOut.aspx, which tricks the SharePoint server into trusting the attacker. With trust in hand, the attacker is able to skip authentication checks and move forward with authenticated access.
Remote Code Execution via Deserialization, CVE-2025-53770: With privileged access, the attacker can interact with the ToolPane.aspx endpoint. The attacker submits a malicious payload in the body of the POST request, triggering the core vulnerability: a deserialization flaw in which the SharePoint application deserializes the object into executable code on the server. At this point, the attacker can execute commands as they wish.
The Long-Game: Possessing Cryptographic Keys: Finally, to play the long-game and maintain continued access, the attacker will use a specific web shell to steal the server’s cryptographic machine keys. By taking the ValidationKey and the DecryptionKey, the attacker obtains the state information used by SharePoint. Possessing these keys allows the attacker to operate independently, long after the original exploit; this means they can continue to execute new malicious payloads on the exploited server. This permanent backdoor makes this attack method uniquely dangerous.
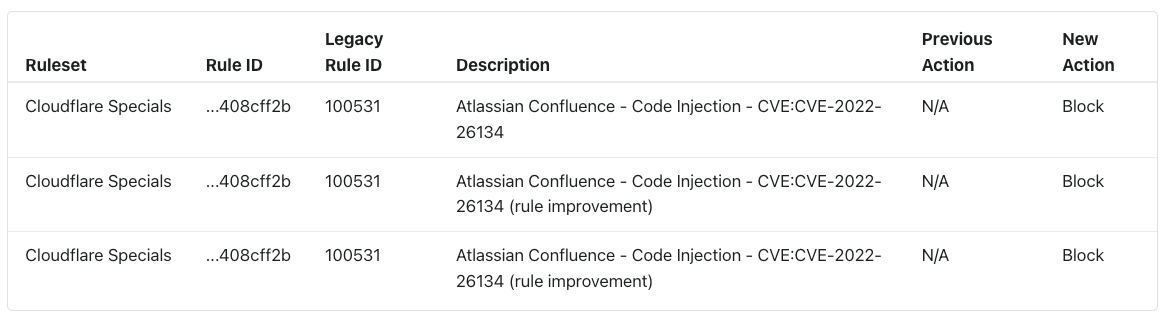
Cloudflare’s new WAF Managed Rules for CVE-2025-53770, CVE-2025-53771
CVE-2025-53770 is a clear example of how modern cyber threats are two-sided, combining an initial breach vector with a mechanism for long-term persistence. This means that a successful defense will address both the immediate RCE vulnerability and the subsequent threat of unwelcome access.
Once a public proof-of-concept became available for this exploit, Cloudflare’s security analysts crafted and tested new patches, ensuring that they would address not only the initial attack, but also the longer-term threat.
The team began researching the exploit the evening of July 20, and on July 21, 2025, Cloudflare deployed our emergency WAF Managed Rules to patch the vulnerability, meaning every customer using the Cloudflare Managed Ruleset will automatically be protected from this critical SharePoint vulnerability. These rules have been announced on the WAF changelog and will take effect immediately.
Forrester Research has recognized Cloudflare as a Leader in it’s The Forrester Wave™: Web Application Firewall Solutions, Q1 2025 report. This market analysis helps security and risk professionals select the right solution for their needs. According to Forrester:
“Cloudflare is a strong option for customers that want to manage an easy-to-use, unified web application protection platform that will continue to innovate.”
In this evaluation, Forrester assessed 10 Web Application Firewall (WAF) vendors across 22 criteria, including product security and vision. We believe this recognition is due to our continued investment in our product offering. Get a complimentary copy of the report here.
Since introducing our first WAF in 2013, Cloudflare has transformed it into a robust, enterprise-grade Application Security platform. Our fully integrated suite includes WAF, bot mitigation, API security, client-side protection, and DDoS mitigation, all built on our expansive global network. By leveraging AI and machine learning, we deliver industry-leading security while enhancing application performance through our content delivery and optimization solutions.
According to the Forrester report, “Cloudflare stands out with features that help customers work more efficiently.” Unlike other solutions in the market, Cloudflare’s WAF, API Security, bot detection, client-side security, and DDoS protection are natively integrated within a single platform, running on a unified engine. Our integrated solution empowers a seamless user experience and enables advanced threat detection across multiple vectors to meet the most demanding security requirements.
Cloudflare: a standout in Application Security
Forrester’s evaluation of Web Application Firewall solutions is one of the most comprehensive assessments in the industry. We believe this report highlights Cloudflare’s integrated global cloud platform and our ability to deliver enterprise-grade security without added complexity. We don’t just offer a WAF — we provide a flexible, customizable security toolkit designed to address your unique application security challenges.
Cloudflare continuously leads the WAF market through our strategic vision and the breadth of our capabilities. We center our approach on relentless innovation, delivering industry-leading security features, and ensuring a seamless management experience with enterprise processes and tools such as Infrastructure as Code (IaC) and DevOps. Our predictable cadence of major feature releases, powered by annual initiatives like Security Week and Birthday Week, ensures that customers always have access to the latest security advancements.
We believe Forrester also highlighted Cloudflare’s extensive security capabilities, with particular recognition of the significant improvements in our API security offerings.
Cloudflare’s top-ranked criteria
In the report, Cloudflare received the highest possible scores in 15 out of 22 criteria, reinforcing, in our opinion, our commitment to delivering the most advanced, flexible and easy-to-use web application protection in the industry. Some of the key criteria include:
Detection models: Advanced AI and machine learning models that continuously evolve to detect new threats.
Layer 7 DDoS protection: Industry-leading mitigation of sophisticated application-layer attacks.
Rule creation and modification: Simple, easy to use rule creation experience, propagating within seconds globally.
Management UI: An intuitive and efficient user interface that simplifies security management.
Product security: A robust architecture that ensures enterprise-grade security.
Infrastructure-as-code support: Seamless integration with DevOps workflows for automated security policy enforcement.
Innovation: A forward-thinking approach to security, consistently pushing the boundaries of what’s possible.
What sets Cloudflare apart?
First, Cloudflare’s WAF goes beyond traditional rule-based protections, offering a comprehensive suite of detection mechanisms to identify attacks and vulnerabilities across web and API traffic while also safeguarding client environments. We leverage AI and machine learning to detect threats such as attacks, automated traffic, anomalies, and compromised JavaScript, among others. Our industry-leading application-layer DDoS protection makes volumetric attacks a thing of the past.
Second, Cloudflare has also made significant strides in API security. Our WAF can be supercharged with features such as: API discovery, schema validation & sequence mitigation, volumetric detection, and JWT authentication.
Third, Cloudflare simplifies security management with an intuitive dashboard that is easy to use while still offering powerful configurations for advanced practitioners. All features are Terraform-supported, allowing teams to manage the entire Cloudflare platform as code. With Security Analytics, customers gain a comprehensive view of all traffic, whether mitigated or not, and can run what-if scenarios to test new rules before deployment. This analytic capability ensures that businesses can dynamically adapt their security posture while maintaining high performance. To make security management even more seamless, our AI agent, powered by Natural Language Processing (NLP), helps users craft and refine custom rules and create powerful visualizations within our analytics engine.
Cloudflare: the clear choice for modern security
We are confident that Forrester’s report validates what our customers already know: Cloudflare is a leading WAF vendor, offering unmatched security, innovation, and ease of use. As threats continue to evolve, we remain committed to pushing the boundaries of web security to protect organizations worldwide.
If you’re looking for a powerful, scalable, and easy-to-manage web application firewall, Cloudflare is the best choice for securing your applications, APIs, and infrastructure.
Ready to enhance your security?
Learn more about Cloudflare WAF by creating an account today and see why Forrester has recognized us as a leader in the market.
Forrester does not endorse any company, product, brand, or service included in its research publications and does not advise any person to select the products or services of any company or brand based on the ratings included in such publications. Information is based on the best available resources. Opinions reflect judgment at the time and are subject to change. For more information, read about Forrester’s objectivity here .
Over the years, we have framed our Application Security features against market-defined product groupings such as Web Application Firewall (WAF), DDoS Mitigation, Bot Management, API Security (API Shield), Client Side Security (Page Shield), and so forth. This has led to unnecessary artificial separation of what is, under the hood, a well-integrated single platform.
This separation, which has sometimes guided implementation decisions that have led to different systems being built for the same purpose, makes it harder for our users to adopt our features and implement a simple effective security posture for their environment.
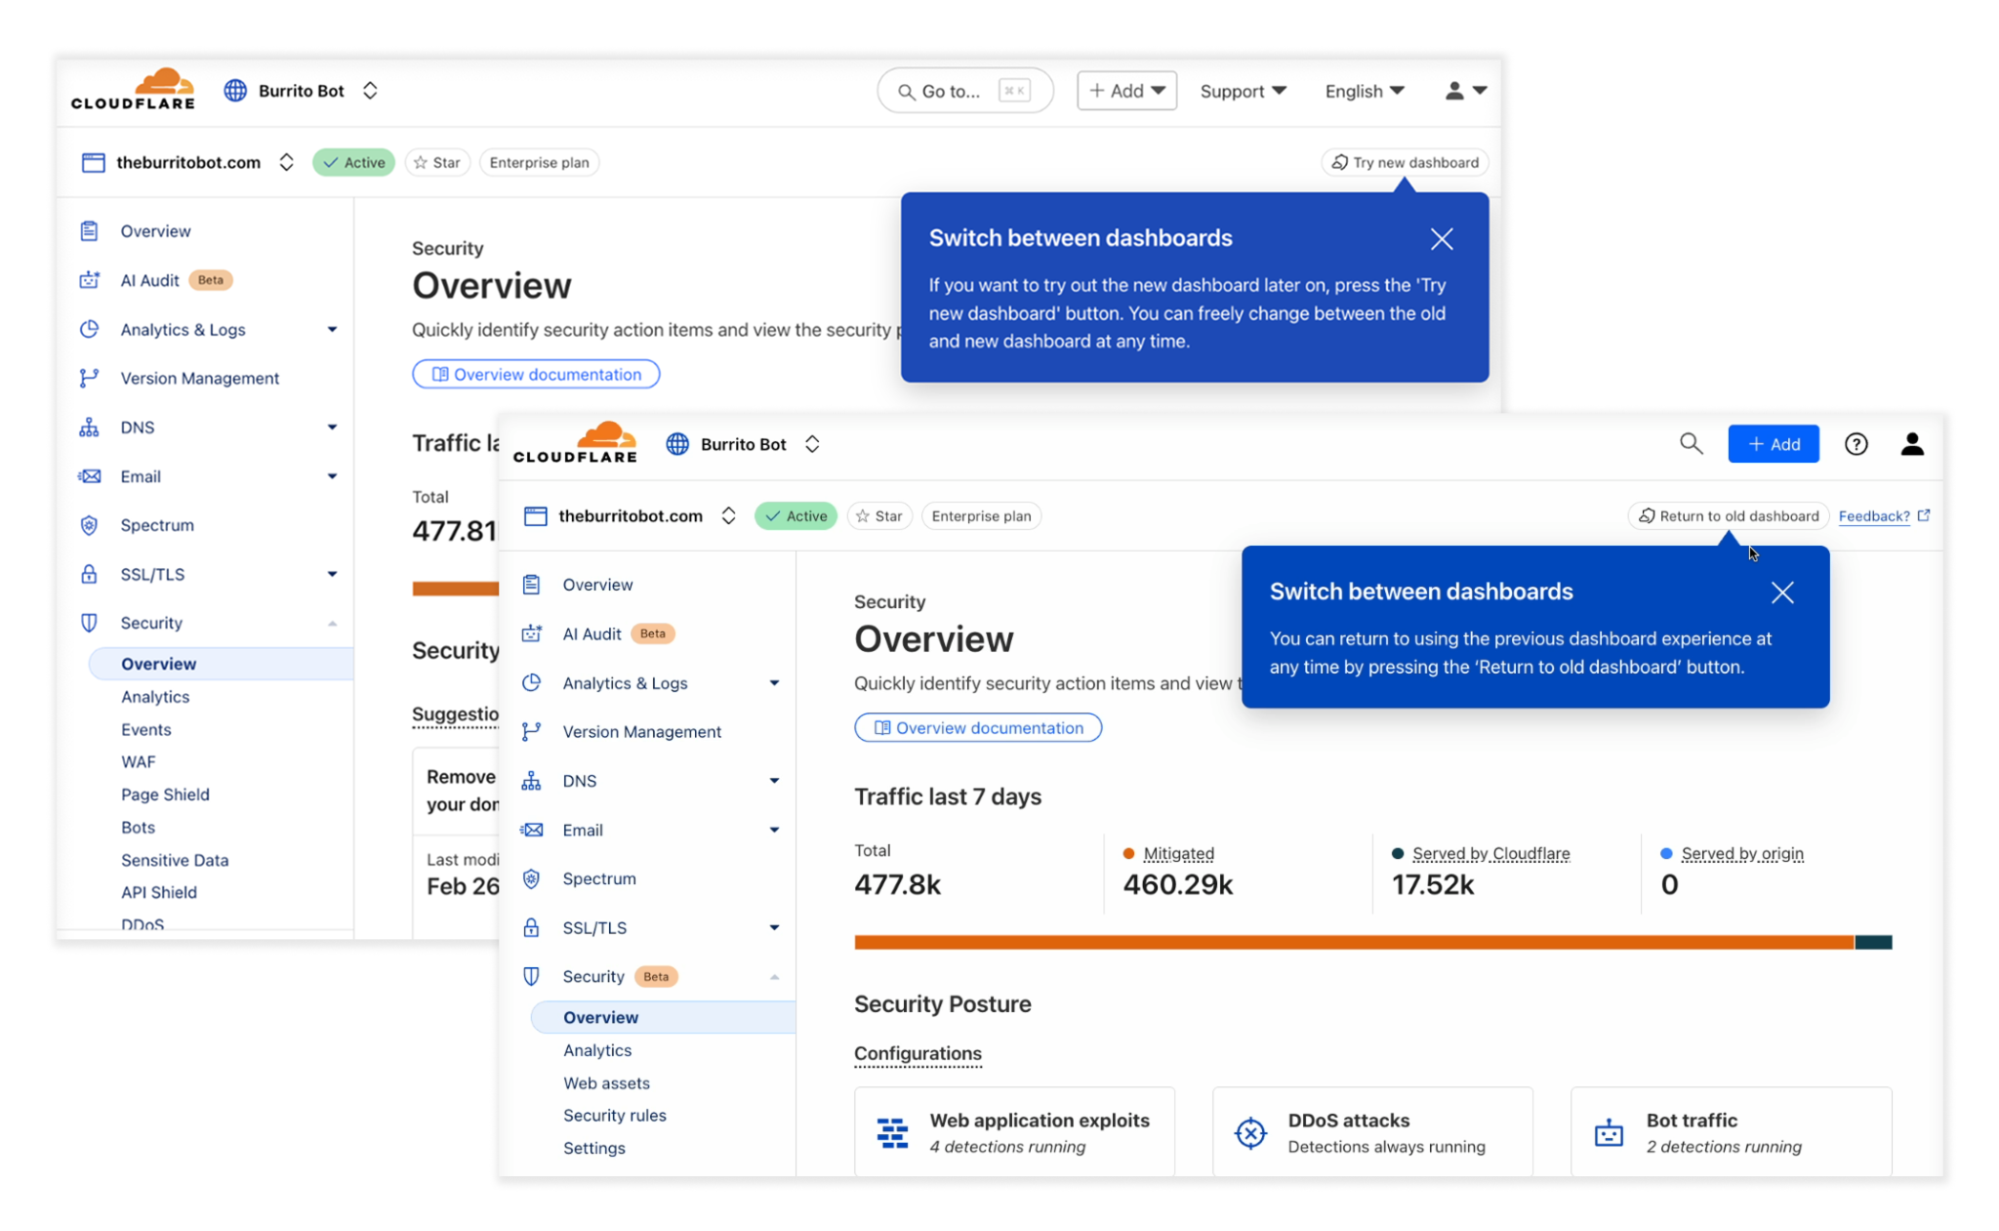
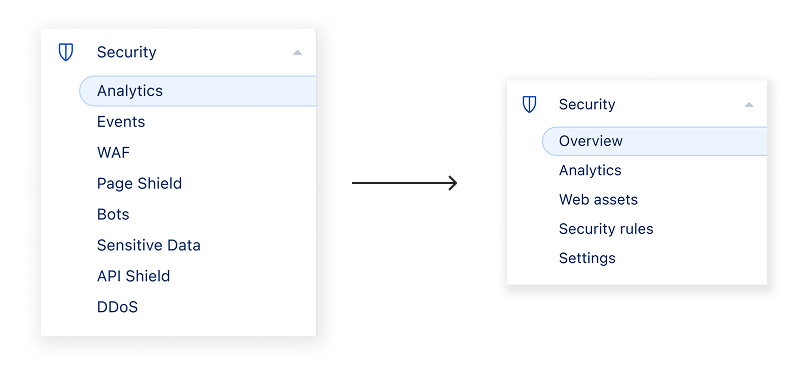
Today, following user feedback and our drive to constantly innovate and simplify, we are going back to our roots by breaking these artificial product boundaries and revising our dashboard, so it highlights our strengths. The ultimate goal remains: to make it shockingly easy to secure your web assets.
Introducing a new unified Application Security experience.
If you are a Cloudflare Application Security user, log in to the dashboard today and try out the updated dashboard interface. To make the transition easier, you can toggle between old and new interfaces.
Security, simplified
Modern applications are built using a variety of technologies. Your app might include a web interface and a mobile version, both powered by an API, each with its own unique security requirements. As these technologies increasingly overlap, traditional security categories like Web, API, client-side, and bot protection start to feel artificial and disconnected when applied to real-world application security.
Consider scenarios where you want to secure your API endpoints with proper authentication, or prevent vulnerability scanners from probing for weaknesses. These tasks often require switching between multiple dashboards, creating different policies, and managing disjointed configurations. This fragmented approach not only complicates workflows but also increases the risk of overlooking a critical vulnerability. The result? A security posture that is harder to manage and potentially less effective.
When you zoom out, a pattern emerges. Whether it’s managing bots, securing APIs, or filtering web traffic, these solutions ultimately analyze incoming traffic looking for specific patterns, and the resulting signal is used to perform actions. The primary difference between these tools is the type of signal they generate, such as identifying bots, enforcing authorization, or flagging suspicious requests.
At Cloudflare, we saw an opportunity to address this complexity by unifying our application security tools into a single platform with one cohesive UI. A unified approach means security practitioners no longer have to navigate multiple interfaces or piece together different security controls. With a single UI, you can configure policies more efficiently, detect threats faster, and maintain consistent protection across all aspects of your application. This simplicity doesn’t just save time, it ensures that your applications remain secure, even as threats evolve.
At the end of the day, attackers won’t care which product you’re using. But by unifying application security, we ensure they’ll have a much harder time finding a way in.
Many products, one common approach
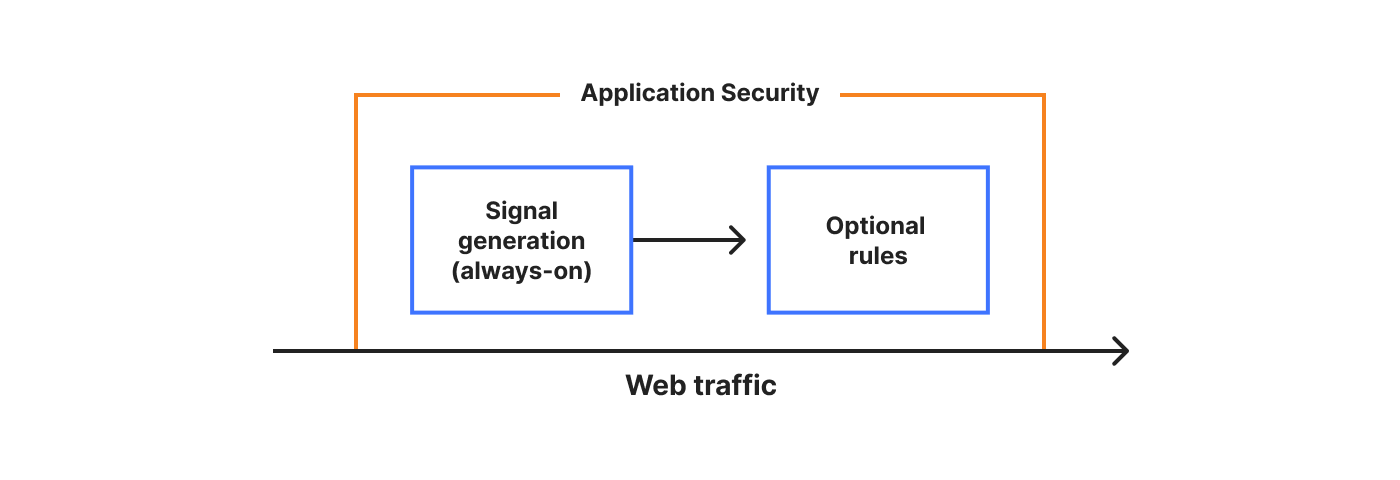
To redefine the experience across Application Security products, we can start by defining three concepts that commonly apply:
Web traffic (HTTP/S), which can be generalised even further as “data”
Signals and detections, which provide intelligence about the traffic. Can be generalised as “metadata”
Security rules that let you combine any signal or detection (metadata), to block, challenge or otherwise perform an action on the web traffic (data)
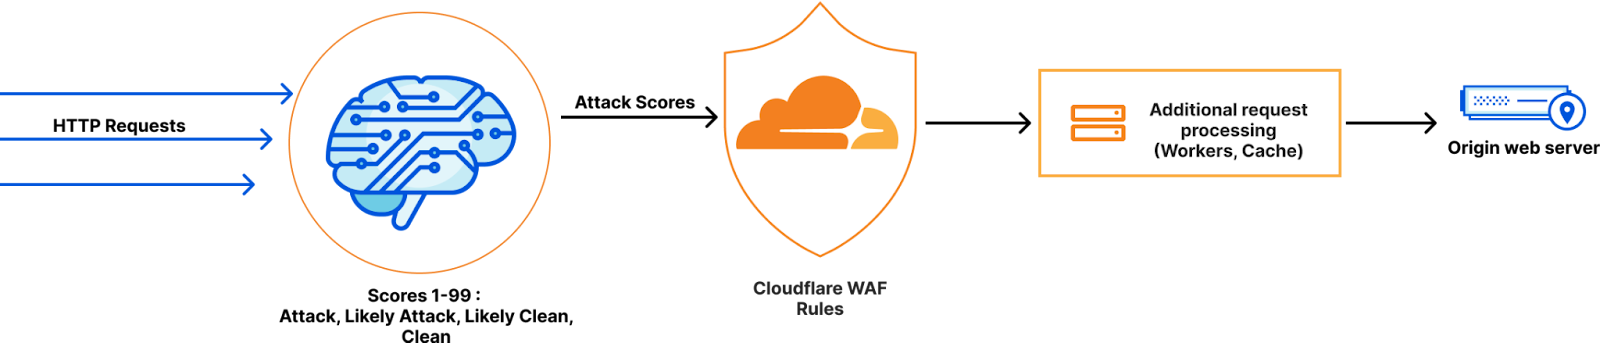
We can diagram the above as follows:
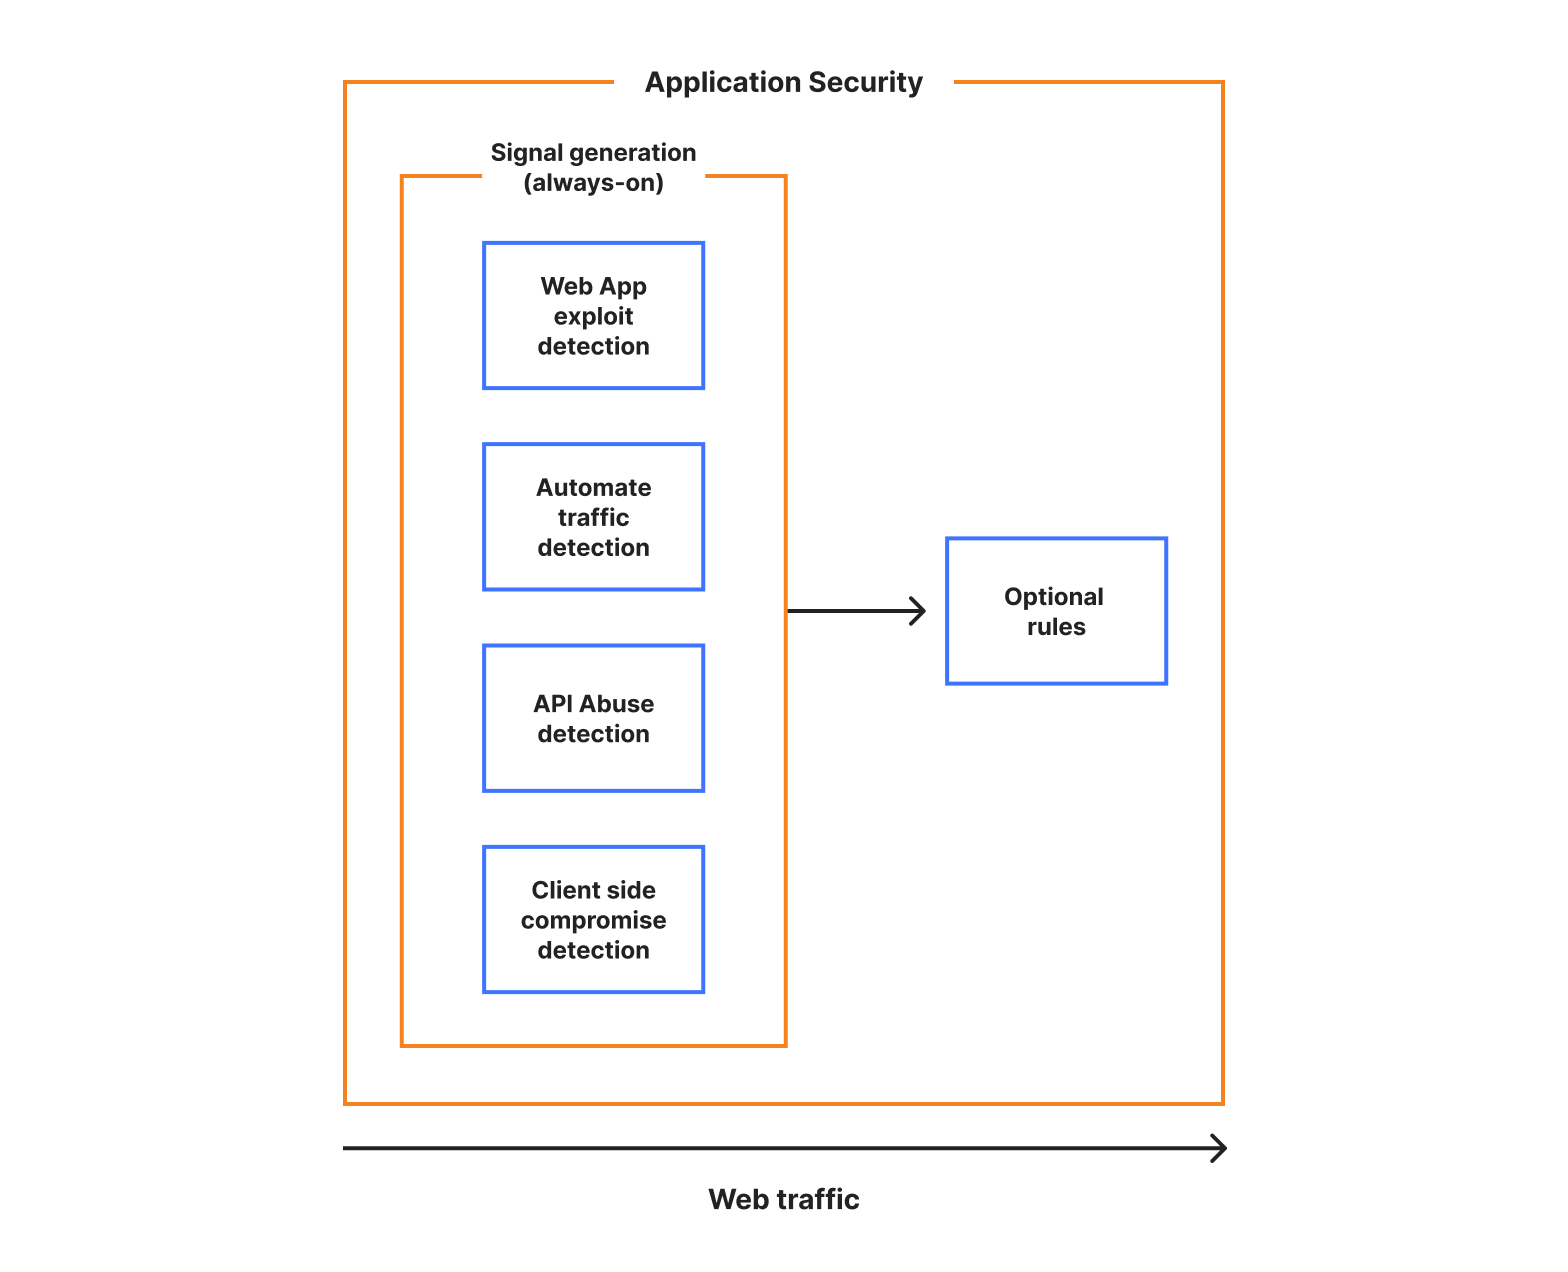
Using these concepts, all the product groupings that we offer can be converted to different types of signals or detections. All else remains the same. And if we are able to run and generate our signals on all traffic separately from the rule system, therefore generating all the metadata, we get what we call always-on detections, another vital benefit of a single platform approach. Also note that the order in which we generate the signals becomes irrelevant.
In diagram form:
The benefits are twofold. First, problem spaces (such as account takeover or web attacks) become signal groupings, and therefore metadata that can be queried to answer questions about your environment.
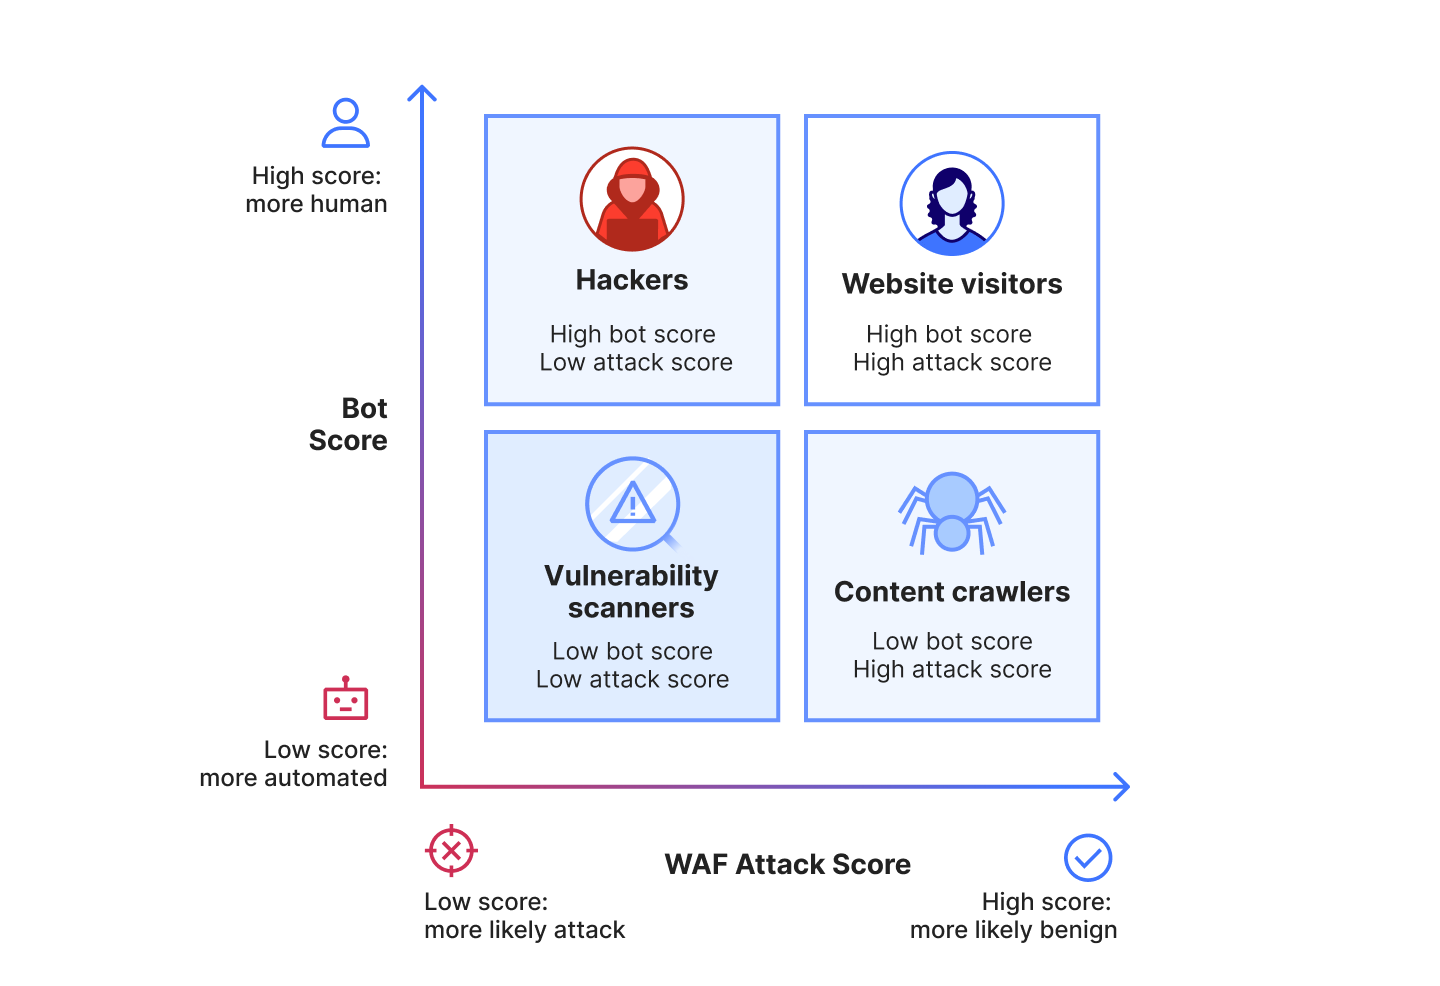
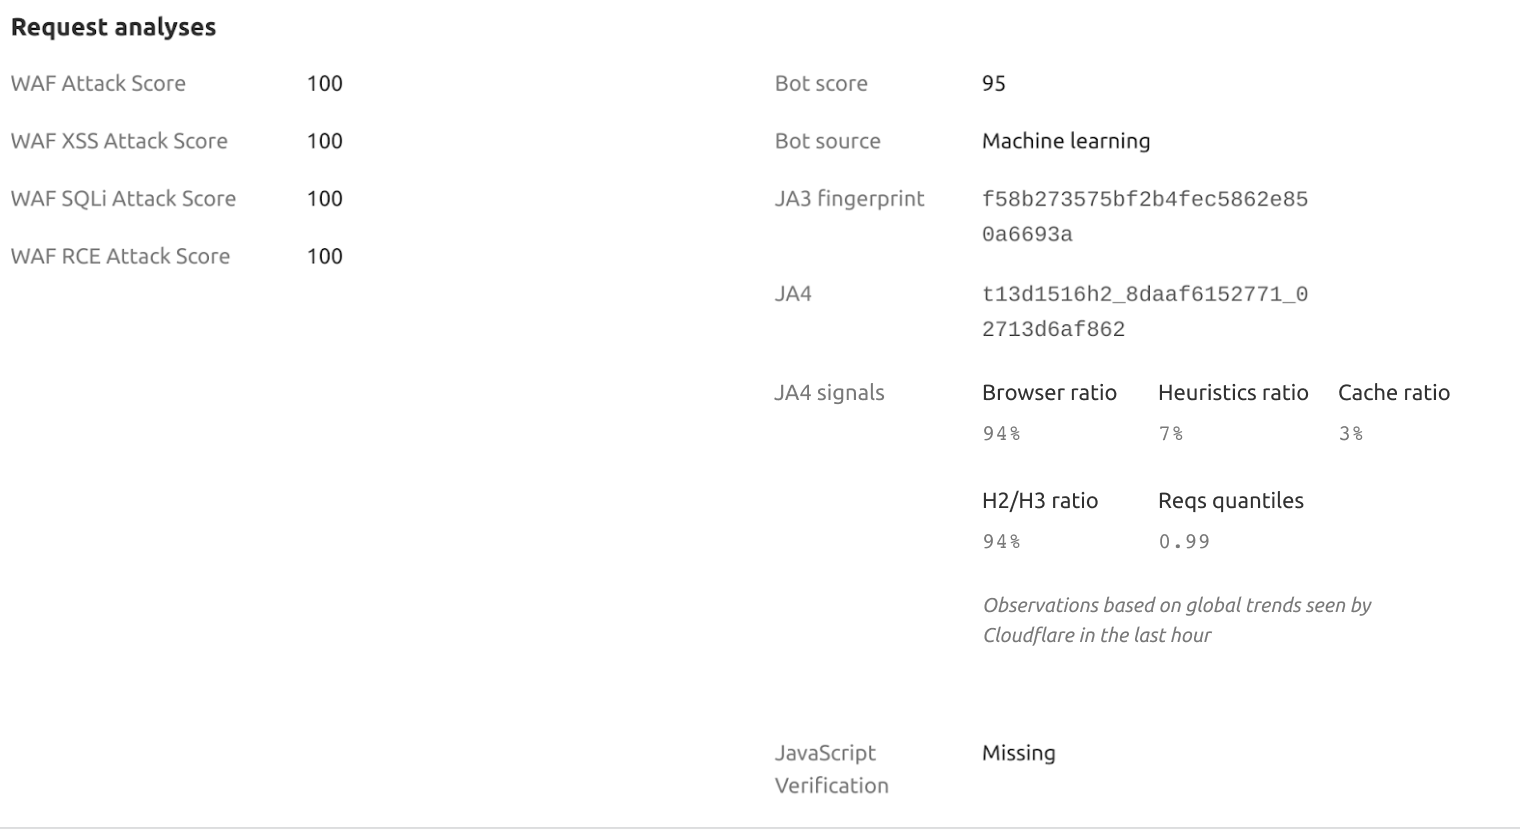
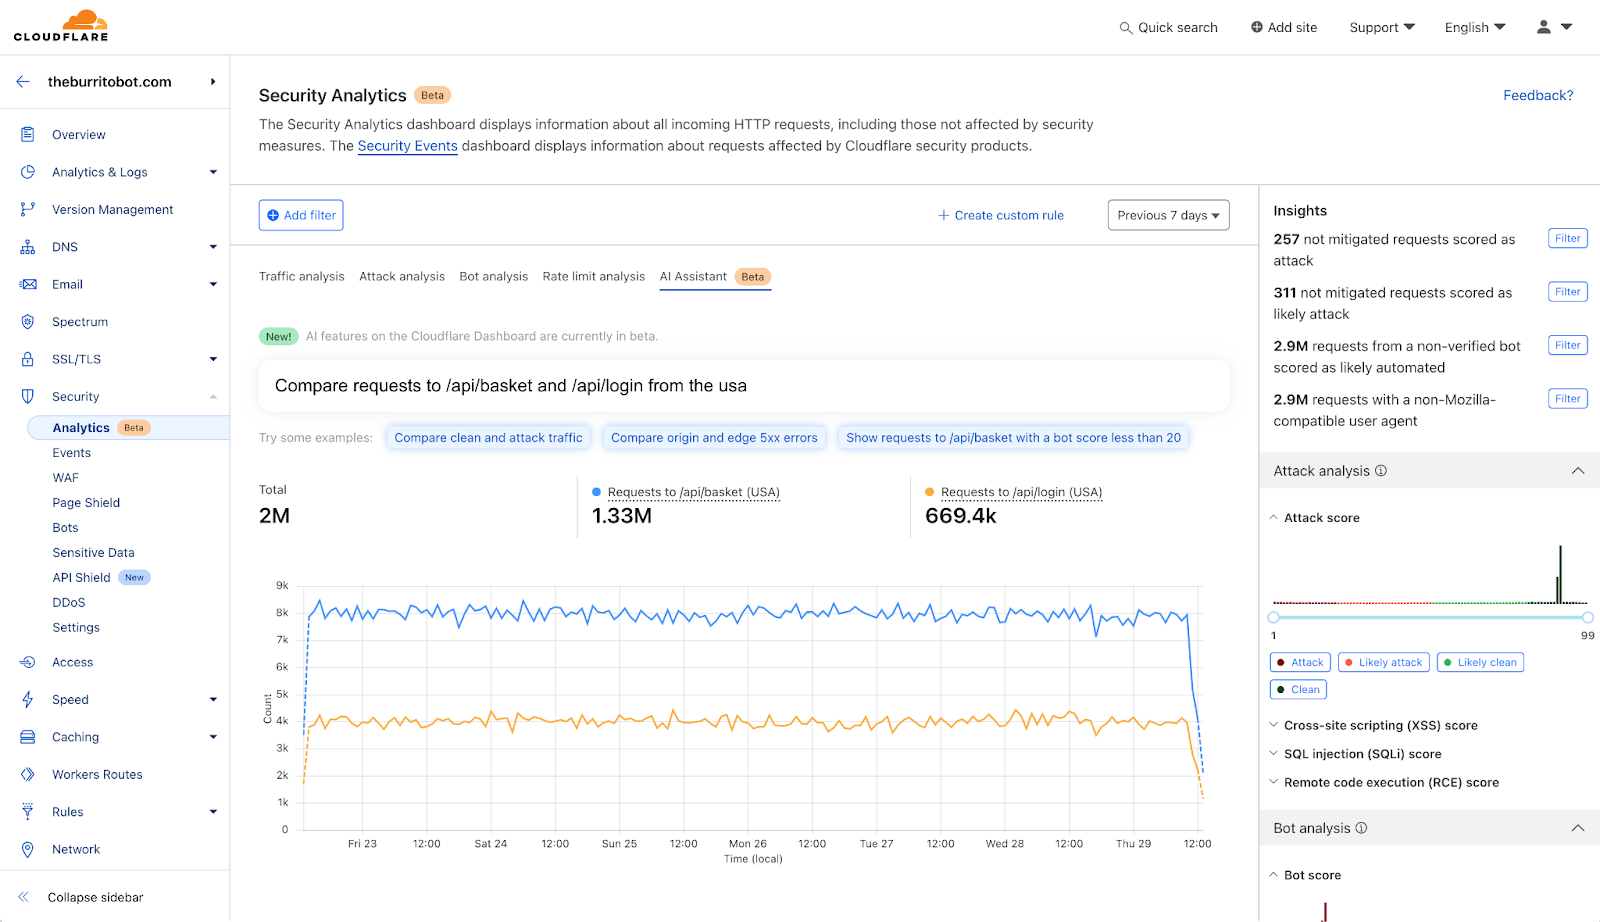
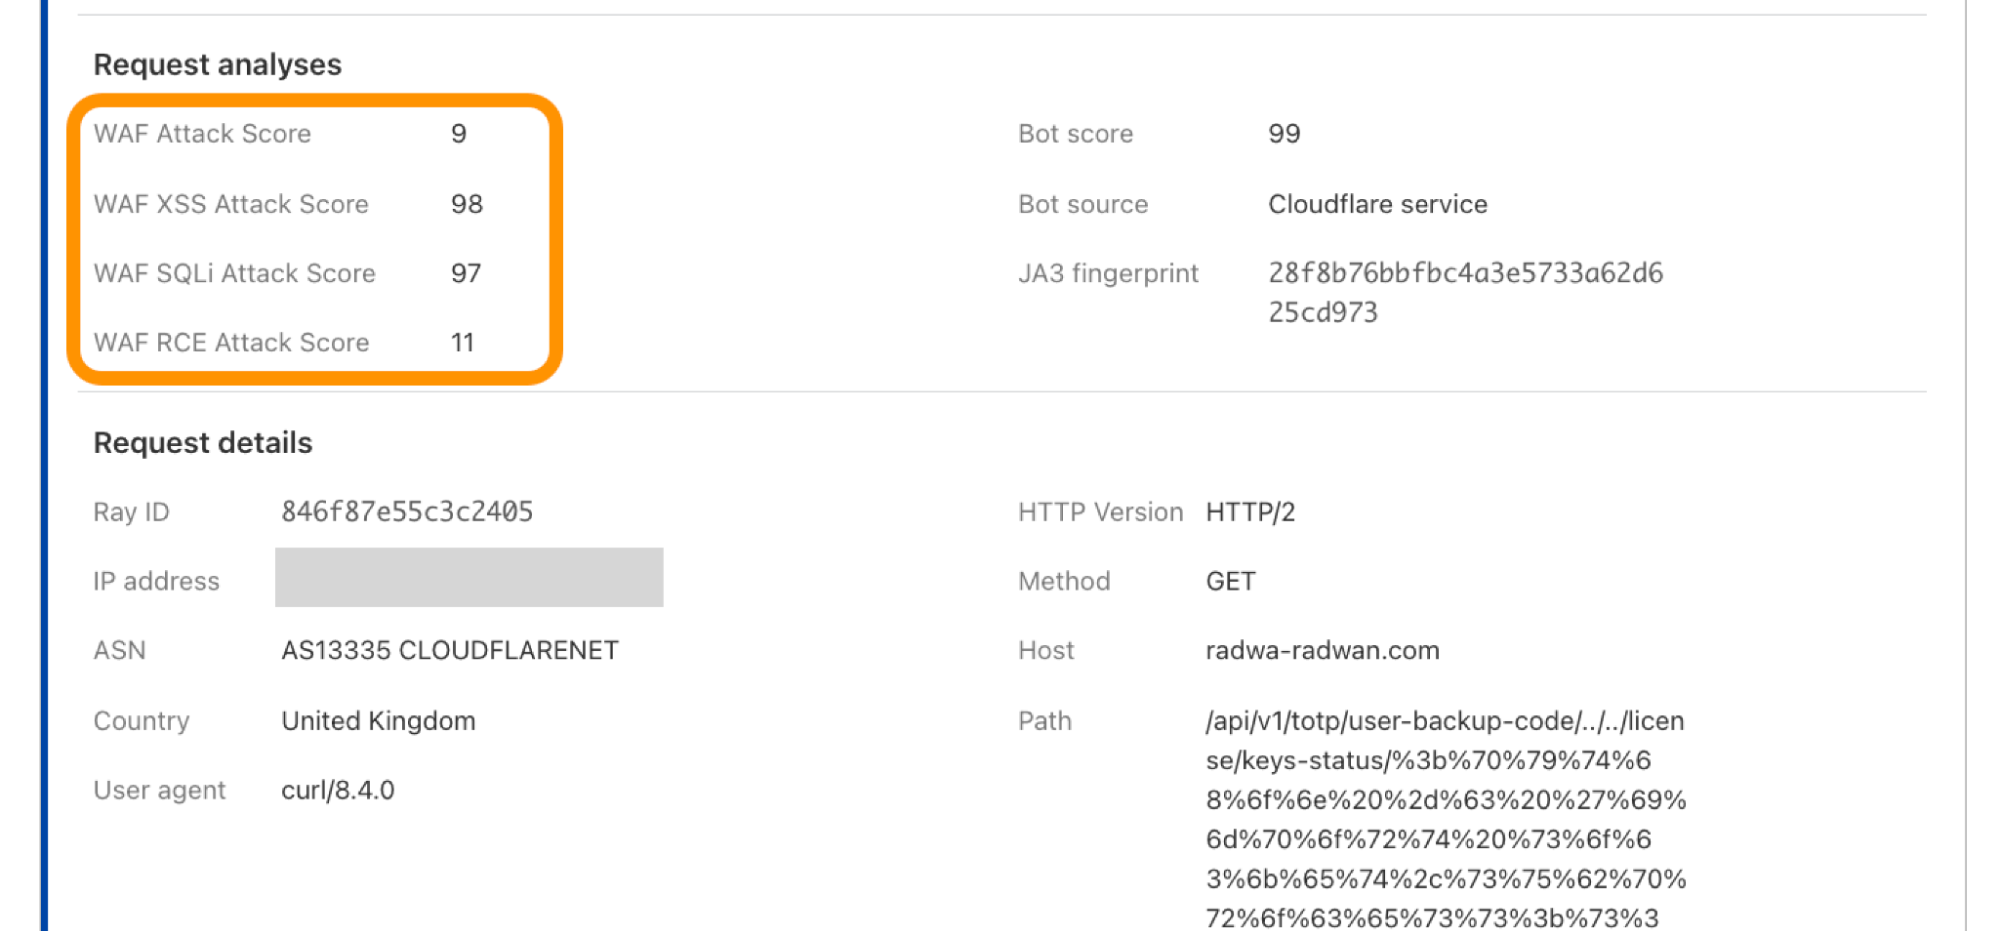
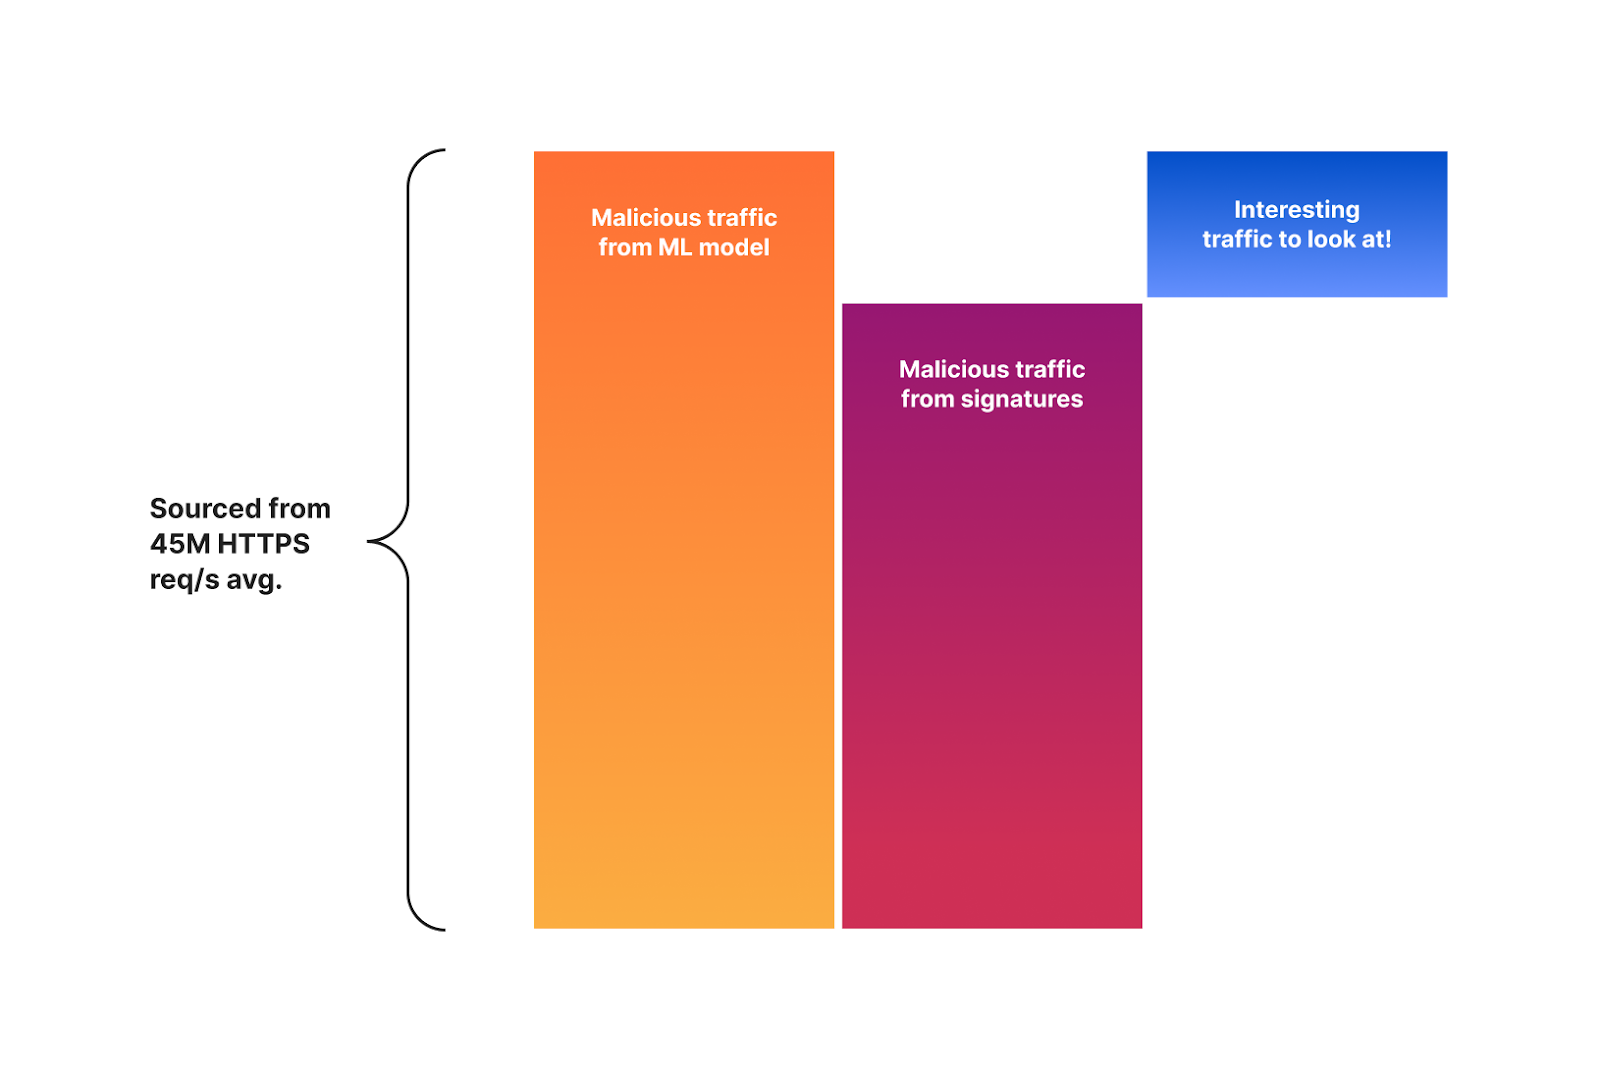
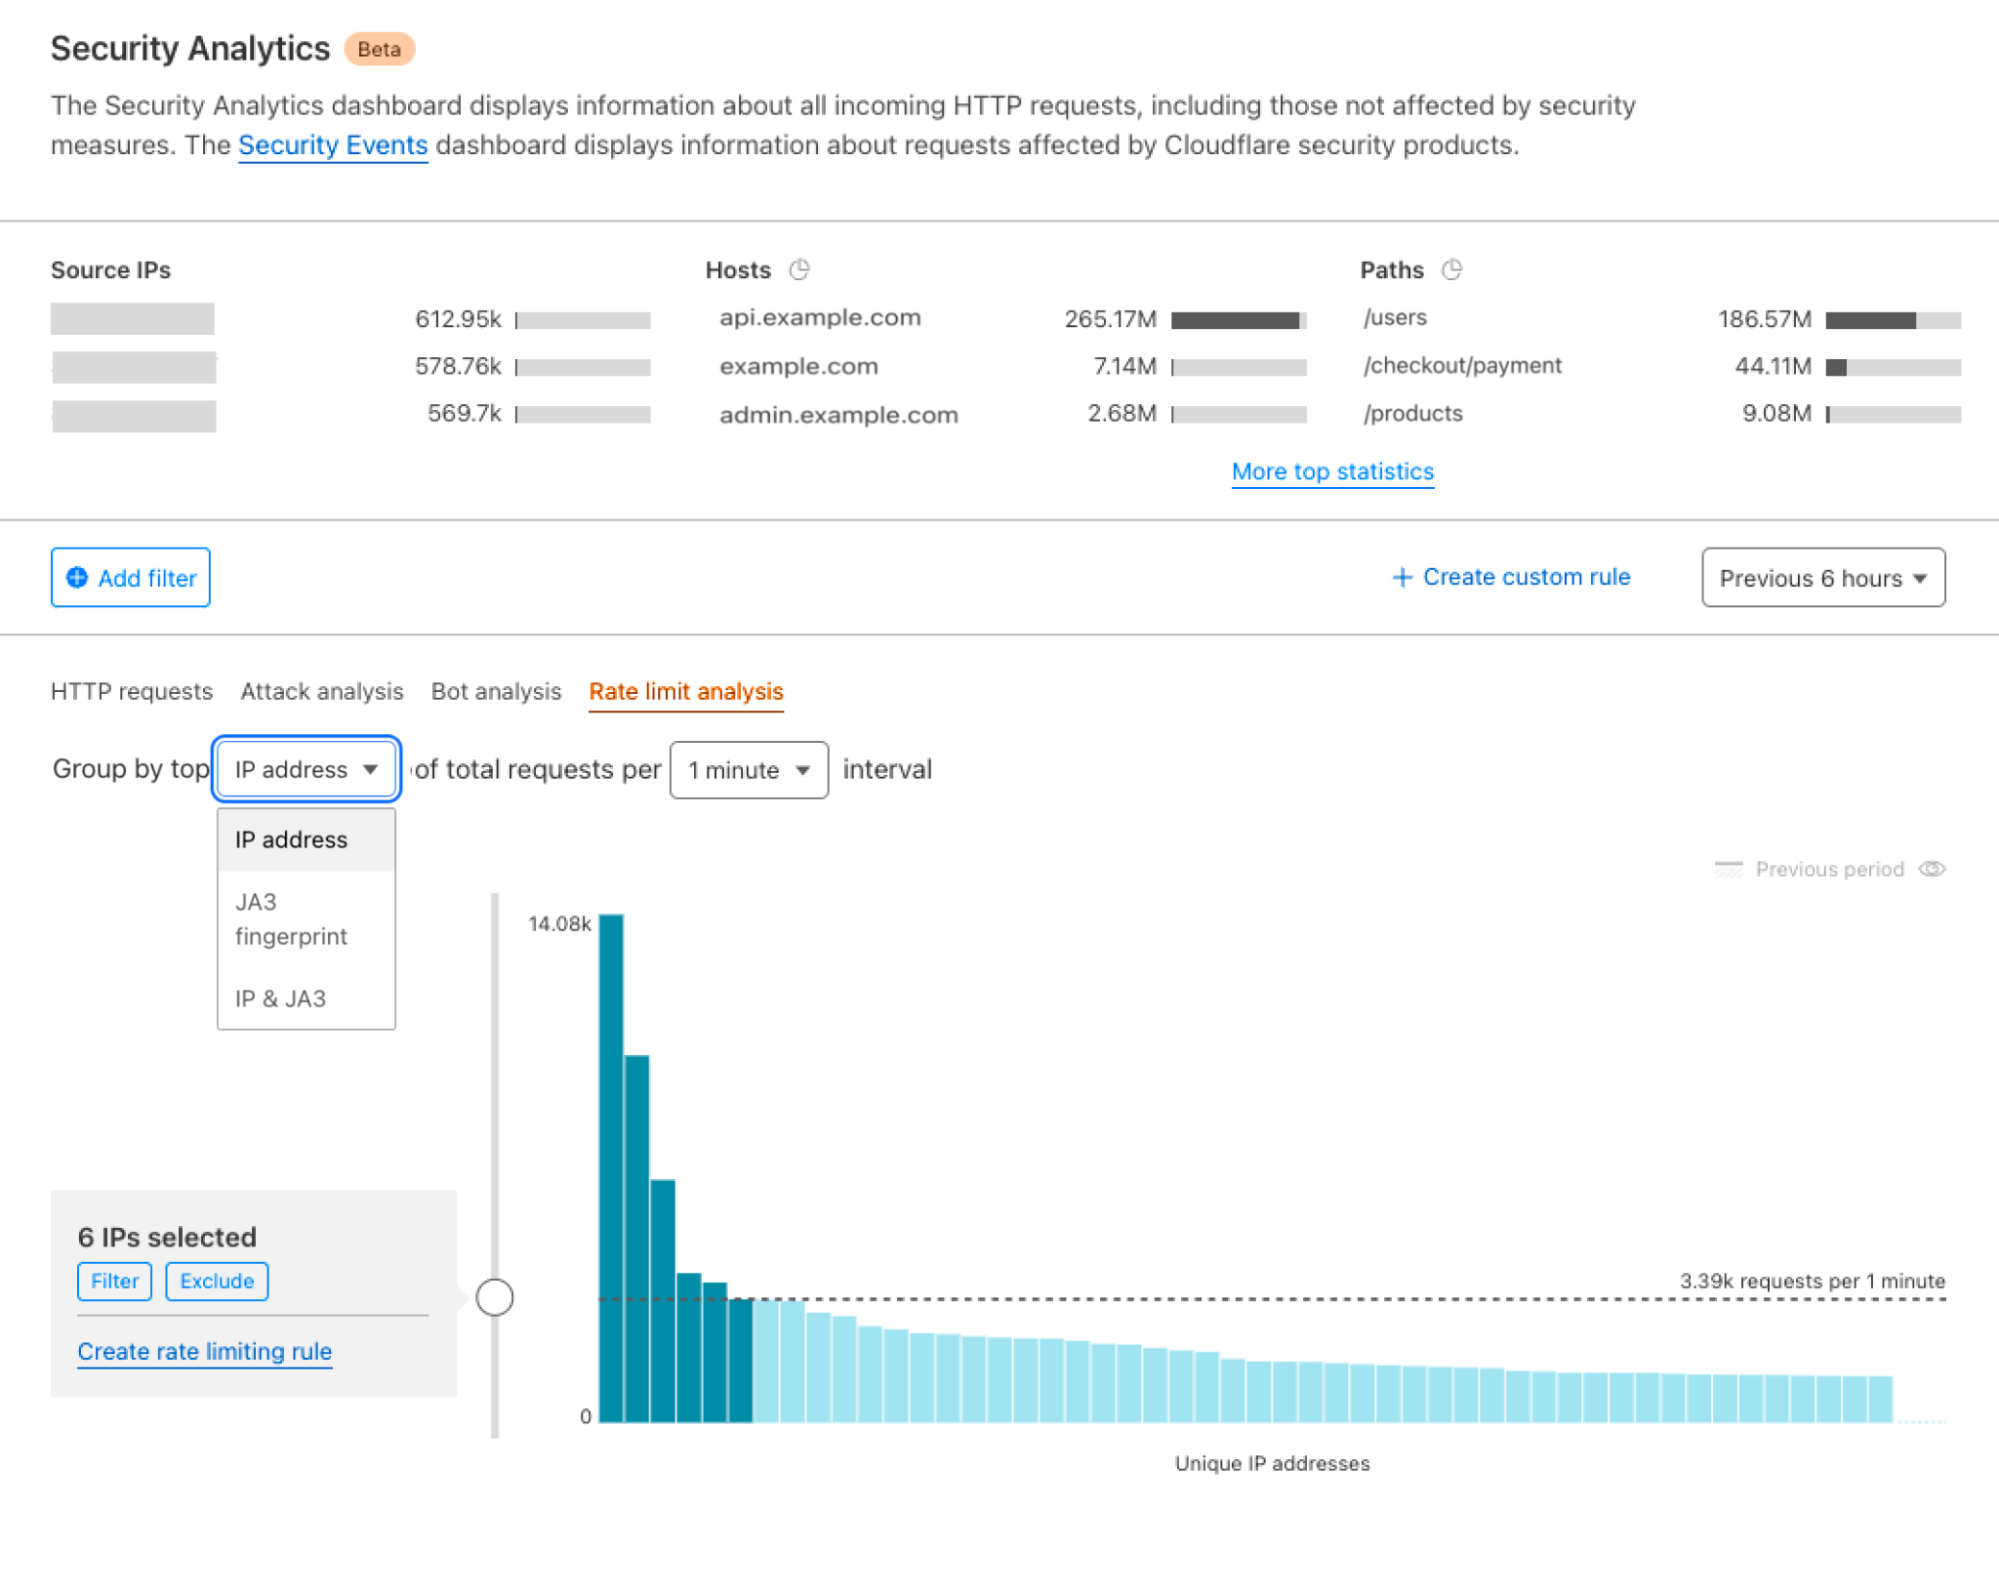
For example, let’s take our Bot Management signal, the bot score, and our WAF Attack Score signal, the attack score. These already run as always-on detections at Cloudflare. By combining these two signals and filtering your traffic against them, you can gain powerful insights on who is accessing your application*:
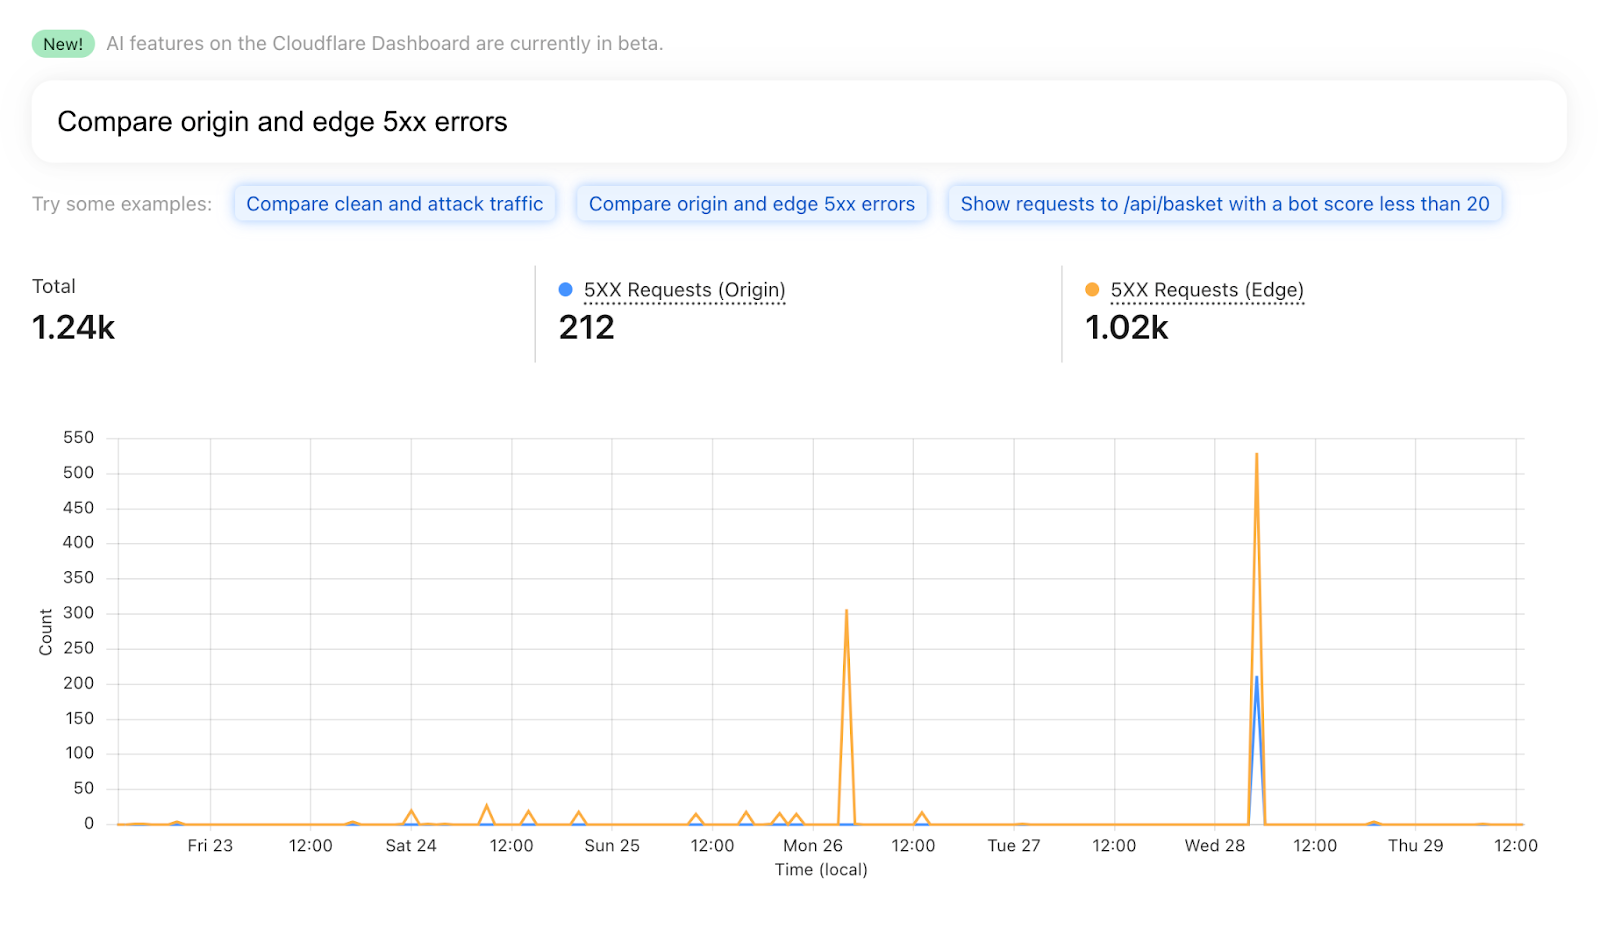
Second, as everything is just a signal, the mitigation layer, driven by the optional rules, becomes detection agnostic. By providing the same signals as fields in a unified rule system, writing high level policies becomes a breeze. And as we said earlier, given the detection is always-on and fully separated from the mitigation rule system, exploring the data can be thought of as a powerful rule match preview engine. No need to deploy a rule in LOG mode to see what it matches!
We can now design a unified user experience that reflects Application Security as a single product.
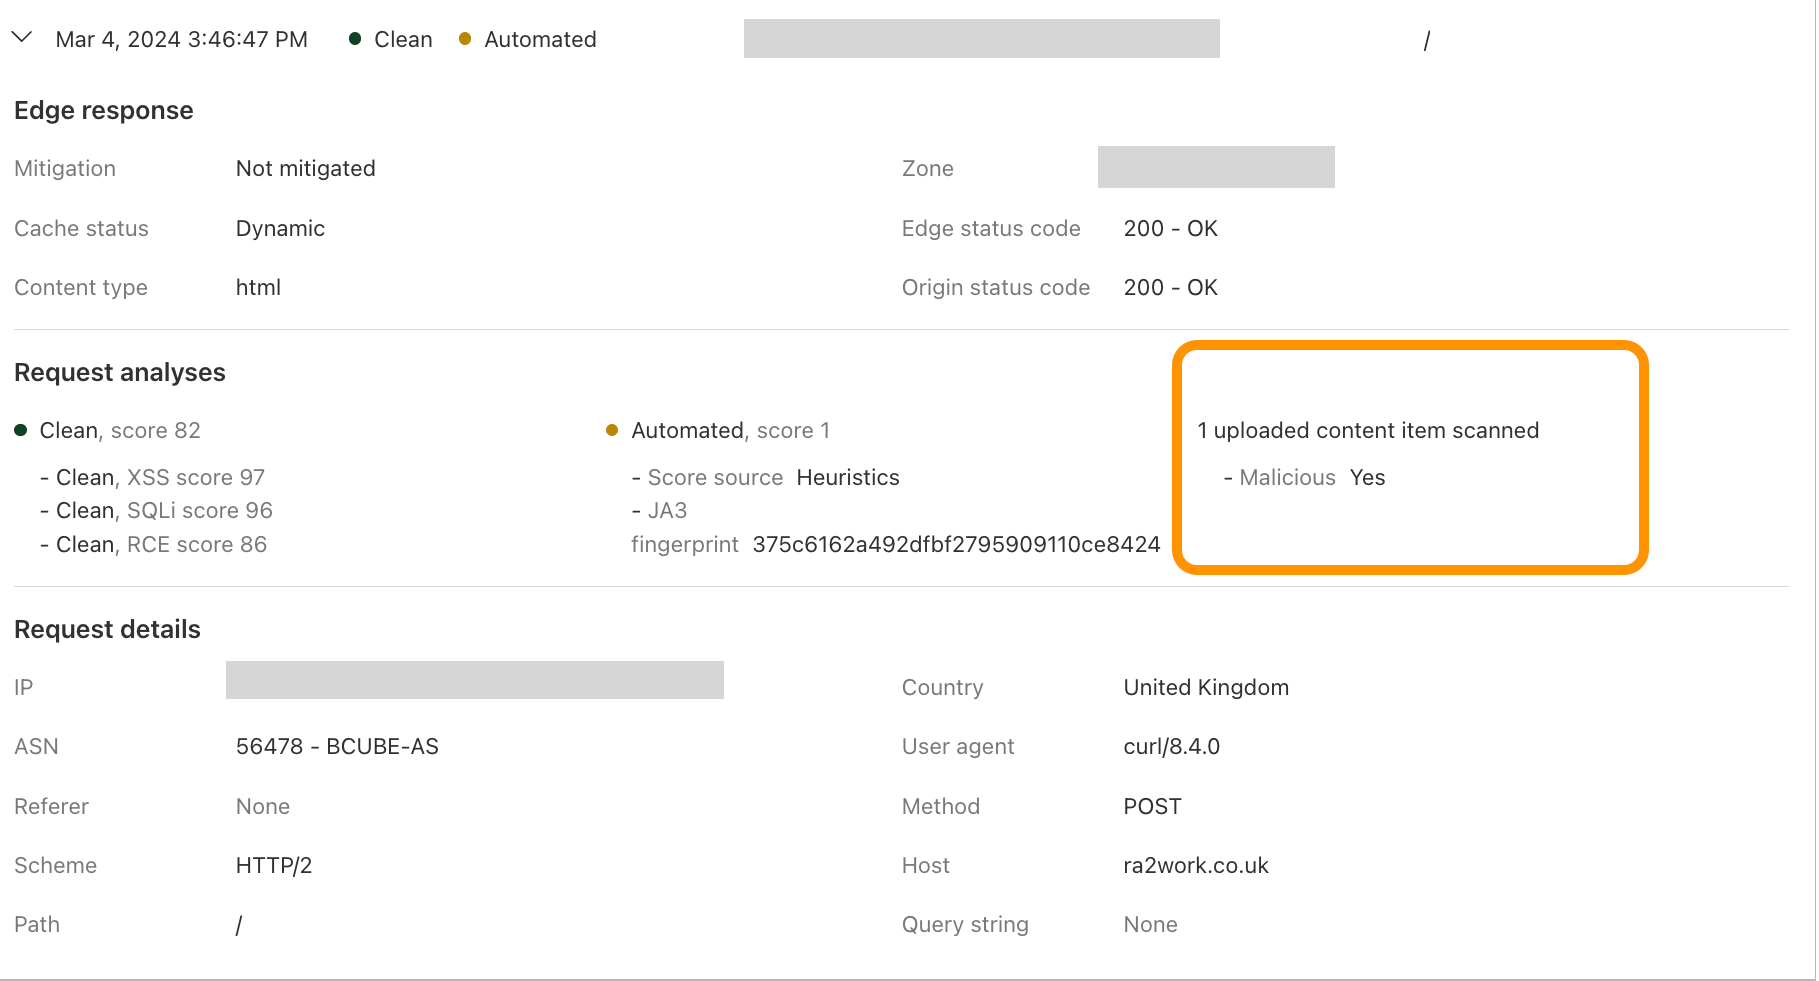
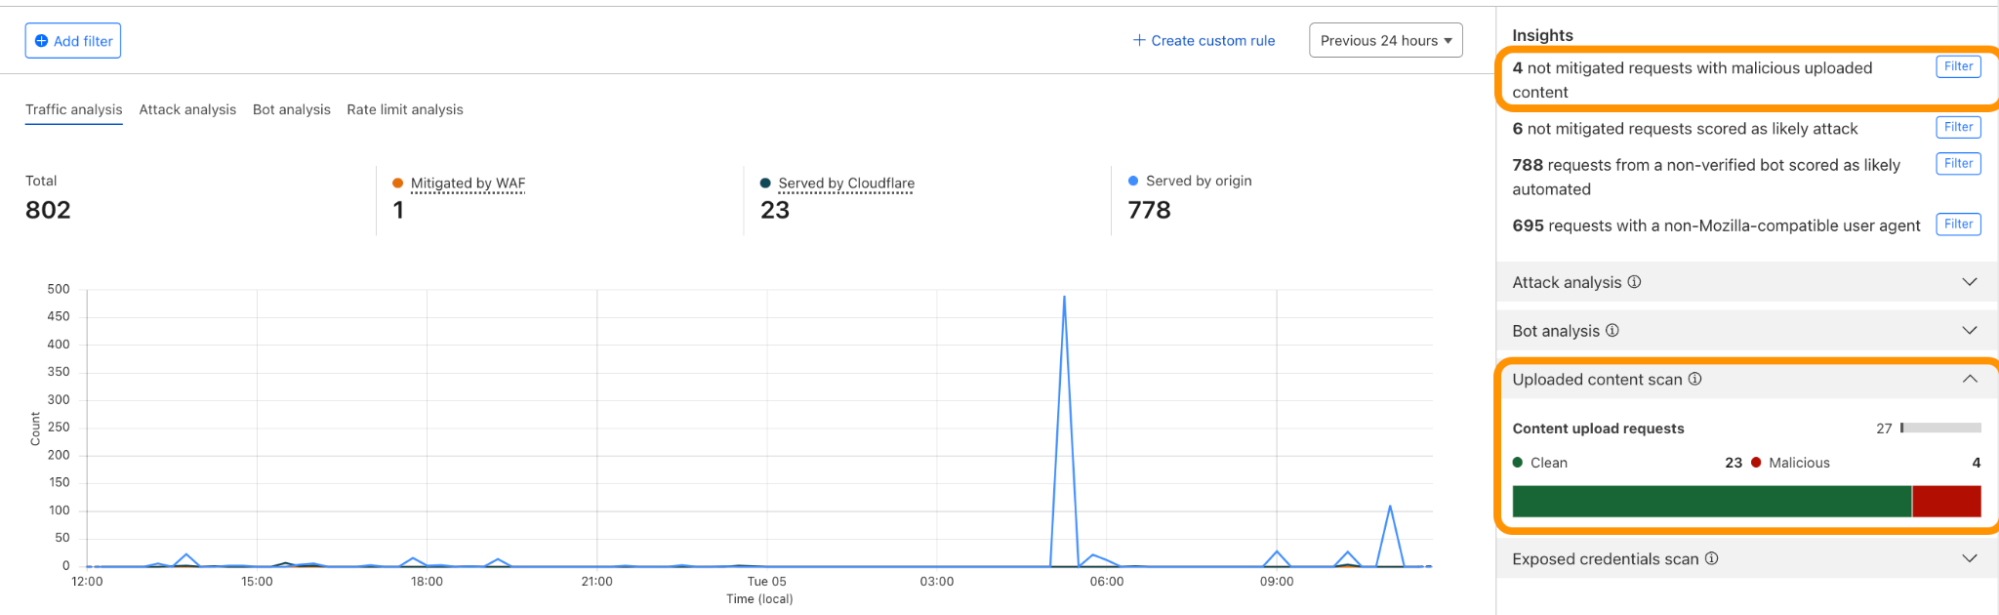
* note: the example here is simplistic, and the use cases become a lot more powerful once you expand to the full set of potential signals that the platform can generate. Take, for example, our ability to detect file uploads. If you run a job application site, you may want to let crawlers access your site, but you may *not* want crawlers to submit applications on behalf of applicants. By combining the bot score signal with the file upload signal, you can ensure that rule is enforced.
Introducing a unified Application Security experience
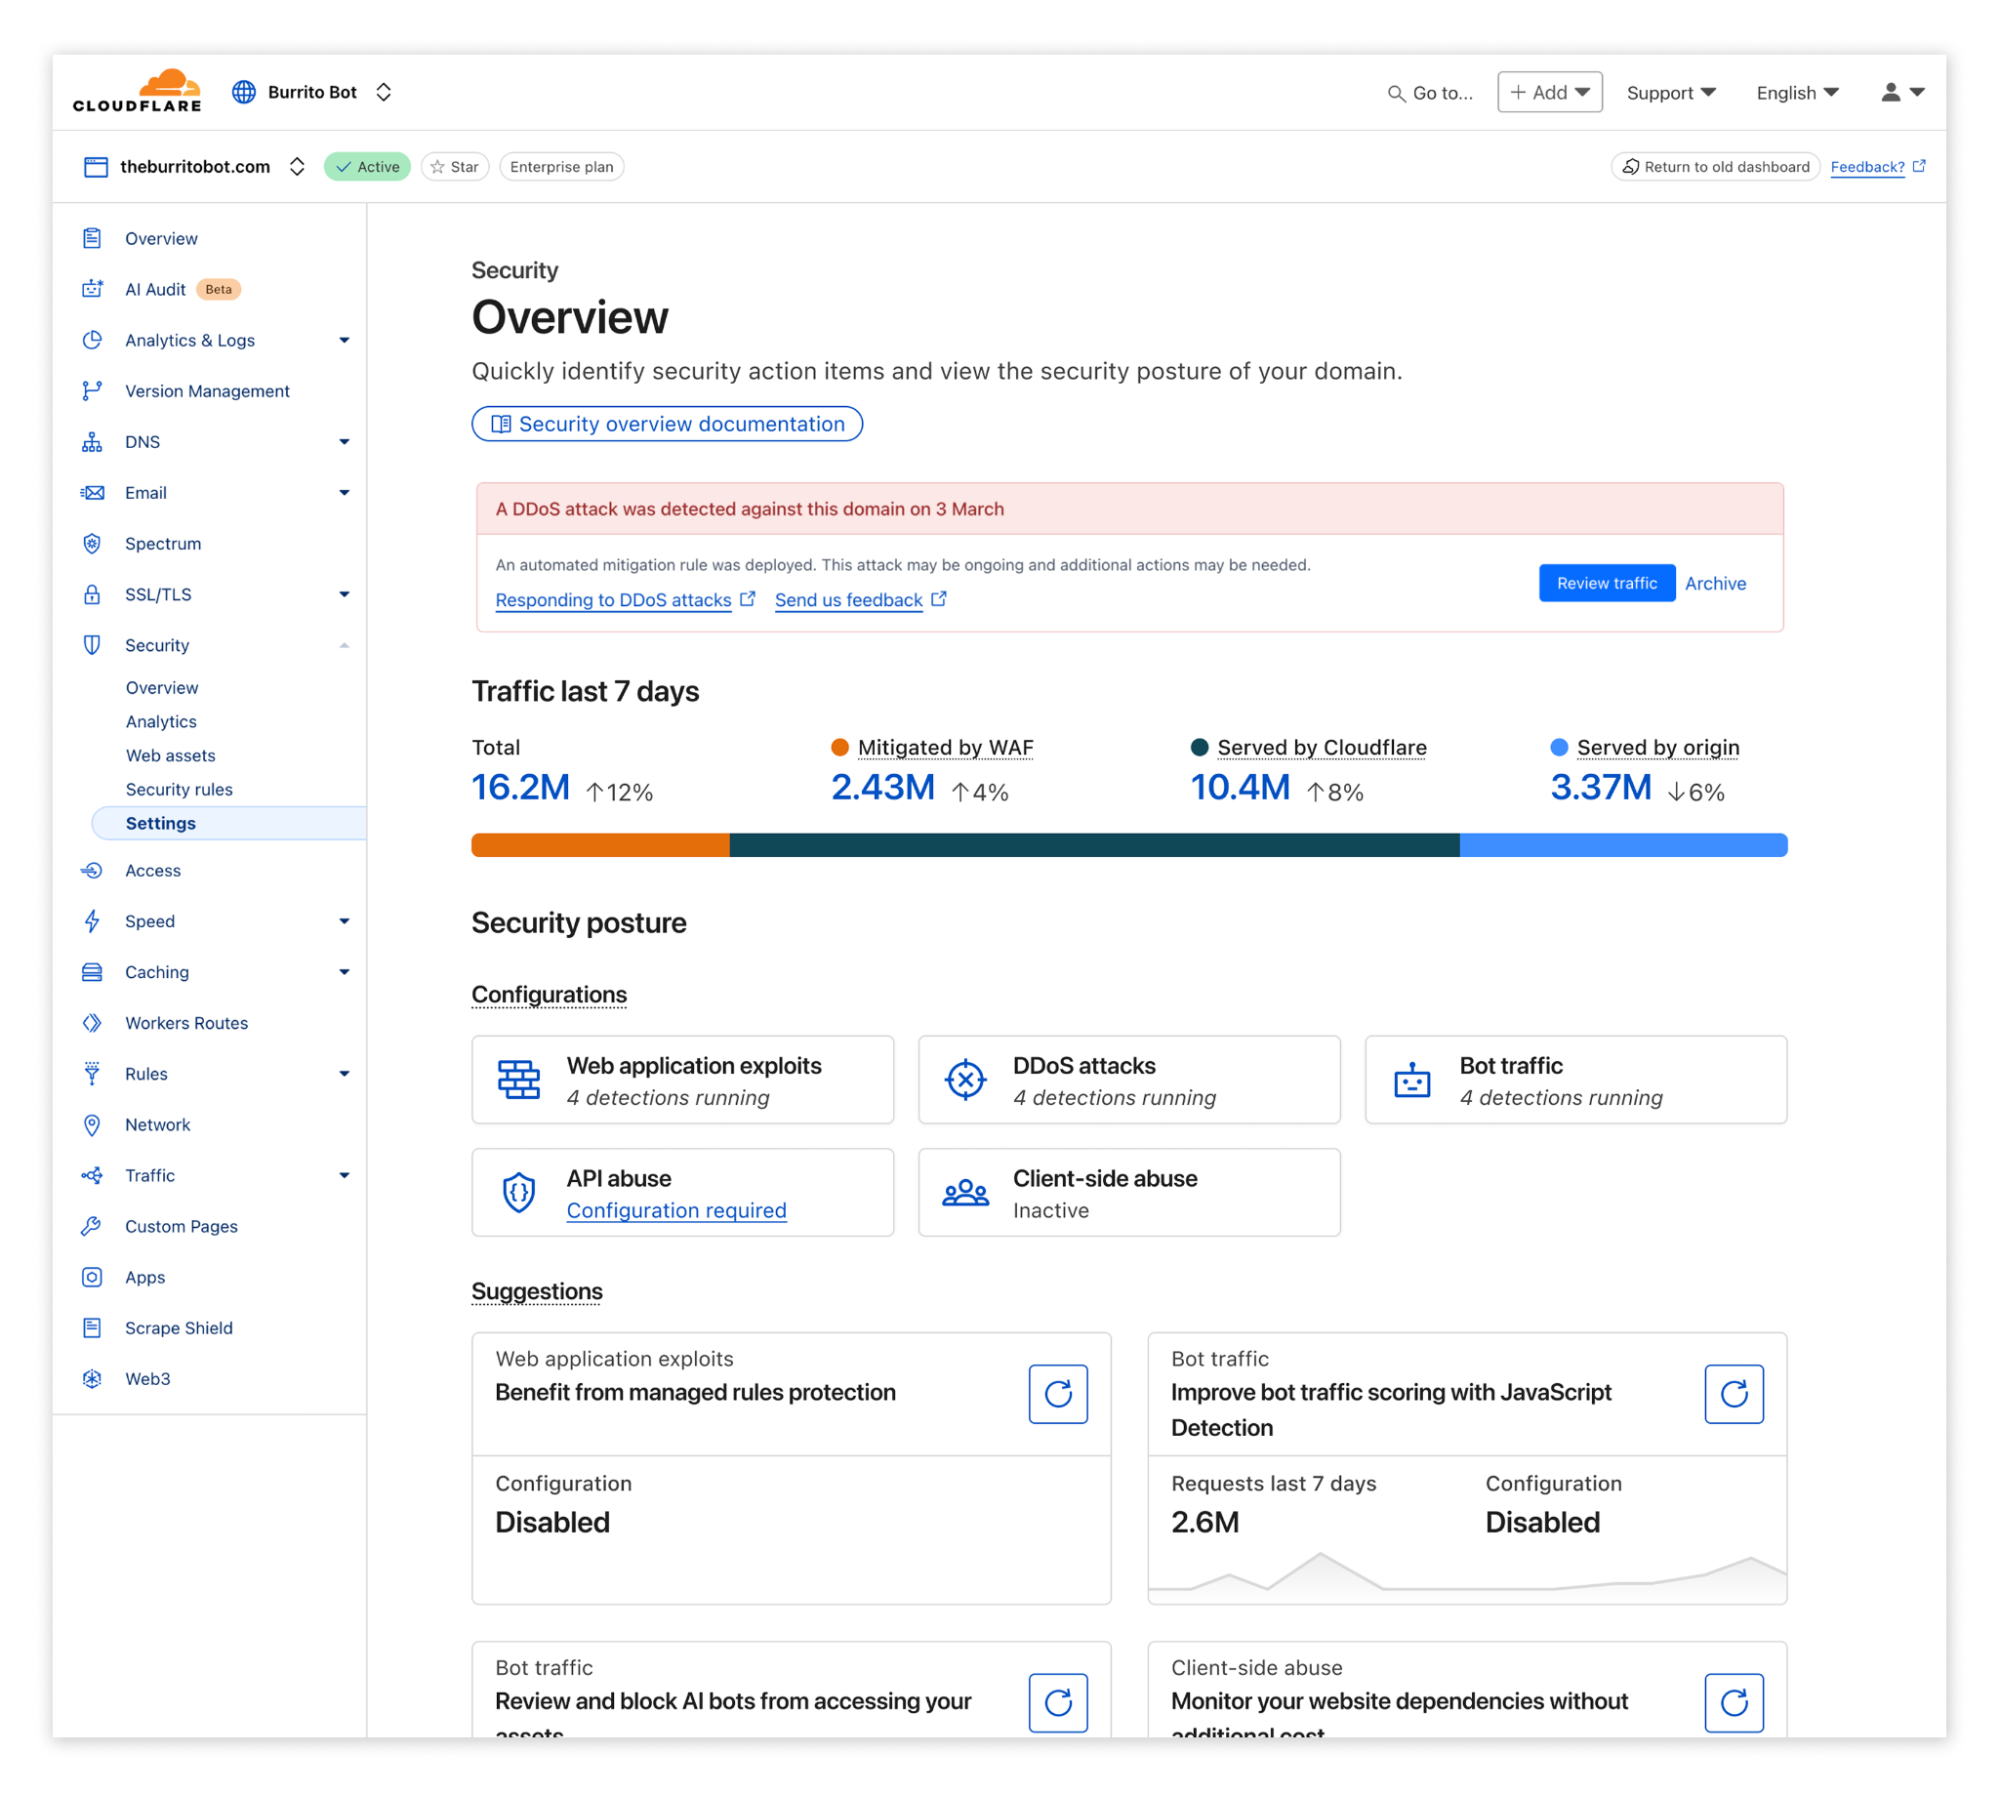
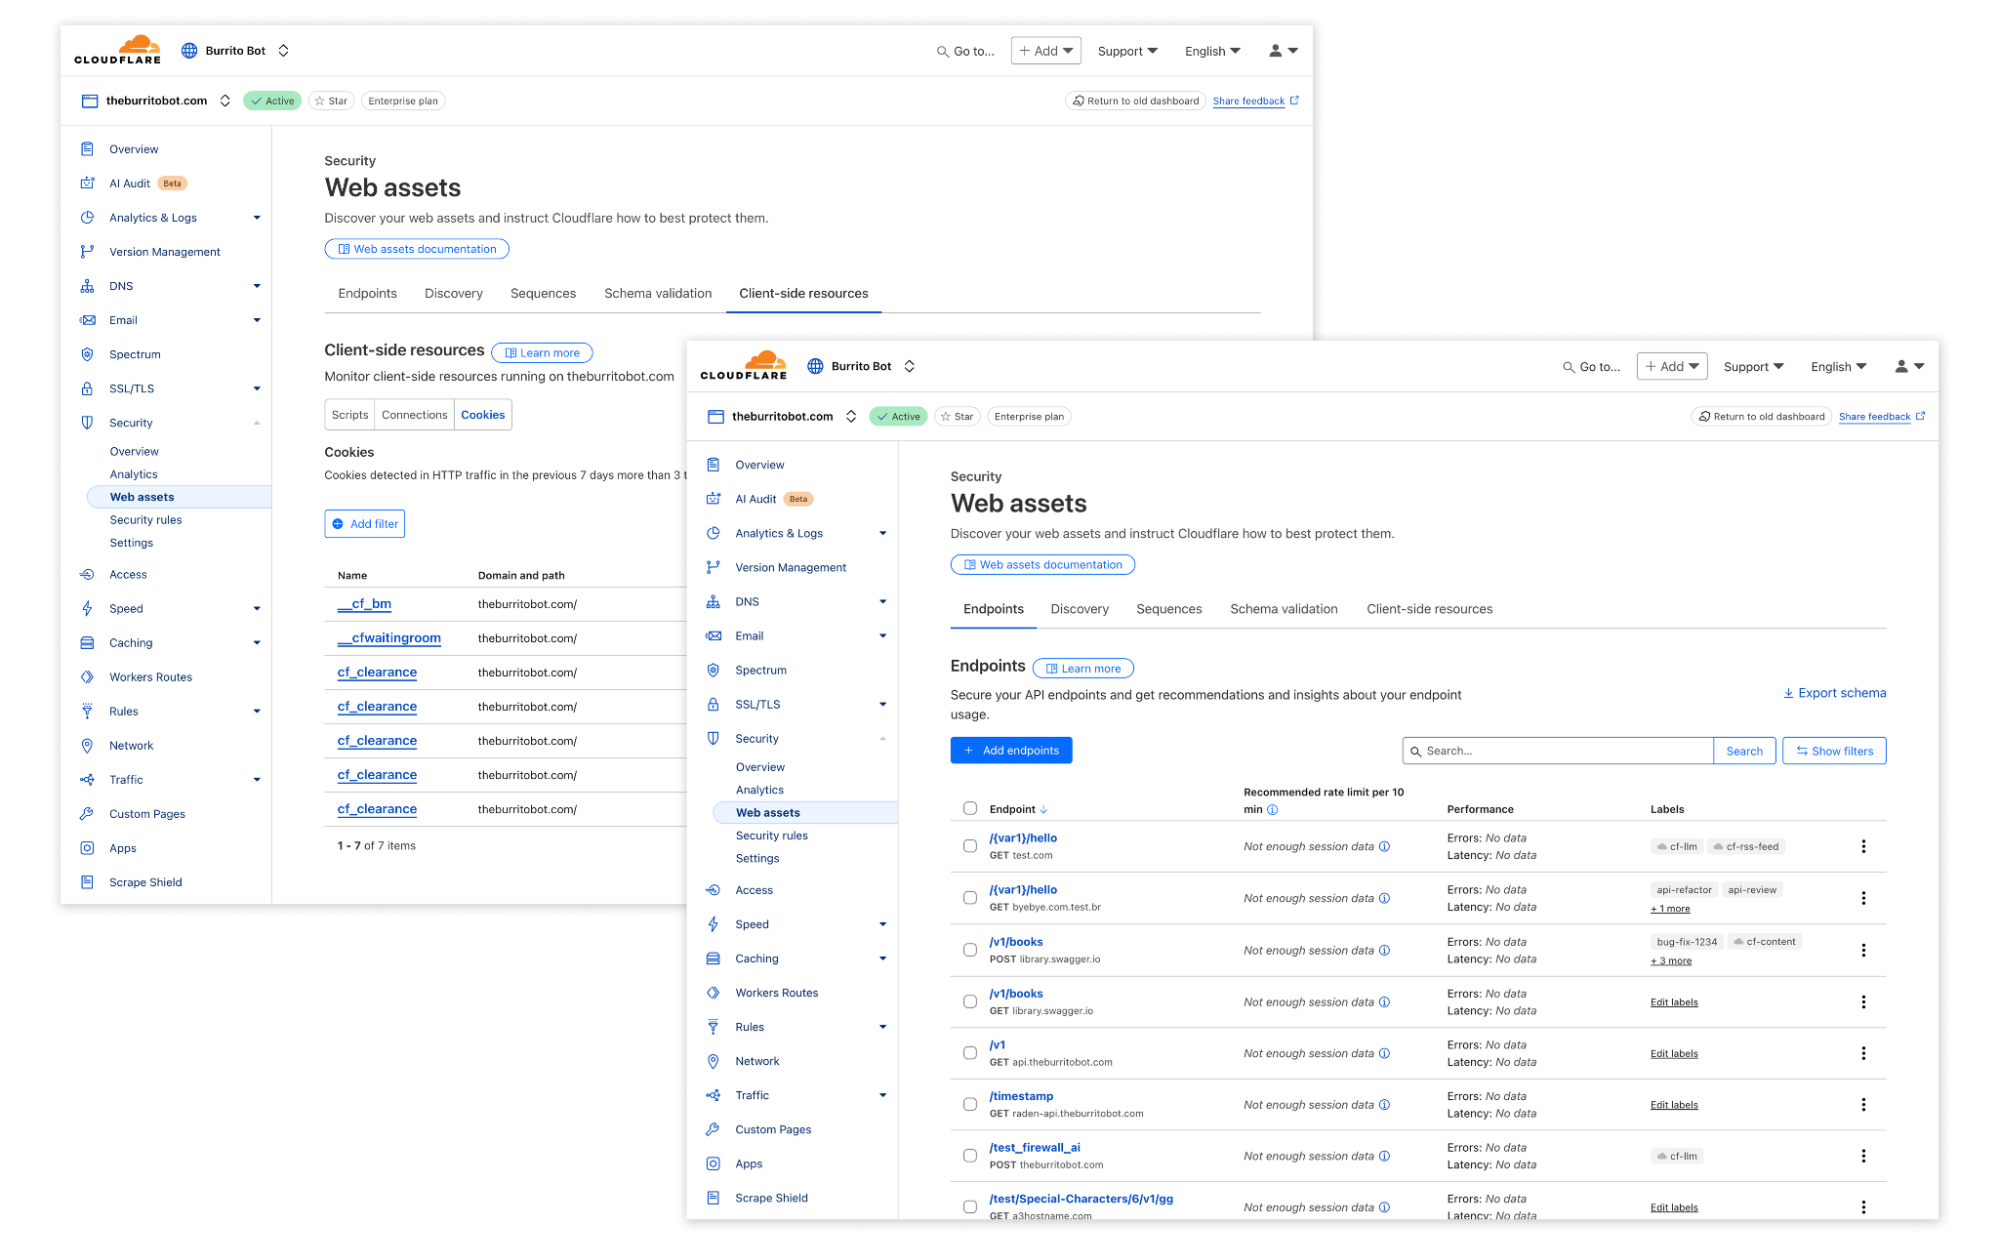
As signals are always-on, the user journey can now start from our new overview page where we highlight security suggestions based on your traffic profile and configurations. Alternatively, you can jump straight into analytics where you can investigate your traffic using a combination of all available signals.
When a specific traffic pattern seems malicious, you can jump into the rule system to implement a security policy. As part of our new design, given the simplicity of the navigation, we also took advantage of the opportunity to introduce a new web assets page, where we highlight discovery and attack surface management details.
Of course, reaching the final design required multiple iterations and feedback sessions. To best understand the balance of maintaining flexibility in the UI whilst reducing complexity, we focused on customer tasks to be done and documenting their processes while trying to achieve their intended actions in the dashboard. Reducing navigation items and using clear naming was one element, but we quickly learned that the changes needed to support ease of use for tasks across the platform.
Here is the end result:
To recap, our new dashboard now includes:
One overview page where misconfigurations, risks, and suggestions are aggregated
Simplified and redesigned security analytics that surfaces security signals from all Application Security capabilities, so you can easily identify and act on any suspicious activity
A new web assets page, where you can manage your attack surfaces, helping improve detection relevance
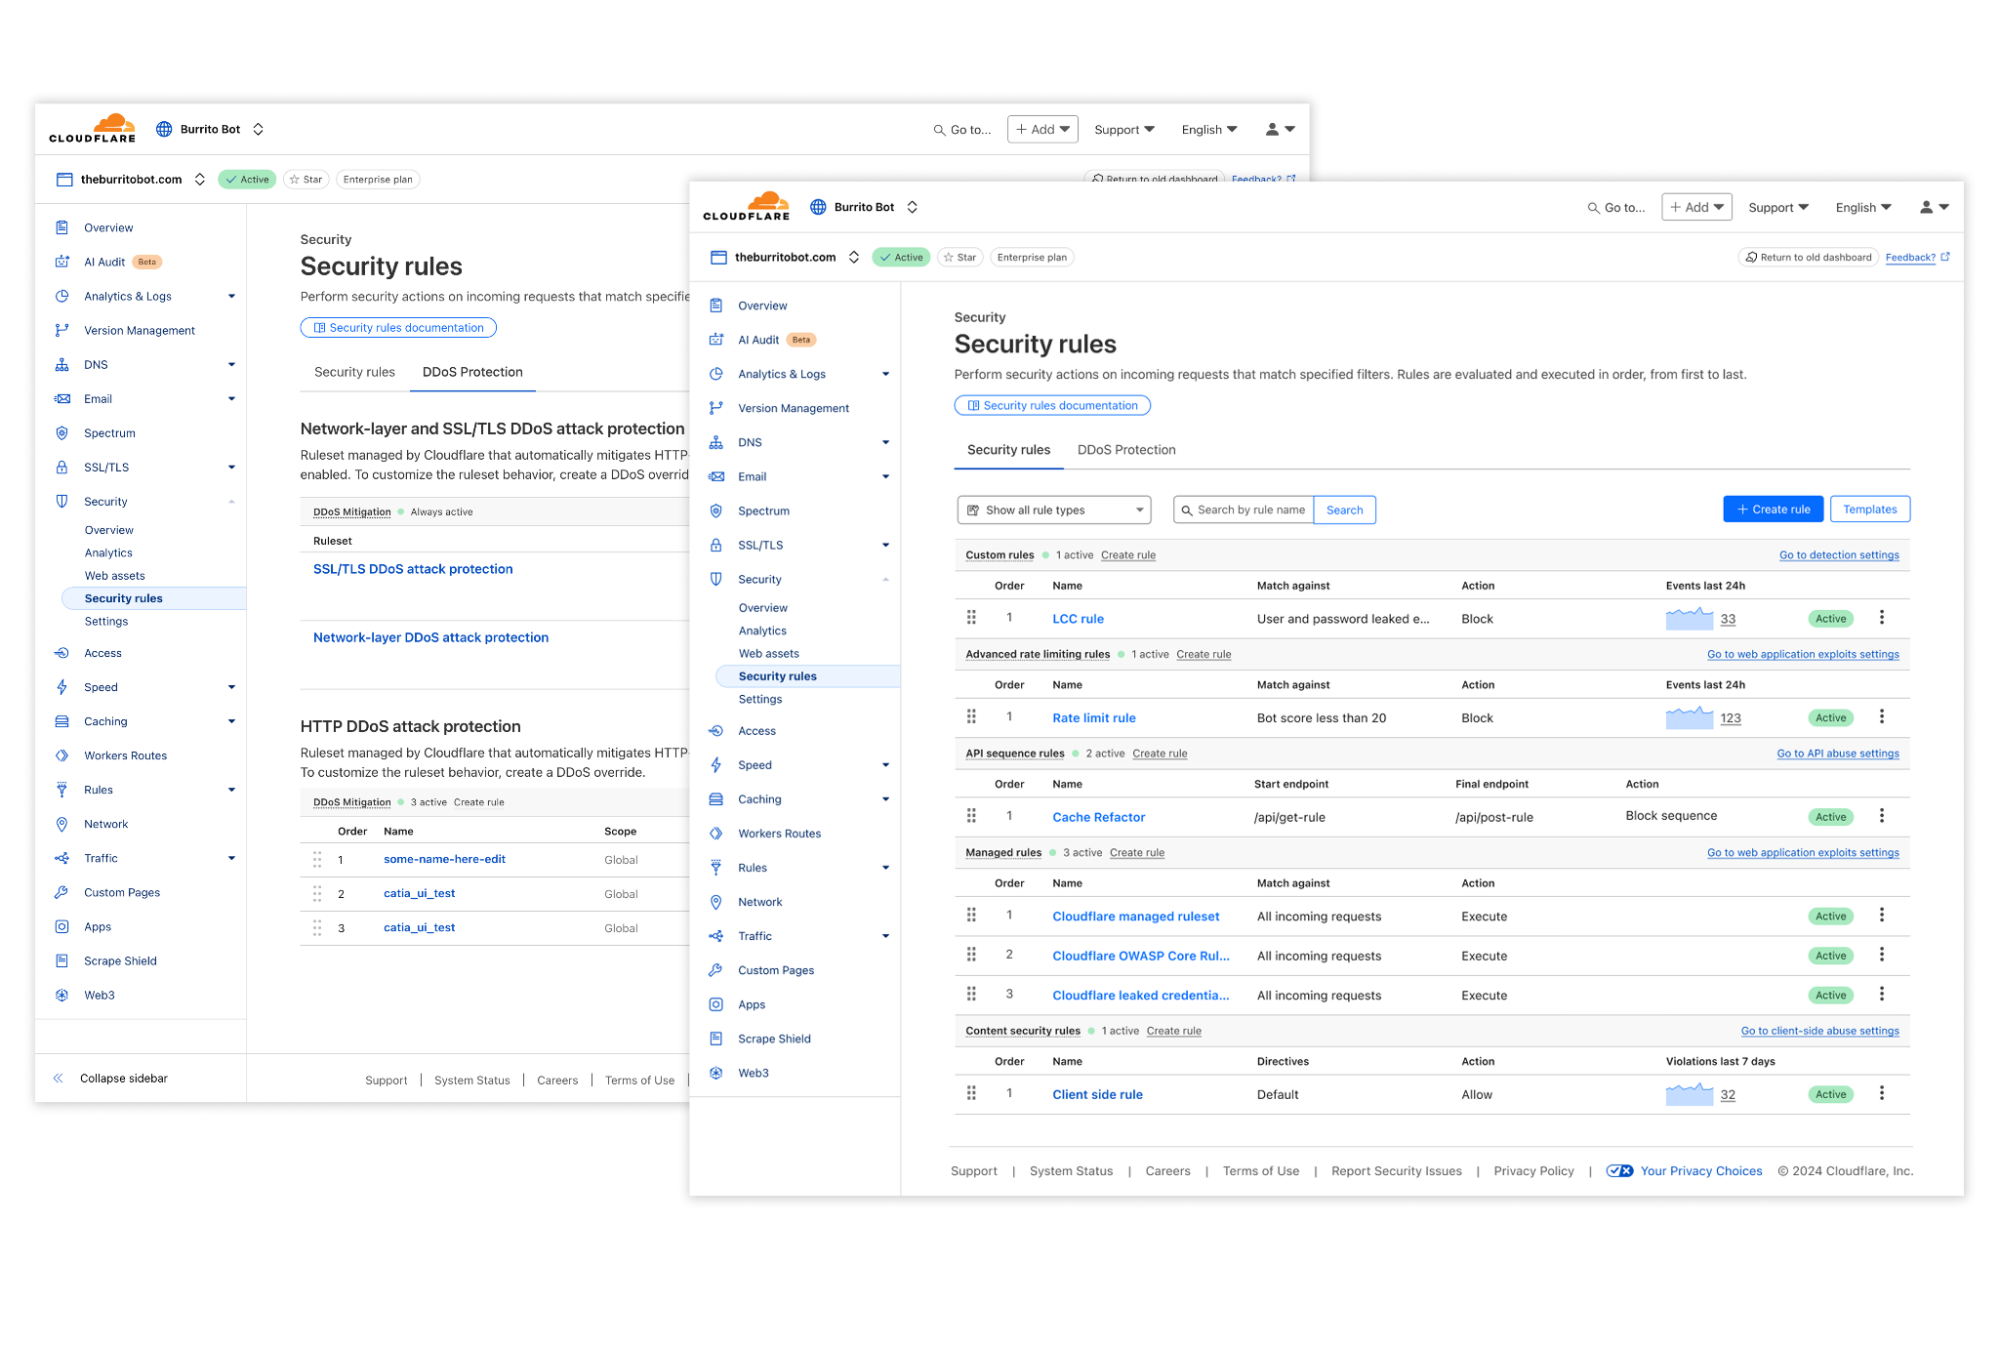
A single Security Rules page that provides a unified interface to manage, prioritise, and customise all mitigation rules in your zone, significantly streamlining your security configuration
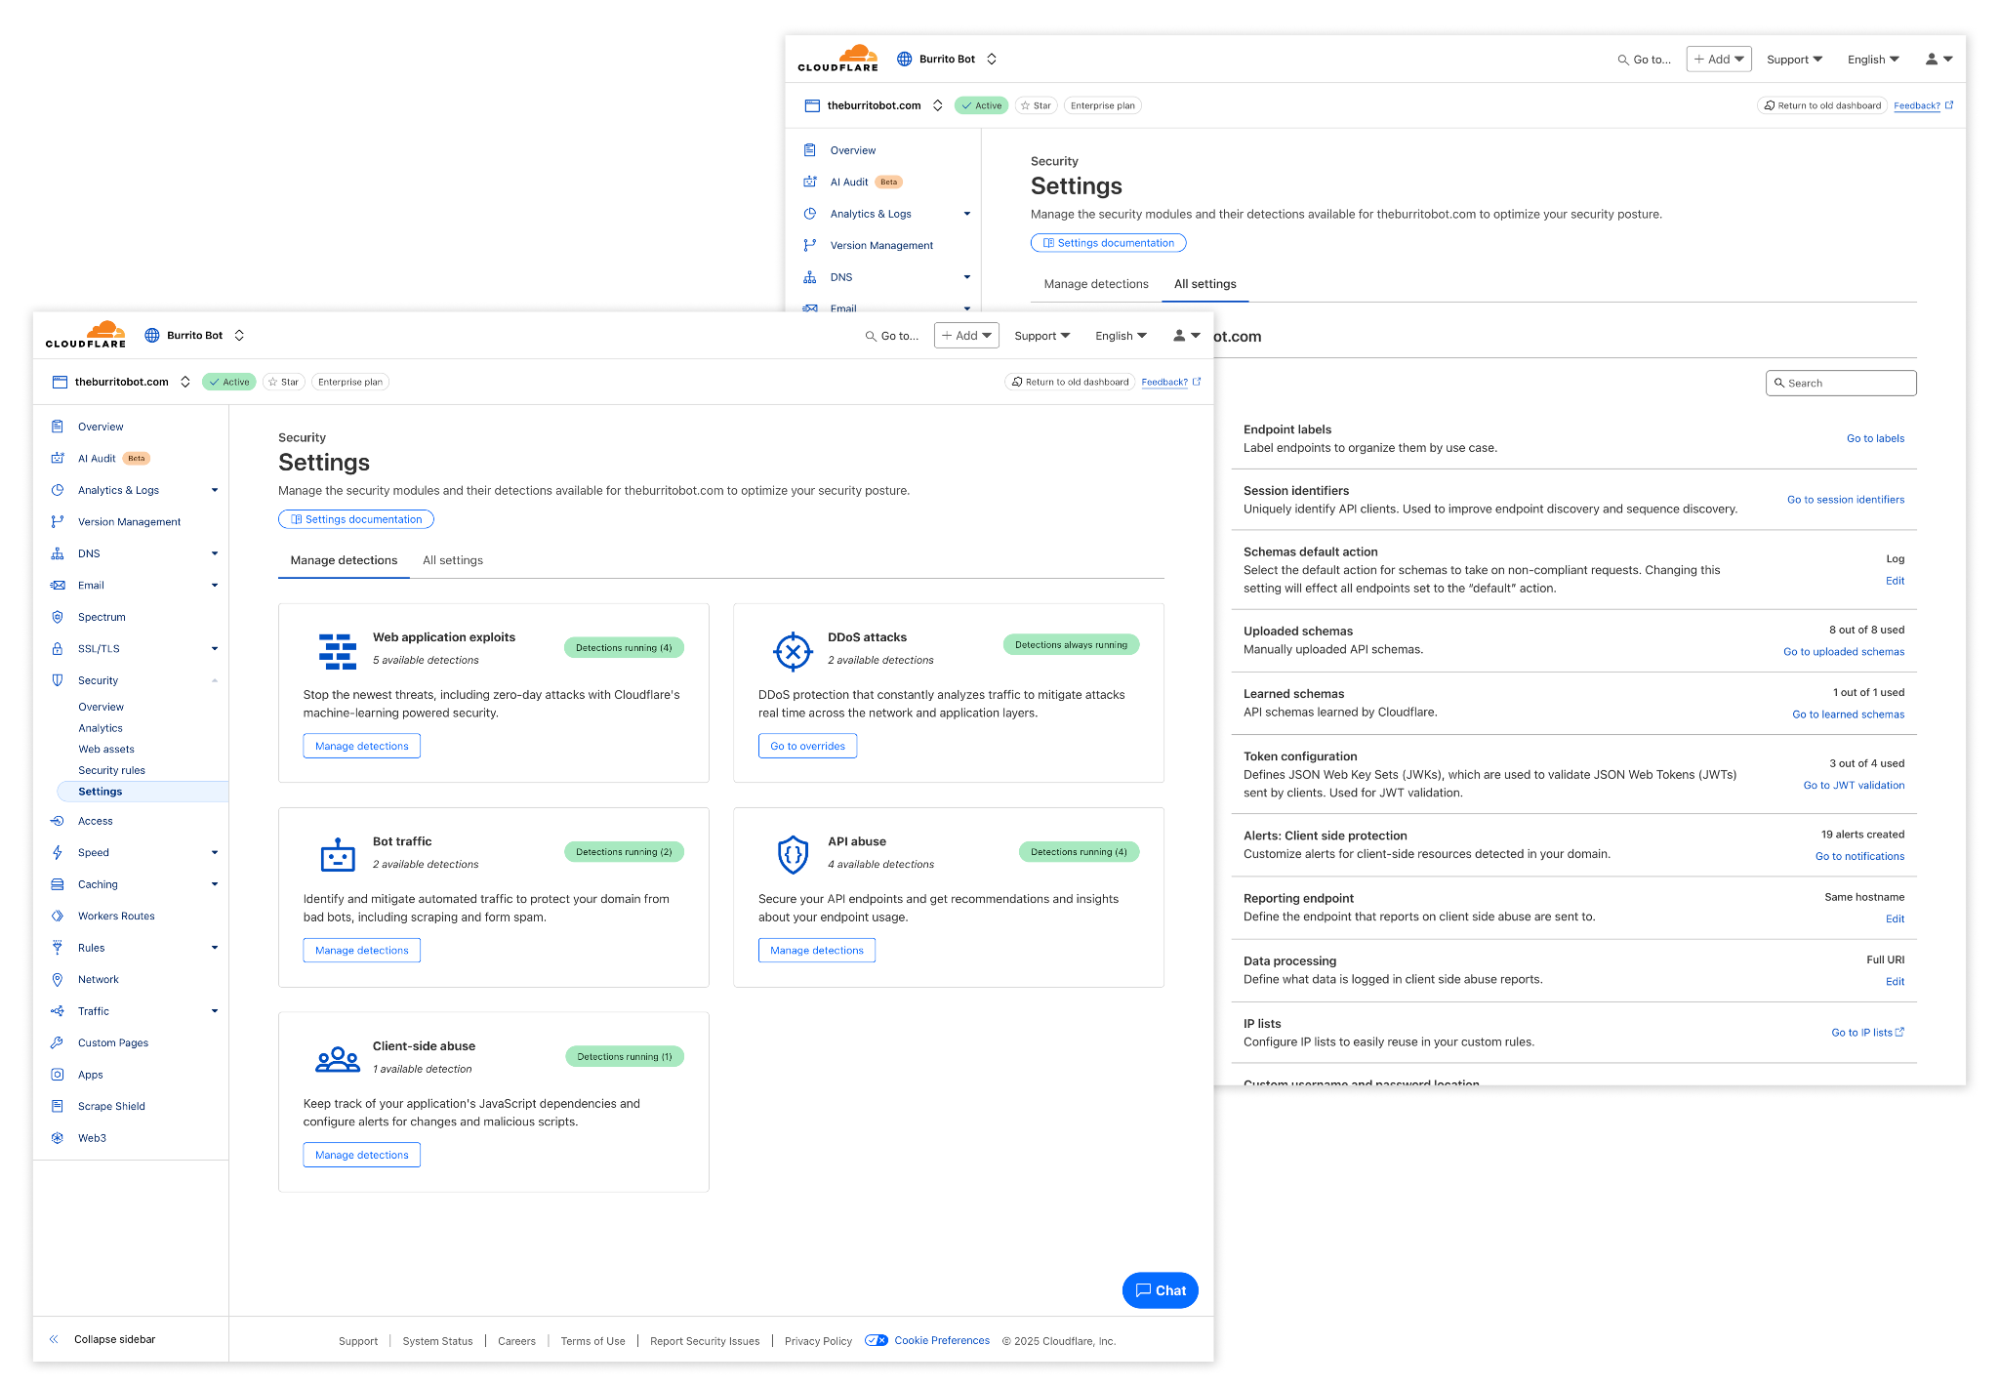
A new settings page where advanced control is based on security needs, not individual products
Let’s dive into each one.
Overview
With the unified security approach, the new overview page aggregates and prioritizes security suggestions across all your web assets, helping you maintain a healthy security posture. The suggestions span from detected (ongoing) attacks if there are any, to risks and misconfigurations to further solidify your protection. This becomes the daily starting point to manage your security posture.
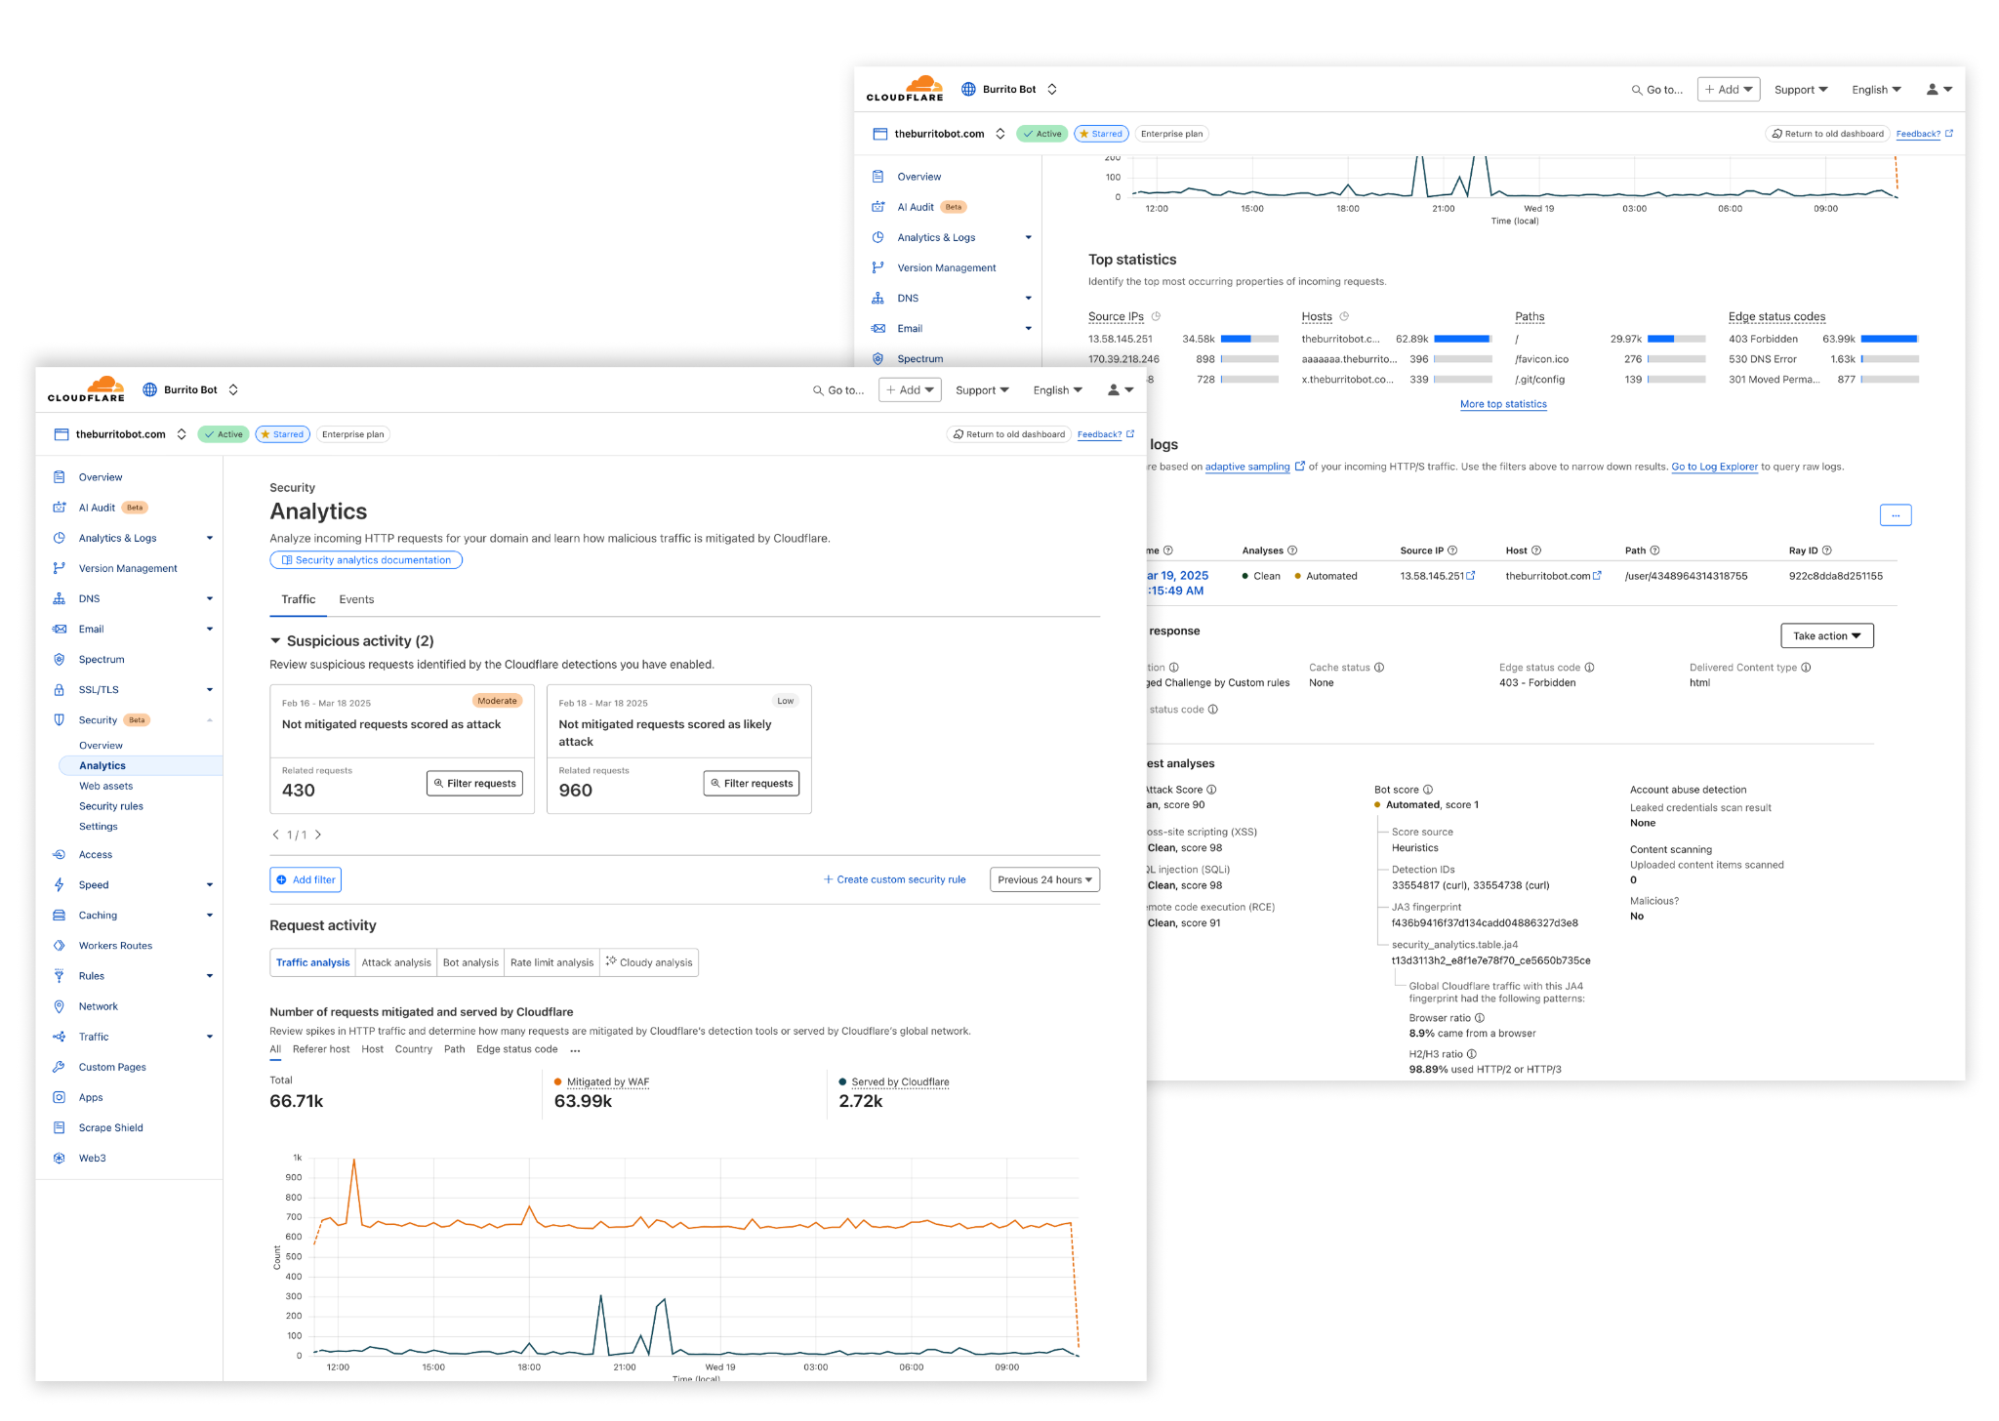
Analytics
Security Analytics and Events have been redesigned to make it easier to analyze your traffic. Suspicious activity detected by Cloudflare is surfaced at the top of the page, allowing you to easily filter and review related traffic. From the Traffic Analytics Sampled Log view, further below in the page, new workflows enable you to take quick action to craft a custom rule or review related security events in context.
Web assets
Web assets is a new concept introduced to bridge your business goals with threat detection capabilities. A web asset is any endpoint, file, document, or other related entity that we normally would act on from a security perspective. Within our new web asset page, you will be able to explore all relevant discovered assets by our system.
With our unified security platform, we are able to rapidly build new use-case driven threat detections. For example, to block automated actions across your e-commerce website, you can instruct Cloudflare’s system to block any fraudulent signup attempts, while allowing verified crawlers to index your product pages. This is made possible by labelling your web assets, which, where possible, is automated by Cloudflare, and then using those labels to power threat detections to protect your assets.
Security rules
The unified Security rules interface brings all mitigation rule types — including WAF custom rules, rate limiting rules, API sequence rules, and client side rules — together in one centralized location, eliminating the need to navigate multiple dashboards.
The new page gives you visibility into how Cloudflare mitigates both incoming traffic and blocks potentially malicious client side resources from loading, making it easier to understand your security posture at a glance. The page allows you to create customised mitigation rules by combining any detection signals, such as Bot Score, Attack Score, or signals from Leaked Credential Checks, enabling precise control over how Cloudflare responds to potential threats.
Settings
Balancing guidance and flexibility was the key driver for designing the new Settings page. As much as Cloudflare guides you towards the optimal security posture through recommendations and alerts, customers that want the flexibility to proactively adjust these settings can find all of them here.
Experience it today
This is the first of many enhancements we plan to make to the Application Security experience in the coming months. To check out the new navigation, log in to the Cloudflare dashboard, click on “Security” and choose “Check it out” when you see the message below. You will still have the option of opting out, if you so prefer.
Let us know what you think either by sharing feedback in our community forum or by providing feedback directly in the dashboard (you will be prompted if you revert to the old design).
It’s a big day here at Cloudflare! Not only is it Security Week, but today marks Cloudflare’s first step into a completely new area of functionality, intended to improve how our users both interact with, and get value from, all of our products.
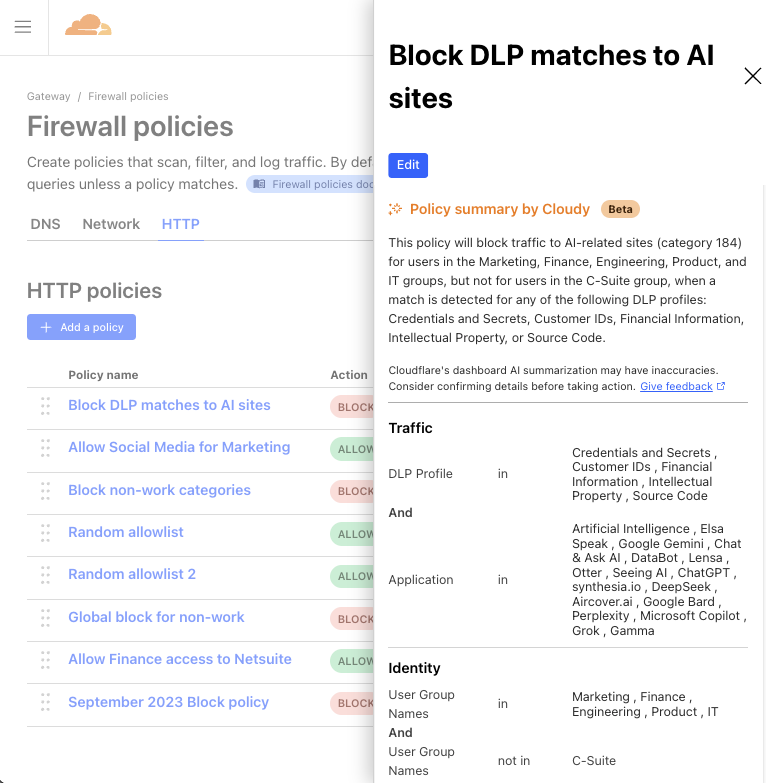
We’re excited to share a first glance of how we’re embedding AI features into the management of Cloudflare products you know and love. Our first mission? Focus on security and streamline the rule and policy management experience. The goal is to automate away the time-consuming task of manually reviewing and contextualizing Custom Rules in Cloudflare WAF, and Gateway policies in Cloudflare One, so you can instantly understand what each policy does, what gaps they have, and what you need to do to fix them.
Meet Cloudy, Cloudflare’s first AI agent
Our initial step toward a fully AI-enabled product experience is the introduction of Cloudy, the first version of Cloudflare AI agents, assistant-like functionality designed to help users quickly understand and improve their Cloudflare configurations in multiple areas of the product suite. You’ll start to see Cloudy functionality seamlessly embedded into two Cloudflare products across the dashboard, which we’ll talk about below.
And while the name Cloudy may be fun and light-hearted, our goals are more serious: Bring Cloudy and AI-powered functionality to every corner of Cloudflare, and optimize how our users operate and manage their favorite Cloudflare products. Let’s start with two places where Cloudy is now live and available to all customers using the WAF and Gateway products.
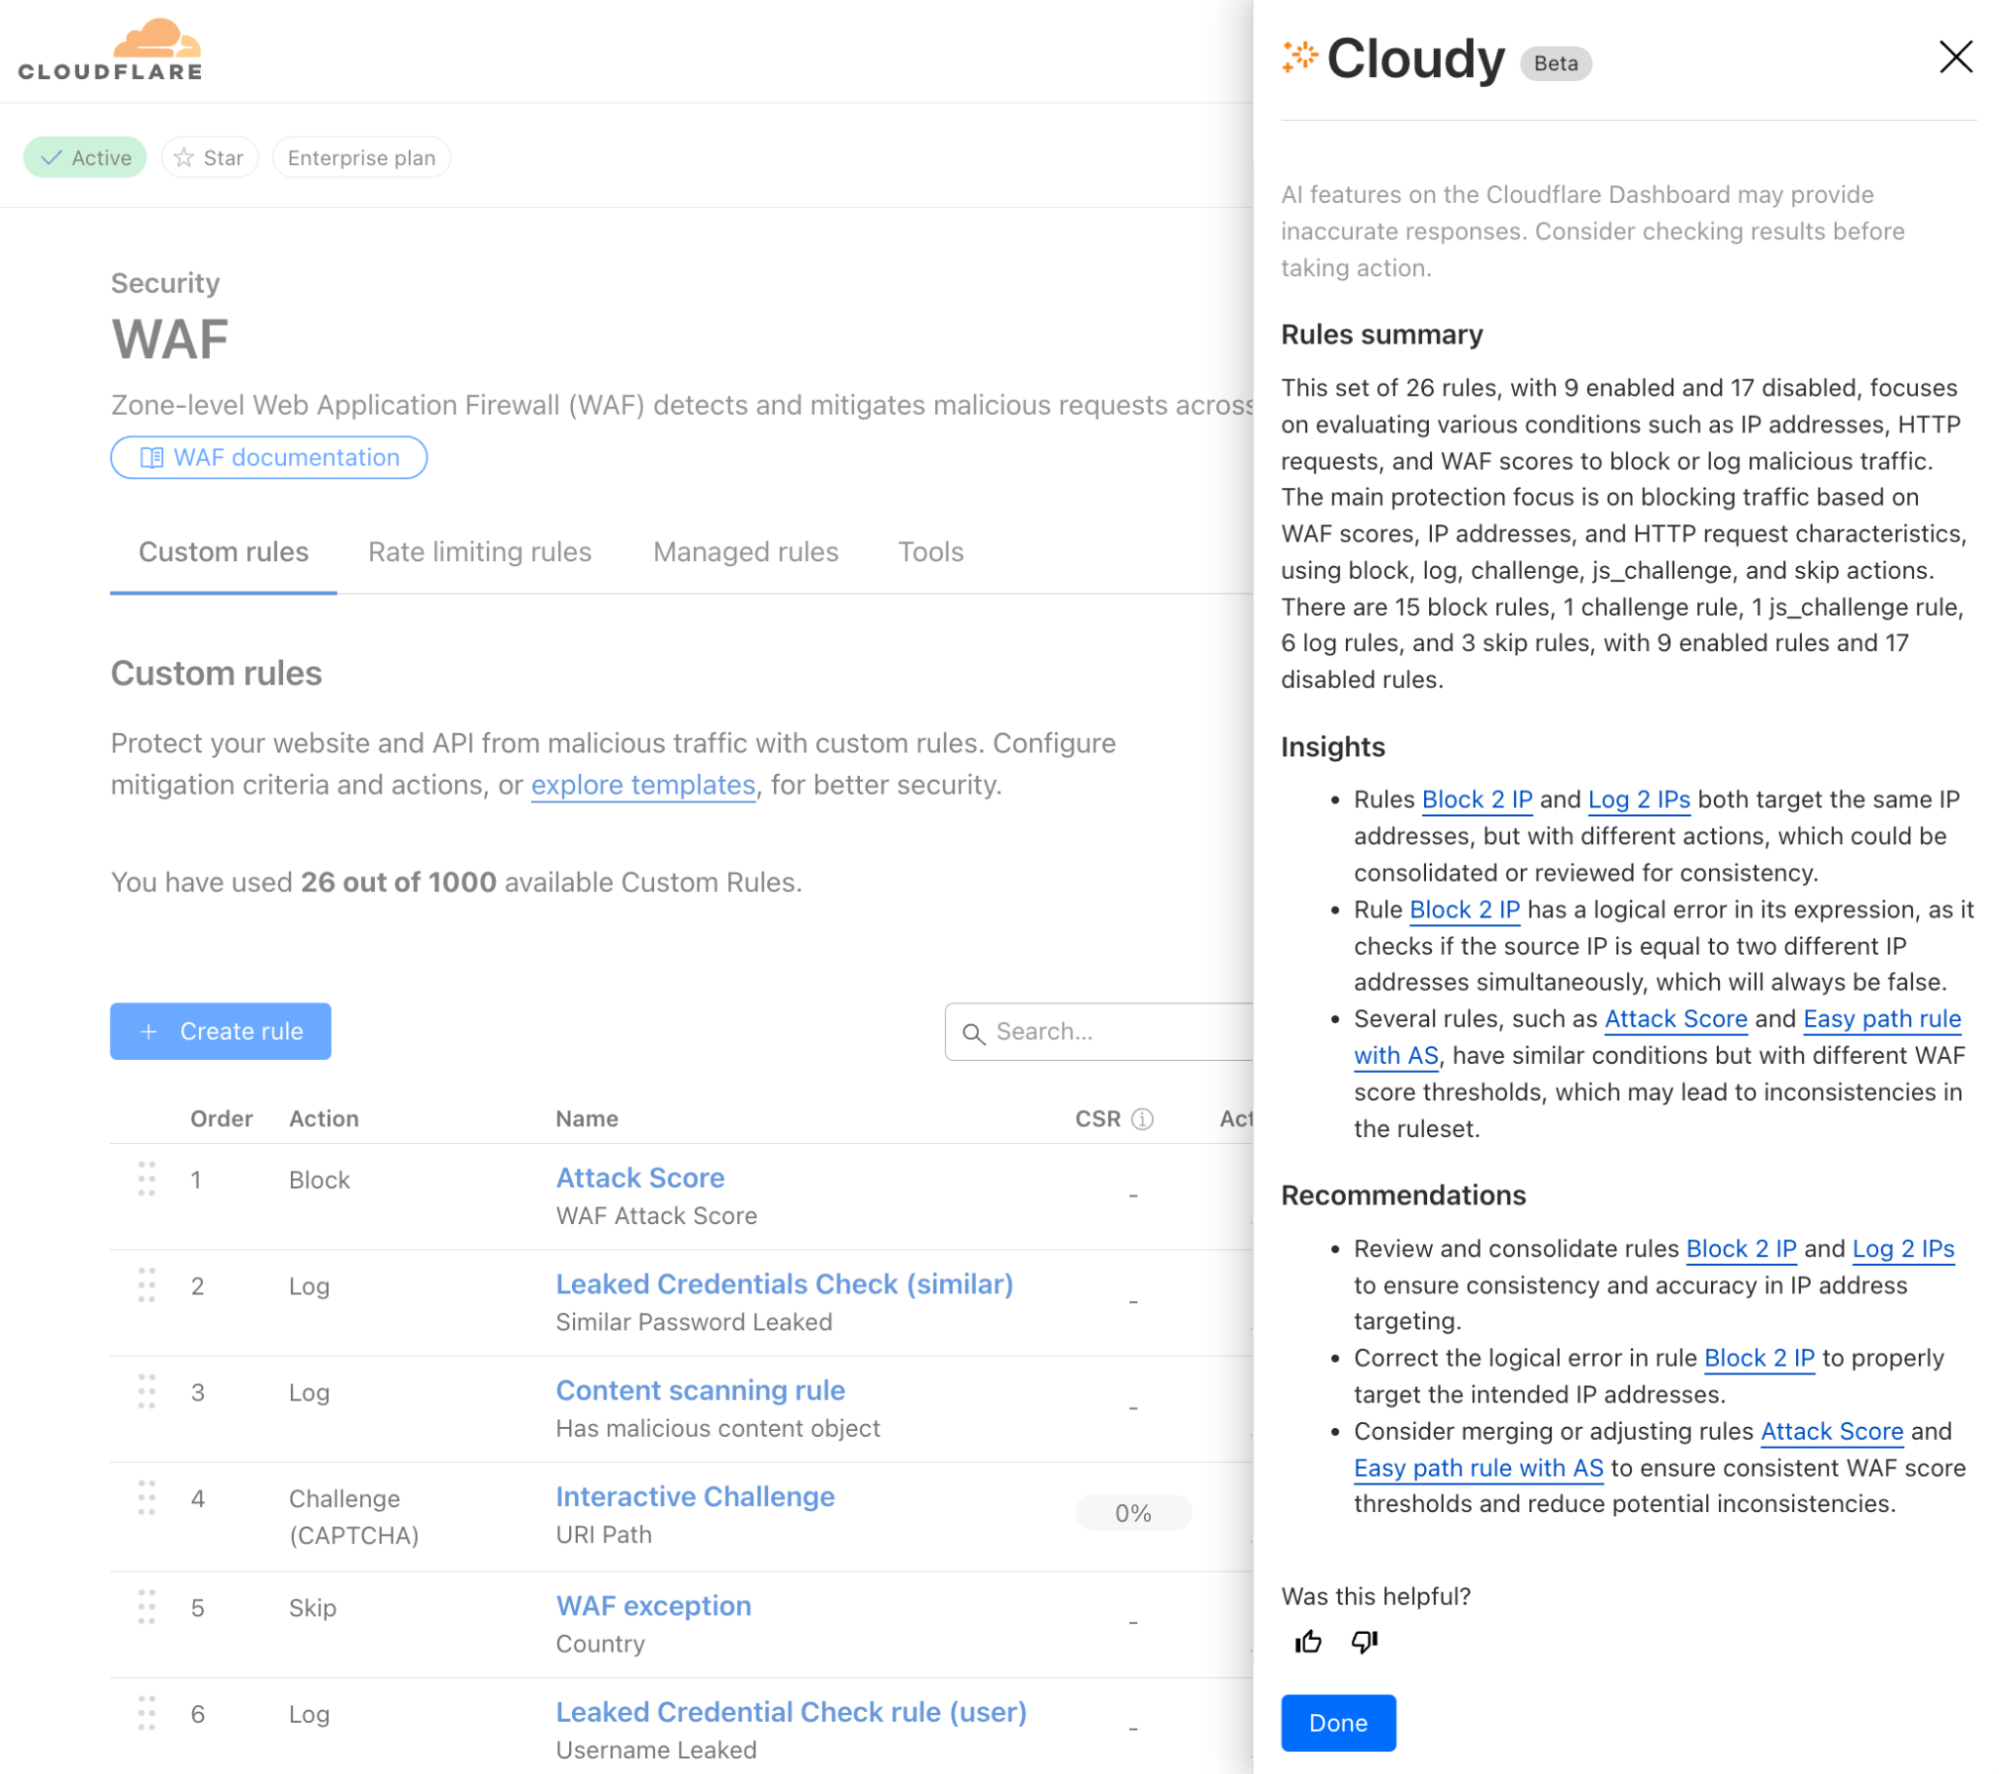
WAF Custom Rules
Let’s begin with AI-powered overviews of WAF Custom Rules. For those unfamiliar, Cloudflare’s Web Application Firewall (WAF) helps protect web applications from attacks like SQL injection, cross-site scripting (XSS), and other vulnerabilities.
One specific feature of the WAF is the ability to create WAF Custom Rules. These allow users to tailor security policies to block, challenge, or allow traffic based on specific attributes or security criteria.
However, for customers with dozens or even hundreds of rules deployed across their organization, it can be challenging to maintain a clear understanding of their security posture. Rule configurations evolve over time, often managed by different team members, leading to potential inefficiencies and security gaps. What better problem for Cloudy to solve?
Powered by Workers AI, today we’ll share how Cloudy will help review your WAF Custom Rules and provide a summary of what’s configured across them. Cloudy will also help you identify and solve issues such as:
Identifying redundant rules: Identify when multiple rules are performing the same function, or using similar fields, helping you streamline your configuration.
Optimising execution order: Spot cases where rules ordering affects functionality, such as when a terminating rule (block/challenge action) prevents subsequent rules from executing.
Analysing conflicting rules: Detect when rules counteract each other, such as one rule blocking traffic that another rule is designed to allow or log.
Identifying disabled rules: Highlight potentially important security rules that are in a disabled state, helping ensure that critical protections are not accidentally left inactive.
Cloudy won’t just summarize your rules, either. It will analyze the relationships and interactions between rules to provide actionable recommendations. For security teams managing complex sets of Custom Rules, this means less time spent auditing configurations and more confidence in your security coverage.
Available to all users, we’re excited to show how Cloudflare AI Agents can enhance the usability of our products, starting with WAF Custom Rules. But this is just the beginning.
Cloudflare One Firewall policies
We’ve also added Cloudy to Cloudflare One, our SASE platform, where enterprises manage the security of their employees and tools from a single dashboard.
In Cloudflare Gateway, our Secure Web Gateway offering, customers can configure policies to manage how employees do their jobs on the Internet. These Gateway policies can block access to malicious sites, prevent data loss violations, and control user access, among other things.
But similar to WAF Custom Rules, Gateway policy configurations can become overcomplicated and bogged down over time, with old, forgotten policies that do who-knows-what. Multiple selectors and operators working in counterintuitive ways. Some blocking traffic, others allowing it. Policies that include several user groups, but carve out specific employees. We’ve even seen policies that block hundreds of URLs in a single step. All to say, managing years of Gateway policies can become overwhelming.
So, why not have Cloudy summarize Gateway policies in a way that makes their purpose clear and concise?
Available to all Cloudflare Gateway users (create a free Cloudflare One account here), Cloudy will now provide a quick summary of any Gateway policy you view. It’s now easier than ever to get a clear understanding of each policy at a glance, allowing admins to spot misconfigurations, redundant controls, or other areas for improvement, and move on with confidence.
Built on Workers AI
At the heart of our new functionality is Cloudflare Workers AI (yes, the same version that everyone uses!) that leverages advanced large language models (LLMs) to process vast amounts of information; in this case, policy and rules data. Traditionally, manually reviewing and contextualizing complex configurations is a daunting task for any security team. With Workers AI, we automate that process, turning raw configuration data into consistent, clear summaries and actionable recommendations.
How it works
Cloudflare Workers AI ingests policy and rule configurations from your Cloudflare setup and combines them with a purpose-built LLM prompt. We leverage the same publicly-available LLM models that we offer our customers, and then further enrich the prompt with some additional data to provide it with context. For this specific task of analyzing and summarizing policy and rule data, we provided the LLM:
Policy & rule data: This is the primary data itself, including the current configuration of policies/rules for Cloudy to summarize and provide suggestions against.
Documentation on product abilities: We provide the model with additional technical details on the policy/rule configurations that are possible with each product, so that the model knows what kind of recommendations are within its bounds.
Enriched datasets: Where WAF Custom Rules or CF1 Gateway policies leverage other ‘lists’ (e.g., a WAF rule referencing multiple countries, a Gateway policy leveraging a specific content category), the list item(s) selected must be first translated from an ID to plain-text wording so that the LLM can interpret which policy/rule values are actually being used.
Output instructions: We specify to the model which format we’d like to receive the output in. In this case, we use JSON for easiest handling.
Additional clarifications: Lastly, we explicitly instruct the LLM to be sure about its output, valuing that aspect above all else. Doing this helps us ensure that no hallucinations make it to the final output.
By automating the analysis of your WAF Custom Rules and Gateway policies, Cloudflare Workers AI not only saves you time but also enhances security by reducing the risk of human error. You get clear, actionable insights that allow you to streamline your configurations, quickly spot anomalies, and maintain a strong security posture—all without the need for labor-intensive manual reviews.
What’s next for Cloudy
Beta previews of Cloudy are live for all Cloudflare customers today. But this is just the beginning of what we envision for AI-powered functionality across our entire product suite.
Throughout the rest of 2025, we plan to roll out additional AI agent capabilities across other areas of Cloudflare. These new features won’t just help customers manage security more efficiently, but they’ll also provide intelligent recommendations for optimizing performance, streamlining operations, and enhancing overall user experience.
We’re excited to hear your thoughts as you get to meet Cloudy and try out these new AI features – send feedback to us at [email protected], or post your thoughts on X, LinkedIn, or Mastodon tagged with #SecurityWeek! Your feedback will help shape our roadmap for AI enhancement, and bring our users smarter, more efficient tooling that helps everyone get more secure.
On January 23, 2025, Cloudflare was notified via its Bug Bounty Program of a vulnerability in Cloudflare’s Mutual TLS (mTLS) implementation.
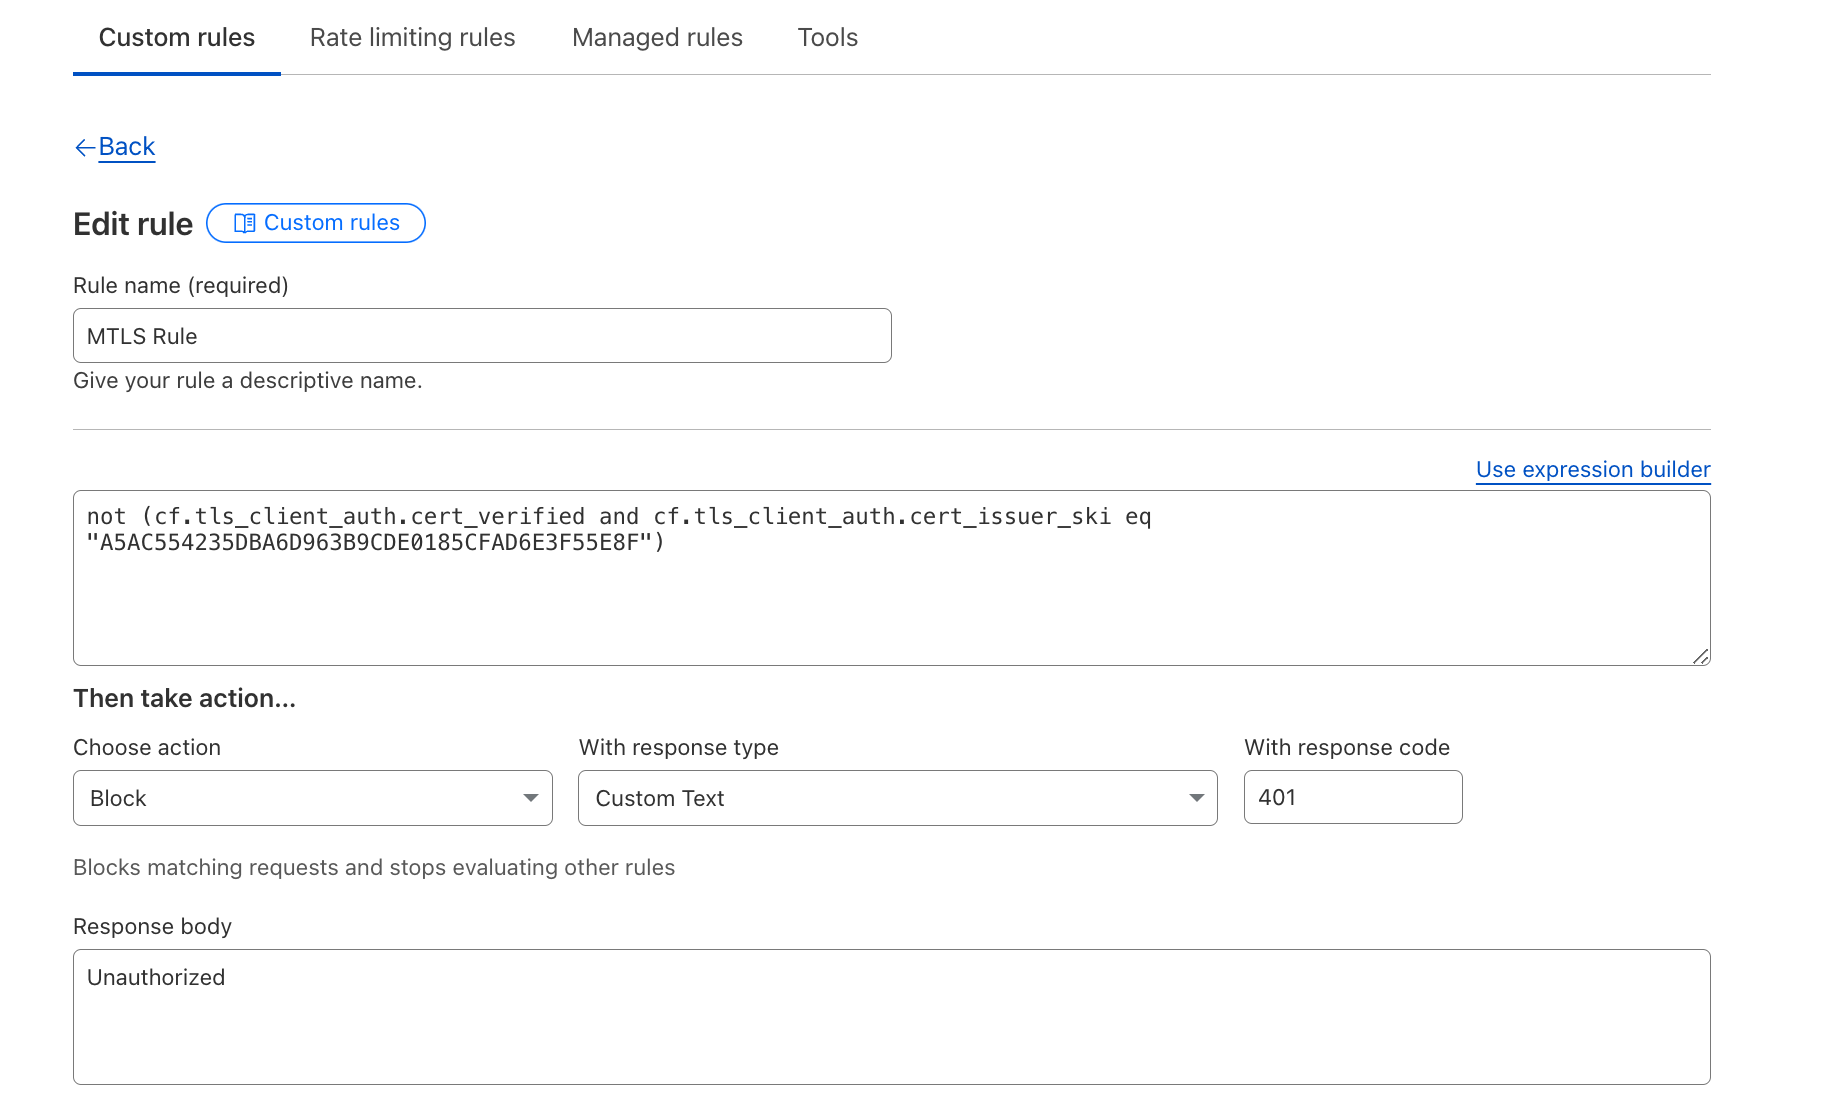
The vulnerability affected customers who were using mTLS and involved a flaw in our session resumption handling. Cloudflare’s investigation revealed no evidence that the vulnerability was being actively exploited. And tracked asCVE-2025-23419, Cloudflare mitigated the vulnerability within 32 hours after being notified. Customers who were using Cloudflare’s API shield in conjunction with WAF custom rules that validated the issuer’s Subject Key Identifier (SKI) were not vulnerable. Access policies such as identity verification, IP address restrictions, and device posture assessments were also not vulnerable.
Background
The bug bounty report detailed that a client with a valid mTLS certificate for one Cloudflare zone could use the same certificate to resume a TLS session with another Cloudflare zone using mTLS, without having to authenticate the certificate with the second zone.
Cloudflare customers can implement mTLS through Cloudflare API Shield with Custom Firewall Rules and the Cloudflare Zero Trust product suite. Cloudflare establishes the TLS session with the client and forwards the client certificate to Cloudflare’s Firewall or Zero Trust products, where customer policies are enforced.
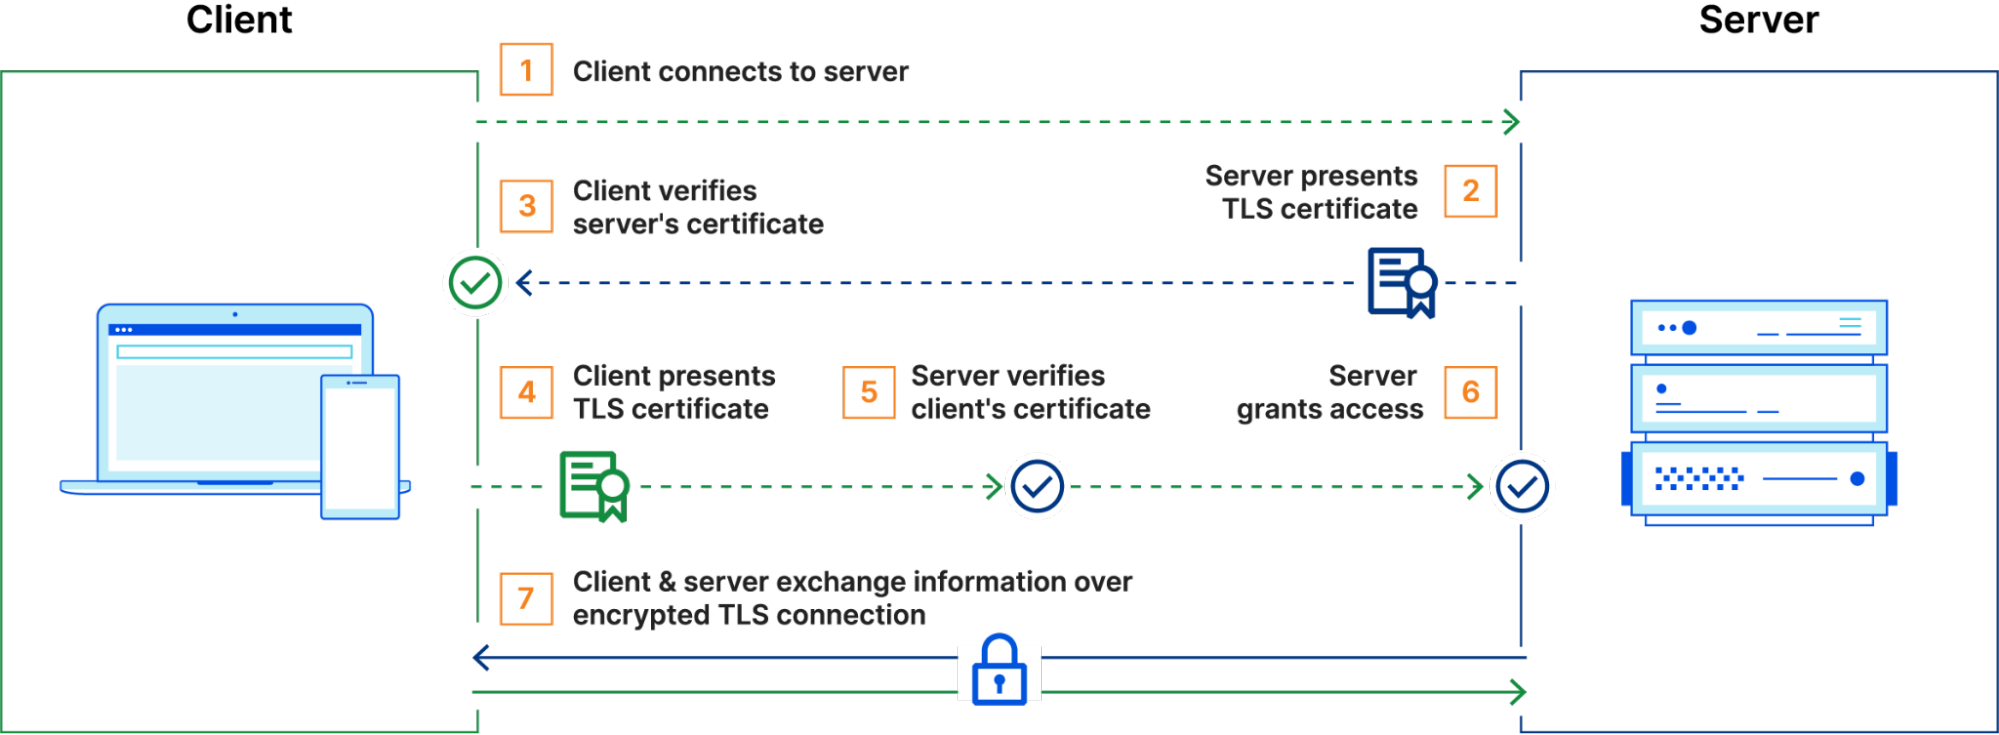
mTLS operates by extending the standard TLS handshake to require authentication from both sides of a connection – the client and the server. In a typical TLS session, a client connects to a server, which presents its TLS certificate. The client verifies the certificate, and upon successful validation, an encrypted session is established. However, with mTLS, the client also presents its own TLS certificate, which the server verifies before the connection is fully established. Only if both certificates are validated does the session proceed, ensuring bidirectional trust.
mTLS is useful for securing API communications, as it ensures that only legitimate and authenticated clients can interact with backend services. Unlike traditional authentication mechanisms that rely on credentials or tokens, mTLS requires possession of a valid certificate and its corresponding private key.
To improve TLS connection performance, Cloudflare employs session resumption. Session resumption speeds up the handshake process, reducing both latency and resource consumption. The core idea is that once a client and server have successfully completed a TLS handshake, future handshakes should be streamlined — assuming that fundamental parameters such as the cipher suite or TLS version remain unchanged.
There are two primary mechanisms for session resumption: session IDs and session tickets. With session IDs, the server stores the session context and associates it with a unique session ID. When a client reconnects and presents this session ID in its ClientHello message, the server checks its cache. If the session is still valid, the handshake is resumed using the cached state.
Session tickets function in a stateless manner. Instead of storing session data, the server encrypts the session context and sends it to the client as a session ticket. In future connections, the client includes this ticket in its ClientHello, which the server can then decrypt to restore the session, eliminating the need for the server to maintain session state.
A resumed mTLS session leverages previously established trust, allowing clients to reconnect to a protected application without needing to re-initiate an mTLS handshake.
The mTLS resumption vulnerability
In Cloudflare’s mTLS implementation, however, session resumption introduced an unintended behavior. BoringSSL, the TLS library that Cloudflare uses, will store the client certificate from the originating, full TLS handshake in the session. Upon resuming that session, the client certificate is not revalidated against the full chain of trust, and the original handshake’s verification status is respected. To avoid this situation, BoringSSL provides an API to partition session caches/tickets between different “contexts” defined by the application. Unfortunately, Cloudflare’s use of this API was not correct, which allowed TLS sessions to be resumed when they shouldn’t have been.
To exploit this vulnerability, the security researcher first set up two zones on Cloudflare and configured them behind Cloudflare’s proxy with mTLS enabled. Once their domains were configured, the researcher authenticated to the first zone using a valid client certificate, allowing Cloudflare to issue a TLS session ticket against that zone.
The researcher then changed the TLS Server Name Indication (SNI) and HTTP Host header from the first zone (which they had authenticated with) to target the second zone (which they had not authenticated with). The researcher then presented the session ticket when handshaking with the second Cloudflare-protected mTLS zone. This resulted in Cloudflare resuming the session with the second zone and reporting verification status for the cached client certificate as successful,bypassing the mTLS authentication that would normally be required to initiate a session.
If you were using additional validation methods in your API Shield or Access policies – for example, checking the issuers SKI, identity verification, IP address restrictions, or device posture assessments – these controls continued to function as intended. However, due to the issue with TLS session resumption, the mTLS checks mistakenly returned a passing result without re-evaluating the full certificate chain.
Remediation and next steps
We have disabled TLS session resumption for all customers that have mTLS enabled. As a result, Cloudflare will no longer allow resuming sessions that cache client certificates and their verification status.
We are exploring ways to bring back the performance improvements from TLS session resumption for mTLS customers.
Further hardening
Customers can further harden their mTLS configuration and add enhanced logging to detect future issues by using Cloudflare’s Transform Rules, logging, and firewall features.
While Cloudflare has mitigated the issue by disabling session resumption for mTLS connections, customers may want to implement additional monitoring at their origin to enforce stricter authentication policies. All customers using mTLS can also enable additional request headers using our Managed Transforms product. Enabling this feature allows us to pass additional metadata to your origin with the details of the client certificate that was used for the connection.
Enabling this feature allows you to see the following headers where mTLS is being utilized on a request.
Customers already logging this information — either at their origin or via Cloudflare Logs — can retroactively check for unexpected certificate hashes or issuers that did not trigger any security policy.
Users are also able to use this information within their WAF custom rules to conduct additional checks. For example, checking the Issuer’s SKI can provide an extra layer of security.
Customers who enabled this additional check were not vulnerable.
Conclusion
We sincerely thank the security researcher who responsibly disclosed this issue via our HackerOne Bug Bounty Program, allowing us to identify and mitigate the vulnerability. We welcome further submissions from our community of researchers to continually improve our products’ security.
Finally, we want to apologize to our mTLS customers. Security is at the core of everything we do at Cloudflare, and we deeply regret any concerns this issue may have caused. We have taken immediate steps to resolve the vulnerability and have implemented additional safeguards to prevent similar issues in the future.
Timeline
All timestamps are in UTC
2025-01-23 15:40 – Cloudflare is notified of a vulnerability in Mutual TLS and the use of session resumption.
2025-01-23 16:02 to 21:06 – Cloudflare validates Mutual TLS vulnerability and prepares a release to disable session resumption for Mutual TLS.
2025-01-23 21:26 – Cloudflare begins rollout of remediation.
2025-01-24 20:15 – Rollout completed. Vulnerability is remediated.
AWS Firewall Manager is a powerful tool that organizations can use to define common AWS WAF rules with centralized security policies. These policies specify which accounts and resources are in scope. Firewall Manager creates a web access control list (web ACL) that adheres to the organization’s policy requirements and associates it with the in-scope resources. Figure 1 shows a Firewall Manager security policy and web ACL created in each in-scope account.
Figure 1: A Firewall Manager security policy and Firewall Manager created web ACLs in each in-scope account
In this post, we’ll talk about the benefits of retrofitting and how you can use this feature to allow Firewall Manager to manage existing web ACLs. When retrofitting is enabled, a Firewall Manager security policy doesn’t replace existing web ACLs. Instead, Firewall Manager adds the top and bottom rule sections to existing web ACLs associated with in-scope resources. For application teams, Firewall Manger no longer restricts how they configure and deploy AWS WAF. Teams can use either the AWS Management Console or infrastructure as code (IaC) tools to customize rules in web ACLs, even if those web ACLs are managed by Firewall Manager.
Firewall Manager before retrofitting
Firewall Manager offers significant benefits, but the existing approach results in several challenges:
Compatibility with infrastructure as code (IaC): Firewall Manager creates and associates AWS WAF web ACLs with in-scope resources. IaC tools expect to create and manage resources (in other words, own their lifecycle). Application teams cannot use IaC to manage the WAF rules and other web ACL configuration components that are created by Firewall Manager; there are custom solutions that inject locally defined rules into Firewall Manager-created web ACLs, but these are complex and have risks such as drift. For AWS WAF customers and application teams, this introduces an operational challenge.
Existing WAF migration: Customers who are already using AWS WAF must migrate existing rules to Firewall Manager-managed web ACLs.
Application-specific rule complexity: Forcing all in-scope resources in the same account and AWS Region to use the same web ACL makes application-specific or exception-based rules more complex. In addition, changes to one application’s rules could impact others that share the same web ACL.
Increased costs: When many applications share a single web ACL, application-specific rules are part of a single web ACL, which can increase total WAF capacity units (WCU) usage, sometimes resulting in higher AWS WAF request costs.
Firewall Manager with retrofitting addresses challenges
To address these challenges, Firewall Manager now offers the ability to retrofit existing web ACLs. Let’s get specific about when and how Firewall Manager retrofitting works:
Firewall Manager will only retrofit a web ACL when all associated resources (for example, Application Load Balancers, API Gateways, and Amazon CloudFront distributions) are in scope. If a not-in-scope resource is also associated, Firewall Manager will not retrofit or update future security policy changes to a retrofitted web ACL. In that scenario, associated in-scope resources and the web ACL are marked noncompliant with security policies.
Retrofitting only modifies customer-created web ACLs. Retrofitting will not act on web ACLs retrofitted by another security policy or managed by Firewall Manager. If either scenario occurs, the web ACL and associated resources are marked noncompliant with security policies.
Retrofitting adds the following on top of an existing web ACL that is associated with one or more in-scope resources:
Retrofitting adds first rule groups and last rule groups defined in a security policy to the web ACL. Existing rules within the web ACL are not changed. The order of rule evaluation changes is the following:
Security policy–defined first rule group rules
Security policy–defined last rule group rules
Retrofitting adds a WAF logging configuration if one is defined by the security policy. If the web ACL already has a logging configuration, Firewall Manager does not replace the existing logging configuration and marks the web ACL noncompliant.
Retrofitting does not verify or configure other attributes that are defined by the security policy. This includes the following properties: default action, custom request headers, web ACL Captcha or challenge configurations, and token domain list. These properties are used only when Firewall Manager creates a web ACL.
If an in-scope resource that supports AWS WAF does not have a web ACL, Firewall Manager creates and associates a Firewall Manager-managed web ACL with that resource.
Figure 2 shows the rules and logging configuration before and after a Firewall Manager security policy retrofits a web ACL that is associated with in-scope resources.
Figure 2: Using retrofitting to update an existing web ACL
This new retrofitting capability solves the previous challenges in the following ways:
IaC compatible: Application teams can provision and manage AWS WAF with IAC tools. Firewall Manager retrofits existing web ACLs by adding rules defined in the security policy to web ACLs created by IaC tools. Application teams can manage AWS WAF exactly the same as when Firewall Manager was not in use.
Existing WAF integration: Customers with existing AWS WAF deployments can adopt Firewall Manager without the need to migrate existing WAF rules.
Application-specific rules: Multiple resources in the same account can use separate web ACLs, which simplifies application-specific rules.
Help prevent additional costs: Application-specific rules are applied only to the relevant web ACLs. This helps prevent increased AWS WAF request costs from shared web ACLs that have a high WCU usage.
By enhancing Firewall Manager to retrofit existing web ACLs, customers can use the power of centralized WAF management without restricting how AWS WAF is deployed and configured by application teams in member accounts.
Firewall Manager security policy for AWS WAF – Enabling retrofitting
Figure 3 shows an example of a Firewall Manager security policy.
Figure 3: An example Firewall Manager security policy that uses the new Retrofit existing webACLs feature
This security policy defines WAF rules in the first rule group section. It applies to all Application Load Balancers (ALBs) across your organization in AWS Organizations in the Region where this security policy is created. The policy action is set to automatically remediate. Under Web ACL management, there is a new section, Managed web ACL source, with two options, Default and Retrofit existing webACLs. Default is the existing behavior: Firewall Manager creates and associates a Firewall Manager managed web ACL. Retrofit existing webACLs applies the WAF rules and logging configuration (if any) defined by a security policy to existing web ACLs when they are associated with an in-scope resource. This policy specifies Retrofit existing webACLs. If an in-scope resource does not have a web ACL, Firewall Manager still creates and associates a web ACL by default.
Retrofitting in action
Let’s walk through what happens when you set Managed web ACL source to Retrofit existing webACLs. Figure 4 shows two ALBs that are in-scope of our security policy, LoadBalancer1 and LoadBalancer2.
Figure 4: Two existing ALBs, one with an existing web ACL and the other without
LoadBalancer1 has the following characteristics:
LoadBalancer1 does NOT have a web ACL associated.
After the Firewall Manager security policy applies, LoadBalancer1 is associated with a Firewall Manager created web ACL, as shown in Figure 5.
Figure 5: LoadBalancer1 is now associated with a Firewall Manager managed and created web ACL
The Firewall Manager-created web ACL contains the WAF rules defined in the security policy.
LoadBalancer2 has the following characteristics:
LoadBalancer2 has an existing customer created web ACL associated with it, as shown in Figure 6.
Figure 6: LoadBalancer2 is associated with a customer-created web ACL
This web ACL was created by the application team with an application-specific rule. The web ACL could have been created with the AWS Management Console, AWS CloudFormation, or other IaC tools like Terraform.
After the Firewall Manager security policy takes effect, LoadBalancer2 remains associated with the existing customer-created web ACL MyCustomWebACL.
Retrofitting adds WAF rules in the first rule group according to the security policy, as shown in Figure 7. Existing WAF rules are not changed, and rules and other aspects of the web ACL are not changed and can continue to be managed exactly as you would without Firewall Manager present.
Figure 7: Firewall Manager has retrofitted a customer-created web ACL and added the security policy–defined first rule groups rules
Figure 8 shows that both ALBs are now compliant with our security policy. LoadBalancer1 has a web ACL created by Firewall Manager; future ALBs that don’t have a web ACL associated would also become associated to this web ACL. LoadBalancer2 is associated with a web ACL the application team previously created. The application-defined WAF rules are not changed and the WAF rules defined by the security policy are added to this web ACL.
Figure 8: Multiple ALBs in scope for the same security policy
Associate a web ACL with Firewall Manager already in place
Let’s continue from our previous scenario. The application team for LoadBalancer1 now configures application-specific rules for their ALB by using the following process.
The application team associates LoadBalancer1 with the custom web ACL.
Figure 9: From the web ACL, only LoadBalancer1 is associated with the app team’s web ACL
After a moment, Firewall Manager detects the change to an in-scope resource (LoadBalancer1). Firewall Manager retrofits the application team’s web ACL AppTeamNewWebACL, making it align with the security policy.
Figure 10: Firewall Manager has retrofitted the app team–created web ACL and added the security policy–defined first rule group rules
The diagram in Figure 11 shows the workflow that happens when the application team creates their own web ACL and associates it with LoadBalancer1. Firewall Manager detects the association change and retrofits the application team’s web ACL again, bringing LoadBalancer1 into alignment with security policies.
Figure 11: Firewall Manager retrofitting a web ACL in response to being associated with an existing in-scope resource
Out-of-scope resources associated with a retrofitted web ACL
Let’s make a change to our security policy. In Figure 12, the policy scope has been updated to only apply to resources when they have the resource tag Tier: Production. Application teams add this tag to LoadBalancer1 and LoadBalancer2.
Figure 12: The Firewall Manager security policy scope has been updated to include a resource tag
Later, an application team creates LoadBalancer3 and associates it with AppTeamNewWebACL (Figure 13).
Figure 13: A new ALB associated with a custom WAF web ACL
The application team does not tag LoadBalancer3, making it out of scope with the security policy, as shown in Figure 14.
Figure 14: A new ALB that is out of scope with a security policy
This web ACL is currently retrofitted by our security policy and associated with LoadBalancer2 (in-scope), as shown in Figure 15.
Figure 15: A retrofitted web ACL associated with in-scope and out-of-scope ALBs
Firewall Manager detects that an out-of-scope resource is associated with a retrofitted web ACL. As shown in Figure 16, Firewall Manager marks the web ACL AppTeamNewWebACL noncompliant. It also marks LoadBalancer2 noncompliant.
Figure 16: Shows retrofit-specific reasons a resource or web ACL will be marked noncompliant. In this case, a not-in-scope resource is associated with a web ACL where another associated resource is in-scope.
As long as the web ACL is noncompliant, Firewall Manager will not retrofit a non-retrofitted web ACL, and future security policy changes will not be applied to that web ACL. Existing retrofitted WAF rules for that web ACL are not modified or removed. When the web ACL later becomes compliant, it will again retrofit the latest state of the security policy. Figure 17 shows how Firewall Manager keeps the existing retrofitting but does not apply updates. Using our example, one of three things would need to happen for the web ACL to become compliant:
LoadBalancer3 can be made in-scope with the current security policy. The application team can then add the resource tag Tier: Production to this ALB.
The resource tag can be removed from the policy scope.
LoadBalancer3 can be disassociated with the web ACL.
Note: We recommend that you promptly address not-in-scope resources associated with web ACLs that are shared by in-scope resources. For example, if the preceding scenario was not addressed and LoadBalancer3 was deleted three months later, Firewall Manager would at that point retrofit the web ACL (3 months later). This is not necessarily a problem, but could trigger unexpected changes to a web ACL’s rules.
Figure 17: Firewall Manager retains existing but not future changes as long as a not-in-scope resource is associated with this web ACL
In summary: Firewall Manager initially retrofits and will apply future updates to existing web ACLs while all associated resources are in-scope. When an out-of-scope resource is associated, an initial retrofit is delayed and security policy retrofit updates are paused until the out-of-scope resource is addressed.
Figure 18 demonstrates how Firewall Manager will not perform an initial retrofit of a web ACL associated with both in-scope and not-in-scope resources.
Figure 18: Firewall Manger will only perform an initial retrofit when only in-scope resources are associated with a web ACL
Conclusion
Firewall Manager verifies that in-scope resources adhere to relevant security policies or are marked noncompliant. You can enable retrofitting for Firewall Manager for AWS WAF to seamlessly enforce these security policies without changing how your application teams manage the configuration of their WAF rules.
Note: Retrofitting is only available for AWS Firewall Manager security policies for AWS WAF; it is not available for AWS WAF Classic.
If you have feedback about this post, submit comments in the Comments section below. If you have questions about this post, start a new thread on the AWS Firewall Manager re:Post or contact AWS Support.
For many years, Cloudflare has used advanced fingerprinting techniques to help block online threats, in products like our DDoS engine, our WAF, and Bot Management. For the purposes of Bot Management, fingerprinting characteristic elements of client software help us quickly identify what kind of software is making an HTTP request. It’s an efficient and accurate way to differentiate a browser from a Python script, while preserving user privacy. These fingerprints are used on their own for simple rules, and they underpin complex machine learning models as well.
Making sure our fingerprints keep pace with the pace of change on the Internet is a constant and critical task. Bots will always adapt to try and look more browser-like. Less frequently, browsers will introduce major changes to their behavior and affect the entire Internet landscape. Last year, Google did exactly that, making older TLS fingerprints almost useless for identifying the latest version of Chrome.
Cloudflare network fingerprinting techniques
These methods are instrumental in accurately scoring and classifying bots, enhancing security measures, and enriching data analytics capabilities. Below are some examples of the fingerprinting techniques we have implemented over the years:
HTTP Signature: The HTTP Signature technique involves analyzing HTTP headers and other request attributes to create a unique signature for each client. This method is particularly useful for identifying and managing bot traffic, as it can detect inconsistencies between the HTTP signature and the claimed user-agent.
ClientHello fingerprint (v1 & v2): The ClientHello fingerprint technique involves analyzing the ClientHello message during the TLS handshake. This message contains various parameters, such as cipher suites, extensions, and supported groups, which can be used to create a unique fingerprint for each client. The first version of ClientHello fingerprint was introduced as part of Cloudflare’s broader TLS fingerprinting efforts, with subsequent improvements leading to version 2. These fingerprints help in identifying the client software and its configuration, providing a static identifier that can be used to detect anomalies and potential threats.
HTTP/2 fingerprint: HTTP/2 fingerprinting focuses on the unique characteristics of the HTTP/2 protocol, such as the settings frame, stream priority information, and the order of pseudo-header fields. Supported by all major browsers, this method was introduced to leverage the protocol’s binary framing layer, which provides a rich set of attributes for creating unique client fingerprints.
HTTP/3 and QUIC fingerprints: As HTTP/3 and the QUIC protocol gain popularity, Cloudflare has developed fingerprinting techniques tailored to these advanced protocols. Running over QUIC, HTTP/3 uses UDP and introduces unique handshake mechanisms, distinct from TCP-based protocols. Cloudflare’s techniques focus on specific attributes like QUIC version and transport parameters to generate precise fingerprints. These are vital for managing and identifying traffic, particularly in environments that heavily use Google products.
JA3 fingerprint: This TLS fingerprinting technique, introduced by Salesforce researchers in 2017 and later adopted by Cloudflare, involves creating a hash of the TLS ClientHello message. This hash includes the ordered list of TLS cipher suites, extensions, and other parameters, providing a unique identifier for each client. While JA3 is broadly utilized for detecting malicious activity and pinpointing specific client software, it shares similarities with Cloudflare’s proprietary ClientHello fingerprints (v1 & v2). However, the latter distinguish themselves by utilizing different components of the ClientHello message and employing alternative encoding schemes.
These fingerprinting techniques power Cloudflare’s Heuristic engine and machine learning models, both of which compute a Bot Score. This score assesses the likelihood — on a scale from 0 to 100 — of whether a request originated from an automated program (low score) or a human (high score). Additionally, these models leverage aggregated traffic statistics from all fingerprint types, and other dimensions, and integrate features throughout the OSI model’s layers (L1 to L7), enabling them to analyze every request for all customers. They provide sophisticated, real-time security analysis with inferences delivered at microsecond latency, providing prompt and precise responses to potential threats.
Limitations of JA3 fingerprint
In early 2023, Google implemented a change in Chromium-based browsers to shuffle the order of TLS extensions – a strategy aimed at disrupting the detection capabilities of JA3 and enhancing the robustness of the TLS ecosystem. This modification was prompted by concerns that fixed fingerprint patterns could lead to rigid server implementations, potentially causing complications each time Chrome updates were rolled out. Over time, JA3 became less useful due to the following reasons:
Randomization of TLS extensions: Browsers began randomizing the order of TLS extensions in their ClientHello messages. This change meant that the JA3 fingerprints, which relied on the sequential order of these extensions, would vary with each connection, making it unreliable for identifying unique clients. (Further information can be found at Stamus Networks.)
Inconsistencies across tools: Different tools and databases that implemented JA3 fingerprinting often produced varying results due to discrepancies in how they handled TLS extensions and other protocol elements. This inconsistency hindered the effectiveness of JA3 fingerprints for reliable cross-organization sharing and threat intelligence. (Further information can be found at Fingerprint.)
Vulnerability to evasion: While the static and simplistic nature of JA3 made it vulnerable to evasion, Cloudflare’s proprietary ClientHello fingerprint v2 (CHFPv2) addressed this challenge by accounting for the randomization of TLS extensions. In our internal implementations, TLS extensions are sorted before being incorporated into the fingerprint, effectively mitigating the impact of randomization for Cloudflare customers.
Limited scope and lack of adaptability: JA3 focused solely on elements within the TLS ClientHello packet, covering only a narrow portion of the OSI model’s layers. This limited scope often missed crucial context about a client’s environment. Additionally, as newer transport layer protocols like QUIC became popular, JA3’s methodology – originally designed for older versions of TLS and excluding modern protocols – proved ineffective.
Enter JA4 fingerprint
In response to these challenges, FoxIO developed JA4, a successor to JA3 that offers a more robust, adaptable, and reliable method for fingerprinting TLS clients across various protocols, including emerging standards like QUIC. Officially launched in September 2023, JA4 is part of the broader JA4+ suite that includes fingerprints for multiple protocols such as TLS, HTTP, and SSH. This suite is designed to be interpretable by both humans and machines, thereby enhancing threat detection and security analysis capabilities.
JA4 fingerprint is resistant to the randomization of TLS extensions and incorporates additional useful dimensions, such as Application Layer Protocol Negotiation (ALPN), which were not part of JA3. The introduction of JA4 has been met with positive reception in the cybersecurity community, with several open-source tools and commercial products beginning to incorporate it into their systems, including Cloudflare. The JA4 fingerprint is available under the BSD 3-Clause license, promoting seamless upgrades from JA3. Other fingerprints within the suite, such as JA4S (TLS Server Response) and JA4H (HTTP Client Fingerprinting), are licensed under the proprietary FoxIO License, which is designed for broader use but requires specific arrangements for commercial monetization.
Let’s take a look at specific JA4 fingerprint example, representing the latest version of Google Chrome on Linux:
Protocol Identifier (t): Indicates the use of TLS over TCP. This identifier is crucial for determining the underlying protocol, distinguishing it from q for QUIC or d for DTLS.
TLS Version (13): Represents TLS version 1.3, confirming that the client is using one of the latest secure protocols. The version number is derived from analyzing the highest version supported in the ClientHello, excluding any GREASE values.
SNI Presence (d): The presence of a domain name in the Server Name Indication. This indicates that the client specifies a domain (d), rather than an IP address (it would indicate the absence of SNI).
Cipher Suites Count (15): Reflects the total number of cipher suites included in the ClientHello, excluding any GREASE values. It provides insight into the cryptographic options the client is willing to use.
Extensions Count (16): Indicates the count of distinct extensions presented by the client in the ClientHello. This measure helps identify the range of functionalities or customizations the client supports.
ALPN Values (h2): Represents the Application-Layer Protocol Negotiation protocol, in this case, HTTP/2, which indicates the protocol preferences of the client for optimized web performance.
Cipher Hash (8daaf6152771): A truncated SHA256 hash of the list of cipher suites, sorted in hexadecimal order. This unique hash serves as a compact identifier for the client’s cipher suite preferences.
Extension Hash (02713d6af862): A truncated SHA256 hash of the sorted list of extensions combined with the list of signature algorithms. This hash provides a unique identifier that helps differentiate clients based on the extensions and signature algorithms they support.
Integrating JA4 support into Cloudflare required rethinking our approach to parsing TLS ClientHello messages, which were previously handled in separate implementations across C, Lua, and Go. Recognizing the need to boost performance and ensure memory safety, we developed a new Rust-based crate, client-hello-parser. This unified parser not only simplifies modifications by centralizing all related logic but also prepares us for future transitions, such as replacing nginx with an upcoming Rust-based service. Additionally, this streamlined parser facilitates the exposure of JA4 fingerprints across our platform, improving the integration with Cloudflare’s firewall rules, Workers, and analytics systems.
Parsing ClientHello
client-hello-parser is an internal Rust crate designed for parsing TLS ClientHello messages. It aims to simplify the process of analyzing TLS traffic by providing a straightforward way to decode and inspect the initial handshake messages sent by clients when establishing TLS connections. This crate efficiently populates a ClientHelloParsed struct with relevant parsed fields, including version 1 and version 2 fingerprints, and JA3 and JA4 hashes, which are essential for network traffic analysis and fingerprinting.
Key benefits of the client-hello-parser library include:
Optimized memory usage: The library achieves amortized zero heap allocations, verified through extensive testing with the dhat crate to track memory allocations. Utilizing the tiny_vec crate, it begins with stack allocations for small vectors backed by fixed-size arrays, resorting to heap allocations only when these vectors exceed their initial size. This method ensures efficient reuse of all vectors, maintaining amortized zero heap allocations.
Memory safety: Reinforced by Rust’s robust borrow checker and complemented by extensive fuzzing, which has helped identify and resolve potential security vulnerabilities previously undetected in C implementations.
Ultra-low latency: The parser benefits from using faster_hex for efficient hex encoding/decoding, which utilizes SIMD instructions to speed up processing. The use of Rust iterators also helps in optimizing performance, often allowing the compiler to generate SIMD-optimized assembly code. This efficiency is further enhanced through the use of BigEndianIterator, which allows for efficient streaming-like processing of TLS ClientHello bytes in a single pass.
The benchmark results demonstrate that the parser efficiently handles different sizes of ClientHello messages, with shorter messages being processed at a rate of approximately 2 million elements per second, and longer messages at around 1 million elements per second, showcasing the effectiveness of SIMD optimizations and Rust’s iterator performance in real-world applications.
Robust testing suite: Includes dozens of real-life TLS ClientHello message examples, with parsed components verified against Wireshark with JA3 and JA4 plugins. Additionally, Cargo fuzzer with memory sanitizer ensures no memory leaks or edge cases leading to core dumps. Backward compatibility tests with the legacy C parser, imported as a dependency and called via FFI, confirm that both parsers yield equivalent results.
Seamless integration with nginx: The crate, compiled as a dynamic library, is linked to the nginx binary, ensuring a smooth transition from the legacy parser to the new Rust-based parser through backwards compatibility tests.
The transition to a new Rust-based parser has enabled the retirement of multiple implementations across different languages (C, Lua, and Go), significantly enhancing performance and parser robustness against edge cases. This shift also facilitates the easier integration of new features and business logic for parsing TLS ClientHello messages, streamlining future expansions and security updates.
With Cloudflare JA4 fingerprints implemented on our network, we were left with another problem to solve. When JA3 was released, we saw some scenarios where customers were surprised by traffic from a new JA3 fingerprint and blocked it, only to find the fingerprint was a new browser release, or an OS update had caused a change in the fingerprint used by their mobile device. By giving customers just a hash, customers still lack context. We wanted to give our customers the necessary context to help them make informed decisions about the safety of a fingerprint, so they can act quickly and confidently on it. As more of our customers embrace AI, we’ve heard more demand from our customers to break out the signals that power our bot detection. These customers want to run complex models on proprietary data that has to stay in their control, but they want to have Cloudflare’s unique perspective on Internet traffic when they do it. To us, both use cases sounded like the same problem.
Enter JA4 Signals
In the ever-evolving landscape of web security, traditional fingerprinting techniques like JA3 and JA4 have proven invaluable for identifying and managing web traffic. However, these methods alone are not sufficient to address the sophisticated tactics employed by malicious agents. Fingerprints can be easily spoofed, they change frequently, and traffic patterns and behaviors are constantly evolving. This is where JA4 Signals come into play, providing a robust and comprehensive approach to traffic analysis.
JA4 Signals are inter-request features computed based on the last hour of all traffic that Cloudflare sees globally. On a daily basis, we analyze over 15 million unique JA4 fingerprints generated from more than 500 million user agents and billions of IP addresses. This breadth of data enables JA4 Signals to provide aggregated statistics that offer deeper insights into global traffic patterns – far beyond what single-request or connection fingerprinting can achieve. These signals are crucial for enhancing security measures, whether through simple firewall rules, Workers scripts, or advanced machine learning models.
Let’s consider a specific example of JA4 Signals from a Firewall events activity log, which involves the latest version of Chrome:
This example highlights that a particular HTTP request received a Bot Score of 95, suggesting it likely originated from a human user operating a browser rather than an automated program or a bot. Please note that ratio and quantile-based signal values fall within the range of [0.0 to 1.0], whereas rank-based signal values are integer values within the range of [1 to N]. Analyzing JA4 Signals in this context provides deeper insight into the behavior of this client (latest Linux Chrome) in comparison to other network clients and their respective JA4 fingerprints:
JA4 Signal
Description
Value example
Interpretation
browser_ratio_1h
The ratio of requests originating from browser-based user agents for the JA4 fingerprint in the last hour. Higher values suggest a higher proportion of browser-based requests.
0.942
Indicates a 94.2% browser-based request rate for this JA4.
cache_ratio_1h
The ratio of cacheable responses for the JA4 fingerprint in the last hour. Higher values suggest a higher proportion of responses that can be cached.
0.534
Shows a 53.4% cacheable response rate for this JA4.
h2h3_ratio_1h
The ratio of HTTP/2 and HTTP/3 requests combined with the total number of requests for the JA4 fingerprint in the last hour. Higher values indicate a higher proportion of HTTP/2 and HTTP/3 requests compared to other protocol versions.
0.987
Reflects a 98.7% rate of HTTP/2 and HTTP/3 requests.
heuristic_ratio_1h
The ratio of requests with a scoreSrc value of “heuristics” for the JA4 fingerprint in the last hour. Higher values suggest a larger proportion of requests being flagged by heuristic-based scoring.
0.007
Suggests a 0.7% rate of heuristic-based scoring for requests.
ips_quantile_1h
The quantile position of the JA4 fingerprint based on the number of unique client IP addresses across all fingerprints in the last hour. Higher values indicate a relatively higher number of distinct client IPs compared to other fingerprints.
1
Indicates a high diversity of client IPs for this JA4.
ips_rank_1h
The rank of the JA4 fingerprint based on the number of unique client IP addresses across all fingerprints in the last hour. Lower values indicate a higher number of distinct client IPs associated with the fingerprint.
2
High volume of IPs compared to other JA4s.
paths_rank_1h
The rank of the JA4 fingerprint based on the number of unique request paths across all fingerprints in the last hour. Lower values indicate a higher diversity of request paths associated with the fingerprint.
2
High diversity of request paths.
reqs_quantile_1h
The quantile position of the JA4 fingerprint based on the number of requests across all fingerprints in the last hour. Higher values indicate a relatively higher number of requests compared to other fingerprints.
1
High volume of requests compared to other JA4s.
reqs_rank_1h
The rank of the JA4 fingerprint based on the number of requests across all fingerprints in the last hour. Lower values indicate a higher number of requests associated with the fingerprint.
2
High request count for this JA4.
uas_rank_1h
The rank of the JA4 fingerprint based on the number of distinct user agents across all fingerprints in the last hour. Lower values indicate a higher diversity of user agents associated with the fingerprint.
1
Highest diversity of user agents for this JA4.
The JA4 fingerprint and JA4 Signals are now available in the Firewall Rules UI, Bot Analytics and Workers. Customers can now use these fields to write custom rules, rate-limiting rules, transform rules, or Workers logic using JA4 fingerprint and JA4 Signals.
Let’s demonstrate how to use JA4 Signals with the following Worker example. This script processes incoming requests by parsing and categorizing JA4 Signals, providing a clear structure for further analysis or rule application within Cloudflare Workers:
/**
 * Event listener for 'fetch' events. This triggers on every request to the worker.
 */
addEventListener('fetch', event => {
  event.respondWith(handleRequest(event.request))
})

/**
 * Main handler for incoming requests.
 * @param {Request} request - The incoming request object from the fetch event.
 * @returns {Response} A response object with JA4 Signals in JSON format.
 */
async function handleRequest(request) {
  // Safely access the ja4Signals object using optional chaining, which prevents errors if properties are undefined.
  const ja4Signals = request.cf?.botManagement?.ja4Signals || {};

  // Construct the response content, including both the original ja4Signals and the parsed signals.
  const responseContent = {
    ja4Signals: ja4Signals,
    jaSignalsParsed: parseJA4Signals(ja4Signals)
  };

  // Return a JSON response with appropriate headers.
  return new Response(JSON.stringify(responseContent), {
    status: 200,
    headers: {
      "content-type": "application/json;charset=UTF-8"
    }
  })
}

/**
 * Parses the JA4 Signals into categorized groups based on their names.
 * @param {Object} ja4Signals - The JA4 Signals object that may contain various metrics.
 * @returns {Object} An object with categorized JA4 Signals: ratios, ranks, and quantiles.
 */
function parseJA4Signals(ja4Signals) {
  // Define the keys for each category of signals.
  const ratios = ['h2h3_ratio_1h', 'heuristic_ratio_1h', 'browser_ratio_1h', 'cache_ratio_1h'];
  const ranks = ['uas_rank_1h', 'paths_rank_1h', 'reqs_rank_1h', 'ips_rank_1h'];
  const quantiles = ['reqs_quantile_1h', 'ips_quantile_1h'];

  // Return an object with each category containing only the signals that are present.
  return {
    ratios: filterKeys(ja4Signals, ratios),
    ranks: filterKeys(ja4Signals, ranks),
    quantiles: filterKeys(ja4Signals, quantiles)
  };
}

/**
 * Filters the keys in the ja4Signals object that match the list of specified keys and are not undefined.
 * @param {Object} ja4Signals - The JA4 Signals object.
 * @param {Array<string>} keys - An array of keys to filter from the ja4Signals object.
 * @returns {Object} A filtered object containing only the specified keys that are present in ja4Signals.
 */
function filterKeys(ja4Signals, keys) {
  const filtered = {};
  // Iterate over the specified keys and add them to the filtered object if they exist in ja4Signals.
  keys.forEach(key => {
    // Check if the key exists and is not undefined to handle optional presence of each signal.
    if (ja4Signals && ja4Signals[key] !== undefined) {
      filtered[key] = ja4Signals[key];
    }
  });
  return filtered;
}
When JA4 Signals are present, the output from the Worker might look like this:
Comprehensive traffic analysis: JA4 Signals aggregate data over an hour to provide a holistic view of traffic patterns. This method enhances the ability to identify emerging threats and abnormal behaviors by analyzing changes over time rather than in isolation.
Precision in anomaly detection: Leveraging detailed inter-request features, JA4 Signals enable the precise detection of anomalies that may be overlooked by single-request fingerprinting. This leads to more accurate identification of sophisticated cyber threats.
Globally scalable insights: By synthesizing data at a global scale, JA4 Signals harness the strength of Cloudflare’s network intelligence. This extensive analysis makes the system less susceptible to manipulation and provides a resilient foundation for security protocols.
Dynamic security enforcement: JA4 Signals can dynamically inform security rules, from simple firewall configurations to complex machine learning algorithms. This adaptability ensures that security measures evolve in tandem with changing traffic patterns and emerging threats.
Reduction in false positives and negatives: With the detailed insights provided by JA4 Signals, security systems can distinguish between legitimate and malicious traffic more effectively, reducing the occurrence of false positives and negatives and improving overall system reliability.
Conclusion
The introduction of JA4 fingerprint and JA4 Signals marks a significant milestone in advancing Cloudflare’s security offerings, including Bot Management and DDoS protection. These tools not only enhance the robustness of our traffic analysis but also showcase the continuous evolution of our network fingerprinting techniques. The efficiency of computing JA4 fingerprints enables real-time detection and response to emerging threats. Similarly, by leveraging aggregated statistics and inter-request features, JA4 Signals provide deep insights into traffic patterns at speeds measured in microseconds, ensuring that no detail is too small to be captured and analyzed.
These security features are underpinned by the scalable techniques and open-sourced libraries outlined in “Every request, every microsecond: scalable machine learning at Cloudflare”. This discussion highlights how Cloudflare’s innovations not only analyze vast amounts of data but also transform this analysis into actionable, reliable, and dynamically adaptable security measures.
Any Enterprise business with a bot problem will benefit from Cloudflare’s unique JA4 implementation and our perspective on bot traffic, but customers who run their own internal threat models will also benefit from access to data insights from a network that processes over 50 million requests per second. Please get in touch with us to learn more about our Bot Management offering.
We made our WAF Machine Learning models 5.5x faster, reducing execution time by approximately 82%, from 1519 to 275 microseconds! Read on to find out how we achieved this remarkable improvement.
WAF Attack Score is Cloudflare’s machine learning (ML)-powered layer built on top of our Web Application Firewall (WAF). Its goal is to complement the WAF and detect attack bypasses that we haven’t encountered before. This has proven invaluable in catching zero-day vulnerabilities, like the one detected in Ivanti Connect Secure, before they are publicly disclosed and enhancing our customers’ protection against emerging and unknown threats.
Since its launch in 2022, WAF attack score adoption has grown exponentially, now protecting millions of Internet properties and running real-time inference on tens of millions of requests per second. The feature’s popularity has driven us to seek performance improvements, enabling even broader customer use and enhancing Internet security.
In this post, we will discuss the performance optimizations we’ve implemented for our WAF ML product. We’ll guide you through specific code examples and benchmark numbers, demonstrating how these enhancements have significantly improved our system’s efficiency. Additionally, we’ll share the impressive latency reduction numbers observed after the rollout.
Before diving into the optimizations, let’s take a moment to review the inner workings of the WAF Attack Score, which powers our WAF ML product.
WAF Attack Score system design
Cloudflare’s WAF attack score identifies various traffic types and attack vectors (SQLi, XSS, Command Injection, etc.) based on structural or statistical content properties. Here’s how it works during inference:
HTTP Request Content: Start with raw HTTP input.
Normalization & Transformation: Standardize and clean the data, applying normalization, content substitutions, and de-duplication.
Feature Extraction: Tokenize the transformed content to generate statistical and structural data.
Machine Learning Model Inference: Analyze the extracted features with pre-trained models, mapping content representations to classes (e.g., XSS, SQLi or RCE) or scores.
Classification Output in WAF: Assign a score to the input, ranging from 1 (likely malicious) to 99 (likely clean), guiding security actions.
Next, we will explore feature extraction and inference optimizations.
Feature extraction optimizations
In the context of the WAF Attack Score ML model, feature extraction or pre-processing is essentially a process of tokenizing the given input and producing a float tensor of 1 x m size:
In our initial pre-processing implementation, this is achieved via a sliding window of 3 bytes over the input with the help of Rust’s std::collections::HashMap to look up the tensor index for a given ngram.
Initial benchmarks
To establish performance baselines, we’ve set up four benchmark cases representing example inputs of various lengths, ranging from 44 to 9482 bytes. Each case exemplifies typical input sizes, including those for a request body, user agent, and URI. We run benchmarks using the Criterion.rs statistics-driven micro-benchmarking tool:
Here are initial numbers for these benchmarks executed on a Linux laptop with a 13th Gen Intel® Core™ i7-13800H processor:
Benchmark case
Pre-processing time, μs
Throughput, MiB/s
preprocessing/long-body-9482
248.46
36.40
preprocessing/avg-body-1000
28.19
33.83
preprocessing/avg-url-44
1.45
28.94
preprocessing/avg-ua-91
2.87
30.24
An important observation from these results is that pre-processing time correlates with the length of the input string, with throughput ranging from 28 MiB/s to 36 MiB/s. This suggests that considerable time is spent iterating over longer input strings. Optimizing this part of the process could significantly enhance performance. The dependency of processing time on input size highlights a key area for performance optimization. To validate this, we should examine where the processing time is spent by analyzing flamegraphs created from a 100-second profiling session visualized using pprof:
Looking at the pre-processing flamegraph above, it’s clear that most of the time was spent on the following two operations:
Function name
% Time spent
std::collections::hash::map::HashMap<K,V,S>::get
61.8%
regex::regex::bytes::Regex::replace_all
18.5%
Let’s tackle the HashMap lookups first. Lookups are happening inside the tensor_populate_ngrams function, where input is split into windows of 3 bytes representing ngram and then lookup inside two hash maps:
fn tensor_populate_ngrams(tensor: &mut [f32], input: &[u8]) {
   // Populate the NORM ngrams
   let mut unknown_norm_ngrams = 0;
   let norm_offset = 1;

   for s in input.windows(3) {
       match NORM_VOCAB.get(s) {
           Some(pos) => {
               tensor[*pos as usize + norm_offset] += 1.0f32;
           }
           None => {
               unknown_norm_ngrams += 1;
           }
       };
   }

   // Populate the SIG ngrams
   let mut unknown_sig_ngrams = 0;
   let sig_offset = norm_offset + NORM_VOCAB.len();

   let res = SIG_REGEX.replace_all(&input, b"#");

   for s in res.windows(3) {
       match SIG_VOCAB.get(s) {
           Some(pos) => {
               // adding +1 here as the first position will be the unknown_sig_ngrams
               tensor[*pos as usize + sig_offset + 1] += 1.0f32;
           }
           None => {
               unknown_sig_ngrams += 1;
           }
       }
   }
}
So essentially the pre-processing function performs a ton of hash map lookups, the volume of which depends on the size of the input string, e.g. 1469 lookups for the given benchmark case avg-body-1000.
Optimization attempt #1: HashMap → Aho-Corasick
Rust hash maps are generally quite fast. However, when that many lookups are being performed, it’s not very cache friendly.
So can we do better than hash maps, and what should we try first? The answer is the Aho-Corasick library.
This library provides multiple pattern search principally through an implementation of the Aho-Corasick algorithm, which builds a fast finite state machine for executing searches in linear time.
We can also tune Aho-Corasick settings based on this recommendation:
Then we use the constructed AhoCorasick dictionary to lookup ngrams using its find_overlapping_iter method:
for mat in NORM_VOCAB_AC.find_overlapping_iter(&input) {
    tensor_input_data[mat.pattern().as_usize() + 1] += 1.0;
}
We ran benchmarks and compared them against the baseline times shown above:
Benchmark case
Baseline time, μs
Aho-Corasick time, μs
Optimization
preprocessing/long-body-9482
248.46
129.59
-47.84% or 1.64x
preprocessing/avg-body-1000
28.19
16.47
-41.56% or 1.71x
preprocessing/avg-url-44
1.45
1.01
-30.38% or 1.44x
preprocessing/avg-ua-91
2.87
1.90
-33.60% or 1.51x
That’s substantially better – Aho-Corasick DFA does wonders.
Optimization attempt #2: Aho-Corasick → match
One would think optimization with Aho-Corasick DFA is enough and that it seems unlikely that anything else can beat it. Yet, we can throw Aho-Corasick away and simply use the Rust match statement and let the compiler do the optimization for us!
Here’s how it performs in practice, based on the assembly generated by the Godbolt compiler explorer. The corresponding assembly code efficiently implements this lookup by employing a jump table and byte-wise comparisons to determine the return value based on input sequences, optimizing for quick decisions and minimal branching. Although the example only includes ten ngrams, it’s important to note that in applications like our WAF Attack Score ML models, we deal with thousands of ngrams. This simple match-based approach outshines both HashMap lookups and the Aho-Corasick method.
Benchmark case
Baseline time, μs
Match time, μs
Optimization
preprocessing/long-body-9482
248.46
112.96
-54.54% or 2.20x
preprocessing/avg-body-1000
28.19
13.12
-53.45% or 2.15x
preprocessing/avg-url-44
1.45
0.75
-48.37% or 1.94x
preprocessing/avg-ua-91
2.87
1.4076
-50.91% or 2.04x
Switching to match gave us another 7-18% drop in latency, depending on the case.
Optimization attempt #3: Regex → WindowedReplacer
So, what exactly is the purpose of Regex::replace_all in pre-processing? Regex is defined and used like this:
pub static SIG_REGEX: Lazy<Regex> =
    Lazy::new(|| RegexBuilder::new("[a-z]+").unicode(false).build().unwrap());
    ...
    let res = SIG_REGEX.replace_all(&input, b"#");
    for s in res.windows(3) {
        tensor[sig_vocab_lookup(s.try_into().unwrap())] += 1.0;
    }
Essentially, all we need is to:
Replace every sequence of lowercase letters in the input with a single byte “#”.
Iterate over replaced bytes in a windowed fashion with a step of 3 bytes representing an ngram.
Look up the ngram index and increment it in the tensor.
This logic seems simple enough that we could implement it more efficiently with a single pass over the input and without any allocations:
type Window = [u8; 3];
type Iter<'a> = Peekable<std::slice::Iter<'a, u8>>;

pub struct WindowedReplacer<'a> {
    window: Window,
    input_iter: Iter<'a>,
}

#[inline]
fn is_replaceable(byte: u8) -> bool {
    matches!(byte, b'a'..=b'z')
}

#[inline]
fn next_byte(iter: &mut Iter) -> Option<u8> {
    let byte = iter.next().copied()?;
    if is_replaceable(byte) {
        while iter.next_if(|b| is_replaceable(**b)).is_some() {}
        Some(b'#')
    } else {
        Some(byte)
    }
}

impl<'a> WindowedReplacer<'a> {
    pub fn new(input: &'a [u8]) -> Option<Self> {
        let mut window: Window = Default::default();
        let mut iter = input.iter().peekable();
        for byte in window.iter_mut().skip(1) {
            *byte = next_byte(&mut iter)?;
        }
        Some(WindowedReplacer {
            window,
            input_iter: iter,
        })
    }
}

impl<'a> Iterator for WindowedReplacer<'a> {
    type Item = Window;

    #[inline]
    fn next(&mut self) -> Option<Self::Item> {
        for i in 0..2 {
            self.window[i] = self.window[i + 1];
        }
        let byte = next_byte(&mut self.input_iter)?;
        self.window[2] = byte;
        Some(self.window)
    }
}
By utilizing the WindowedReplacer, we simplify the replacement logic:
if let Some(replacer) = WindowedReplacer::new(&input) {
    for ngram in replacer.windows(3) {
        tensor[sig_vocab_lookup(ngram.try_into().unwrap())] += 1.0;
    }
}
This new approach not only eliminates the need for allocating additional buffers to store replaced content, but also leverages Rust’s iterator optimizations, which the compiler can more effectively optimize. You can view an example of the assembly output for this new iterator at the provided Godbolt link.
Now let’s benchmark this and compare against the original implementation:
Benchmark case
Baseline time, μs
Match time, μs
Optimization
preprocessing/long-body-9482
248.46
51.00
-79.47% or 4.87x
preprocessing/avg-body-1000
28.19
5.53
-80.36% or 5.09x
preprocessing/avg-url-44
1.45
0.40
-72.11% or 3.59x
preprocessing/avg-ua-91
2.87
0.69
-76.07% or 4.18x
The new letters replacement implementation has doubled the preprocessing speed compared to the previously optimized version using match statements, and it is four to five times faster than the original version!
Optimization attempt #4: Going nuclear with branchless ngram lookups
At this point, 4-5x improvement might seem like a lot and there is no point pursuing any further optimizations. After all, using an ngram lookup with a match statement has beaten the following methods, with benchmarks omitted for brevity:
A Rust crate that allows you to use static compile-time generated hash maps and hash sets using PTHash perfect hash functions.
However, if we look again at the assembly of the norm_vocab_lookup function, it is clear that the execution flow has to perform a bunch of comparisons using cmp instructions. This creates many branches for the CPU to handle, which can lead to branch mispredictions. Branch mispredictions occur when the CPU incorrectly guesses the path of execution, causing delays as it discards partially completed instructions and fetches the correct ones. By reducing or eliminating these branches, we can avoid these mispredictions and improve the efficiency of the lookup process. How can we get rid of those branches when there is a need to look up thousands of unique ngrams?
Since there are only 3 bytes in each ngram, we can build two lookup tables of 256 x 256 x 256 size, storing the ngram tensor index. With this naive approach, our memory requirements will be: 256 x 256 x 256 x 2 x 2 = 64 MB, which seems like a lot.
However, given that we only care about ASCII bytes 0..127, then memory requirements can be lower: 128 x 128 x 128 x 2 x 2 = 8 MB, which is better. However, we will need to check for bytes >= 128, which will introduce a branch again.
So can we do better? Considering that the actual number of distinct byte values used in the ngrams is significantly less than the total possible 256 values, we can reduce memory requirements further by employing the following technique:
1. To avoid the branching caused by comparisons, we use precomputed offset lookup tables. This means instead of comparing each byte of the ngram during each lookup, we precompute the positions of each possible byte in a lookup table. This way, we replace the comparison operations with direct memory accesses, which are much faster and do not involve branching. We build an ngram bytes offsets lookup const array, storing each unique ngram byte offset position multiplied by the number of unique ngram bytes:
const NGRAM_OFFSETS: [[u32; 256]; 3] = [
    [
        // offsets of first byte in ngram
    ],
    [
        // offsets of second byte in ngram
    ],
    [
        // offsets of third byte in ngram
    ],
];
2. Then to obtain the ngram index, we can use this simple const function:
#[inline]
const fn ngram_index(ngram: [u8; 3]) -> usize {
    (NGRAM_OFFSETS[0][ngram[0] as usize]
        + NGRAM_OFFSETS[1][ngram[1] as usize]
        + NGRAM_OFFSETS[2][ngram[2] as usize]) as usize
}
3. To look up the tensor index based on the ngram index, we construct another const array at compile time using a list of all ngrams, where N is the number of unique ngram bytes:
4. Finally, to update the tensor based on given ngram, we lookup the ngram index, then the tensor index, and then increment it with help of get_unchecked_mut, which avoids unnecessary (in this case) boundary checks and eliminates another source of branching:
This logic works effectively, passes correctness tests, and most importantly, it’s completely branchless! Moreover, the memory footprint of used lookup arrays is tiny – just ~500 KiB of memory – which easily fits into modern CPU L2/L3 caches, ensuring that expensive cache misses are rare and performance is optimal.
The last trick we will employ is loop unrolling for ngrams processing. By taking 6 ngrams (corresponding to 8 bytes of the input array) at a time, the compiler can unroll the second loop and auto-vectorize it, leveraging parallel execution to improve performance:
const CHUNK_SIZE: usize = 6;

let chunks_max_offset =
    ((input.len().saturating_sub(2)) / CHUNK_SIZE) * CHUNK_SIZE;
for i in (0..chunks_max_offset).step_by(CHUNK_SIZE) {
    for ngram in input[i..i + CHUNK_SIZE + 2].windows(3) {
        update_tensor_with_ngram(tensor, ngram.try_into().unwrap());
    }
}
Tying up everything together, our final pre-processing benchmarks show the following:
Benchmark case
Baseline time, μs
Branchless time, μs
Optimization
preprocessing/long-body-9482
248.46
21.53
-91.33% or 11.54x
preprocessing/avg-body-1000
28.19
2.33
-91.73% or 12.09x
preprocessing/avg-url-44
1.45
0.26
-82.34% or 5.66x
preprocessing/avg-ua-91
2.87
0.43
-84.92% or 6.63x
The longer input is, the higher the latency drop will be due to branchless ngram lookups and loop unrolling, ranging from six to twelve times faster than baseline implementation.
After trying various optimizations, the final version of pre-processing retains optimization attempts 3 and 4, using branchless ngram lookup with offset tables and a single-pass non-allocating replacement iterator.
There are potentially more CPU cycles left on the table, and techniques like memory pre-fetching and manual SIMD intrinsics could speed this up a bit further. However, let’s now switch gears into looking at inference latency a bit closer.
Model inference optimizations
Initial benchmarks
Let’s have a look at original performance numbers of the WAF Attack Score ML model, which uses TensorFlow Lite 2.6.0:
Benchmark case
Inference time, μs
inference/long-body-9482
247.31
inference/avg-body-1000
246.31
inference/avg-url-44
246.40
inference/avg-ua-91
246.88
Model inference is actually independent of the original input length, as inputs are transformed into tensors of predetermined size during the pre-processing phase, which we optimized above. From now on, we will refer to a singular inference time when benchmarking our optimizations.
Digging deeper with profiler, we observed that most of the time is spent on the following operations:
The most expensive operation is matrix multiplication, which boils down to iteration within three nested loops:
void PortableMatrixBatchVectorMultiplyAccumulate(const float* matrix,
                                                 int m_rows, int m_cols,
                                                 const float* vector,
                                                 int n_batch, float* result) {
  float* result_in_batch = result;
  for (int b = 0; b < n_batch; b++) {
    const float* matrix_ptr = matrix;
    for (int r = 0; r < m_rows; r++) {
      float dot_prod = 0.0f;
      const float* vector_in_batch = vector + b * m_cols;
      for (int c = 0; c < m_cols; c++) {
        dot_prod += *matrix_ptr++ * *vector_in_batch++;
      }
      *result_in_batch += dot_prod;
     ++result_in_batch;
    }
  }
}
This doesn’t look very efficient and many blogs and research papers have been written on how matrix multiplication can be optimized, which basically boils down to:
Blocking: Divide matrices into smaller blocks that fit into the cache, improving cache reuse and reducing memory access latency.
Vectorization: Use SIMD instructions to process multiple data points in parallel, enhancing efficiency with vector registers.
Loop Unrolling: Reduce loop control overhead and increase parallelism by executing multiple loop iterations simultaneously.
To gain a better understanding of how these techniques work, we recommend watching this video, which brilliantly depicts the process of matrix multiplication:
Tensorflow Lite with AVX2
TensorFlow Lite does, in fact, support SIMD matrix multiplication – we just need to enable it and re-compile the TensorFlow Lite library:
if [[ "$(uname -m)" == x86_64* ]]; then
    # On x86_64 target x86-64-v3 CPU to enable AVX2 and FMA.
    arguments+=("--copt=-march=x86-64-v3")
fi
After running profiler again using the SIMD-optimized TensorFlow Lite library:
Matrix multiplication now uses AVX2 instructions, which uses blocks of 8×8 to multiply and accumulate the multiplication result.
Proportionally, matrix multiplication and quantization operations take a similar time share when compared to non-SIMD version, however in absolute numbers, it’s almost twice as fast when SIMD optimizations are enabled:
Benchmark case
Baseline time, μs
SIMD time, μs
Optimization
inference/avg-body-1000
246.31
130.07
-47.19% or 1.89x
Quite a nice performance boost just from a few lines of build config change!
Tensorflow Lite with XNNPACK
Tensorflow Lite comes with a useful benchmarking tool called benchmark_model, which also has a built-in profiler.
Tensorflow Lite with XNNPACK enabled emerges as a leader, achieving ~50% latency reduction, when compared to the original Tensorflow Lite implementation.
More technical details about XNNPACK can be found in these blog posts:
Re-running benchmarks with XNNPack enabled, we get the following results:
Benchmark case
Baseline time, μs TFLite 2.6.0
SIMD time, μs TFLite 2.6.0
SIMD time, μs TFLite 2.16.1
SIMD + XNNPack time, μs TFLite 2.16.1
Optimization
inference/avg-body-1000
246.31
130.07
115.17
56.22
-77.17% or 4.38x
By upgrading TensorFlow Lite from 2.6.0 to 2.16.1 and enabling SIMD optimizations along with the XNNPack, we were able to decrease WAF ML model inference time more than four-fold, achieving a 77.17% reduction.
Caching inference result
While making code faster through pre-processing and inference optimizations is great, it’s even better when code doesn’t need to run at all. This is where caching comes in. Amdahl’s Law suggests that optimizing only parts of a program has diminishing returns. By avoiding redundant executions with caching, we can achieve significant performance gains beyond the limitations of traditional code optimization.
A simple key-value cache would quickly occupy all available memory on the server due to the high cardinality of URLs, HTTP headers, and HTTP bodies. However, because “everything on the Internet has an L-shape” or more specifically, follows a Zipf’s law distribution, we can optimize our caching strategy.
Zipf‘s law states that in many natural datasets, the frequency of any item is inversely proportional to its rank in the frequency table. In other words, a few items are extremely common, while the majority are rare. By analyzing our request data, we found that URLs, HTTP headers, and even HTTP bodies follow this distribution. For example, here is the user agent header frequency distribution against its rank:
By caching the top-N most frequently occurring inputs and their corresponding inference results, we can ensure that both pre-processing and inference are skipped for the majority of requests. This is where the Least Recently Used (LRU) cache comes in – frequently used items stay hot in the cache, while the least recently used ones are evicted.
We use lua-resty-mlcache as our caching solution, allowing us to share cached inference results between different Nginx workers via a shared memory dictionary. The LRU cache effectively exploits the space-time trade-off, where we trade a small amount of memory for significant CPU time savings.
This approach enables us to achieve a ~70% cache hit ratio, significantly reducing latency further, as we will analyze in the final section below.
Optimization results
The optimizations discussed in this post were rolled out in several phases to ensure system correctness and stability.
First, we enabled SIMD optimizations for TensorFlow Lite, which reduced WAF ML total execution time by approximately 41.80%, decreasing from 1519 ➔ 884 μs on average.
Next, we upgraded TensorFlow Lite from version 2.6.0 to 2.16.1, enabled XNNPack, and implemented pre-processing optimizations. This further reduced WAF ML total execution time by ~40.77%, bringing it down from 932 ➔ 552 μs on average. The initial average time of 932 μs was slightly higher than the previous 884 μs due to the increased number of customers using this feature and the months that passed between changes.
Lastly, we introduced LRU caching, which led to an additional reduction in WAF ML total execution time by ~50.18%, from 552 ➔ 275 μs on average.
Overall, we cut WAF ML execution time by ~81.90%, decreasing from 1519 ➔ 275 μs, or 5.5x faster!
To illustrate the significance of this: with Cloudflare’s average rate of 9.5 million requests per second passing through WAF ML, saving 1244 microseconds per request equates to saving ~32 years of processing time every single day! That’s in addition to the savings of 523 microseconds per request or 65 years of processing time per day demonstrated last year in our Every request, every microsecond: scalable machine learning at Cloudflare post about our Bot Management product.
Conclusion
We hope you enjoyed reading about how we made our WAF ML models go brrr, just as much as we enjoyed implementing these optimizations to bring scalable WAF ML to more customers on a truly global scale.
Looking ahead, we are developing even more sophisticated ML security models. These advancements aim to bring our WAF and Bot Management products to the next level, making them even more useful and effective for our customers.
Over the last twelve months, the Internet security landscape has changed dramatically. Geopolitical uncertainty, coupled with an active 2024 voting season in many countries across the world, has led to a substantial increase in malicious traffic activity across the Internet. In this report, we take a look at Cloudflare’s perspective on Internet application security.
This report is the fourth edition of our Application Security Report and is an official update to our Q2 2023 report. New in this report is a section focused on client-side security within the context of web applications.
Throughout the report we discuss various insights. From a global standpoint, mitigated traffic across the whole network now averages 7%, and WAF and Bot mitigations are the source of over half of that. While DDoS attacks remain the number one attack vector used against web applications, targeted CVE attacks are also worth keeping an eye on, as we have seen exploits as fast as 22 minutes after a proof of concept was released.
Focusing on bots, about a third of all traffic we observe is automated, and of that, the vast majority (93%) is not generated by bots in Cloudflare’s verified list and is potentially malicious.
API traffic is also still growing, now accounting for 60% of all traffic, and maybe more concerning, is that organizations have up to a quarter of their API endpoints not accounted for.
We also touch on client side security and the proliferation of third-party integrations in web applications. On average, enterprise sites integrate 47 third-party endpoints according to Page Shield data.
It is also worth mentioning that since the last report, our network, from which we gather the data and insights, is bigger and faster: we are now processing an average of 57 million HTTP requests/second (+23.9% YoY) and 77 million at peak (+22.2% YoY). From a DNS perspective, we are handling 35 million DNS queries per second (+40% YoY). This is the sum of authoritative and resolver requests served by our infrastructure.
Maybe even more noteworthy, is that, focusing on HTTP requests only, in Q1 2024 Cloudflare blocked an average of 209 billion cyber threats each day (+86.6% YoY). That is a substantial increase in relative terms compared to the same time last year.
As usual, before we dive in, we need to define our terms.
Definitions
Throughout this report, we will refer to the following terms:
Mitigated traffic: any eyeball HTTP* request that had a “terminating” action applied to it by the Cloudflare platform. These include the following actions: BLOCK, CHALLENGE, JS_CHALLENGE and MANAGED_CHALLENGE. This does not include requests that had the following actions applied: LOG, SKIP, ALLOW. They also accounted for a relatively small percentage of requests. Additionally, we improved our calculation regarding the CHALLENGE type actions to ensure that only unsolved challenges are counted as mitigated. A detailed description of actions can be found in our developer documentation. This has not changed from last year’s report.
Bot traffic/automated traffic: any HTTP* request identified by Cloudflare’s Bot Management system as being generated by a bot. This includes requests with a bot score between 1 and 29 inclusive. This has not changed from last year’s report.
API traffic: any HTTP* request with a response content type of XML or JSON. Where the response content type is not available, such as for mitigated requests, the equivalent Accept content type (specified by the user agent) is used instead. In this latter case, API traffic won’t be fully accounted for, but it still provides a good representation for the purposes of gaining insights. This has not changed from last year’s report.
Unless otherwise stated, the time frame evaluated in this post is the period from April 1, 2023, through March 31, 2024, inclusive.
Finally, please note that the data is calculated based only on traffic observed across the Cloudflare network and does not necessarily represent overall HTTP traffic patterns across the Internet.
*When referring to HTTP traffic we mean both HTTP and HTTPS.
Global traffic insights
Average mitigated daily traffic increases to nearly 7%
Compared to the prior 12-month period, Cloudflare mitigated a higher percentage of application layer traffic and layer 7 (L7) DDoS attacks between Q2 2023 and Q1 2024, growing from 6% to 6.8%.
Figure 1: Percent of mitigated HTTP traffic increasing over the last 12 months
During large global attack events, we can observe spikes of mitigated traffic approaching 12% of all HTTP traffic. These are much larger spikes than we have ever observed across our entire network.
WAF and Bot mitigations accounted for 53.9% of all mitigated traffic
As the Cloudflare platform continues to expose additional signals to identify potentially malicious traffic, customers have been actively using these signals in WAF Custom Rules to improve their security posture. Example signals include our WAF Attack Score, which identifies malicious payloads, and our Bot Score, which identifies automated traffic.
After WAF and Bot mitigations, HTTP DDoS rules are the second-largest contributor to mitigated traffic. IP reputation, that uses our IP threat score to block traffic, and access rules, which are simply IP and country blocks, follow in third and fourth place.
Figure 2: Mitigated traffic by Cloudflare product group
CVEs exploited as fast as 22 minutes after proof-of-concept published
Zero-day exploits (also called zero-day threats) are increasing, as is the speed of weaponization of disclosed CVEs. In 2023, 97 zero-days were exploited in the wild, and that’s along with a 15% increase of disclosed CVEs between 2022 and 2023.
Looking at CVE exploitation attempts against customers, Cloudflare mostly observed scanning activity, followed by command injections, and some exploitation attempts of vulnerabilities that had PoCs available online, including Apache CVE-2023-50164 and CVE-2022-33891, Coldfusion CVE-2023-29298CVE-2023-38203 and CVE-2023-26360, and MobileIron CVE-2023-35082.
This trend in CVE exploitation attempt activity indicates that attackers are going for the easiest targets first, and likely having success in some instances given the continued activity around old vulnerabilities.
As just one example, Cloudflare observed exploitation attempts of CVE-2024-27198 (JetBrains TeamCity authentication bypass) at 19:45 UTC on March 4, just 22 minutes after proof-of-concept code was published.
The speed of exploitation of disclosed CVEs is often quicker than the speed at which humans can create WAF rules or create and deploy patches to mitigate attacks. This also applies to our own internal security analyst team that maintains the WAF Managed Ruleset, which has led us to combine the human written signatures with an ML-based approach to achieve the best balance between low false positives and speed of response.
CVE exploitation campaigns from specific threat actors are clearly visible when we focus on a subset of CVE categories. For example, if we filter on CVEs that result in remote code execution (RCE), we see clear attempts to exploit Apache and Adobe installations towards the end of 2023 and start of 2024 along with a notable campaign targeting Citrix in May of this year.
Figure 4: Worldwide daily number of requests for Code Execution CVEs
Similar views become clearly visible when focusing on other CVEs or specific attack categories.
DDoS attacks remain the most common attack against web applications
DDoS attacks remain the most common attack type against web applications, with DDoS comprising 37.1% of all mitigated application traffic over the time period considered.
Figure 5: Volume of HTTP DDoS attacks over time
We saw a large increase in volumetric attacks in February and March 2024. This was partly the result of improved detections deployed by our teams, in addition to increased attack activity. In the first quarter of 2024 alone, Cloudflare’s automated defenses mitigated 4.5 million unique DDoS attacks, an amount equivalent to 32% of all the DDoS attacks Cloudflare mitigated in 2023. Specifically, application layer HTTP DDoS attacks increased by 93% YoY and 51% quarter-over-quarter (QoQ).
Cloudflare correlates DDoS attack traffic and defines unique attacks by looking at event start and end times along with target destination.
Motives for launching DDoS attacks range from targeting specific organizations for financial gains (ransom), to testing the capacity of botnets, to targeting institutions and countries for political reasons. As an example, Cloudflare observed a 466% increase in DDoS attacks on Sweden after its acceptance to the NATO alliance on March 7, 2024. This mirrored the DDoS pattern observed during Finland’s NATO acceptance in 2023. The size of DDoS attacks themselves are also increasing.
In August 2023, Cloudflare mitigated a hyper-volumetric HTTP/2 Rapid Reset DDoS attack that peaked at 201 million requests per second (rps) – three times larger than any previously observed attack. In the attack, threat actors exploited a zero-day vulnerability in the HTTP/2 protocol that had the potential to incapacitate nearly any server or application supporting HTTP/2. This underscores how menacing DDoS vulnerabilities are for unprotected organizations.
Gaming and gambling became the most targeted sector by DDoS attacks, followed by Internet technology companies and cryptomining.
Figure 6: Largest HTTP DDoS attacks as seen by Cloudflare, by year
Bot traffic insights
Cloudflare has continued to invest heavily in our bot detection systems. In early July, we declared AIndependence to help preserve a safe Internet for content creators, offering a brand new “easy button” to block all AI bots. It’s available for all customers, including those on our free tier.
Major progress has also been made in other complementary systems such as our Turnstile offering, a user-friendly, privacy-preserving alternative to CAPTCHA.
All these systems and technologies help us better identify and differentiate human traffic from automated bot traffic.
On average, bots comprise one-third of all application traffic
31.2% of all application traffic processed by Cloudflare is bot traffic. This percentage has stayed relatively consistent (hovering at about 30%) over the past three years.
The term bot traffic may carry a negative connotation, but in reality bot traffic is not necessarily good or bad; it all depends on the purpose of the bots. Some are “good” and perform a needed service, such as customer service chatbots and authorized search engine crawlers. But some bots misuse an online product or service and need to be blocked.
Different application owners may have different criteria for what they deem a “bad” bot. For example, some organizations may want to block a content scraping bot that is being deployed by a competitor to undercut on prices, whereas an organization that does not sell products or services may not be as concerned with content scraping. Known, good bots are classified by Cloudflare as “verified bots.”
93% of bots we identified were unverified bots, and potentially malicious
Unverified bots are often created for disruptive and harmful purposes, such as hoarding inventory, launching DDoS attacks, or attempting to take over an account via brute force or credential stuffing. Verified bots are those that are known to be safe, such as search engine crawlers, and Cloudflare aims to verify all major legitimate bot operators. A list of all verified bots can be found in our documentation.
Attackers leveraging bots focus most on industries that could bring them large financial gains. For example, consumer goods websites are often the target of inventory hoarding, price scraping run by competition or automated applications aimed at exploiting some sort of arbitrage (for example, sneaker bots). This type of abuse can have a significant financial impact on the target organization.
Figure 8: Industries with the highest median daily share of bot traffic
API traffic insights
Consumers and end users expect dynamic web and mobile experiences powered by APIs. For businesses, APIs fuel competitive advantages, greater business intelligence, faster cloud deployments, integration of new AI capabilities, and more.
However, APIs introduce new risks by providing outside parties additional attack surfaces with which to access applications and databases which also need to be secured. As a consequence, numerous attacks we observe are not targeting API endpoints first rather than the traditional web interfaces.
The additional security concerns are of course not slowing down adoption of API first applications.
60% of dynamic (non cacheable) traffic is API-related
This is a two percentage point increase compared to last year’s report. Of this 60%, about 4% on average is mitigated by our security systems.
Figure 9: Share of mitigated API traffic
A substantial spike is visible around January 11-17 that accounts for almost a 10% increase in traffic share alone for that period. This was due to a specific customer zone receiving attack traffic that was mitigated by a WAF Custom Rule.
Digging into mitigation sources for API traffic, we see the WAF being the largest contributor, as standard malicious payloads are commonly applicable to both API endpoints and standard web applications.
Figure 10: API mitigated traffic broken down by product group
A quarter of APIs are “shadow APIs”
You cannot protect what you cannot see. And, many organizations lack accurate API inventories, even when they believe they can correctly identify API traffic.
Using our proprietary machine learning model that scans not just known API calls, but all HTTP requests (identifying API traffic that may be going unaccounted for), we found that organizations had 33% more public-facing API endpoints than they knew about. This number was the median, and it was calculated by comparing the number of API endpoints detected through machine learning based discovery vs. customer-provided session identifiers.
This suggests that nearly a quarter of APIs are “shadow APIs” and may not be properly inventoried and secured.
Client-side risks
Most organizations’ web apps rely on separate programs or pieces of code from third-party providers (usually coded in JavaScript). The use of third-party scripts accelerates modern web app development and allows organizations to ship features to market faster, without having to build all new app features in-house.
Using Cloudflare’s client side security product, Page Shield, we can get a view on the popularity of third party libraries used on the Internet and the risk they pose to organizations. This has become very relevant recently due to the Polyfill.io incident that affected more than one hundred thousand sites.
Enterprise applications use 47 third-party scripts on average
Cloudflare’s typical enterprise customer uses an average of 47 third-party scripts, and a median of 20 third-party scripts. The average is much higher than the median due to SaaS providers, who often have thousands of subdomains which may all use third-party scripts. Here are some of the top third-party script providers Cloudflare customers commonly use:
Google (Tag Manager, Analytics, Ads, Translate, reCAPTCHA, YouTube)
Meta (Facebook Pixel, Instagram)
Cloudflare (Web Analytics)
jsDelivr
New Relic
Appcues
Microsoft (Clarity, Bing, LinkedIn)
jQuery
WordPress (Web Analytics, hosted plugins)
Pinterest
UNPKG
TikTok
Hotjar
While useful, third-party software dependencies are often loaded directly by the end-user’s browser (i.e. they are loaded client-side) placing organizations and their customers at risk given that organizations have no direct control over third-party security measures. For example, in the retail sector, 18% of all data breaches originate from Magecart style attacks, according to Verizon’s 2024 Data Breach Investigations Report.
Enterprise applications connect to nearly 50 third-parties on average
Loading a third-party script into your website poses risks, even more so when that script “calls home” to submit data to perform the intended function. A typical example here is Google Analytics: whenever a user performs an action, the Google Analytics script will submit data back to the Google servers. We identify these as connections.
On average, each enterprise website connects to 50 separate third-party destinations, with a median of 15. Each of these connections also poses a potential client-side security risk as attackers will often use them to exfiltrate additional data going unnoticed.
Here are some of the top third-party connections Cloudflare customers commonly use:
Google (Analytics, Ads)
Microsoft (Clarity, Bing, LinkedIn)
Meta (Facebook Pixel)
Hotjar
Kaspersky
Sentry
Criteo
tawk.to
OneTrust
New Relic
PayPal
Looking forward
This application security report is also available in PDF format with additional recommendations on how to address many of the concerns raised, along with additional insights.
We also publish many of our reports with dynamic charts on Cloudflare Radar, making it an excellent resource to keep up to date with the state of the Internet.
File upload is a common feature in many web applications. Applications may allow users to upload files like images of flood damage to file an insurance claim, PDFs like resumes or cover letters to apply for a job, or other documents like receipts or income statements. However, beneath the convenience lies a potential threat, since allowing unrestricted file uploads can expose the web server and your enterprise network to significant risks related to security, privacy, and compliance.
Cloudflare recently introduced WAF Content Scanning, our in-line malware file detection and prevention solution to stop malicious files from reaching the web server, offering our Enterprise WAF customers an additional line of defense against security threats.
Today, we’re pleased to announce that the feature is now generally available. It will be automatically rolled out to existing WAF Content Scanning customers before the end of March 2024.
In this blog post we will share more details about the new version of the feature, what we have improved, and reveal some of the technical challenges we faced while building it. This feature is available to Enterprise WAF customers as an add-on license, contact your account team to get it.
What to expect from the new version?
The feedback from the early access version has resulted in additional improvements. The main one is expanding the maximum size of scanned files from 1 MB to 15 MB. This change required a complete redesign of the solution’s architecture and implementation. Additionally, we are improving the dashboard visibility and the overall analytics experience.
Let’s quickly review how malware scanning operates within our WAF.
Behind the scenes
WAF Content Scanning operates in a few stages: users activate and configure it, then the scanning engine detects which requests contain files, the files are sent to the scanner returning the scan result fields, and finally users can build custom rules with these fields. We will dig deeper into each step in this section.
Activate and configure
Customers can enable the feature via the API, or through the Settings page in the dashboard (Security → Settings) where a new section has been added for incoming traffic detection configuration and enablement. As soon as this action is taken, the enablement action gets distributed to the Cloudflare network and begins scanning incoming traffic.
Customers can also add a custom configuration depending on the file upload method, such as a base64 encoded file in a JSON string, which allows the specified file to be parsed and scanned automatically.
In the example below, the customer wants us to look at JSON bodies for the key “file” and scan them.
As soon as the feature is activated and configured, the scanning engine runs the pre-scanning logic, and identifies content automatically via heuristics. In this case, the engine logic does not rely on the Content-Type header, as it’s easy for attackers to manipulate. When relevant content or a file has been found, the engine connects to the antivirus (AV) scanner in our Zero Trust solution to perform a thorough analysis and return the results of the scan. The engine uses the scan results to propagate useful fields that customers can use.
Integrate with WAF
For every request where a file is found, the scanning engine returns various fields, including:
The scanning engine integrates with the WAF where customers can use those fields to create custom WAF rules to address various use cases. The basic use case is primarily blocking malicious files from reaching the web server. However, customers can construct more complex logic, such as enforcing constraints on parameters such as file sizes, file types, endpoints, or specific paths.
In-line scanning limitations and file types
One question that often comes up is about the file types we detect and scan in WAF Content Scanning. Initially, addressing this query posed a challenge since HTTP requests do not have a definition of a “file”, and scanning all incoming HTTP requests does not make sense as it adds extra processing and latency. So, we had to decide on a definition to spot HTTP requests that include files, or as we call it, “uploaded content”.
The WAF Content Scanning engine makes that decision by filtering out certain content types identified by heuristics. Any content types not included in a predefined list, such as text/html, text/x-shellscript, application/json, and text/xml, are considered uploaded content and are sent to the scanner for examination. This allows us to scan a wide range of content types and file types without affecting the performance of all requests by adding extra processing. The wide range of files we scan includes:
Executable (e.g., .exe, .bat, .dll, .wasm)
Documents (e.g., .doc, .docx, .pdf, .ppt, .xls)
Compressed (e.g., .7z, .gz, .zip, .rar)
Image (e.g., .jpg, .png, .gif, .webp, .tif)
Video and audio files within the 15 MB file size range.
The file size scanning limit of 15 Megabytes comes from the fact that the in-line file scanning as a feature is running in real time, which offers safety to the web server and instant access to clean files, but also impacts the whole request delivery process. Therefore, it’s crucial to scan the payload without causing significant delays or interruptions; namely increased CPU time and latency.
Scaling the scanning process to 15 MB
In the early design of the product, we built a system that could handle requests with a maximum body size of 1 MB, and increasing the limit to 15 MB had to happen without adding any extra latency. As mentioned, this latency is not added to all requests, but only to the requests that have uploaded content. However, increasing the size with the same design would have increased the latency by 15x for those requests.
In this section, we discuss how we previously managed scanning files embedded in JSON request bodies within the former architecture as an example, and why it was challenging to expand the file size using the same design, then compare the same example with the changes made in the new release to overcome the extra latency in details.
Old architecture used for the Early Access release
In order for customers to use the content scanning functionality in scanning files embedded in JSON request bodies, they had to configure a rule like:
lookup_json_string(http.request.body.raw, “file”)
This means we should look in the request body but only for the “file” key, which in the image below contains a base64 encoded string for an image.
When the request hits our Front Line (FL) NGINX proxy, we buffer the request body. This will be in an in-memory buffer, or written to a temporary file if the size of the request body exceeds the NGINX configuration of client_body_buffer_size. Then, our WAF engine executes the lookup_json_string function and returns the base64 string which is the content of the file key. The base64 string gets sent via Unix Domain Sockets to our malware scanner, which does MIME type detection and returns a verdict to the file upload scanning module.
This architecture had a bottleneck that made it hard to expand on: the expensive latency fees we had to pay. The request body is first buffered in NGINX and then copied into our WAF engine, where rules are executed. The malware scanner will then receive the execution result — which, in the worst scenario, is the entire request body — over a Unix domain socket. This indicates that once NGINX buffers the request body, we send and buffer it in two other services.
New architecture for the General Availability release
In the new design, the requirements were to scan larger files (15x larger) while not compromising on performance. To achieve this, we decided to bypass our WAF engine, which is where we introduced the most latency.
In the new architecture, we made the malware scanner aware of what is needed to execute the rule, hence bypassing the Ruleset Engine (RE). For example, the configuration “lookup_json_string(http.request.body.raw, “file”)”, will be represented roughly as:
{
   Function: lookup_json_string
   Args: [“file”]
}
This is achieved by walking the Abstract Syntax Tree (AST) when the rule is configured, and deploying the sample struct above to our global network. The struct’s values will be read by the malware scanner, and rule execution and malware detection will happen within the same service. This means we don’t need to read the request body, execute the rule in the Ruleset Engine (RE) module, and then send the results over to the malware scanner.
The malware scanner will now read the request body from the temporary file directly, perform the rule execution, and return the verdict to the file upload scanning module.
The file upload scanning module populates these fields, so they can be used to write custom rules and take actions. For example:
This module also enriches our logging pipelines with these fields, which can then be read in Log Push, Edge Log Delivery, Security Analytics, and Firewall Events in the dashboard. For example, this is the security log in the Cloudflare dashboard (Security → Analytics) for a web request that triggered WAF Content Scanning:
WAF content scanning detection visibility
Using the concept of incoming traffic detection, WAF Content Scanning enables users to identify hidden risks through their traffic signals in the analytics before blocking or mitigating matching requests. This reduces false positives and permits security teams to make decisions based on well-informed data. Actually, this isn’t the only instance in which we apply this idea, as we also do it for a number of other products, like WAF Attack Score and Bot Management.
We have integrated helpful information into our security products, like Security Analytics, to provide this data visibility. The Content Scanning tab, located on the right sidebar, displays traffic patterns even if there were no WAF rules in place. The same data is also reflected in the sampled requests, and you can create new rules from the same view.
On the other hand, if you want to fine-tune your security settings, you will see better visibility in Security Events, where these are the requests that match specific rules you have created in WAF.
Last but not least, in our Logpush datastream, we have included the scan fields that can be selected to send to any external log handler.
What’s next?
Before the end of March 2024, all current and new customers who have enabled WAF Content Scanning will be able to scan uploaded files up to 15 MB. Next, we’ll focus on improving how we handle files in the rules, including adding a dynamic header functionality. Quarantining files is also another important feature we will be adding in the future. If you’re an Enterprise customer, reach out to your account team for more information and to get access.
Imagine you are in the middle of an attack on your most crucial production application, and you need to understand what’s going on. How happy would you be if you could simply log into the Dashboard and type a question such as: “Compare attack traffic between US and UK” or “Compare rate limiting blocks for automated traffic with rate limiting blocks from human traffic” and see a time series chart appear on your screen without needing to select a complex set of filters?
Today, we are introducing an AI assistant to help you query your security event data, enabling you to more quickly discover anomalies and potential security attacks. You can now use plain language to interrogate Cloudflare analytics and let us do the magic.
What did we build?
One of the big challenges when analyzing a spike in traffic or any anomaly in your traffic is to create filters that isolate the root cause of an issue. This means knowing your way around often complex dashboards and tools, knowing where to click and what to filter on.
On top of this, any traditional security dashboard is limited to what you can achieve by the way data is stored, how databases are indexed, and by what fields are allowed when creating filters. With our Security Analytics view, for example, it was difficult to compare time series with different characteristics. For example, you couldn’t compare the traffic from IP address x.x.x.x with automated traffic from Germany without opening multiple tabs to Security Analytics and filtering separately. From an engineering perspective, it would be extremely hard to build a system that allows these types of unconstrained comparisons.
With the AI Assistant, we are removing this complexity by leveraging our Workers AI platform to build a tool that can help you query your HTTP request and security event data and generate time series charts based on a request formulated with natural language. Now the AI Assistant does the hard work of figuring out the necessary filters and additionally can plot multiple series of data on a single graph to aid in comparisons. This new tool opens up a new way of interrogating data and logs, unconstrained by the restrictions introduced by traditional dashboards.
Now it is easier than ever to get powerful insights about your application security by using plain language to interrogate your data and better understand how Cloudflare is protecting your business. The new AI Assistant is located in the Security Analytics dashboard and works seamlessly with the existing filters. The answers you need are just a question away.
What can you ask?
To demonstrate the capabilities of AI Assistant, we started by considering the questions that we ask ourselves every day when helping customers to deploy the best security solutions for their applications.
We’ve included some clickable examples in the dashboard to get you started.
You can use the AI Assistant to
Identify the source of a spike in attack traffic by asking: “Compare attack traffic between US and UK”
Identify root cause of 5xx errors by asking: “Compare origin and edge 5xx errors”
See which browsers are most commonly used by your users by asking:”Compare traffic across major web browsers”
For an ecommerce site, understand what percentage of users visit vs add items to their shopping cart by asking: “Compare traffic between /api/login and /api/basket”
Identify bot attacks against your ecommerce site by asking: “Show requests to /api/basket with a bot score less than 20”
Identify the HTTP versions used by clients by asking: “Compare traffic by each HTTP version”
Identify unwanted automated traffic to specific endpoints by asking: “Show POST requests to /admin with a Bot Score over 30”
You can start from these when exploring the AI Assistant.
How does it work?
Using Cloudflare’s powerful Workers AI global network inference platform, we were able to use one of the off-the-shelf large language models (LLMs) offered on the platform to convert customer queries into GraphQL filters. By teaching an AI model about the available filters we have on our Security Analytics GraphQL dataset, we can have the AI model turn a request such as “Compare attack traffic on /api and /admin endpoints” into a matching set of structured filters:
Then, using the filters provided by the AI model, we can make requests to our GraphQL APIs, gather the requisite data, and plot a data visualization to answer the customer query.
By using this method, we are able to keep customer information private and avoid exposing any security analytics data to the AI model itself, while still allowing humans to query their data with ease. This ensures that your queries will never be used to train the model. And because Workers AI hosts a local instance of the LLM on Cloudflare’s own network, your queries and resulting data never leave Cloudflare’s network.
Future Development
We are in the early stages of developing this capability and plan to rapidly extend the capabilities of the Security Analytics AI Assistant. Don’t be surprised if we cannot handle some of your requests at the beginning. At launch, we are able to support basic inquiries that can be plotted in a time series chart such as “show me” or “compare” for any currently filterable fields.
However, we realize there are a number of use cases that we haven’t even thought of, and we are excited to release the Beta version of AI Assistant to all Business and Enterprise customers to let you test the feature and see what you can do with it. We would love to hear your feedback and learn more about what you find useful and what you would like to see in it next. With future versions, you’ll be able to ask questions such as “Did I experience any attacks yesterday?” and use AI to automatically generate WAF rules for you to apply to mitigate them.
Beta availability
Starting today, AI Assistant is available for a select few users and rolling out to all Business and Enterprise customers throughout March. Look out for it and try for free and let us know what you think by using the Feedback link at the top of the Security Analytics page.
Final pricing will be determined prior to general availability.
Today, Cloudflare is announcing the development of Firewall for AI, a protection layer that can be deployed in front of Large Language Models (LLMs) to identify abuses before they reach the models.
While AI models, and specifically LLMs, are surging, customers tell us that they are concerned about the best strategies to secure their own LLMs. Using LLMs as part of Internet-connected applications introduces new vulnerabilities that can be exploited by bad actors.
Some of the vulnerabilities affecting traditional web and API applications apply to the LLM world as well, including injections or data exfiltration. However, there is a new set of threats that are now relevant because of the way LLMs work. For example, researchers have recently discovered a vulnerability in an AI collaboration platform that allows them to hijack models and perform unauthorized actions.
Firewall for AI is an advanced Web Application Firewall (WAF) specifically tailored for applications using LLMs. It will comprise a set of tools that can be deployed in front of applications to detect vulnerabilities and provide visibility to model owners. The tool kit will include products that are already part of WAF, such as Rate Limiting and Sensitive Data Detection, and a new protection layer which is currently under development. This new validation analyzes the prompt submitted by the end user to identify attempts to exploit the model to extract data and other abuse attempts. Leveraging the size of Cloudflare network, Firewall for AI runs as close to the user as possible, allowing us to identify attacks early and protect both end user and models from abuses and attacks.
Before we dig into how Firewall for AI works and its full feature set, let’s first examine what makes LLMs unique, and the attack surfaces they introduce. We’ll use the OWASP Top 10 for LLMs as a reference.
Why are LLMs different from traditional applications?
When considering LLMs as Internet-connected applications, there are two main differences compared with more traditional web apps.
First, the way users interact with the product. Traditional apps are deterministic in nature. Think about a bank application — it’s defined by a set of operations (check my balance, make a transfer, etc.). The security of the business operation (and data) can be obtained by controlling the fine set of operations accepted by these endpoints: “GET /balance” or “POST /transfer”.
LLM operations are non-deterministic by design. To start with, LLM interactions are based on natural language, which makes identifying problematic requests harder than matching attack signatures. Additionally, unless a response is cached, LLMs typically provide a different response every time — even if the same input prompt is repeated. This makes limiting the way a user interacts with the application much more difficult. This poses a threat to the user as well, in terms of being exposed to misinformation that weakens the trust in the model.
Second, a big difference is how the application control plane interacts with the data. In traditional applications, the control plane (code) is well separated from the data plane (database). The defined operations are the only way to interact with the underlying data (e.g. show me the history of my payment transactions). This allows security practitioners to focus on adding checks and guardrails to the control plane and thus protecting the database indirectly.
LLMs are different in that the training data becomes part of the model itself through the training process, making it extremely difficult to control how that data is shared as a result of a user prompt. Some architectural solutions are being explored, such as separating LLMs into different levels and segregating data. However, no silver bullet has yet been found.
From a security perspective, these differences allow attackers to craft new attack vectors that can target LLMs and fly under the radar of existing security tools designed for traditional web applications.
OWASP LLM Vulnerabilities
The OWASP foundation released a list of the top 10 classes of vulnerabilities for LLMs, providing a useful framework for thinking about how to secure language models. Some of the threats are reminiscent of the OWASP top 10 for web applications, while others are specific to language models.
Similar to web applications, some of these vulnerabilities can be best addressed when the LLM application is designed, developed, and trained. For example, Training Data Poisoning can be carried out by introducing vulnerabilities in the training data set used to train new models. Poisoned information is then presented to the user when the model is live. Supply Chain Vulnerabilities and Insecure Plugin Design are vulnerabilities introduced in components added to the model, like third-party software packages.Finally, managing authorization and permissions is crucial when dealing with Excessive Agency,where unconstrained models can perform unauthorized actions within the broader application or infrastructure.
Conversely, Prompt Injection, Model Denial of Service, and Sensitive Information Disclosure can be mitigated by adopting a proxy security solution like Cloudflare Firewall for AI. In the following sections, we will give more details about these vulnerabilities and discuss how Cloudflare is optimally positioned to mitigate them.
LLM deployments
Language model risks also depend on the deployment model. Currently, we see three main deployment approaches: internal, public, and product LLMs. In all three scenarios, you need to protect models from abuses, protect any proprietary data stored in the model, and protect the end user from misinformation or from exposure to inappropriate content.
Internal LLMs: Companies develop LLMs to support the workforce in their daily tasks. These are considered corporate assets and shouldn’t be accessed by non-employees. Examples include an AI co-pilot trained on sales data and customer interactions used to generate tailored proposals, or an LLM trained on an internal knowledge base that can be queried by engineers.
Public LLMs: These are LLMs that can be accessed outside the boundaries of a corporation. Often these solutions have free versions that anyone can use and they are often trained on general or public knowledge. Examples include GPT from OpenAI or Claude from Anthropic.
Product LLM: From a corporate perspective, LLMs can be part of a product or service offered to their customers. These are usually self-hosted, tailored solutions that can be made available as a tool to interact with the company resources. Examples include customer support chatbots or Cloudflare AI Assistant.
From a risk perspective, the difference between Product and Public LLMs is about who carries the impact of successful attacks. Public LLMs are considered a threat to data because data that ends up in the model can be accessed by virtually anyone. This is one of the reasons many corporations advise their employees not to use confidential information in prompts for publicly available services. Product LLMs can be considered a threat to companies and their intellectual property if models had access to proprietary information during training (by design or by accident).
Firewall for AI
Cloudflare Firewall for AI will be deployed like a traditional WAF, where every API request with an LLM prompt is scanned for patterns and signatures of possible attacks.
Firewall for AI can be deployed in front of models hosted on the Cloudflare Workers AI platform or models hosted on any other third party infrastructure. It can also be used alongside Cloudflare AI Gateway, and customers will be able to control and set up Firewall for AI using the WAF control plane.
Firewall for AI works like a traditional web application firewall. It is deployed in front of an LLM application and scans every request to identify attack signatures
Prevent volumetric attacks
One of the threats listed by OWASP is Model Denial of Service. Similar to traditional applications, a DoS attack is carried out by consuming an exceptionally high amount of resources, resulting in reduced service quality or potentially increasing the costs of running the model. Given the amount of resources LLMs require to run, and the unpredictability of user input, this type of attack can be detrimental.
This risk can be mitigated by adopting rate limiting policies that control the rate of requests from individual sessions, therefore limiting the context window. By proxying your model through Cloudflare today, you get DDoS protection out of the box. You can also use Rate Limiting and Advanced Rate Limiting to manage the rate of requests allowed to reach your model by setting a maximum rate of request performed by an individual IP address or API key during a session.
Identify sensitive information with Sensitive Data Detection
There are two use cases for sensitive data, depending on whether you own the model and data, or you want to prevent users from sending data into public LLMs.
As defined by OWASP, Sensitive Information Disclosure happens when LLMs inadvertently reveal confidential data in the responses, leading to unauthorized data access, privacy violations, and security breaches. One way to prevent this is to add strict prompt validations. Another approach is to identify when personally identifiable information (PII) leaves the model. This is relevant, for example, when a model was trained with a company knowledge base that may include sensitive information, such asPII (like social security number), proprietary code, or algorithms.
Customers using LLM models behind Cloudflare WAF can employ the Sensitive Data Detection (SDD) WAF managed ruleset to identify certain PII being returned by the model in the response. Customers can review the SDD matches on WAF Security Events. Today, SDD is offered as a set of managed rules designed to scan for financial information (such as credit card numbers) as well as secrets (API keys). As part of the roadmap, we plan to allow customers to create their own custom fingerprints.
The other use case is intended to prevent users from sharing PII or other sensitive information with external LLM providers, such as OpenAI or Anthropic. To protect from this scenario, we plan to expand SDD to scan the request prompt and integrate its output with AI Gateway where, alongside the prompt’s history, we detect if certain sensitive data has been included in the request. We will start by using the existing SDD rules, and we plan to allow customers to write their own custom signatures. Relatedly, obfuscation is another feature we hear a lot of customers talk about. Once available, the expanded SDD will allow customers to obfuscate certain sensitive data in a prompt before it reaches the model. SDD on the request phase is being developed.
Preventing model abuses
Model abuse is a broader category of abuse. It includes approaches like “prompt injection” or submitting requests that generate hallucinations or lead to responses that are inaccurate, offensive, inappropriate, or simply off-topic.
Prompt Injection is an attempt to manipulate a language model through specially crafted inputs, causing unintended responses by the LLM. The results of an injection can vary, from extracting sensitive information to influencing decision-making by mimicking normal interactions with the model. A classic example of prompt injection is manipulating a CV to affect the output of resume screening tools.
A common use case we hear from customers of our AI Gateway is that they want to avoid their application generating toxic, offensive, or problematic language. The risks of not controlling the outcome of the model include reputational damage and harming the end user by providing an unreliable response.
These types of abuse can be managed by adding an additional layer of protection that sits in front of the model. This layer can be trained to block injection attempts or block prompts that fall into categories that are inappropriate.
Prompt and response validation
Firewall for AI will run a series of detections designed to identify prompt injection attempts and other abuses, such as making sure the topic stays within the boundaries defined by the model owner. Like other existing WAF features, Firewall for AI will automatically look for prompts embedded in HTTP requests or allow customers to create rules based on where in the JSON body of the request the prompt can be found.
Once enabled, the Firewall will analyze every prompt and provide a score based on the likelihood that it’s malicious. It will also tag the prompt based on predefined categories. The score ranges from 1 to 99 which indicates the likelihood of a prompt injection, with 1 being the most likely.
Customers will be able to create WAF rules to block or handle requests with a particular score in one or both of these dimensions. You’ll be able to combine this score with other existing signals (like bot score or attack score) to determine whether the request should reach the model or should be blocked. For example, it could be combined with a bot score to identify if the request was malicious and generated by an automated source.
Detecting prompt injections and prompt abuse is part of the scope of Firewall for AI. Early iteration of the product design
Besides the score, we will assign tags to each prompt that can be used when creating rules to prevent prompts belonging to any of these categories from reaching their model. For example, customers will be able to create rules to block specific topics. This includes prompts using words categorized as offensive, or linked to religion, sexual content, or politics, for example.
How can I use Firewall for AI? Who gets this?
Enterprise customers on the Application Security Advanced offering can immediately start using Advanced Rate Limiting and Sensitive Data Detection (on the response phase). Both products can be found in the WAF section of the Cloudflare dashboard. Firewall for AI’s prompt validation feature is currently under development and a beta version will be released in the coming months to all Workers AI users. Sign up to join the waiting list and get notified when the feature becomes available.
Conclusion
Cloudflare is one of the first security providers launching a set of tools to secure AI applications. Using Firewall for AI, customers can control what prompts and requests reach their language models, reducing the risk of abuses and data exfiltration. Stay tuned to learn more about how AI application security is evolving.
Most WAF providers rely on reactive methods, responding to vulnerabilities after they have been discovered and exploited. However, we believe in proactively addressing potential risks, and using AI to achieve this. Today we are sharing a recent example of a critical vulnerability (CVE-2023-46805 and CVE-2024-21887) and how Cloudflare’s Attack Score powered by AI, and Emergency Rules in the WAF have countered this threat.
The threat: CVE-2023-46805 and CVE-2024-21887
An authentication bypass (CVE-2023-46805) and a command injection vulnerability (CVE-2024-21887) impacting Ivanti products were recently disclosed and analyzed by AttackerKB. This vulnerability poses significant risks which could lead to unauthorized access and control over affected systems. In the following section we are going to discuss how this vulnerability can be exploited.
Technical analysis
As discussed in AttackerKB, the attacker can send a specially crafted request to the target system using a command like this:
This command targets an endpoint (/license/keys-status/) that is usually protected by authentication. However, the attacker can bypass the authentication by manipulating the URL to include /api/v1/totp/user-backup-code/../../license/keys-status/. This technique is known as directory traversal.
The URL-encoded part of the command decodes to a Python reverse shell, which looks like this:
The Python reverse shell is a way for the attacker to gain control over the target system.
The vulnerability exists in the way the system processes the node_name parameter. If an attacker can control the value of node_name, they can inject commands into the system.
To elaborate on ‘node_name’: The ‘node_name’ parameter is a component of the endpoint /api/v1/license/keys-status/path:node_name. This endpoint is where the issue primarily occurs.
The attacker can send a GET request to the URI path /api/v1/totp/user-backup-code/../../license/keys-status/;CMD; where CMD is any command they wish to execute. By using a semicolon, they can specify this command in the request. To ensure the command is correctly processed by the system, it must be URL-encoded.
Another code injection vulnerability was identified, as detailed in the blog post from AttackerKB. This time, it involves an authenticated command injection found in a different part of the system.
The same Python reverse shell payload used in the first command injection can be employed here, forming a JSON structure to trigger the vulnerability. Since the payload is in JSON, it doesn’t need to be URL-encoded:
Although the /api/v1/system/maintenance/archiving/cloud-server-test-connection endpoint requires authentication, an attacker can bypass this by chaining it with the previously mentioned directory traversal vulnerability. They can construct an unauthenticated URI path /api/v1/totp/user-backup-code/../../system/maintenance/archiving/cloud-server-test-connection to reach this endpoint and exploit the vulnerability.
To execute an unauthenticated operating system command, an attacker would use a curl request like this:
Cloudflare WAF is supported by an additional AI-powered layer called WAF Attack Score, which is built for the purpose of catching attack bypasses before they are even announced. Attack Score provides a score to indicate if the request is malicious or not; focusing on three main categories until now: XSS, SQLi, and some RCE variations (Command Injection, ApacheLog4J, etc.). The score ranges from 1 to 99 and the lower the score the more malicious the request is. Generally speaking, any request with a score below 20 is considered malicious.
Looking at the results of the exploitation example above of CVE-2023-46805 and CVE-2024-21887 using Cloudflare’s dashboard (Security > Events). Attack Score analysis results consist of three individual scores, each labeled to indicate their relevance to a specific attack category. There’s also a global score, “WAF Attack Score”, which considers the combined impact of these three scores. In some cases, the global score is affected by one of the sub-scores if the attack matches a category, here we can see the dominant sub-score is Remote Code Execution “WAF RCE Attack Score”.
Similarly, for the unauthenticated operating system command request, we received “WAF Attack Score: 19” from the AI model which also lies under the malicious request category. Worth mentioning the example scores are not fixed numbers and may vary based on the incoming attack variation.
The great news here is: customers on Enterprise and Business plans with WAF attack score enabled, along with a rule to block low scores (e.g. cf.waf.score le 20) or (cf.waf.score.class eq “attack“) for Business, were already shielded from potential vulnerability exploits that were tested so far even before the vulnerability was announced.
Emergency rule deployment
In response to this critical vulnerability, Cloudflare released Emergency Rules on January 17, 2024, Within 24 hours after the proof of concept went public. These rules are part of its Managed Rules for the WAF, specifically targeting the threats posed by CVE-2023-46805 and an additional vulnerability, CVE-2024-21887, also related to Ivanti products. The rules, named “Ivanti – Auth Bypass, Command Injection – CVE:CVE-2023-46805, CVE:CVE-2024-21887,” are developed to block attempts to exploit these vulnerabilities, providing an extra layer of security for Cloudflare users.
Since we deployed these rules, we have recorded a high level of activity. At the time of writing, the rule was triggered more than 180,000 times.
Cloudflare’s response to CVE-2023-46805 and CVE-2024-21887 underscores the importance of having robust security measures in place. Organizations using Cloudflare services, particularly the WAF, are advised to ensure that their systems are updated with the latest rules and configurations to maintain optimal protection. We also recommend customers to deploy rules using Attack Score to improve their security posture. If you want to learn more about Attack Score, contact your account team.
Conclusion
Cloudflare’s proactive approach to cybersecurity using AI to identify and stop attacks, exemplified by its response to CVE-2023-46805 and CVE-2024-21887, highlights how threats and attacks can be identified before they are made public and vulnerabilities disclosed. By continuously monitoring and rapidly responding to vulnerabilities, Cloudflare ensures that its clients remain secure in an increasingly complex digital landscape.
On 2023-10-04 at 13:00 UTC, Atlassian released details of the zero-day vulnerability described as “Privilege Escalation Vulnerability in Confluence Data Center and Server” (CVE-2023-22515), a zero-day vulnerability impacting Confluence Server and Data Center products.
Cloudflare was warned about the vulnerability before the advisory was published and worked with Atlassian to proactively apply protective WAF rules for all customers. All Cloudflare customers, including Free, received the protection enabled by default. On 2023-10-03 14:00 UTC Cloudflare WAF team released the following managed rules to protect against the first variant of the vulnerability observed in real traffic.
When CVE-2023-22515 is exploited, an attacker could access public Confluence Data Center and Server instances to create unauthorized Confluence administrator accounts to access the instance. According to the advisory the vulnerability is assessed by Atlassian as critical. At the moment of writing a CVSS score is not yet known. More information can be found in the security advisory, including what versions of Confluence Server are affected.
We are constantly researching ways to improve our products. For the Web Application Firewall (WAF), the goal is simple: keep customer web applications safe by building the best solution available on the market.
In this blog post we talk about our approach and ongoing research into detecting novel web attack vectors in our WAF before they are seen by a security researcher. If you are interested in learning about our secret sauce, read on.
This post is the written form of a presentation first delivered at Black Hat USA 2023.
The value of a WAF
Many companies offer web application firewalls and application security products with a total addressable market forecasted to increase for the foreseeable future.
In this space, vendors, including ourselves, often like to boast the importance of their solution by presenting ever-growing statistics around threats to web applications. Bigger numbers and scarier stats are great ways to justify expensive investments in web security. Taking a few examples from our very own application security report research (see our latest report here):
The numbers above all translate to real value: yes, a large portion of Internet HTTP traffic is malicious, therefore you could mitigate a non-negligible amount of traffic reaching your applications if you deployed a WAF. It is also true that we are seeing a drastic increase in global API traffic, therefore, you should look into the security of your APIs as you are likely serving API traffic you are not aware of. You need a WAF with API protection capabilities. And so on.
There is, however, one statistic often presented that hides a concept more directly tied to the value of a web application firewall:
This brings us to zero-days. The definition of a zero-day may vary depending on who you ask, but is generally understood to be an exploit that is not yet, or has very recently become, widely known with no patch available. High impact zero-days will get assigned a CVE number. These happen relatively frequently and the value can be implied by how often we see exploit attempts in the wild. Yes, you need a WAF to make sure you are protected from zero-day exploits.
But herein hides the real value: how quickly can a WAF mitigate a new zero-day/CVE?
By definition a zero-day is not well known, and a single malicious payload could be the one that compromises your application. From a purist standpoint, if your WAF is not fast at detecting new attack vectors, it is not providing sufficient value.
The faster the mitigation, the better. We refer to this as “time to mitigate”. Any WAF evaluation should focus on this metric.
How fast is fast enough?
24 hours? 6 hours? 30 minutes? Luckily we run one of the world's largest networks, and we can look at some real examples to understand how quickly a WAF really needs to be to protect most environments. I specifically mention “most” here as not everyone is the target of a highly sophisticated attack, and therefore, most companies should seek to be protected at least by the time a zero-day is widely known. Anything better is a plus.
Our first example is Log4Shell (CVE-2021-44228). A high and wide impacting vulnerability that affected Log4J, a popular logging software maintained by the Apache Software Foundation. The vulnerability was disclosed back in December 2021. If you are a security practitioner, you have certainly heard of this exploit.
The proof of concept of this attack was published on GitHub on December 9, 2021, at 15:27 UTC. A tweet followed shortly after. We started observing a substantial amount of attack payloads matching the signatures from about December 10 at 10:00 UTC. That is about ~19 hours after the PoC was published.
Our second example is a little more recent: Atlassian Confluence CVE-2022-26134 from June 2, 2022. In this instance Atlassian published a security advisory pertaining to the vulnerability at 20:00 UTC. We were very fast at deploying mitigations and had rules globally deployed protecting customers at 23:38 UTC, before the four-hour mark.
Although potentially matching payloads were observed before the rules were deployed, these were not confirmed. Exact matches were only observed on 2022-06-03 at 10:30 UTC, over 10 hours after rule deployment. Even in this instance, we provided our observations on our blog.
The list of examples could go on, but the data tells the same story: for most, as long as you have mitigations in place within a few hours, you are likely to be fine.
That, however, is a dangerous statement to make. Cloudflare protects applications that have some of the most stringent security requirements due to the data they hold and the importance of the service they provide. They could be the one application that is first targeted with the zero-day well before it is widely known. Also, we are a WAF vendor and I would not be writing this post if I thought “a few hours” was fast enough.
Zero (time) is the only acceptable time to mitigate!
Signatures are not enough, but are here to stay
All WAFs on the market today will have a signature based component. Signatures are great as they can be built to minimize false positives (FPs), their behavior is predictable and can be improved overtime.
We build and maintain our own signatures provided in the WAF as the Cloudflare Managed Ruleset. This is a set of over 320 signatures (at time of writing) that have been fine-tuned and optimized over the 13 years of Cloudflare’s existence.
Signatures tend to be written in ModSecurity, regex-like syntax or other proprietary language. At Cloudflare, we use wirefilter, a language understood by our global proxy. To use the same example as above, here is what one of our Log4Shell signatures looks like:
Our network, which runs our WAF, also gives us an additional superpower: the ability to test new signatures (or updates to existing ones) on over 64M HTTP/S requests per second at peak. We can tell pretty quickly if a signature is well written or not.
But one of their qualities (low false positive rates), along with the fact that humans have to write them, are the source of our inability to solely rely on signatures to reach zero time to mitigate. Ultimately a signature is limited by the speed at which we can write it, and combined with our goal to keep FPs low, they only match things we know and are 100% sure about. Our WAF security analyst team is, after all, limited by human speed while balancing the effectiveness of the rules.
The good news: signatures are a vital component to reach zero time to mitigate, and will always be needed, so the investment remains vital.
Getting to zero time to mitigation
To reach zero time to mitigate we need to rely on some machine learning algorithms. It turns out that WAFs are a great application for this type of technology especially combined with existing signature based systems. In this post I won’t describe the algorithms themselves (subject for another post) but will provide the high level concepts of the system and the steps of how we built it.
Step 1: create the training set
It is a well known fact in data science that the quality of any classification system, including the latest generative AI systems, is highly dependent on the quality of the training set. The old saying “garbage in, garbage out” resonates well.
And this is where our signatures come into play. As these were always written with a low false positive rate in mind, combined with our horizontal WAF deployment on our network, we essentially have access to millions of true positive examples per second to create what is likely one of the best WAF training sets available today.
We also, due to customer configurations and other tools such as Bot Management, have a pretty clear idea of what true negatives look like. In summary, we have a constant flow of training data. Additionally due to our self-service plans and the globally distributed nature of Cloudflare’s service and customer base, our data tends to be very diverse, removing a number of biases that may otherwise be present.
Simply relying on real traffic data is good, but with a few artificial enhancements the training set can become a lot better, leading to much higher detection efficacy.
In a nutshell we went through the process of generating artificial (but realistic) data to increase the diversity of our data even further by studying statistical distribution of existing real-world data. For example, mutating benign content with random character noise, language specific keywords, generating new benign content and so on.
One restriction that often applies to machine learning based classifiers running to inline traffic, like the Cloudflare proxy, is latency performance. To be useful, we need to be able to compute classification “inline” without affecting the user experience for legitimate end users. We don’t want security to be associated with “slowness”.
This required us to fine tune not only the feature set used by the classification system, but also the underlying tooling, so it was both fast and lightweight. The classifier is built using TensorFlow Lite.
At time of writing, our classification model is able to provide a classification output under 1ms at 50th percentile. We believe we can reach 1ms at 90th percentile with ongoing efforts.
Step 4: deploy on the network
Once the classifier is ready, there is still a large amount of additional work needed to deploy on live production HTTP traffic, especially at our scale. Quite a few additional steps need to be implemented starting from a fully formed live HTTP request and ending with a classification output.
The diagram below is a good summary of each step. First and foremost, starting from the raw HTTP request, we normalize it, so it can easily be parsed and processed, without unintended consequences, by the following steps in the pipeline. Second we extract the relevant features found after experimentation and research, that would be more beneficial for our use case. To date we extract over 6k features. We then run inference on the resulting features (the actual classification) and generate outputs for the various attack types we have trained the model for. To date we classify cross site scripting payloads (XSS), SQL injection payloads (SQLi) and remote code execution payloads (RCE). The final step is to consolidate the output in a single WAF Attack Score.
Step 5: expose output as a simple interface
To make the system usable we decided the output should be in the same format as our Bot Management system output. A single score that ranges from 1 to 99. Lower scores indicate higher probability that the request is malicious, higher scores indicate the request is clean.
There are two main benefits of representing the output within a fixed range. First, using the output to BLOCK traffic becomes very easy. It is sufficient to deploy a WAF rule that blocks all HTTP requests with a score lower than $x, for example a rule that blocks all traffic with a score lower than 10 would look like this:
cf.waf.score < 10 then BLOCK
Secondly, deciding what the threshold should be can be done easily by representing the score distributions on your live traffic in colored “buckets”, and then allowing you to zoom in where relevant to validate the correct classification. For example, the graph below shows an attack that we observed against blog.cloudflare.com when we initially started testing the system. This graph is available to all business and enterprise users.
All that remains, is to actually use the score!
Success in the wild
The classifier has been deployed for just over a year on Cloudflare’s network. The main question stated at the start of this post remains: does it work? Have we been able to detect attacks before we’ve seen them? Have we achieved zero time to mitigate?
To answer this we track classification output for new CVEs that fail to be detected by existing Cloudflare Managed Rules. Of course our rule improvement work is always ongoing, but this gives us an idea on how well the system is performing.
And the answer: YES. For all CVEs or bypasses that rely on syntax similar to existing vulnerabilities, the classifier performs very well, and we have observed several instances of it blocking valid malicious payloads that were not detected by our signatures. All of this, while keeping false positives very low at a threshold of 15 or below. XSS variations, SQLi CVEs, are in most cases, a problem fully solved if the classifier is deployed.
One recent example is a set of Sitecore vulnerabilities that were disclosed in June 2023 listed below:
The CVEs listed above were not detected by Cloudflare Managed Rules, but were correctly detected and classified by our model. Customers that had the score deployed in a rule in June 2023, would have been protected in zero time.
This does not mean there isn’t space for further improvement.
The classification works very well for attack types that are aligned, or somewhat similar to existing attack types. If the payload implements a brand new never seen before syntax, then we still have some work to do. Log4Shell is actually a very good example of this. If another zero-day vulnerability was discovered that leveraged the JNDI Java syntax, we are confident that our customers who have deployed WAF rules using the WAF Attack Score would be safe against it.
We are already working on adding more detection capabilities including web shell detection and open redirects/path traversal.
The perfect feedback loop
I mentioned earlier that our security analyst driven improvements to our Cloudflare Managed Rulesets are not going to stop. Our public changelog is full of activity and there is no sign of slowing down.
There is a good reason for this: the signature based system will remain, and likely eventually be converted to our training set generation tool. But not only that, it also provides an opportunity to speed up improvements by focusing on reviewing malicious traffic that is classified by our machine learning system but not detected by our signatures. The delta between the two systems is now one of the main focuses of attention for our security analyst team. The diagram below visualizes this concept.
It is this delta that is helping our team to further fine tune and optimize the signatures themselves. Both to match malicious traffic that is bypassing the signatures, and to reduce false positives. You can now probably see where this is going as we are starting to build the perfect feedback loop.
Better signatures provide a better training set (data). In turn, we can create a better model. The model will provide us with a more interesting delta, which, once reviewed by humans, will allow us to create better signatures. And start over.
We are now working to automate this entire process with the goal of having humans simply review and click to deploy. This is the leading edge for WAF zero-day mitigation in the industry.
Summary
One of the main value propositions of any web application security product is the ability to detect novel attack vectors before they can cause an issue, allowing internal teams time to patch and remediate the underlying codebase. We call this time to mitigate. The ideal value is zero.
We’ve put a lot of effort and research into a machine learning system that augments our existing signature based system to yield very good classification results of new attack vectors the first time they are seen. The system outputs a score that we call the WAF Attack Score. We have validated that for many CVEs, we are indeed able to correctly classify malicious payloads on the first attempt and provide Sitecore CVEs as an example.
Moving forward, we are now automating a feedback loop that will allow us to both improve our signatures faster, to then subsequently iterate on the model and provide even better detection.
The system is live and available to all our customers in the business or enterprise plan. Log in to the Cloudflare dashboard today to receive instant zero-day mitigation.
Rate Limiting rules are essential in the toolbox of security professionals as they are very effective in managing targeted volumetric attacks, takeover attempts, scraping bots, or API abuse. Over the years we have received a lot of feature requests from users, but two stand out: suggesting rate limiting thresholds and implementing a throttle behavior. Today we released both to Enterprise customers!
When creating a rate limit rule, one of the common questions is “what rate should I put in to block malicious traffic without affecting legitimate users?”. If your traffic is authenticated, API Shield will suggest thresholds based on auth IDs (such a session-id, cookie, or API key). However, when you don’t have authentication headers, you will need to create IP-based rules (like for a ‘/login’ endpoint) and you are left guessing the threshold. From today, we provide analytics tools to determine what rate of requests can be used for your rule.
So far, a rate limit rule could be created with log, challenge, or block action. When ‘block’ is selected, all requests from the same source (for example, IP) were blocked for the timeout period. Sometimes this is not ideal, as you would rather selectively block/allow requests to enforce a maximum rate of requests without an outright temporary ban. When using throttle, a rule lets through enough requests to keep the request rate from individual clients below a customer-defined threshold.
Continue reading to learn more about each feature.
Introducing Rate Limit Analysis in Security Analytics
The Security Analytics view was designed with the intention of offering complete visibility on HTTP traffic while adding an extra layer of security on top. It's proven a great value when it comes to crafting custom rules. Nevertheless, when it comes to creating rate limiting rules, relying solely on Security Analytics can be somewhat challenging.
To create a rate limiting rule you can leverage Security Analytics to determine the filter — what requests are evaluated by the rule (for example, by filtering on mitigated traffic, or selecting other security signals like Bot scores). However, you’ll also need to determine what’s the maximum rate you want to enforce and that depends on the specific application, traffic pattern, time of day, endpoint, etc. What’s the typical rate of legitimate users trying to access the login page at peak time? What’s the rate of requests generated by a botnet with the same JA3 fingerprint scraping prices from an ecommerce site? Until today, you couldn’t answer these questions from the analytics view.
That’s why we made the decision to integrate a rate limit helper into Security Analytics as a new tab called "Rate Limit Analysis," which concentrates on providing a tool to answer rate-related questions.
High level top statistics vs. granular Rate Limit Analysis
In Security Analytics, users can analyze traffic data by creating filters combining what we call top statistics. These statistics reveal the total volume of requests associated with a specific attribute of the HTTP requests. For example, you can filter the traffic from the ASNs that generated more requests in the last 24 hours, or you slice the data to look only at traffic reaching the most popular paths of your application. This tool is handy when creating rules based on traffic analysis.
However, for rate limits, a more detailed approach is required.
The new Rate limit analysis tab now displays data on request rate for traffic matching the selected filter and time period. You can select a rate defined on different time intervals, like one or five minutes, and the attribute of the request used to identify the rate, such as IP address, JA3 fingerprint, or a combination of both as this often improves accuracy. Once the attributes are selected, the chart displays the distribution of request rates for the top 50 unique clients (identified as unique IPs or JA3s) observed during the chosen time interval in descending order.
You can use the slider to determine the impact of a rule with different thresholds. How many clients would have been caught by the rule and rate limited? Can I visually identify abusers with above-average rate vs. the long tail of average users? This information will guide you in assessing what’s the most appropriate rate for the selected filter.
Using Rate Limit Analysis to define rate thresholds
It takes a few minutes to build your rate limit rule now. Let’s apply this to one of the common use cases where we identify /login endpoint and create a rate limit rule based on the IP with a logging action.
Define a scope and rate.
In the HTTP requests tab (the default view), start by selecting a specific time period. If you’re looking for the normal rate distribution you can specify a period with non-peak traffic. Alternatively, you can analyze the rate of offending users by selecting a period when an attack was carried out.
Using the filters in the top statistics, select a specific endpoint (e.g., /login). We can also focus on non-automated/human traffic using the bot score quick filter on the right sidebar or the filter button on top of the chart. In the Rate limiting Analysis tab, you can choose the characteristic (JA3, IP, or both) and duration (1 min, 5 mins, or 1 hour) for your rate limit rule. At this point, moving the dotted line up and down can help you choose an appropriate rate for the rule. JA3 is only available to customers using Bot Management.
Looking at the distribution, we can exclude any IPs or ASNs that might be known to us, to have a better visual on end user traffic. One way to do this is to filter out the outliers right before the long tail begins. A rule with this setting will block the IPs/JA3 with a higher rate of requests.
Validate your rate. You can validate the rate by repeating this process but selecting a portion of traffic where you know there was an attack or traffic peak. The rate you've chosen should block the outliers during the attack and allow traffic during normal times. In addition to that, looking at the sampled logs can be helpful in verifying the fingerprints and filters chosen.
Create a rule. Selecting “Create rate limit rule” will take you to the rate limiting tab in the WAF with your filters pre-populated.
Choose your action and behavior in the rule. Depending on your needs you can choose to log, challenge, or block requests exceeding the selected threshold. It’s often a good idea to first deploy the rule with a log action to validate the threshold and then change the action to block or challenge when you are confident with the result. With every action, you can also choose between two behaviors: fixed action or throttle. Learn more about the difference in the next section.
Introducing the new throttle behavior
Until today, the only available behavior for Rate Limiting has been fixed action, where an action is triggered for a selected time period (also known as timeout). For example, did the IP 192.0.2.23 exceed the rate of 20 requests per minute? Then block (or log) all requests from this IP for, let’s say, 10 minutes.
In some situations, this type of penalty is too severe and risks affecting legitimate traffic. For example, if a device in a corporate network (think about NAT) exceeds the threshold, all devices sharing the same IP will be blocked outright.
With throttling, rate limiting selectively drops requests to maintain the rate within the specified threshold. It’s like a leaky bucket behavior (with the only difference that we do not implement a queuing system). For example, throttling a client to 20 requests per minute means that when a request comes from this client, we look at the last 60 seconds and see if (on average) we have received less than 20 requests. If this is true, the rule won’t perform any action. If the average is already at 20 requests then we will take action on that request. When another request comes in, we will check again. Since some time has passed the average rate might have dropped, making room for more requests.
Throttling can be used with all actions: block, log, or challenge. When creating a rule, you can select the behavior after choosing the action.
When using any challenge action, we recommend using the fixedaction behavior. As a result, when a client exceeds the threshold we will challenge all requests until a challenge is passed. The client will then be able to reach the origin again until the threshold is breached again.
Throttle behavior is available to Enterprise rate limiting plans.
Try it out!
Today we are introducing a new Rate Limiting analytics experience along with the throttle behavior for all Rate Limiting users on Enterprise plans. We will continue to work actively on providing a better experience to save our customers' time. Log in to the dashboard, try out the new experience, and let us know your feedback using the feedback button located on the top right side of the Analytics page or by reaching out to your account team directly.
The collective thoughts of the interwebz
Manage Consent
To provide the best experiences, we use technologies like cookies to store and/or access device information. Consenting to these technologies will allow us to process data such as browsing behavior or unique IDs on this site. Not consenting or withdrawing consent, may adversely affect certain features and functions.
Functional
Always active
The technical storage or access is strictly necessary for the legitimate purpose of enabling the use of a specific service explicitly requested by the subscriber or user, or for the sole purpose of carrying out the transmission of a communication over an electronic communications network.
Preferences
The technical storage or access is necessary for the legitimate purpose of storing preferences that are not requested by the subscriber or user.
Statistics
The technical storage or access that is used exclusively for statistical purposes.The technical storage or access that is used exclusively for anonymous statistical purposes. Without a subpoena, voluntary compliance on the part of your Internet Service Provider, or additional records from a third party, information stored or retrieved for this purpose alone cannot usually be used to identify you.
Marketing
The technical storage or access is required to create user profiles to send advertising, or to track the user on a website or across several websites for similar marketing purposes.